In this issue:
H1 Performance & Attribution
H1 Top Down Positioning Update
NVIDIA: New Highs
349 Global Equity Funds, AUM $988bn
H1 Performance & Attribution
The latest stats on performance and the drivers of performance for H1 2023.
H1 Performance Summary
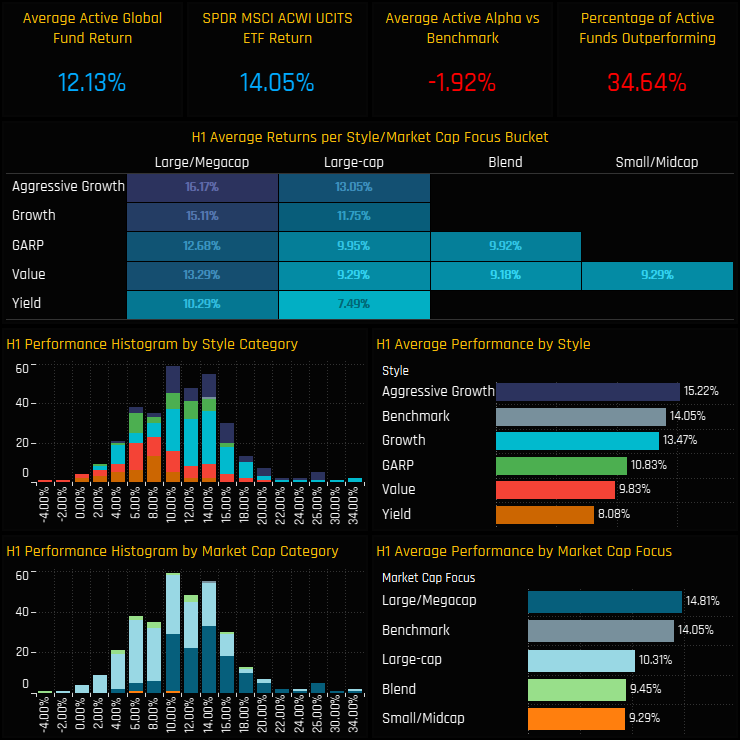
Active Global funds returned a healthy 12.13% on average during the first half of 2023, but an unhealthy underperformance of -1.92% compared to the SPDRs MSCI ACWI ETF. Style really mattered, as did Market Cap, with Aggressive Growth funds (+15.2%) and Large/Megacap (14.8%) the only groups to outperform the benchmark (14.05%) over the period. Value (9.8%), Yield (8.1%) and Small/Midcap (9.3%) funds dragged down the averages.
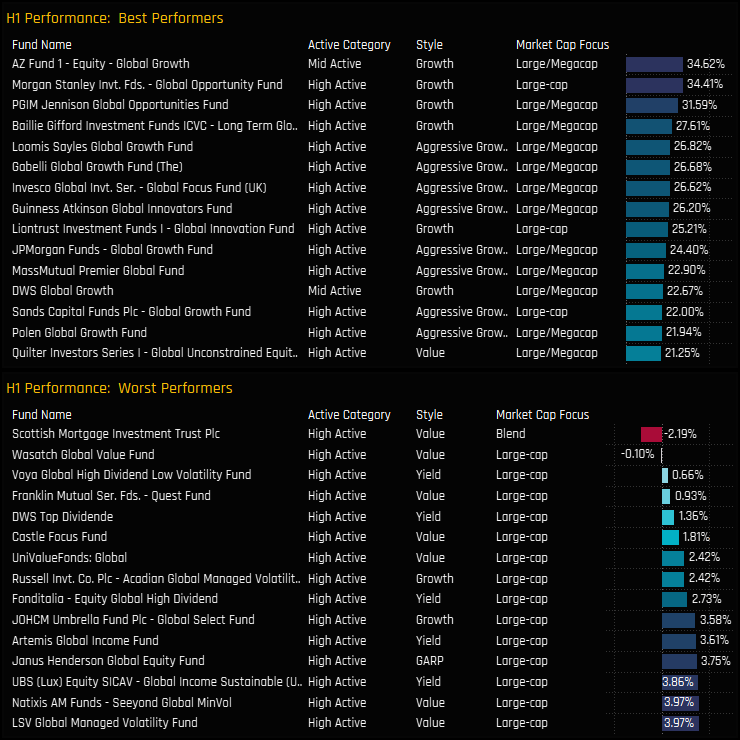
On a single fund level the dispersion in returns was even more pronounced, with the top performers of AZ Fund Global Growth, Morgan Stanley Global Opportunity and PGIM Global Opportunities returning >30%, against Scottish Mortgage and Wasatch Global Value who failed to break even. Large/Megacap funds took 12 of the top 15 spots, whilst Value/Yield took 12 of the bottom 15.
Portfolio Contribution
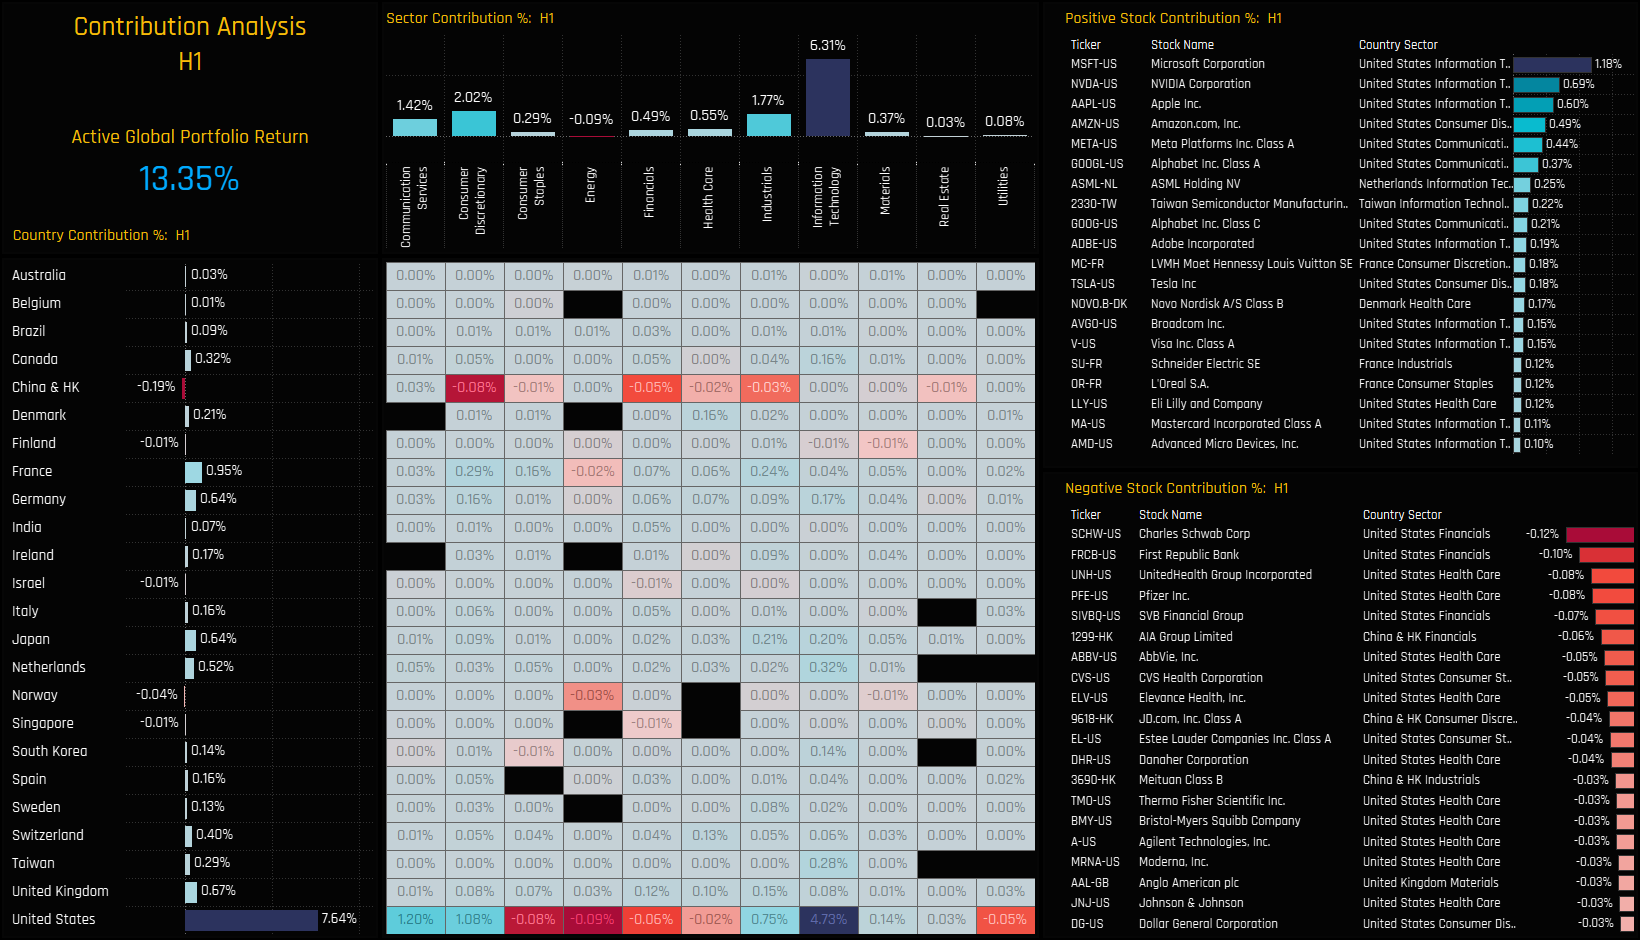
What were the drivers of these returns over the year across countries, sectors and stocks? The chart set below breaks down the performance of a portfolio based on the average holdings of the 349 active Global funds in our analysis. This theoretical portfolio returned 13.35% in H1 2023, with Technology (+6.3%) and Consumer Discretionary (+2.02%) the key drivers and Energy (-0.06%) the only sector to contribute negatively on the year. On a Country level, the USA was main driver of returns (+7.64%) with healthy contributions across the major European countries and Japan, whilst China & HK positions cost managers -0.19% on the year so far.
Drilling down a level further, costly country/sectors were China & HK Consumer Discretionary (-0.08%), US Energy (-0.09%) and US Consumer Staples (-0.08%). The major drivers of positive returns were US Technology (+4.73%), US Communication Services (+1.2%) and US Consumer Discretionary (+1.08%). The key stocks driving performance can be seen in the right hand charts below, with positive contributions led by Microsoft Corp (+1.18%), NVIDIA Corp (+0.69%) and Apple Inc (0.6%). On the negative side, Charles Schwab (-0.12%), First Republic Bank (-0.1%) and UnitedHealth Group Corp (-0.08%) dragged on returns in the first half of the year.
Portfolio Attribution
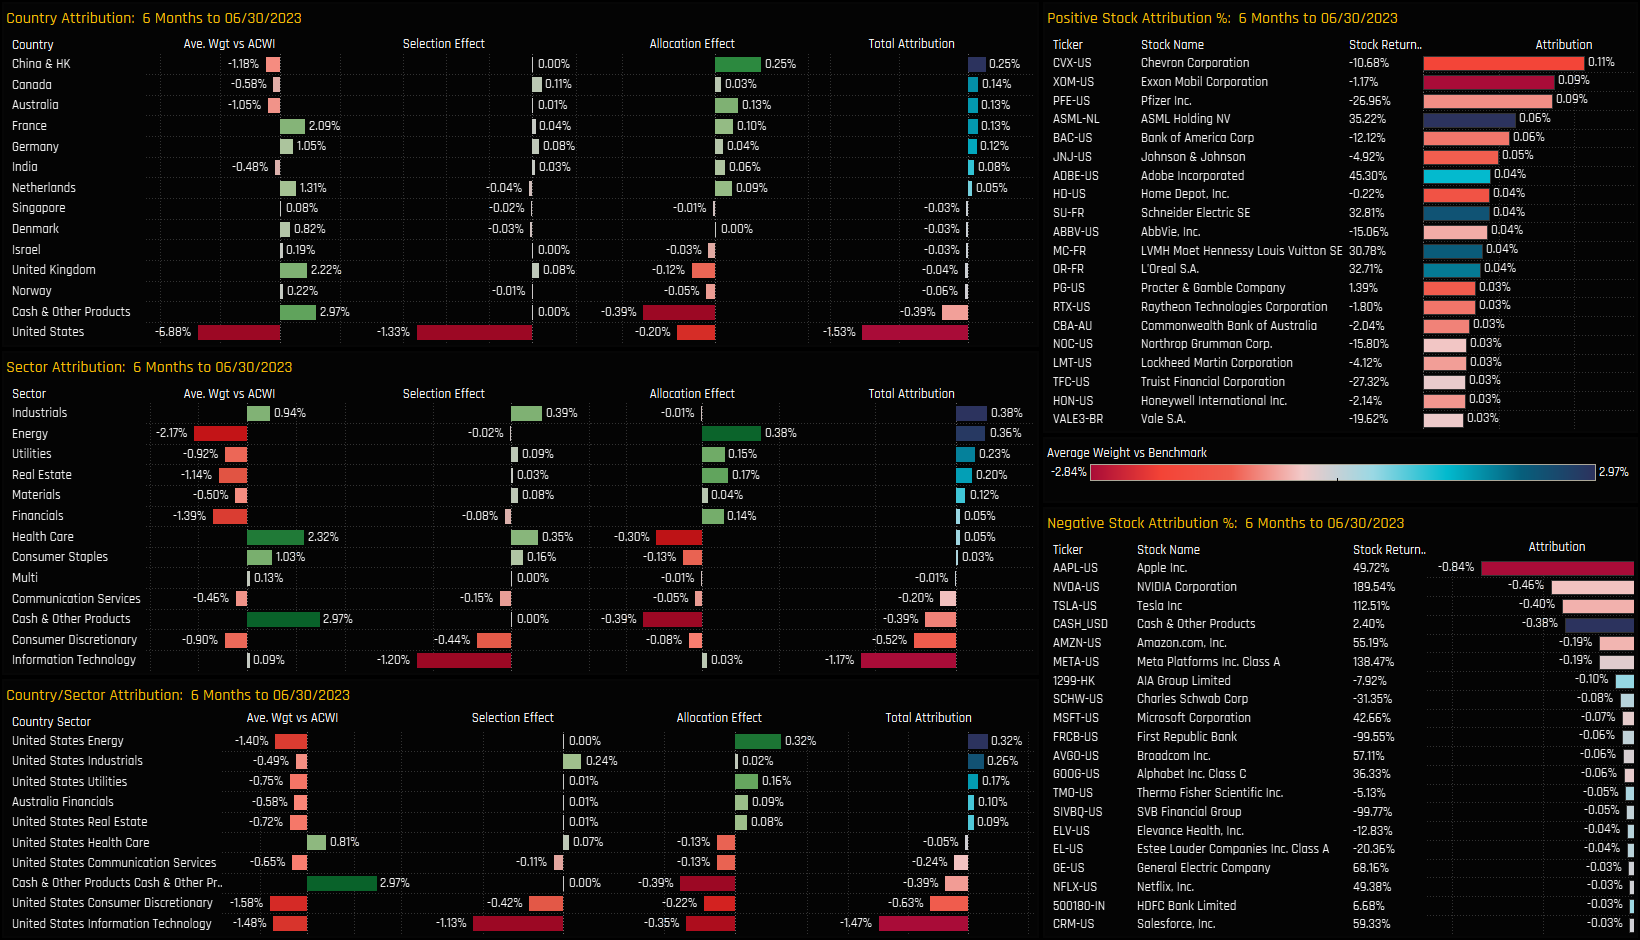
We perform attribution analysis on this portfolio versus a representation of the benchmark based on the SPDRs MSCI ACWI ETF, to help us better understand where this year’s underperformance came from. The portfolio underperformed by -0.86% over the period, with one of the major pain trades being the underweight in Apple Inc that Global funds continue to run. A summary of the key drivers are documented below.
What worked:
Underweights in China & HK, India Energy, USA Utilities.
Overweights in France, Netherlands, Germany
Stock selection in Canada, Industrials, Health Care
Underweights in Chevron, Exxon Mobil, Pfizer Inc.
Overweights in ASML Holding, Adobe Incorporated, Schneider Electric
What didn’t:
Underweights in USA Technology, US Consumer Discretionary
Overweights in Cash, the UK, Health Care, Consumer Staples
Stock Selection in the USA, Information Technology, Consumer Discretionary
Overweights in AIA Group, Charles Schwabb
Underweights Apple. NVIDIA, Telsa Inc.
349 Global Equity Funds, AUM $988bn
H1 Top Down Positioning Update
How are Global funds positioned at the turn of the year across regions, countries, sectors and stocks and what have been the key changes on the year so far?
Regions
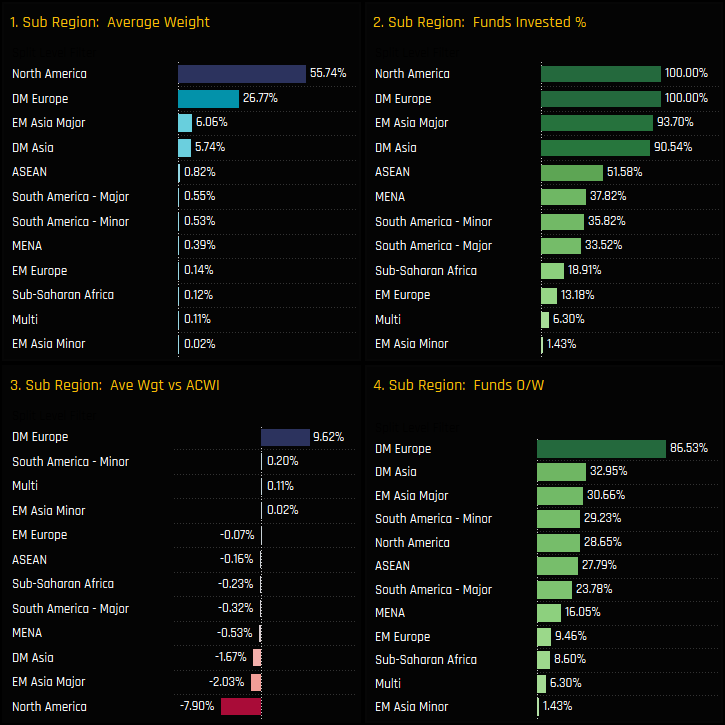
Active Global Funds start the 2nd half of 2023 with 82.5% of all allocations invested in North America (55.74%) and Developed Europe (26.77%). The remainder is mostly split between EM Asia Major (China & HK, India, S.Korea, Taiwan) and Developed Markets in Asia (Singapore, Japan, Australia). Versus the SPDRs MSCI ACWI ETF benchmark, active Global managers are running a sizeable overweight in DM Europe (+9.62%), with 86.5% of the 349 funds in our analysis positioned as overweight. Against this, record underweights in North America (-7.9%) are complemented by smaller underweights in the Asia and MENA regions.
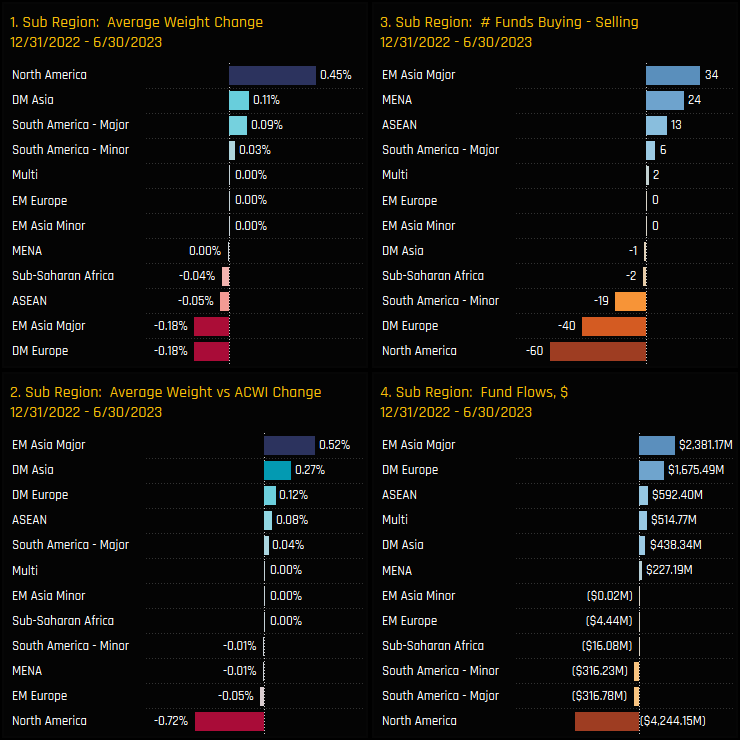
Between the filing dates of 12/31/2022 and 06/30/2023, active Global funds saw average weights increase in North America by +0.45%, exacerbating the existing underweight by -0.72%. Active managers sold in to this strength, with a net $4.24bn in outflows and an excess of 60 sellers over buyers during the period. Elsewhere, evidence that Global funds are warming to the major EM Asia nations came in the form of net fund inflows of $2.3bn, underweights dropping by 0.52% and an excess of buyers over sellers.
Countries
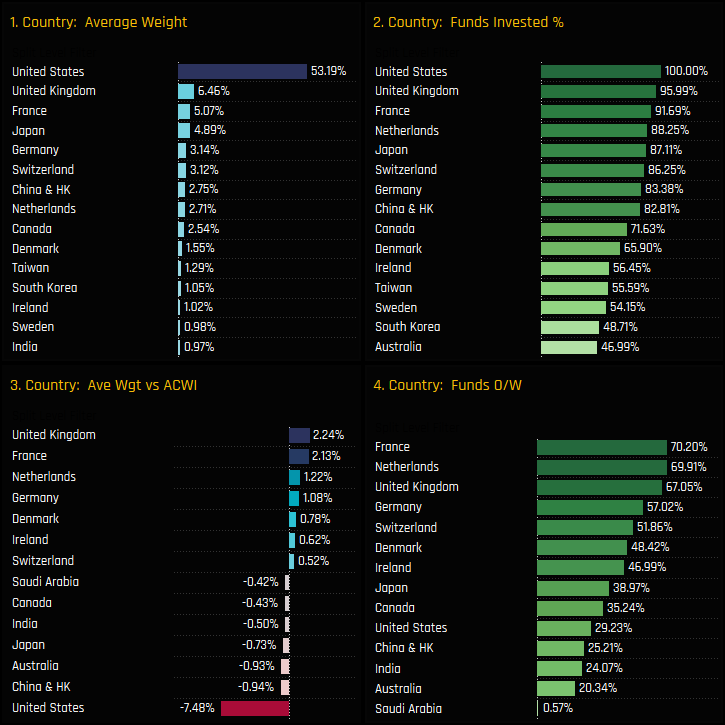
Country positioning is dominated by the USA, which accounts for 53.2% of the average active Global Fund. Relative to the SPDRs ACWI ETF benchmark this represents an underweight of -7.48%, with managers overweight Developed Europe via the major countries, led by the UK (+2.24%), France (+2.13%), the Netherlands (1.22%) and Germany (+1.08%). In fact, 70.2% of funds are now overweight France and 69.9% overweight the Netherlands. China & HK, Australia, Japan and India are all key underweights alongside Saudi Arabia, which is held underweight by 99.4% of the funds in our analysis.
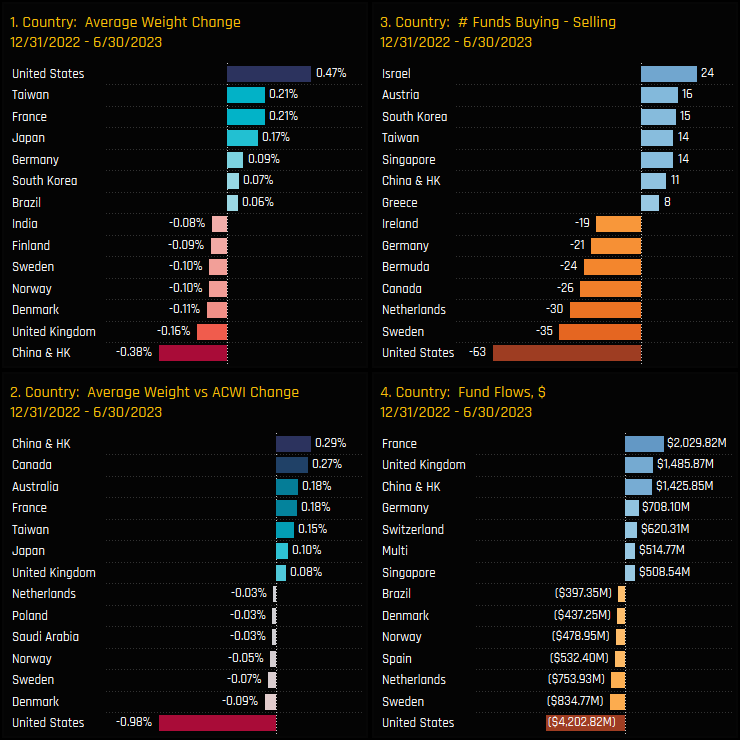
Country level ownership changes over the course of the year highlight a drop in China & HK weights (-0.38%) against an increase in the United States (+0.47%). These moves were driven by price, with ‘active’ rotation going the other way. China & HK saw net fund flows of +$1.43bn against the USA -$4.2bn, and an excess of buyers vs sellers of +11 versus the USA’s excess of 63 sellers. Elsewhere, Israel captured some positive rotation alongside Taiwan and South Korea, whilst Sweden and the Netherlands lost out.
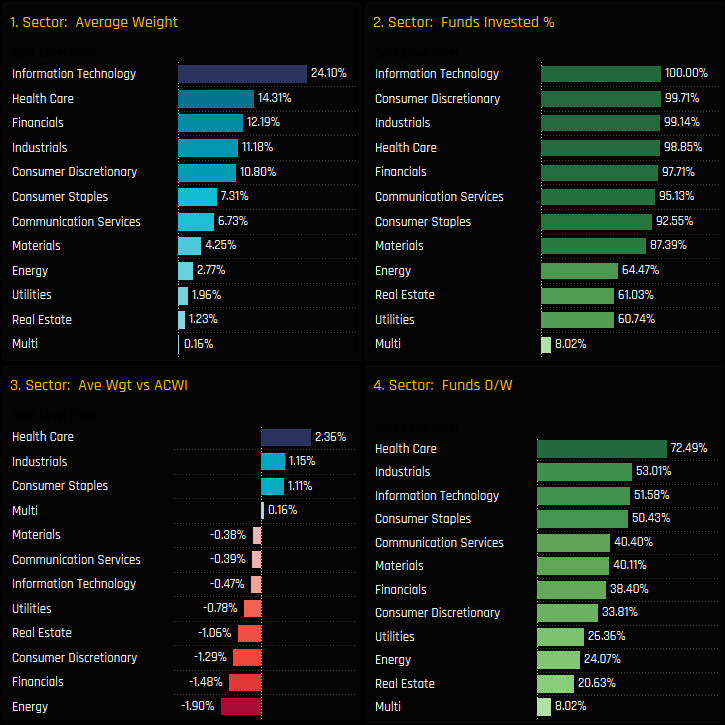
Sectors
On a sector level, Information Technology remains the dominant position by a margin, accounting for 24.1% of the average Global fund. The trio of Health Care, Industrials and Consumer Staples form the overweight sector holdings, offset by underweights in all other sectors and led by Energy, Financials and Consumer Discretionary. Energy, Real Estate and Utilities are not universally held among active Global managers, with over 35% of funds avoiding exposure to each.
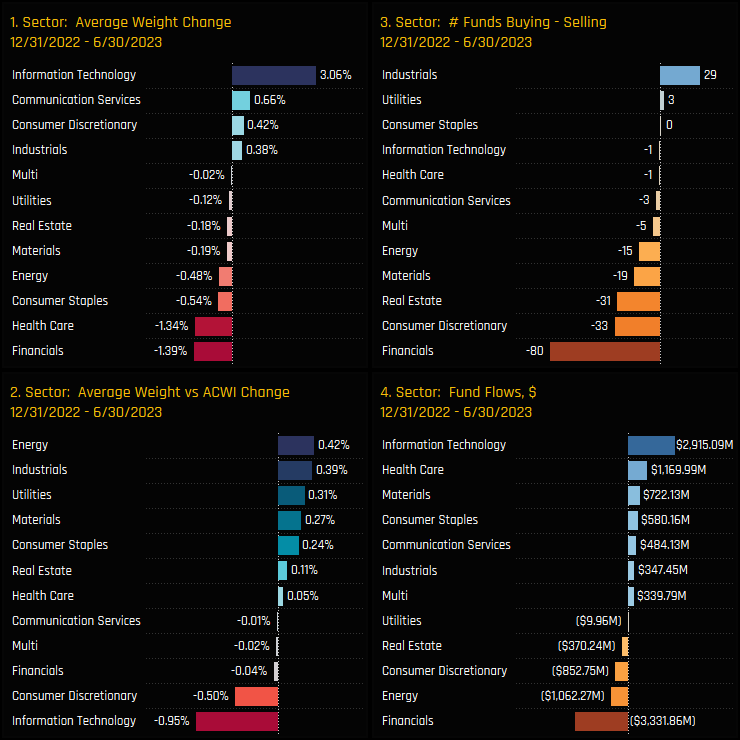
Sector ownership changes between 12/31/2022 and 06/30/2023 favoured the Tech sector, with average weights increasing by +3.06% on the back of positive inflows totaling +$2.9bn. This rotation was not enough to keep pace with the benchmark though, with active funds moving from overweight +0.48% to underweight -0.47% over the period. Financials really bore the brunt of the outward rotation, with a net 80 funds selling out of the sector, average weights decreasing by -1.39% and fund outflows of -$3.3bn.
Stocks
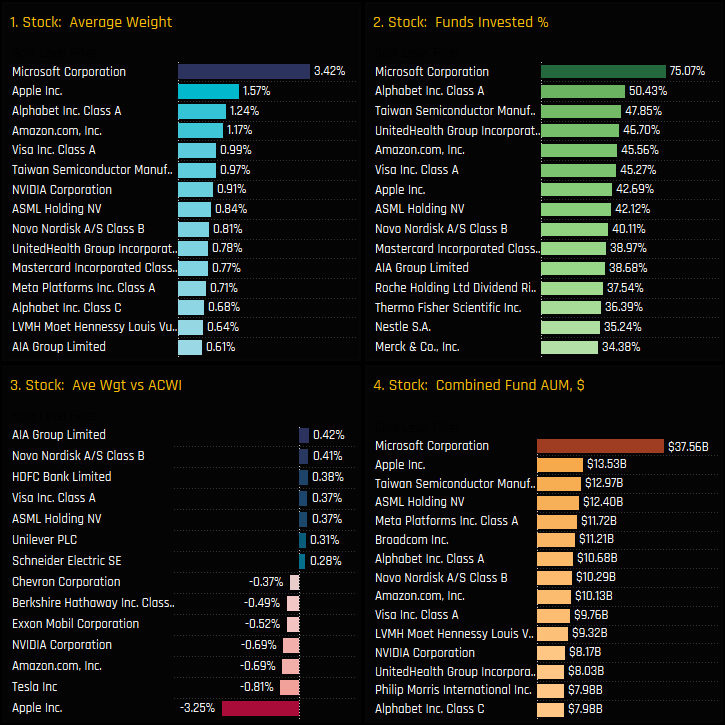
Microsoft remains the dominant stock holding, owned by 75.1% of funds at an average weight of 3.42%. Apple Inc is the next largest average weight on 1.57%, though more funds hold exposure to Alphabet Class A, TSMC and UnitedHealth, as shown in Chart 2. Global active funds are running big underweights in Apple Inc, with average exposure way below the ACWI weight of 4.82%. In fact, the -3.25% Apple underweight is the highest on record for Global active funds. Other decent sized underweights are in Telsa, NVIDIA and Amazon.com, with overweights spread across a large universe of stocks led by AIA Group, Novo Nordisk, HDFC Bank and Visa Inc.
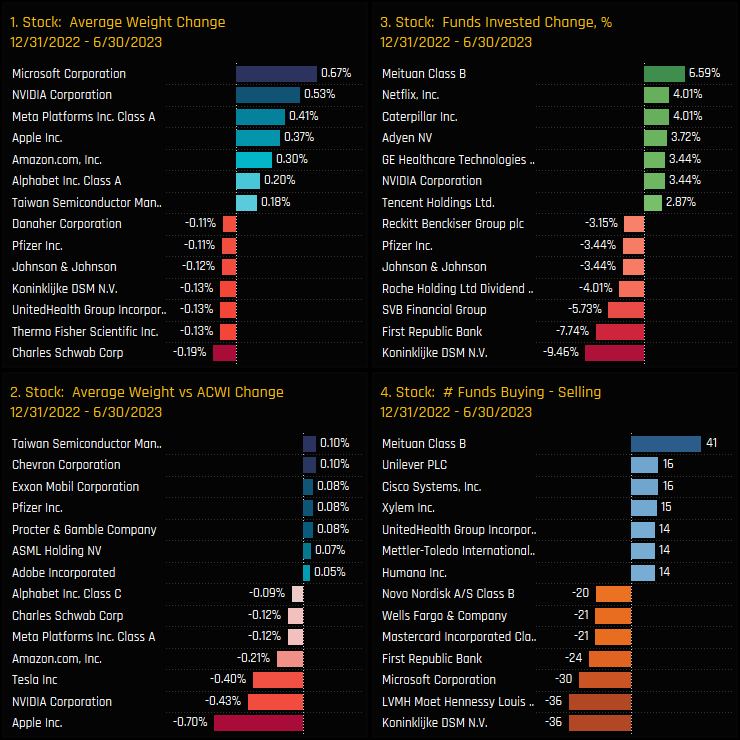
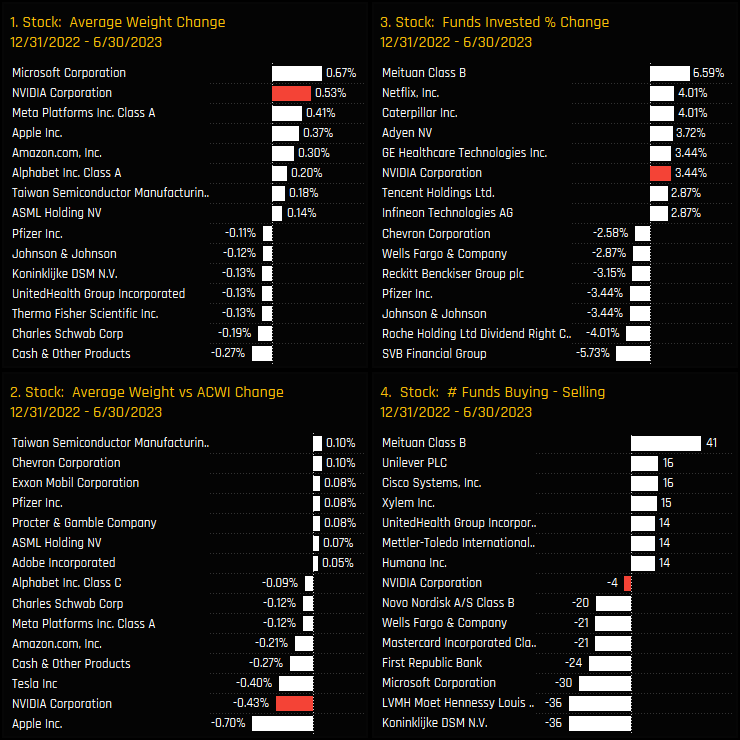
Microsoft’s strong performance helped push average holding weights higher by 0.67% this year, whist a doubling of NVIDIA’s share price helped push weights higher by +0.53% and underweights higher by -0.69%. On a funds invested basis, Meituan, Netflix and Caterpillar saw some of the largest increases, whilst Koninklijke (merger), First Republic Bank and SVB Financial saw ownership levels drop over the period.
Global Active Funds Ownership Report
That concludes our top down positioning review. For a more detailed look at positioning among the Global funds in our analysis, click on the link opposite for the latest edition of the Global Active Funds Ownership Report
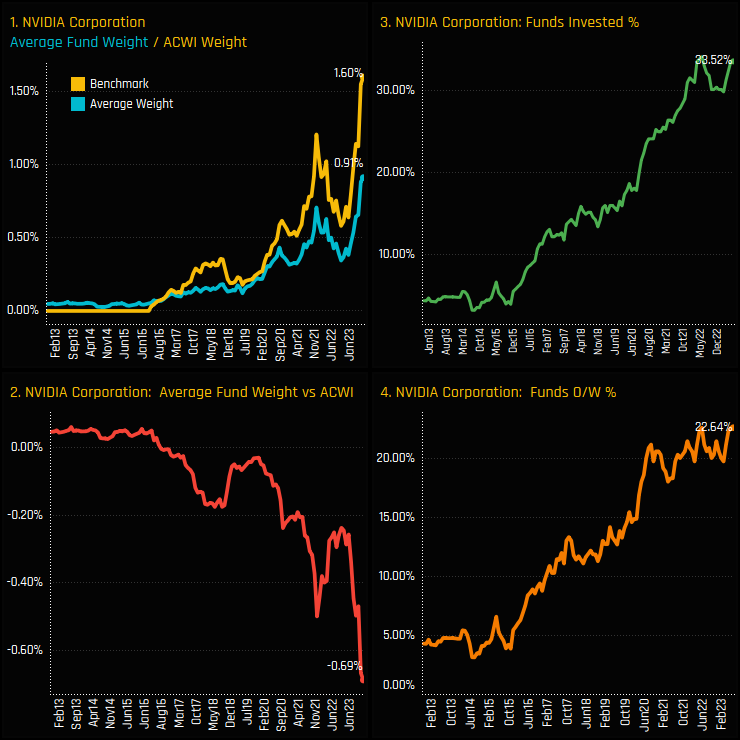
A doubling of the share price this year has pushed average weights to all-time highs, but then so too the benchmark....
Time Series & Stock Activity
Global Fund exposure in NVIDIA Corp has moved to record levels after a doubling of the share price this year. Average weights among the 349 funds in our analysis stand at a record 0.91%, mainly driven by price but with the percentage of funds invested also moving back to the all-time highs of 33.5%. Given the pre-existing underweight in NVIDIA, these price increases have driven benchmark weights higher still, with the average active fund underweight plunging to a record low of -0.69%.
In the context of the broader stock universe, these moves are among the largest over the last 6-months, with only Microsoft seeing a larger increase in average weight. NVIDIA Corp captured the 5th largest increase in the percentage of funds invested, but the small excess of sellers over buyers does suggest there has been a degree of selling in to the recent strength.
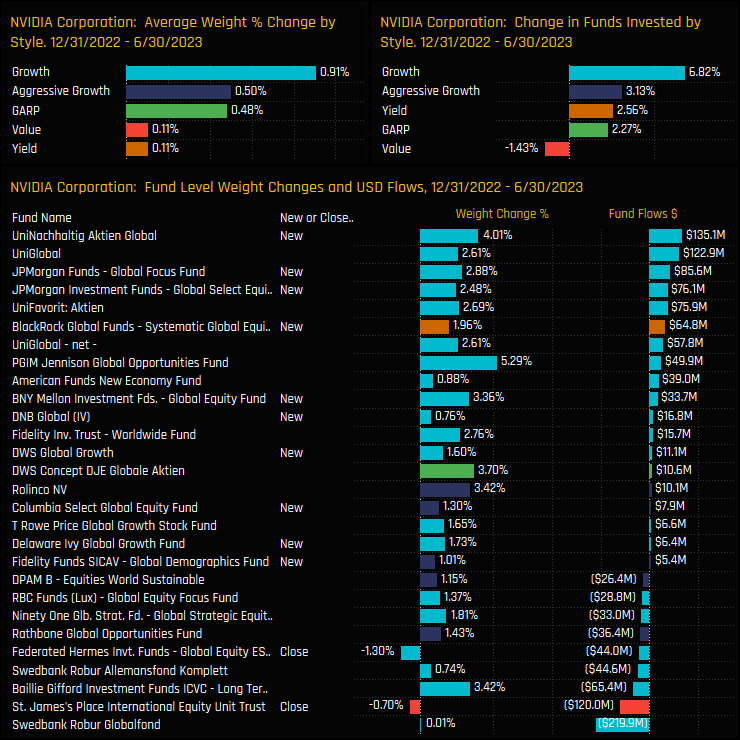
Fund Activity & Latest Holdings
Between 12/31/2022 and 06/30/2023, new positions from UniNachhaltig Global (+4.0%), JP Morgan Global Focus (+2.88%) and BNY Mellon Global Equity (3.36%) were among a total of 14 funds who opened exposure to NVIDIA Corp. Growth managers were prevalent among the larger buyers, with 6.8% of the Growth funds in our analysis opening new positions, and all but Value funds seeing ownership levels rise. Closures were by St James Place International Equity Trust (-0.7%) and Hermes Global ESG (-1.3%).
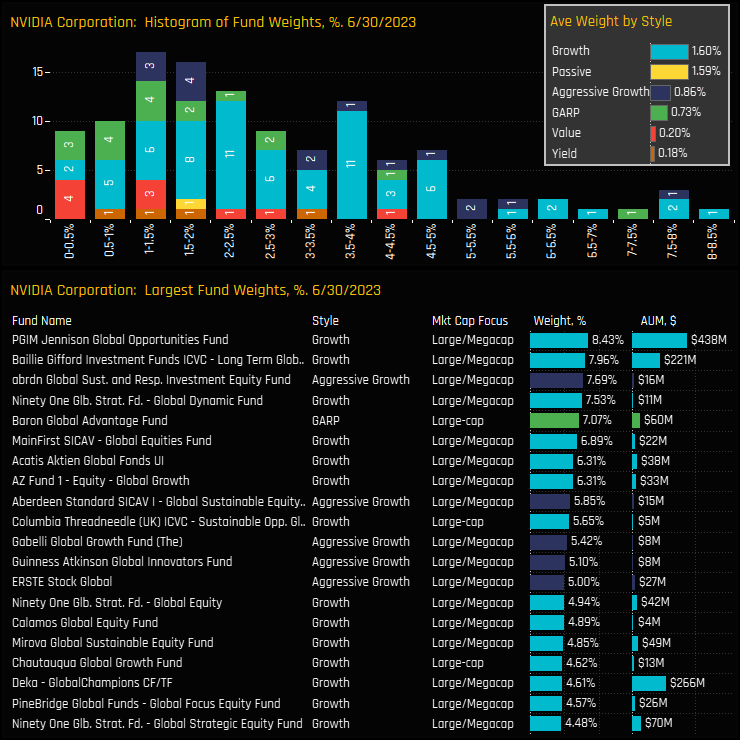
This leaves the latest distribution of fund weights in NVIDIA Corp clustered at between 1% and 5%, though it is a larger portfolio position for a number of managers. PGIM Jennison Global Opportunities (8.4%) and Baillie Gifford Long Term Global Growth (7.96%) lead a group of managers who are comfortable with a +7% position. NVIDIA is becoming a top portfolio holding for a growing number of funds.
Conclusions & Data Report
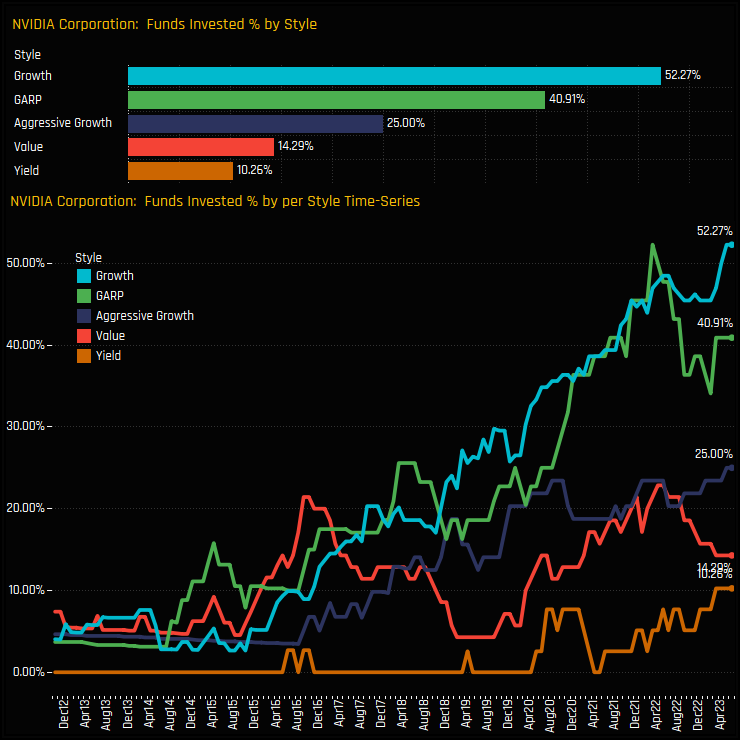
Can NVIDIA sustain these record levels of investment after seeing such an abrupt doubling of it’s market cap this year?
As is often the case among high growth companies, the picture is split. The chart opposite shows the percentage of funds invested in NVIDIA Corp over time, split by the Style of the fund. Growth funds have seen sustained increases in ownership over the last decade, with current levels the highest on record. They remain the most widely held Style group with 52.3% of funds invested. Aggressive Growth funds are some way behind but also stand at peak levels of ownership.
The fact that both GARP and Value fund ownership has fallen from the highs suggests there is some hesitation among those with a more traditional valuation led approach. However, given that 41% of GARP funds are still exposed shows that NVIDIA’s growth potential has some solid foundations.
Click below for an extended data report on Global fund ownership in NVIDIA Corp.
For more analysis, data or information on active investor positioning in your market, please get in touch with me on steven.holden@copleyfundresearch.com
Investor Positioning Report — Copley Fund Research Ltd · Last updated: July 2026 · Registered in England and Wales
1. Who we are
Copley Fund Research Ltd provides proprietary institutional fund intelligence to listed companies and investor relations professionals. These terms govern every purchase of an Investor Positioning Report. By completing a purchase you confirm you have read, understood, and agreed to these terms in full.
2. What you are purchasing
The Investor Positioning Report is a bespoke PDF report mapping the institutional fund universe around your stock. It covers current investors, past investors, competitor investors, and white space investors. Every report is built from scratch for the specific company ordered and is not a standardised or templated product.
3. Delivery and process
Following payment or invoice issuance, Copley Fund Research will contact you within one working day to agree your competitor set. Production begins once the competitor set is confirmed in writing. The completed report will be released to you within 48 hours of production starting, provided payment has been received in full; where payment is outstanding, the report will be withheld until payment clears. If the requested company falls outside our covered fund universes, or a competitor set cannot be agreed, Copley Fund Research will issue a full refund or cancel the outstanding invoice.
4. Competitor set agreement
The competitor set is agreed with you in writing prior to production, and the report is built to that agreed specification. Requests to amend the competitor set after delivery, based on a change of preference rather than an error, may be treated as a new order.
5. Refund policy
Because each report is produced individually for your company, orders are non-refundable once production has begun, except as set out in clauses 3 and 5a below. By purchasing, you agree not to dispute the charge with your card provider on the basis that the service was not as described, provided the report has been delivered to the agreed specification or corrected under clause 5a.
5a. Quality remedy
If a delivered report contains a material error caused by Copley Fund Research — for example, an incorrect company analysed, a competitor omitted from the agreed set, or content missing from the specification in clause 2 — Copley Fund Research will correct and redeliver the report at no additional charge, within a reasonable timeframe. This is your sole remedy for such errors.
6. Data and accuracy
All fund positioning data in the report reflects holdings as disclosed at the most recently available reporting date at the time of compilation. The timing of fund holdings disclosures is determined by regulatory requirements applicable to each fund and is outside the control of Copley Fund Research Ltd. This data may not reflect current fund positions. Copley Fund Research takes reasonable care to ensure accuracy but makes no warranty, express or implied, as to the completeness or current accuracy of the underlying data — though this does not affect the quality remedy in clause 5a for errors in how that data was analysed or presented. Past fund positioning is not indicative of future fund behaviour or investment decisions.
7. Not investment advice
The Investor Positioning Report is produced for investor relations intelligence purposes only. It does not constitute investment advice, financial advice, or a recommendation to buy, hold, or sell any security. The data reflects historical fund positioning and must not be relied upon as a prediction of future fund behaviour or investment decisions. Copley Fund Research Ltd is not authorised or regulated by the Financial Conduct Authority for the provision of investment advice.
8. Permitted use and confidentiality
The report is licensed for internal use by the purchasing organisation only. You may share it with employees and directors of your organisation. You may not: reproduce, redistribute, publish, or resell the report or any part of it; share it with any third party outside your organisation without prior written consent; use the fund or portfolio manager names contained in the report to approach those individuals on behalf of Copley Fund Research or in a manner that could damage Copley Fund Research's relationships with those funds; or use the data for any purpose other than your own investor relations strategy. The data, analysis, and methodology contained in the report are the intellectual property of Copley


