Saudi Arabia Special Report: A Tipping Point in EM Equity Allocations

  • 2023 marks a pivotal year with EM investors significantly increasing holdings in the Saudi market.
  • Major EM investors from GQG Partners to Capital Funds record notable fund inflows into Saudi for the first time.
  • Despite growing interest, the Saudi market still presents ample room for broader investor engagement.
  • Saudi Arabia remains comparatively ‘under-owned’ in relation to its Asian and LATAM peers.

Saudi Fund Ownership Trends

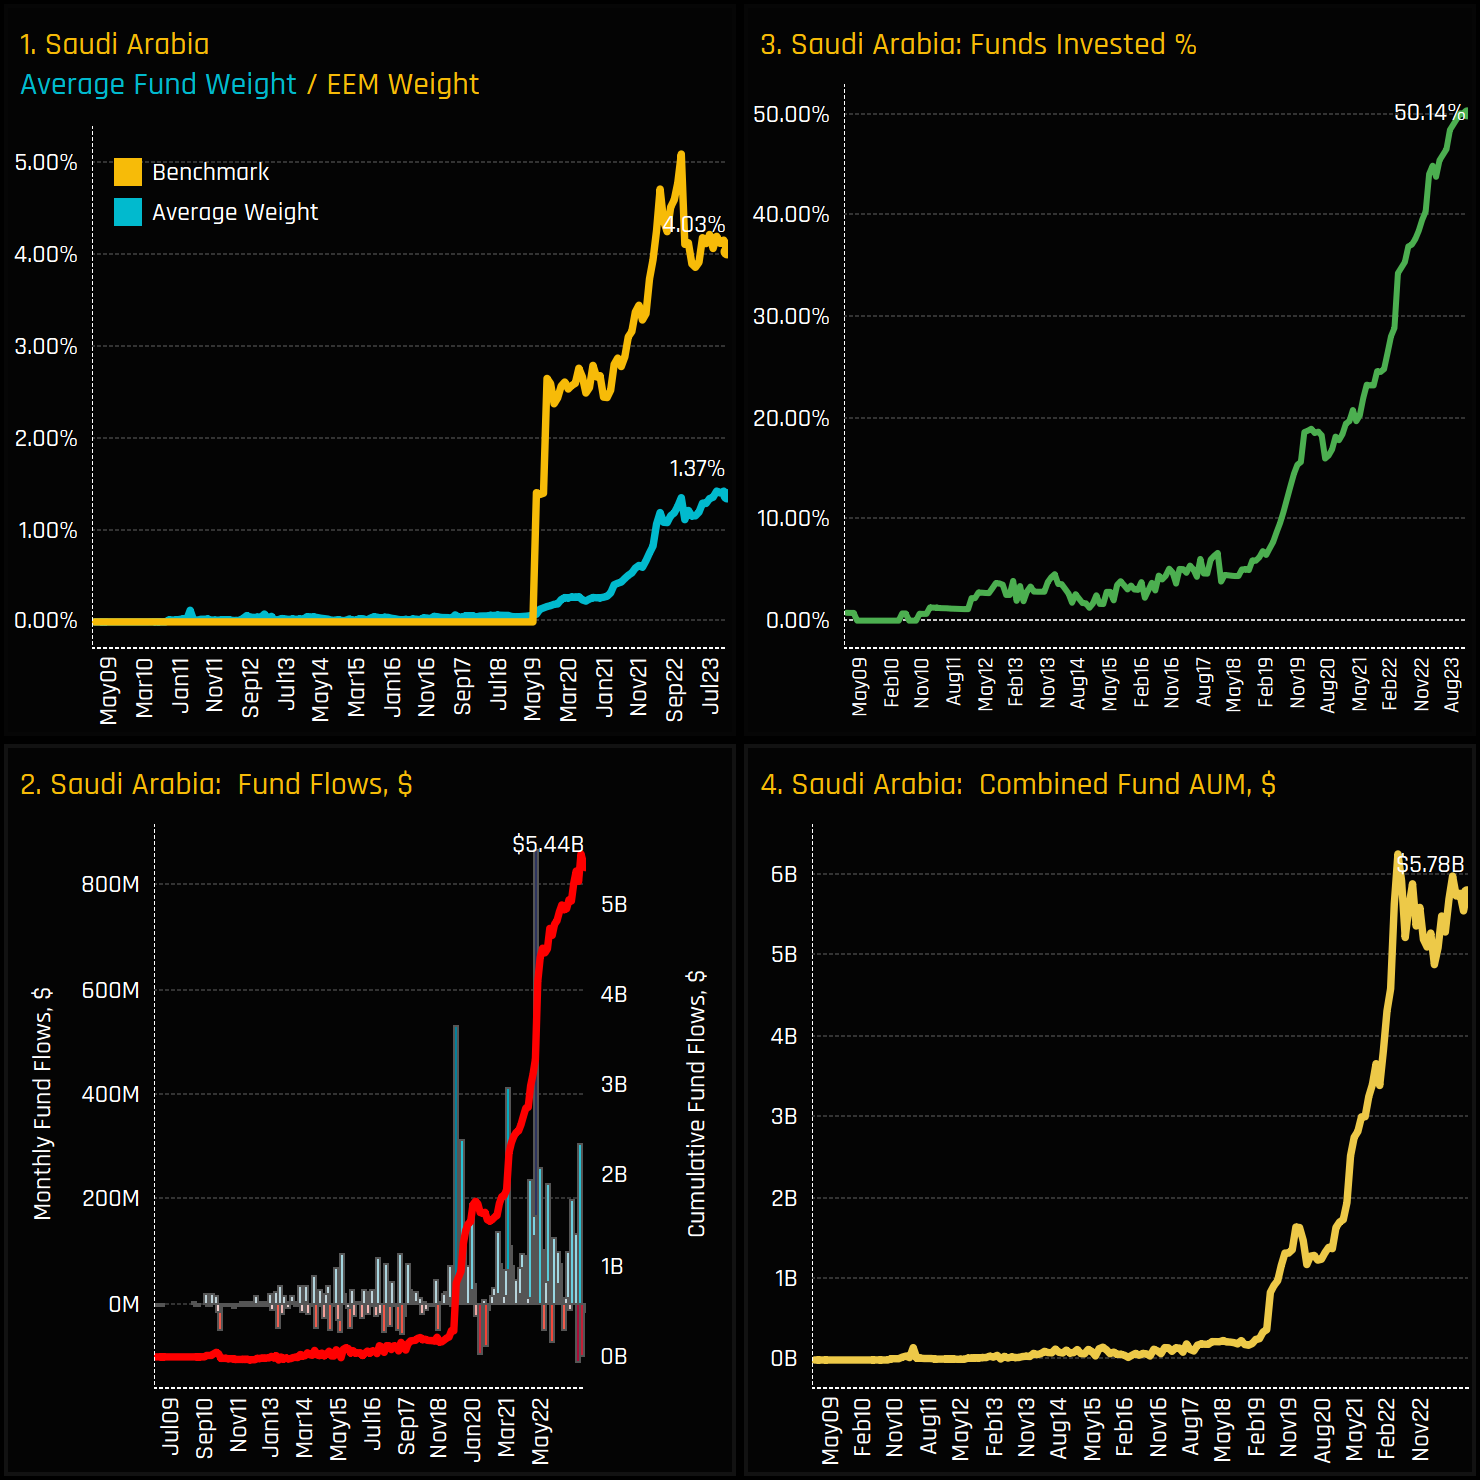
The percentage of active EM funds investing in Saudi stocks has surpassed 50% for the first time in our fund holdings history. Chart 3 opposite shows this remarkable rise in ownership, with the percentage of funds invested in Saudi Arabia doubling over the past 2-years, supported by consistent fund inflows as shown in chart 2. In the 55 months post-MSCI EM entry, 43 months have seen net inflows, totaling $5.15 billion. Average fund weights of 1.37% are close to their highest on record, with total Saudi assets of $5.8bn at the top of the decade-long range.

2023 Fund Activity

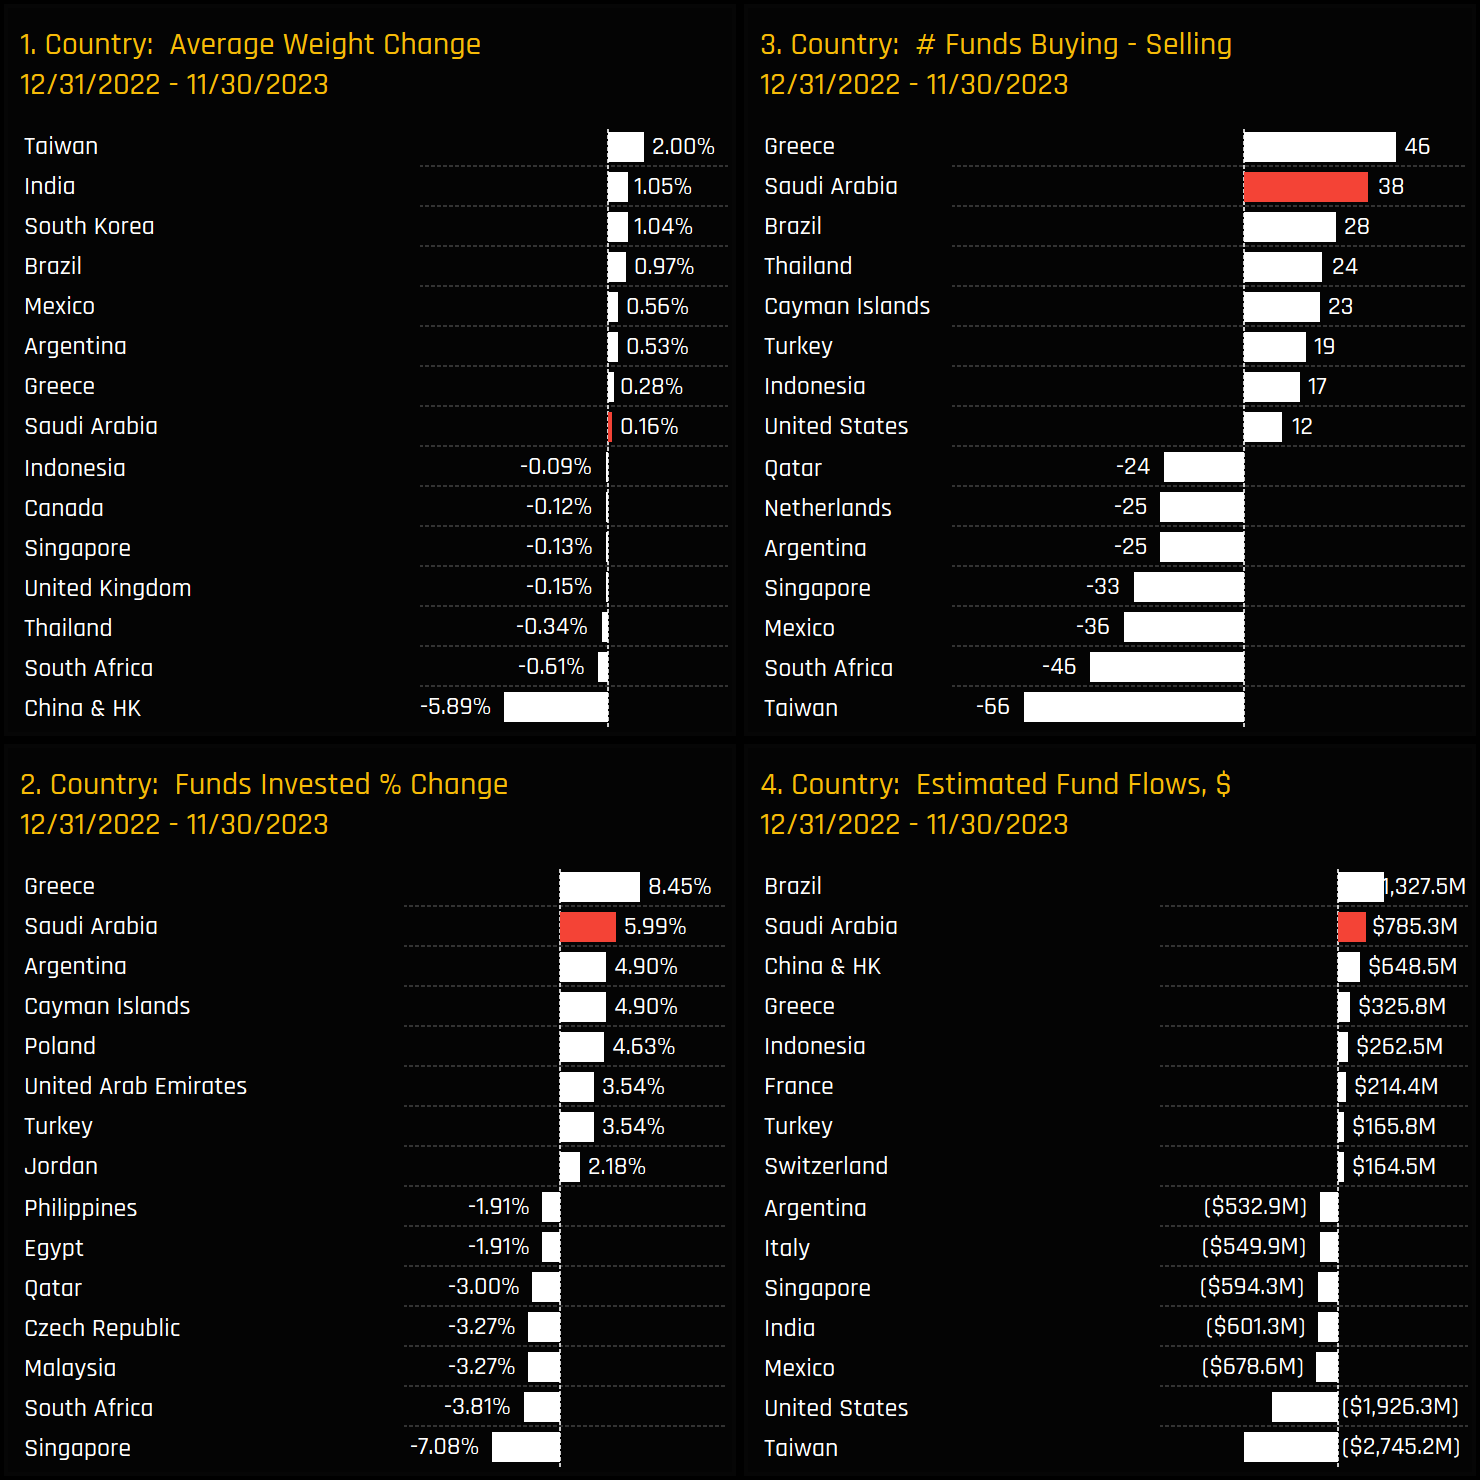
In 2023, Saudi Arabia really gained traction among EM active investors, as seen in the chart collection opposite. It achieved the second-highest fund inflows of $785m after Brazil (ch4), and a significant increase in the percentage of funds invested of +5.9%, just behind Greece (ch2). These metrics reflect a targeted and active reallocation towards Saudi assets over the year

Stock Ownership

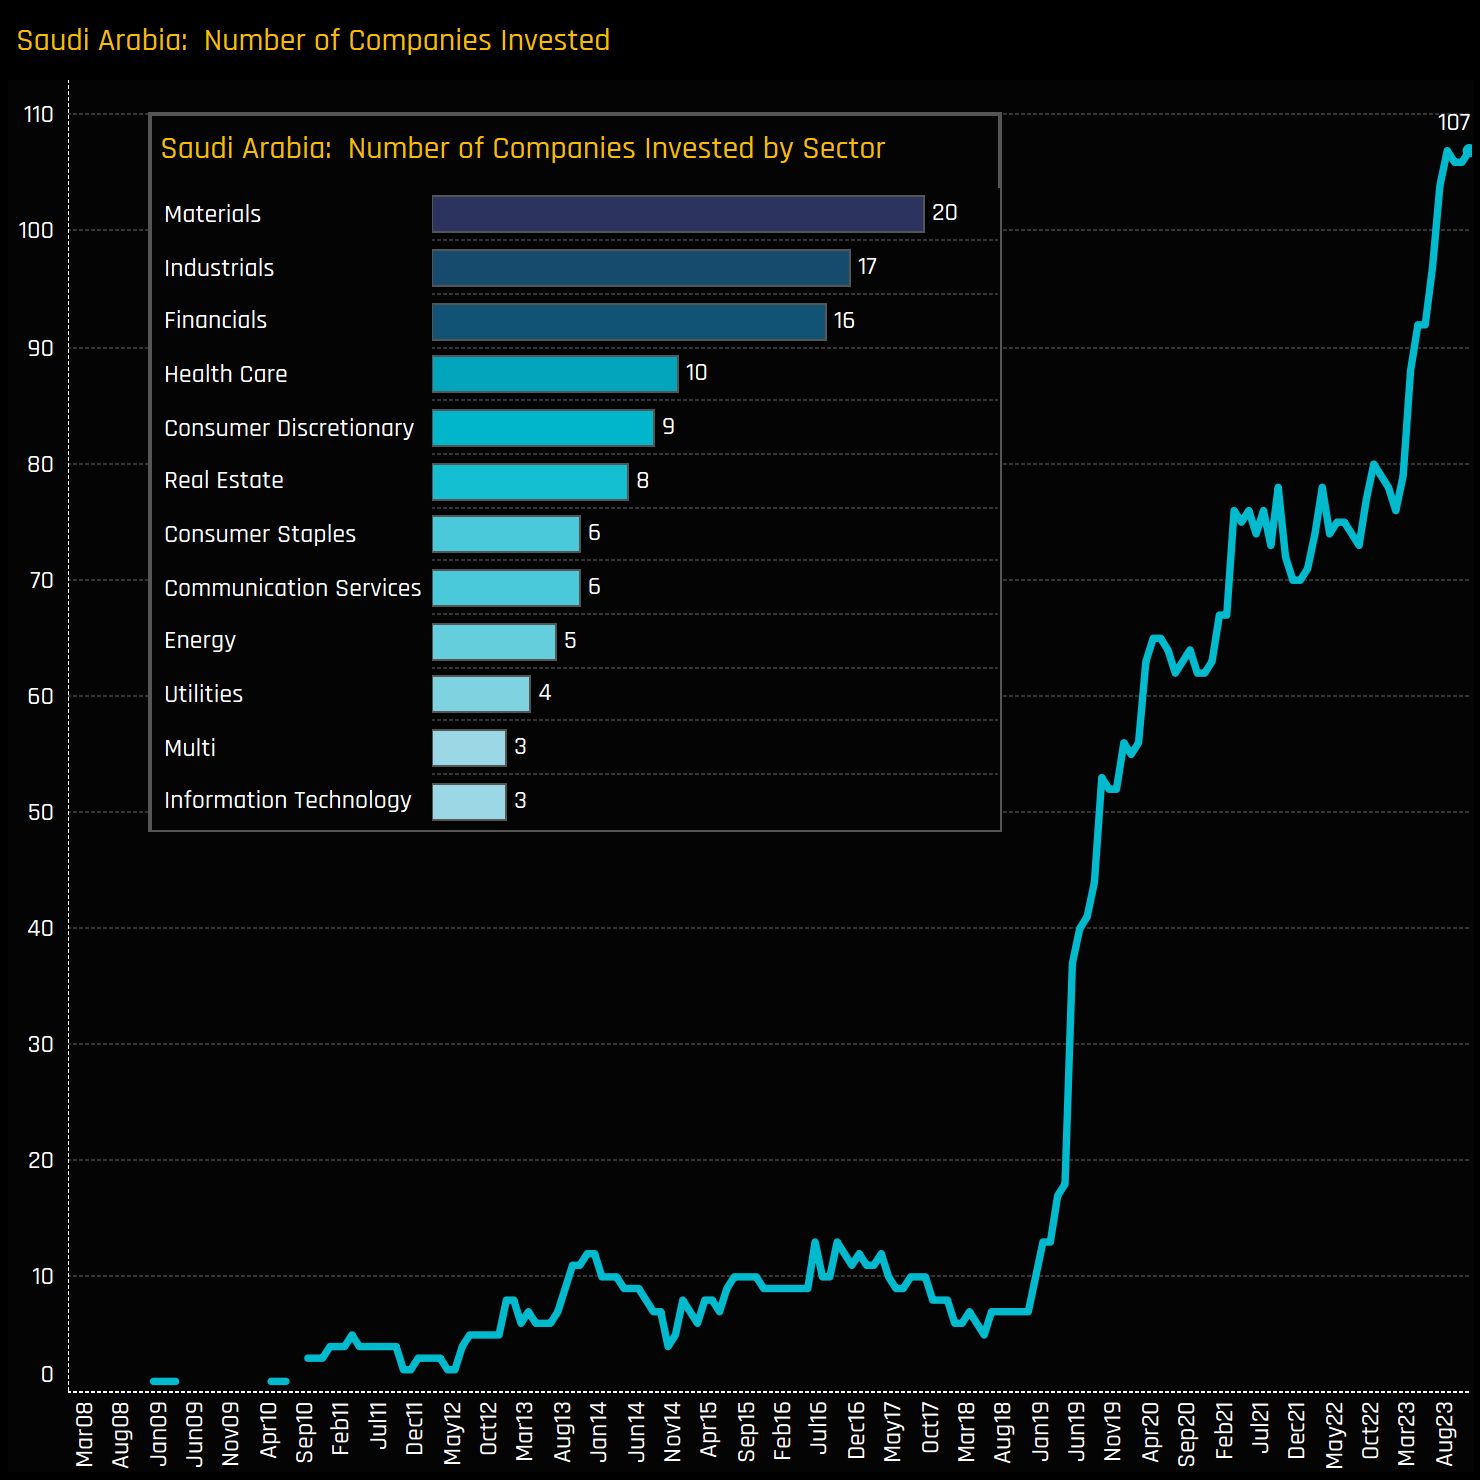
Alongside the rise in overall Saudi investment, there has been an expansion in the breadth of stock holdings. A record 107 companies have now found investment from the 367 EM funds in our analysis, indicating a willingness by investors to explore beyond the major index constituents. By comparison, the iShares MSCI Emerging Market ETF includes only 42 companies.

Under-Owned?

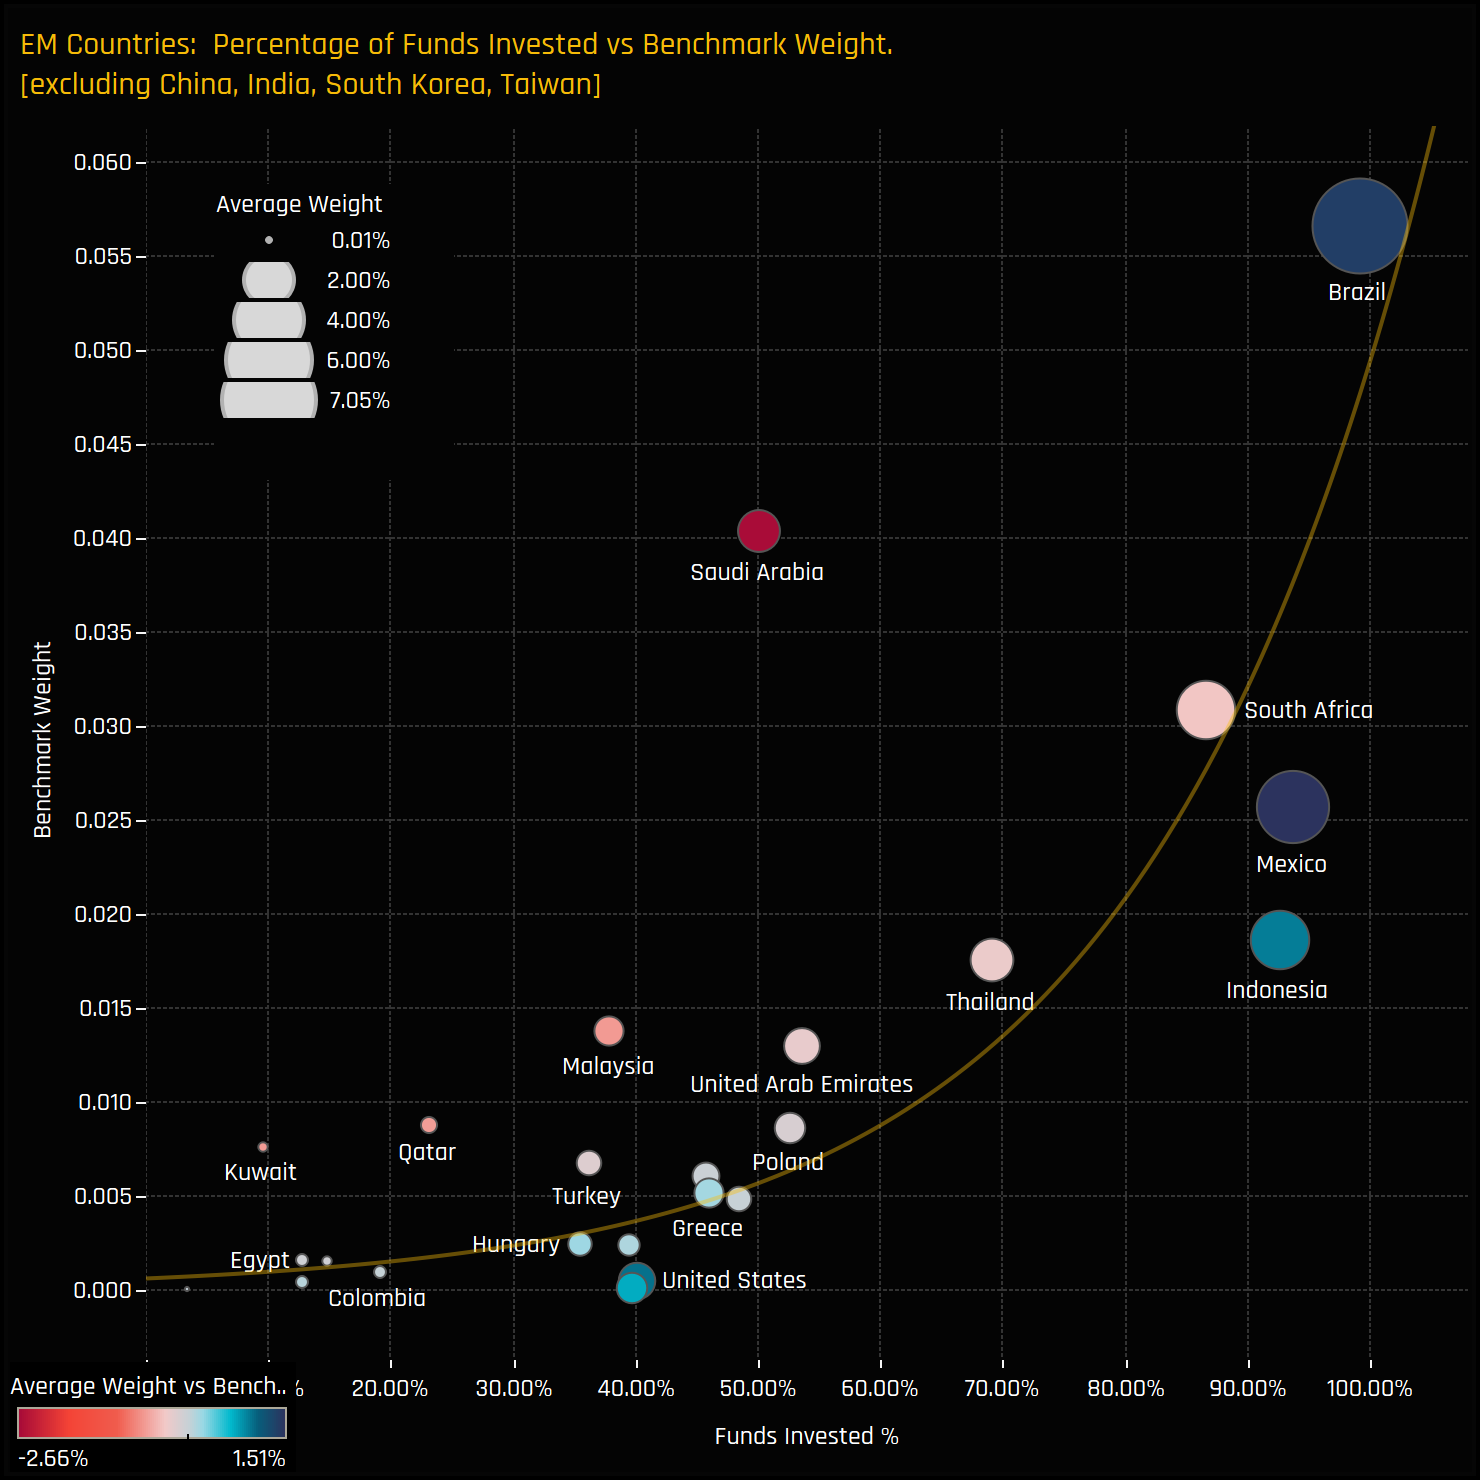
Yet despite this meteoric rise in investment, we would still go as far as saying Saudi Arabia is ‘under-owned’ here. The adjacent chart illustrates the correlation between the percentage of funds invested in each country and their respective benchmark weights. This relationship is positively skewed and grows exponentially towards 100% ownership (which is why we have excluded the universally held China, India, Taiwan, and South Korea from the chart). Saudi Arabia stands as a significant outlier from the trend line. To align with markets such as Brazil, South Africa, and Mexico, around 90% of funds should have exposure to Saudi Arabia.  While nothing is certain, the 40% of funds that have yet to invest in Saudi Arabia account for $127 billion in total fund AUM, so the flow potential is real. 


Conclusions

Historically, managers have been content with maintaining a benchmark underweight in Saudi, but as an increasing number of active investors increase their exposure, this stance has evolved into a peer group underweight. Consequently, the relative risks associated with non-investment in Saudi are escalating with each passing month.

In the full report, we deep dive in to the most popular stock holdings, the key ownership moves across sectors and stocks and the funds driving this allocation shift.  If you are a financial professional and would like to see the full report as part of a trial, please get in touch directly on the email below. 

Taken from our Emerging Markets positioning analysis, covering 367 active strategies with a combined AUM of $400bn.

Terms and Conditions

Investor Positioning Report — Copley Fund Research Ltd  ·  Last updated: July 2026  ·  Registered in England and Wales

1. Who we are

Copley Fund Research Ltd provides proprietary institutional fund intelligence to listed companies and investor relations professionals. These terms govern every purchase of an Investor Positioning Report. By completing a purchase you confirm you have read, understood, and agreed to these terms in full.

2. What you are purchasing

The Investor Positioning Report is a bespoke PDF report mapping the institutional fund universe around your stock. It covers current investors, past investors, competitor investors, and white space investors. Every report is built from scratch for the specific company ordered and is not a standardised or templated product.

3. Delivery and process

Following payment or invoice issuance, Copley Fund Research will contact you within one working day to agree your competitor set. Production begins once the competitor set is confirmed in writing. The completed report will be released to you within 48 hours of production starting, provided payment has been received in full; where payment is outstanding, the report will be withheld until payment clears. If the requested company falls outside our covered fund universes, or a competitor set cannot be agreed, Copley Fund Research will issue a full refund or cancel the outstanding invoice.

4. Competitor set agreement

The competitor set is agreed with you in writing prior to production, and the report is built to that agreed specification. Requests to amend the competitor set after delivery, based on a change of preference rather than an error, may be treated as a new order.

5. Refund policy

Because each report is produced individually for your company, orders are non-refundable once production has begun, except as set out in clauses 3 and 5a below. By purchasing, you agree not to dispute the charge with your card provider on the basis that the service was not as described, provided the report has been delivered to the agreed specification or corrected under clause 5a.

5a. Quality remedy

If a delivered report contains a material error caused by Copley Fund Research — for example, an incorrect company analysed, a competitor omitted from the agreed set, or content missing from the specification in clause 2 — Copley Fund Research will correct and redeliver the report at no additional charge, within a reasonable timeframe. This is your sole remedy for such errors.

6. Data and accuracy

All fund positioning data in the report reflects holdings as disclosed at the most recently available reporting date at the time of compilation. The timing of fund holdings disclosures is determined by regulatory requirements applicable to each fund and is outside the control of Copley Fund Research Ltd. This data may not reflect current fund positions. Copley Fund Research takes reasonable care to ensure accuracy but makes no warranty, express or implied, as to the completeness or current accuracy of the underlying data — though this does not affect the quality remedy in clause 5a for errors in how that data was analysed or presented. Past fund positioning is not indicative of future fund behaviour or investment decisions.

7. Not investment advice

The Investor Positioning Report is produced for investor relations intelligence purposes only. It does not constitute investment advice, financial advice, or a recommendation to buy, hold, or sell any security. The data reflects historical fund positioning and must not be relied upon as a prediction of future fund behaviour or investment decisions. Copley Fund Research Ltd is not authorised or regulated by the Financial Conduct Authority for the provision of investment advice.

8. Permitted use and confidentiality

The report is licensed for internal use by the purchasing organisation only. You may share it with employees and directors of your organisation. You may not: reproduce, redistribute, publish, or resell the report or any part of it; share it with any third party outside your organisation without prior written consent; use the fund or portfolio manager names contained in the report to approach those individuals on behalf of Copley Fund Research or in a manner that could damage Copley Fund Research's relationships with those funds; or use the data for any purpose other than your own investor relations strategy. The data, analysis, and methodology contained in the report are the intellectual property of Copley