Related Posts


• The Magnificent 7, comprising Microsoft, Apple, Alphabet, Amazon, Meta, NVIDIA and Tesla have hit record high allocations among active Global equity funds this year.
• Thought of as a standalone allocation, they represent the 2nd largest country weight, but also stand as a sizeable underweight versus the benchmark.
• Value funds continue to find reasons to sell, with underweights growing in magnitude as key funds close out.
• Microsoft's dominates the group, NVIDIA has attracted a new investors this year, whilst Tesla has struggled to gain the same level of trust from active Global investors.
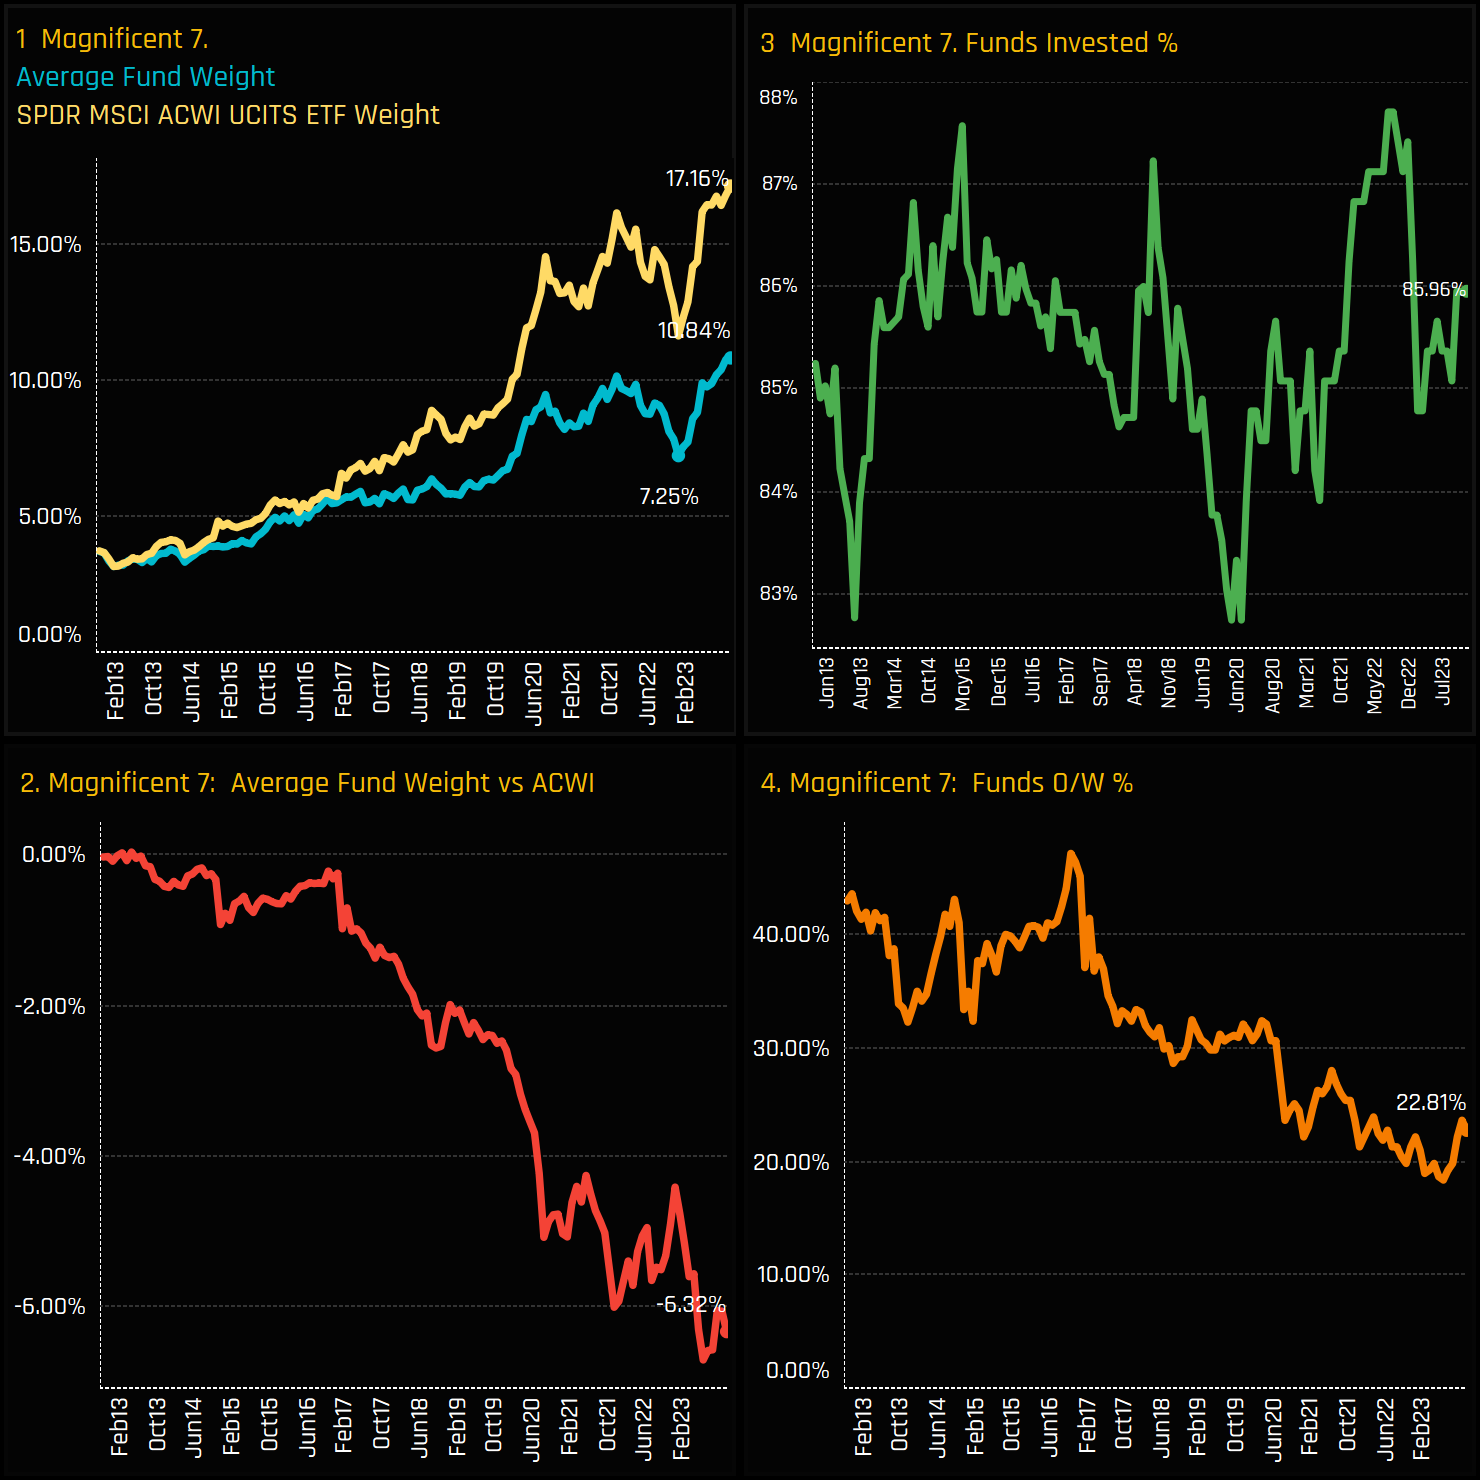
Allocations to the ‘Magnificent 7’ group of stocks in global equity funds have reached record highs. As depicted in Chart 1 below, both the average active Global fund and the iShares ACWI ETF have seen a marked increase in allocations following a decline through most of 2022. Despite this uptrend, active funds have not matched the benchmark index’s growing weight, resulting in a near-record underweight position of -6.32%. While 87% of funds hold at least one of the Magnificent 7 stocks, only 22.8% maintain an overweight position compared to the ACWI ETF.
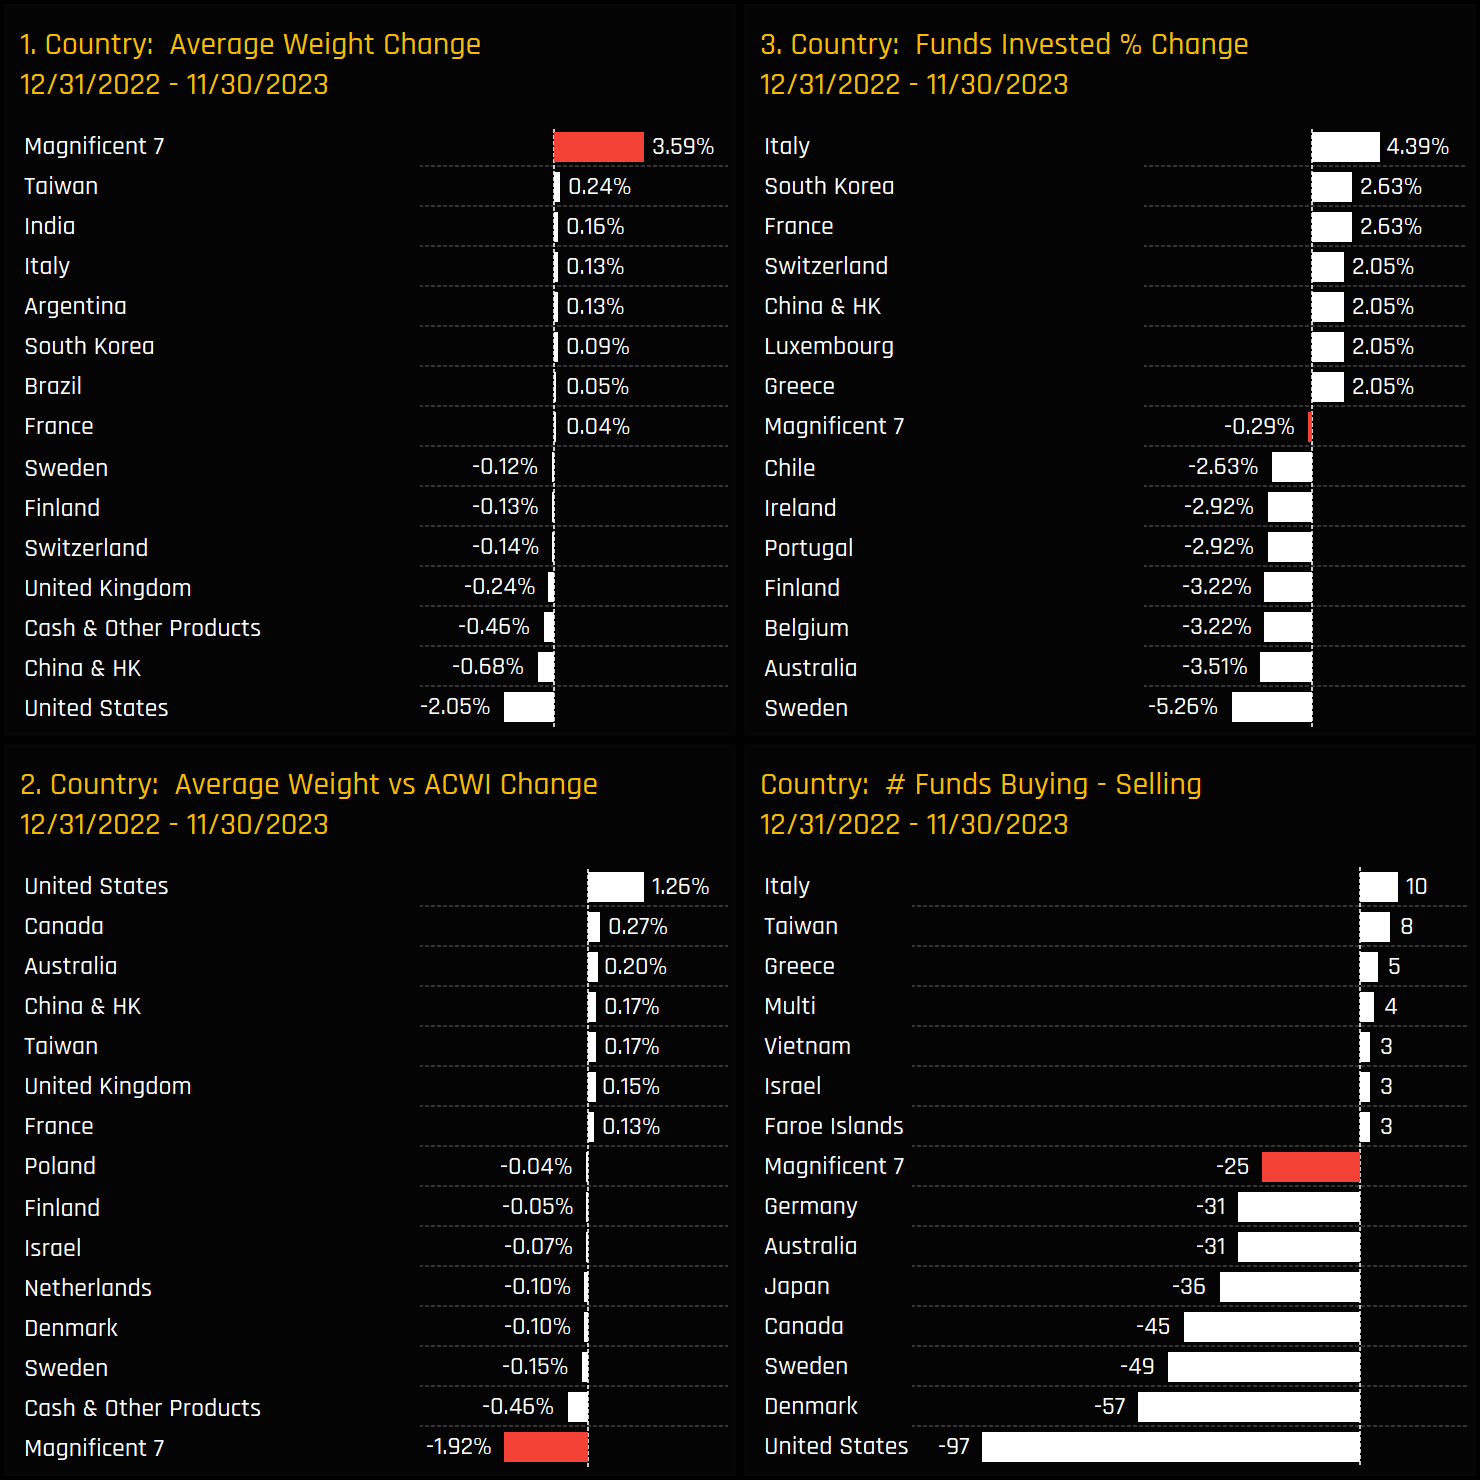
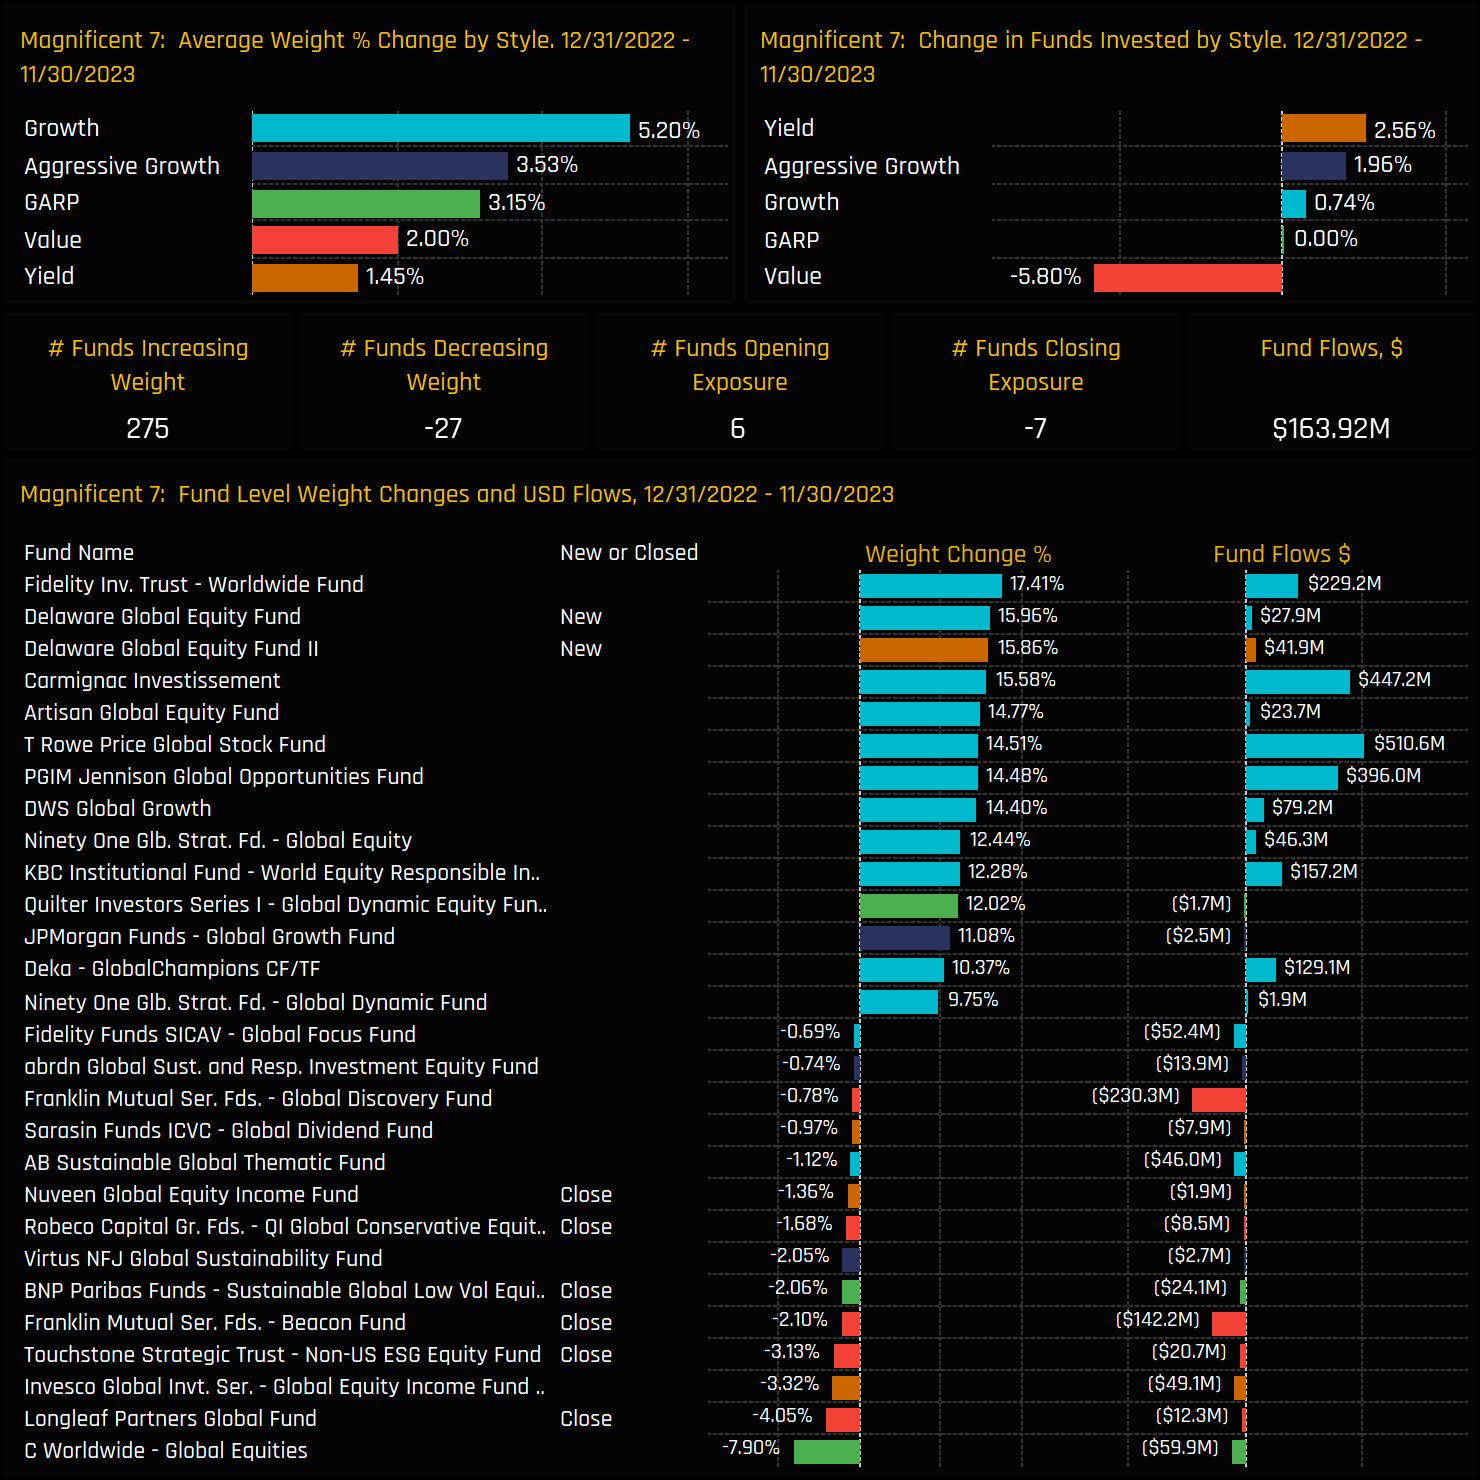
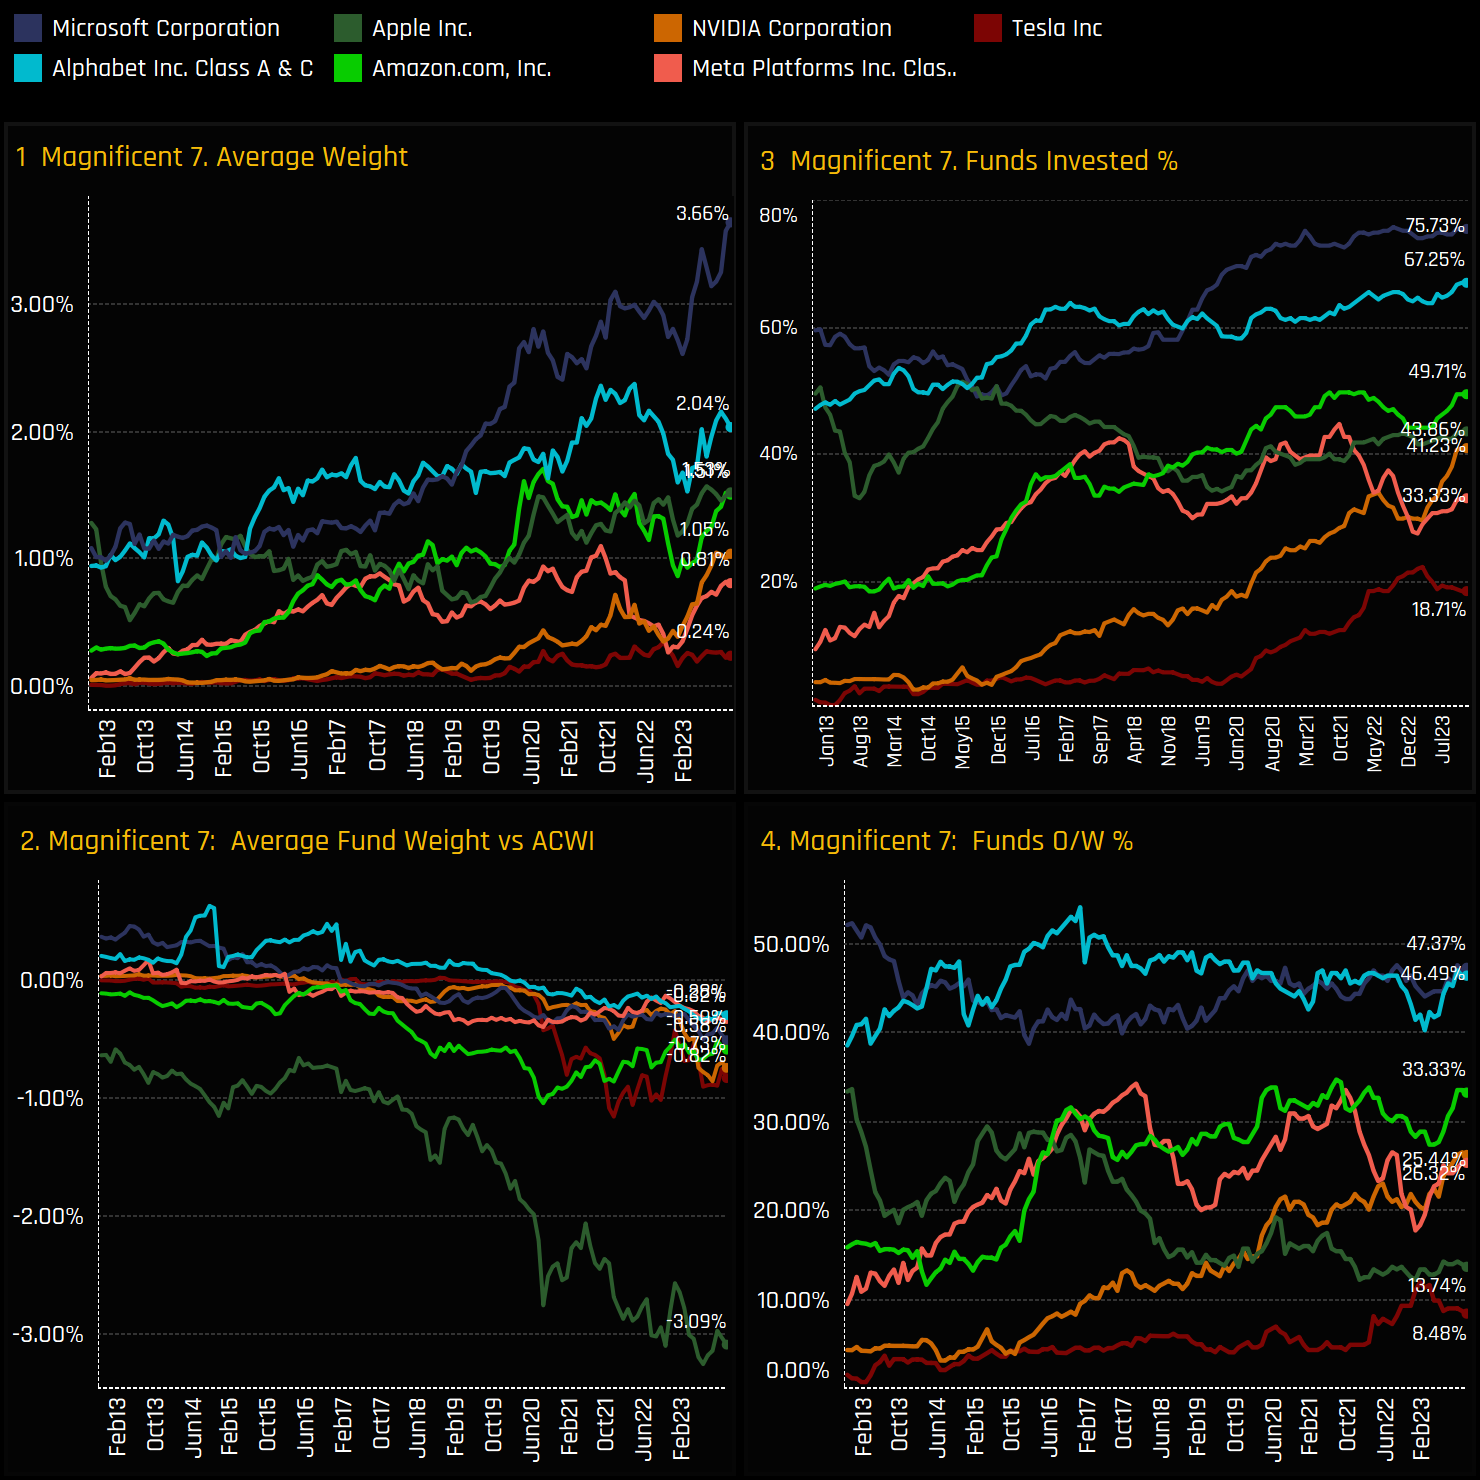
In 2023, when viewed as a separate country allocation, the Magnificent 7 stocks have seen the largest increase in average fund weight compared to any other country. Chart 1 shows their average weight increasing by +3.59% between 12/31/2022 and 11/30/2023. This increase was primarily offset by reductions in U.S. stocks (excluding Mag7), China & Hong Kong, cash, and UK allocations. Simultaneously, the net underweight for the Magnificent 7 rose by -1.92%, while the underweight in U.S. stocks (excluding Mag7) narrowed by +1.26%. Despite these shifts, the overall percentage of funds invested remained constant. The excess of sellers over buyers primarily stemmed from net outflows totaling $6 billion from this asset class over the year.
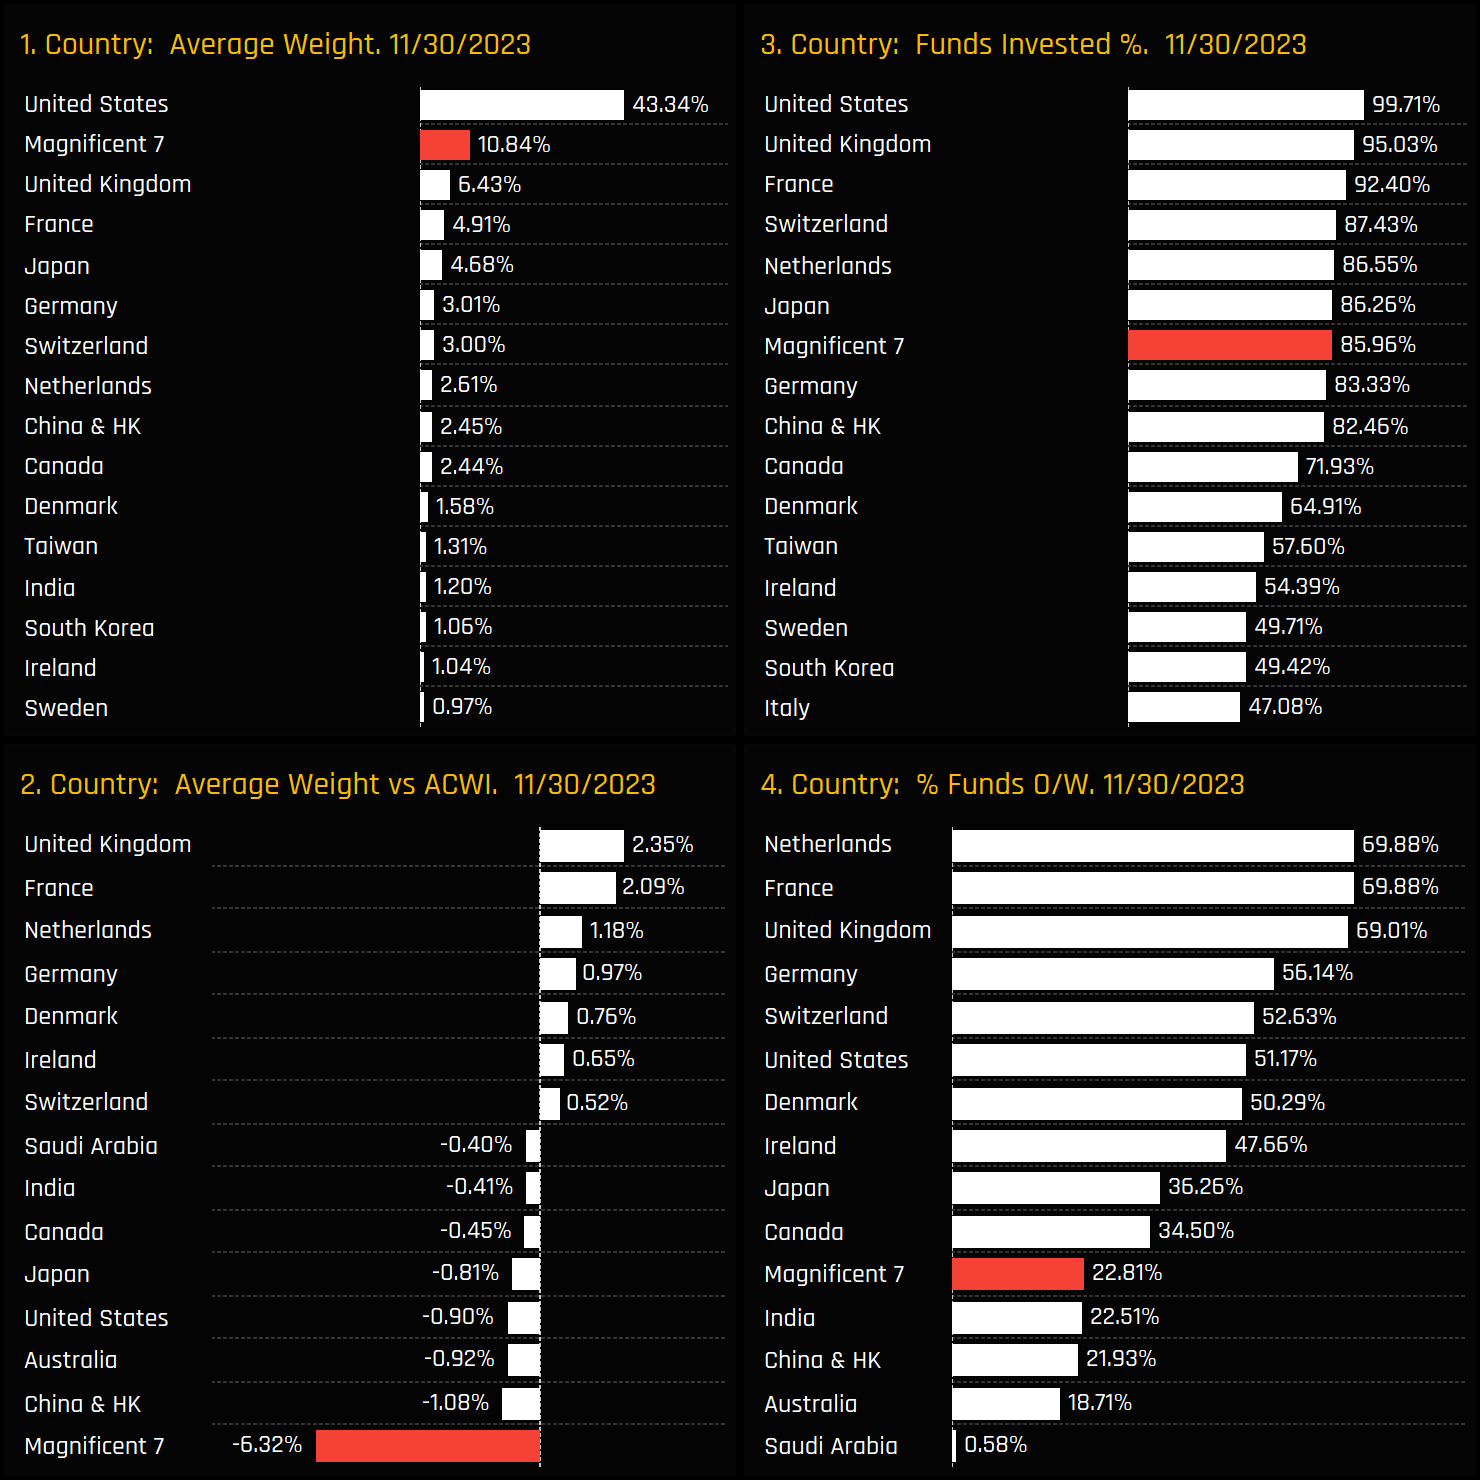
These increases have positioned the Magnificent 7 as the second-largest country allocation for Global investors, as depicted in chart 1 below. The standout metric is the underweight of -6.32% as shown in chart 2, which is well above the underweights of China & HK (-1.1%), Australia (-0.92%) and the rest of the USA (-0.9%). Funds underweight the Magnificent 7 are primarily positioning their portfolios overweight in select European countries, with the UK, France, and the Netherlands leading the way.
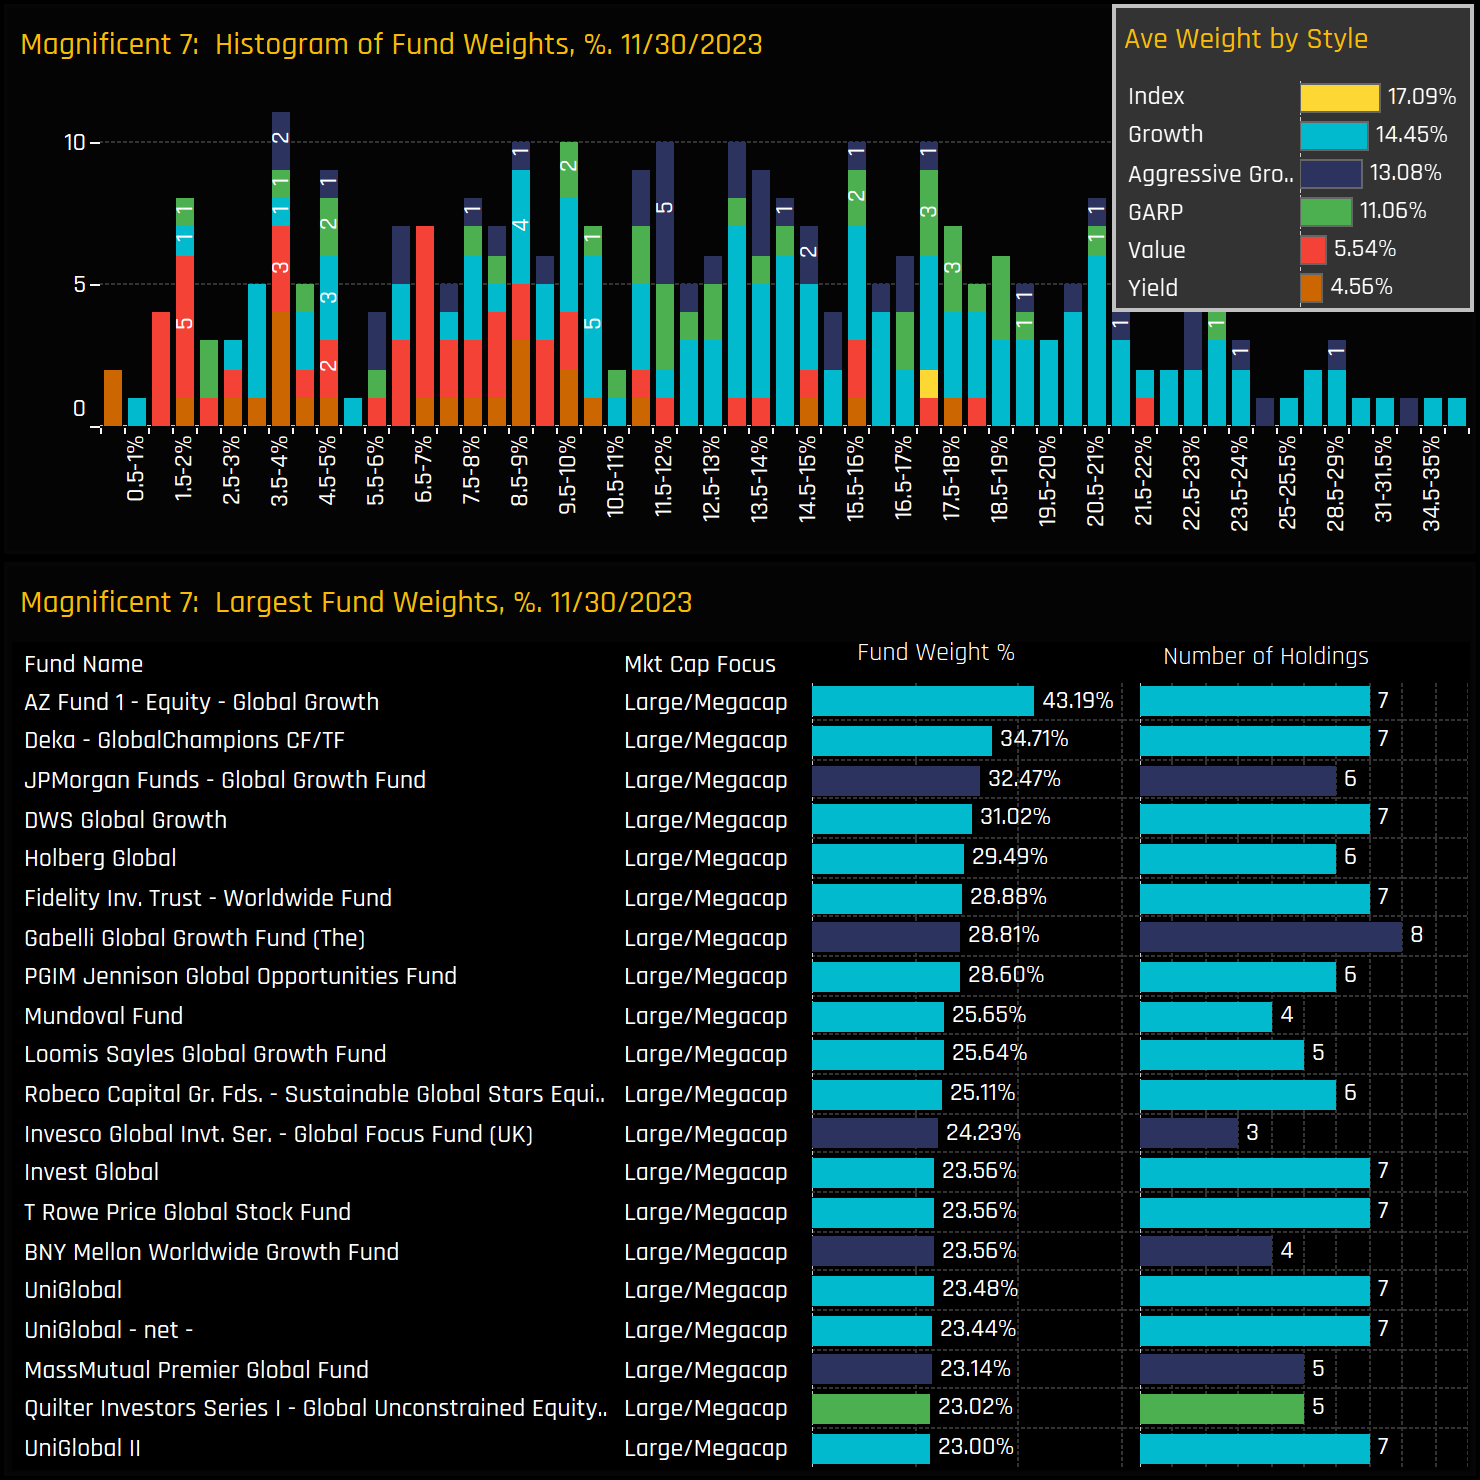
At the individual fund level, allocations to the Magnificent 7 span a wide range, extending to four funds with allocations above 30%. Growth and Aggressive Funds constitute 37 of the top 40 holders, with AZ Global Growth (43.2%) and Deka Global Champions (34.7%)—both holding all 7 companies—leading the pack. Despite this, all style groups are net underweight compared to the benchmark, with Value and Yield funds having notably lower allocations than their Growth counterparts.
The drivers behind the allocation shift at the fund level are illustrated in the lower chart. From 12/31/2022 to 11/30/2023, 275 funds increased their allocations to the Magnificent 7, while only 27 reduced them. Delaware Global Equity initiated new positions of 15%+, and Fidelity Worldwide made the largest increase of +17.4%. However, there was a notable exception: the percentage of Value funds invested in the Magnificent 7 decreased by -5.8%. Notably, Longleaf Global reduced its allocation by -4.05%, with both Touchstone and Franklin Mutual exiting their positions altogether.
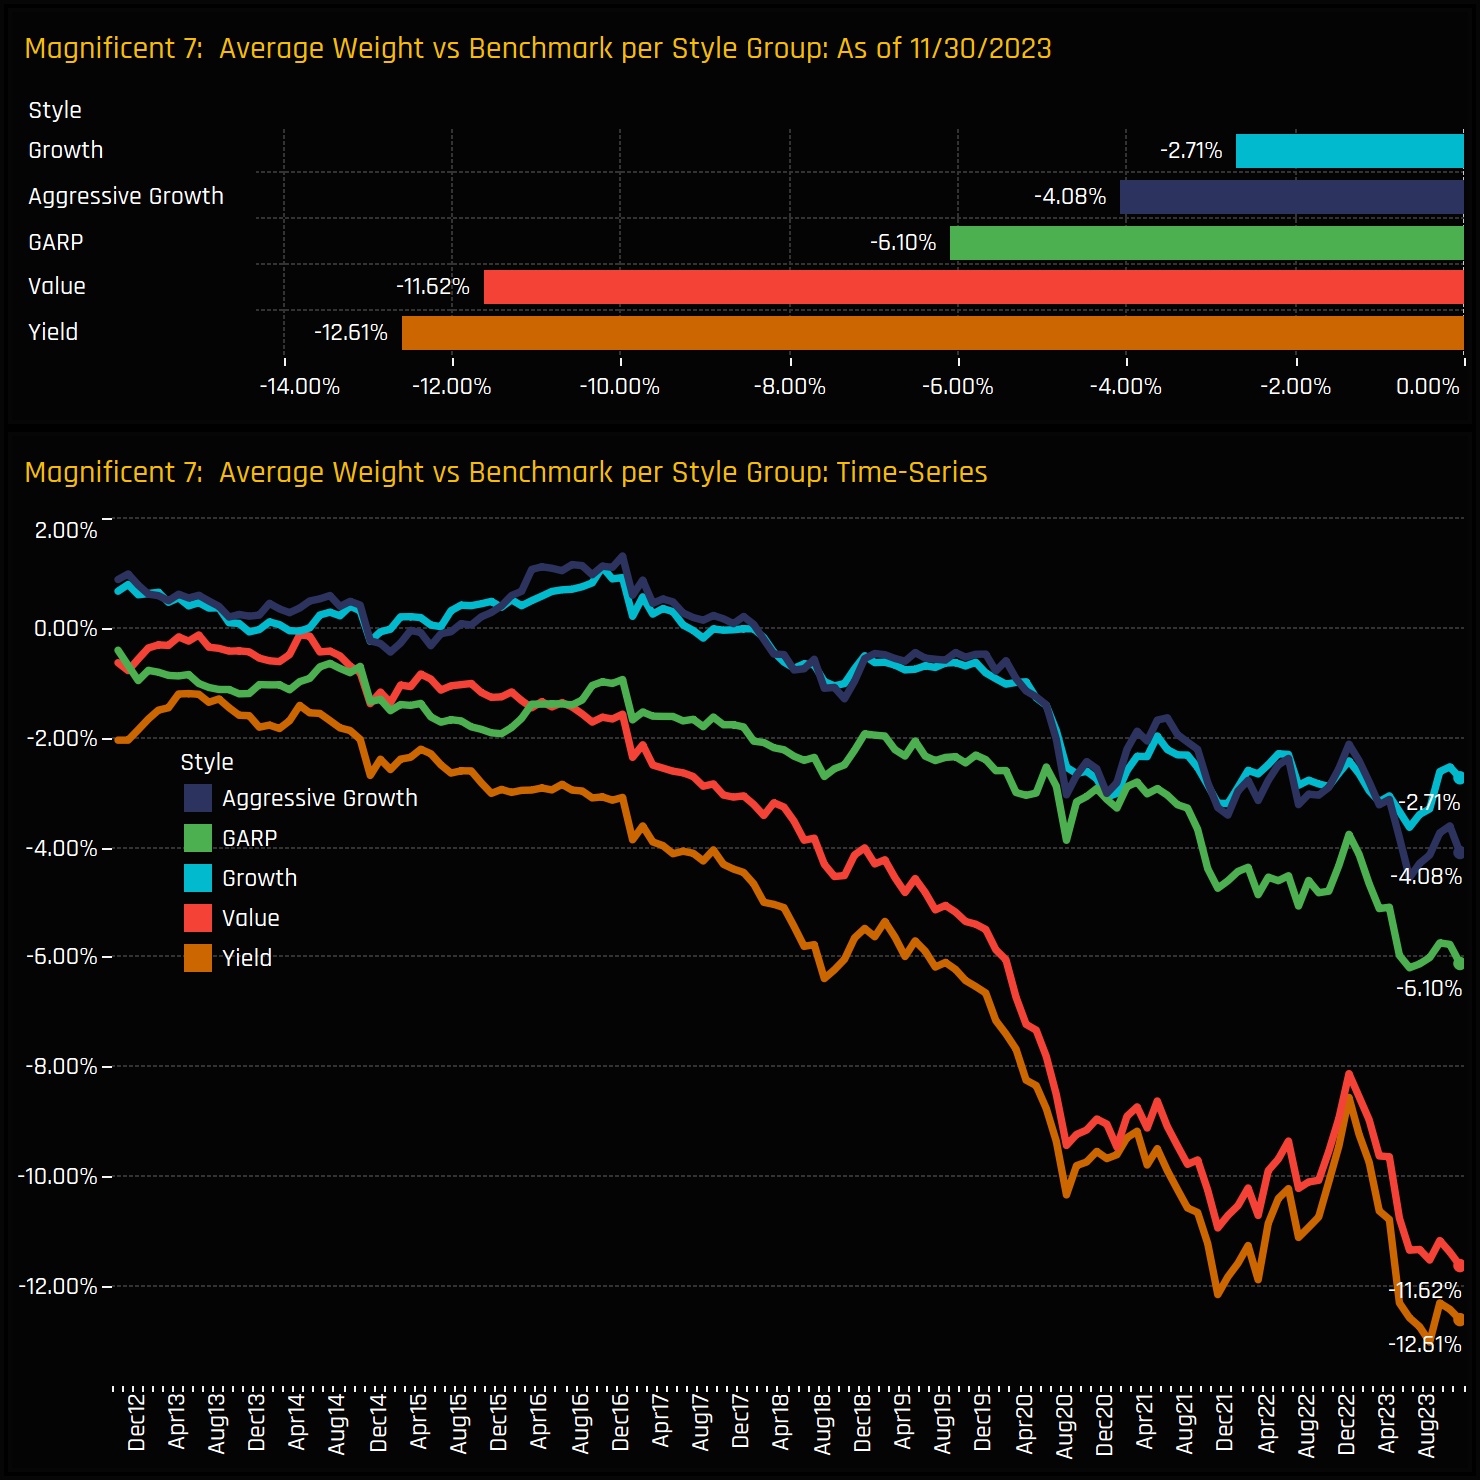
The ongoing move away from the Magnificent 7 by Value managers is part of a long-standing trend of reluctance towards the group. The below chart details the average holding weight in the Magnificent 7 minus the weight in the iShares ACWI ETF, categorized by fund Style. Over the past decade, both Value and Yield funds have significantly deepened their underweight positions, reaching -11.6% and -12.6% respectively, some of the lowest in our records. More recently, GARP funds have begun diverging from Growth and Aggressive Growth funds, possibly reflecting the growing difficulty in justifying valuations at this juncture.
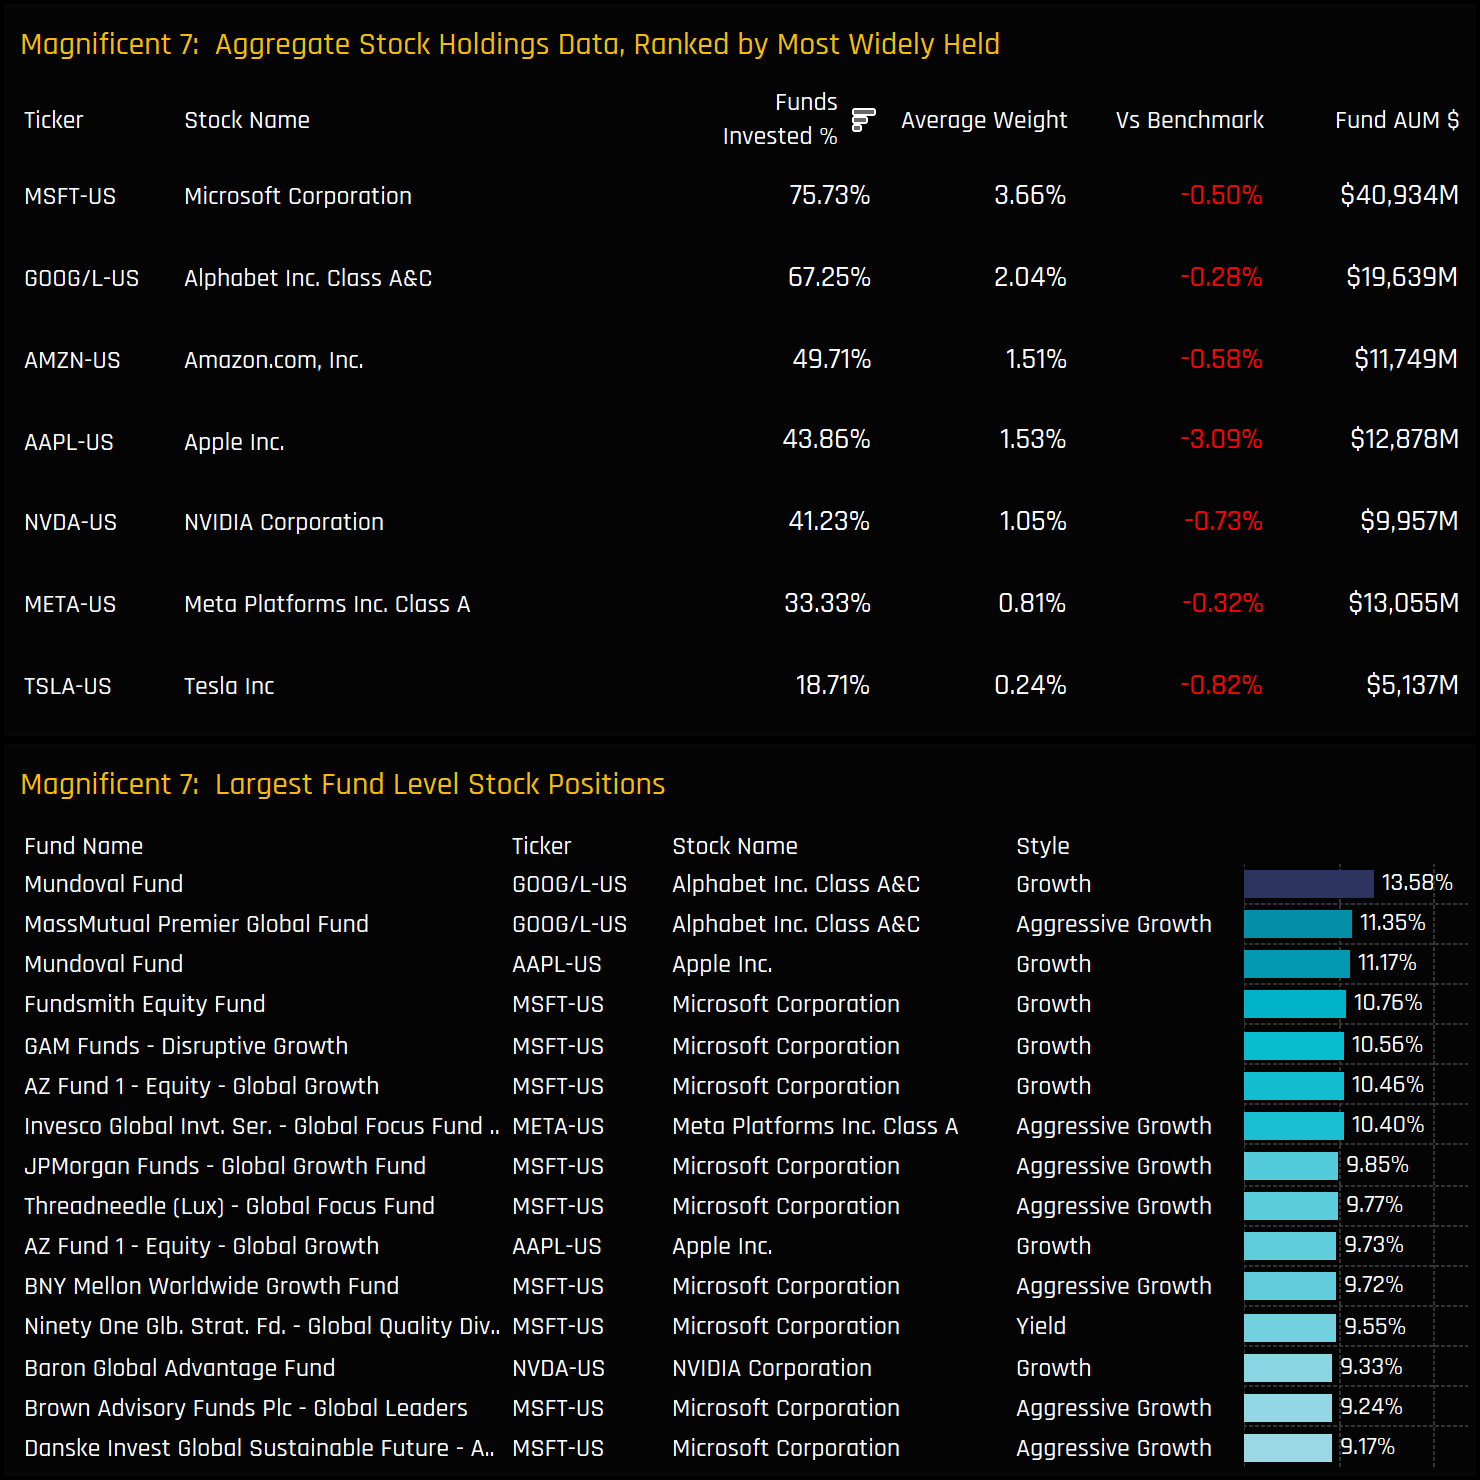
Though grouped together due to their perceived magnificence, individual ownership levels within the group vary significantly. At the top end are Microsoft and Alphabet, owned by 75.7% and 67.3% of funds respectively and at average weights just marginally behind the iShares ACWI ETF. Apple emerges as a notable underweight, held by only 43.8% of funds and averaging an underweight of -3.1%. Telsa is very much the runt of the litter, owned by just 18.7% of managers and at weights well below the benchmark index. On an individual fund level, Microsoft dominates the list of large positions, though Mundoval’s 13.6% position in Alphabet tops the list.
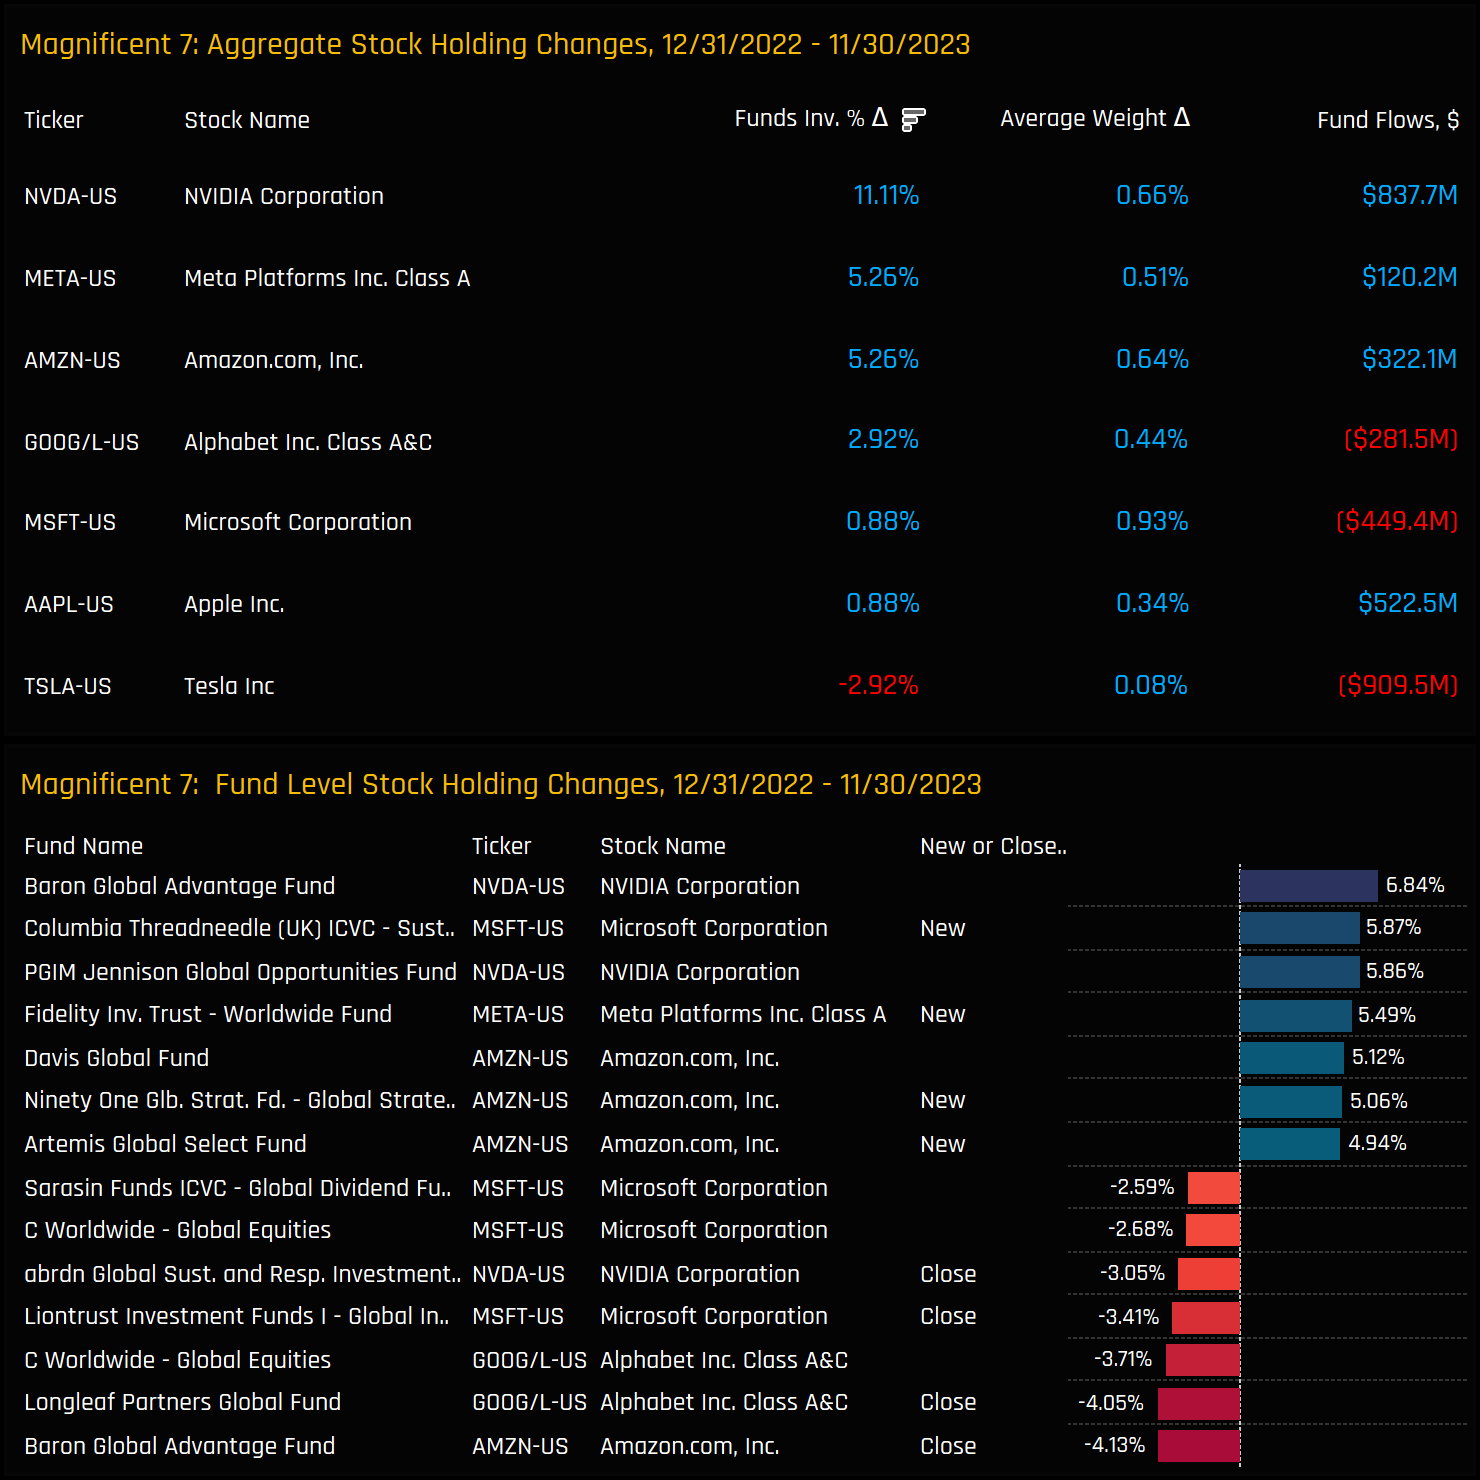
Ownership changes at the stock level this year have been predominantly positive, with NVIDIA leading the way. The proportion of funds invested in NVIDIA soared by +11.1%, buoyed by $837 million in net fund inflows, which lifted its weight by 0.66%. Both Meta and Amazon also saw significant uptake, attracting an additional 5.26% of Global investors each. Apart from Tesla, all stocks in the group experienced ownership increases over the year. In contrast, Tesla’s funds invested percentage dipped by -2.92%, driven by -$910 million in net fund outflows. The most significant movements in individual fund positions occurred in Microsoft, NVIDIA, Amazon, and Alphabet.
The charts below illustrate the long-term ownership trends for each of the Magnificent 7 stocks. Microsoft’s average holding weight began diverging from the pack in 2019 and has since soared to record highs (Chart 1). Apple has always been the dominant underweight holding, with the intensity of the underweight increasing from 2019 onwards, leading to near-record underweights today. Tesla’s reversal in ownership can be clearly seen in Chart 3, opposing strong gains made by NVIDIA.
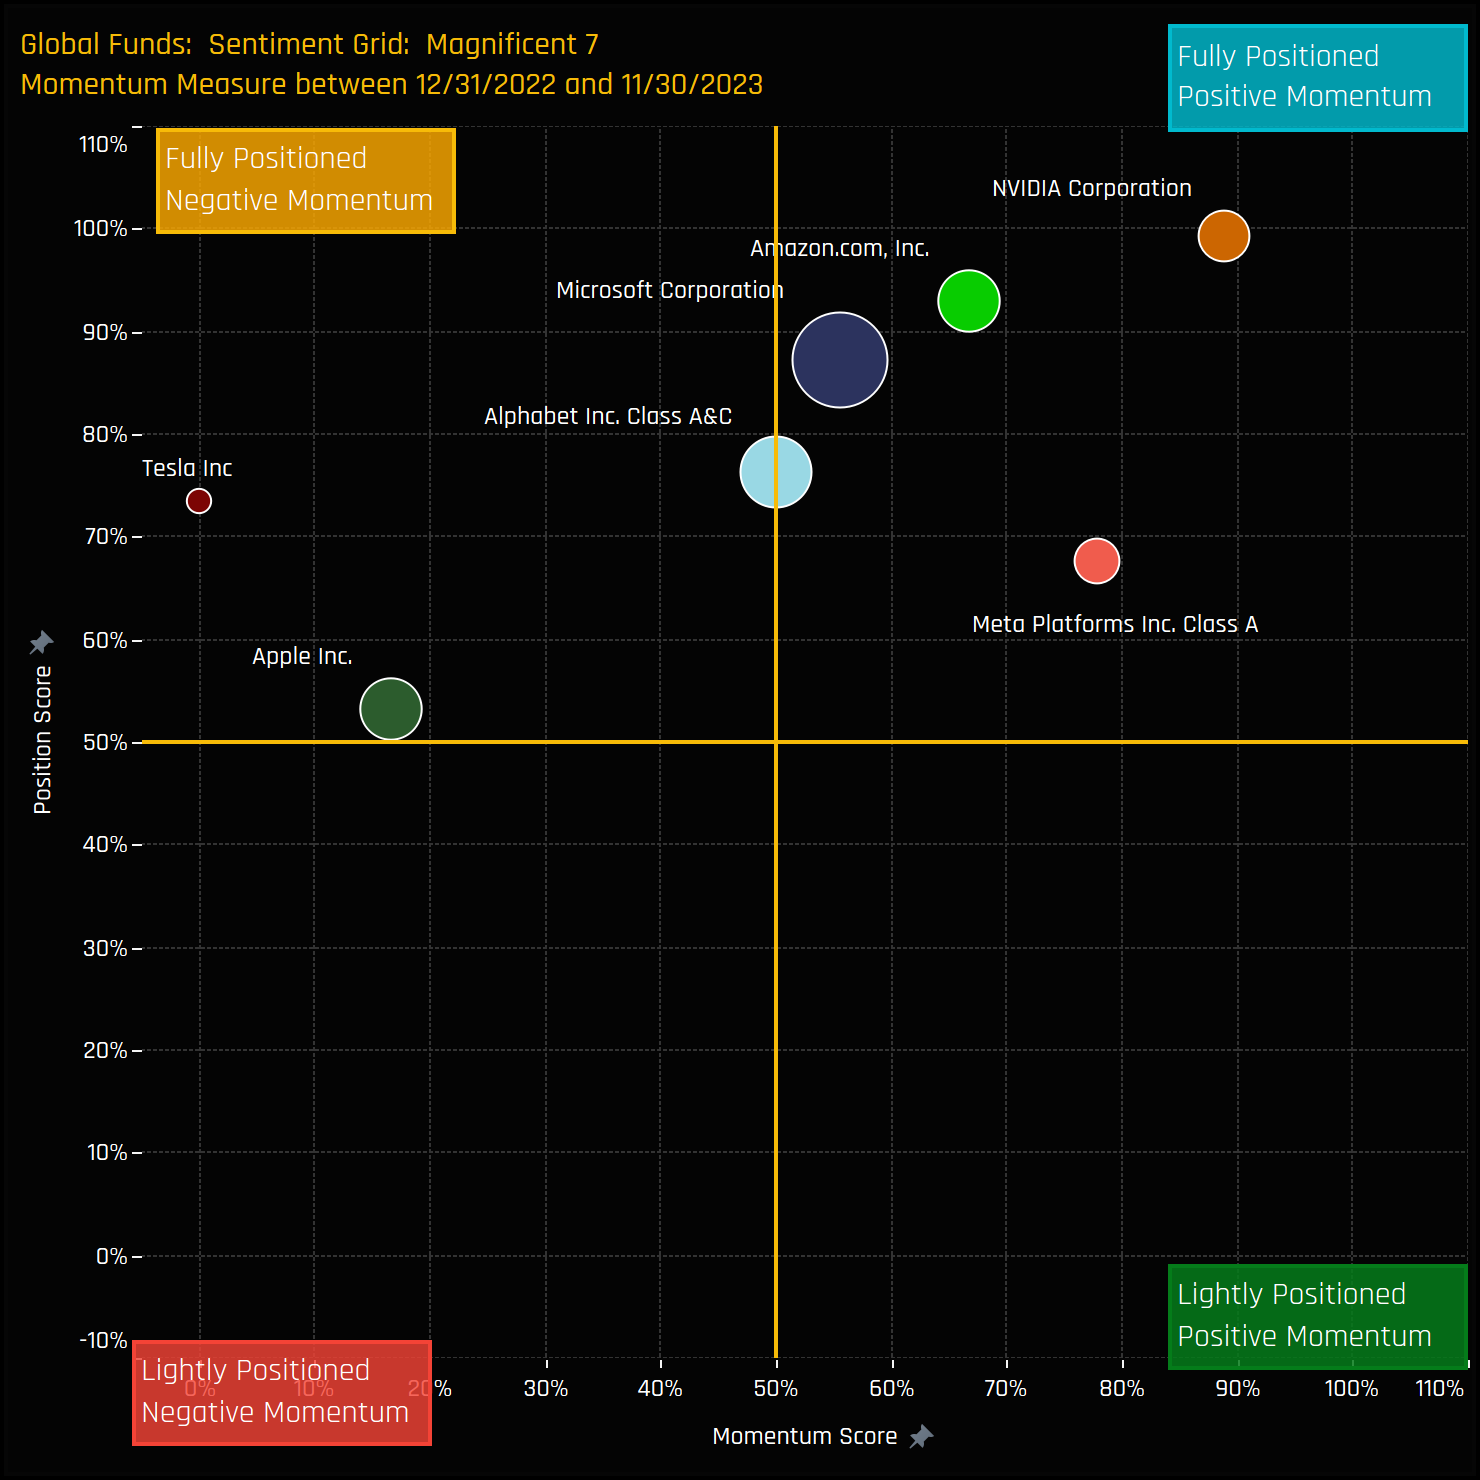
The Sentiment Grid below merges long-term positioning with recent fund manager activity into one chart. The vertical axis shows the ‘Position Score’, a measure of current positioning in each of the 7 stocks compared to its own history going back to 2011 on a scale of 0-100%. The horizontal axis shows the ‘Momentum Score’, a measure of fund manager activity for each stock between 12/31/2022 and 11/30/2023 on a scale of 0% (maximum negative activity) to 100% (maximum positive activity). The placement of all stocks in the top half of the Grid reflects their heighted exposure levels compared to historical averages. The momentum divergence indicates a clear preference for Meta and NVIDIA over Tesla and Apple this year.
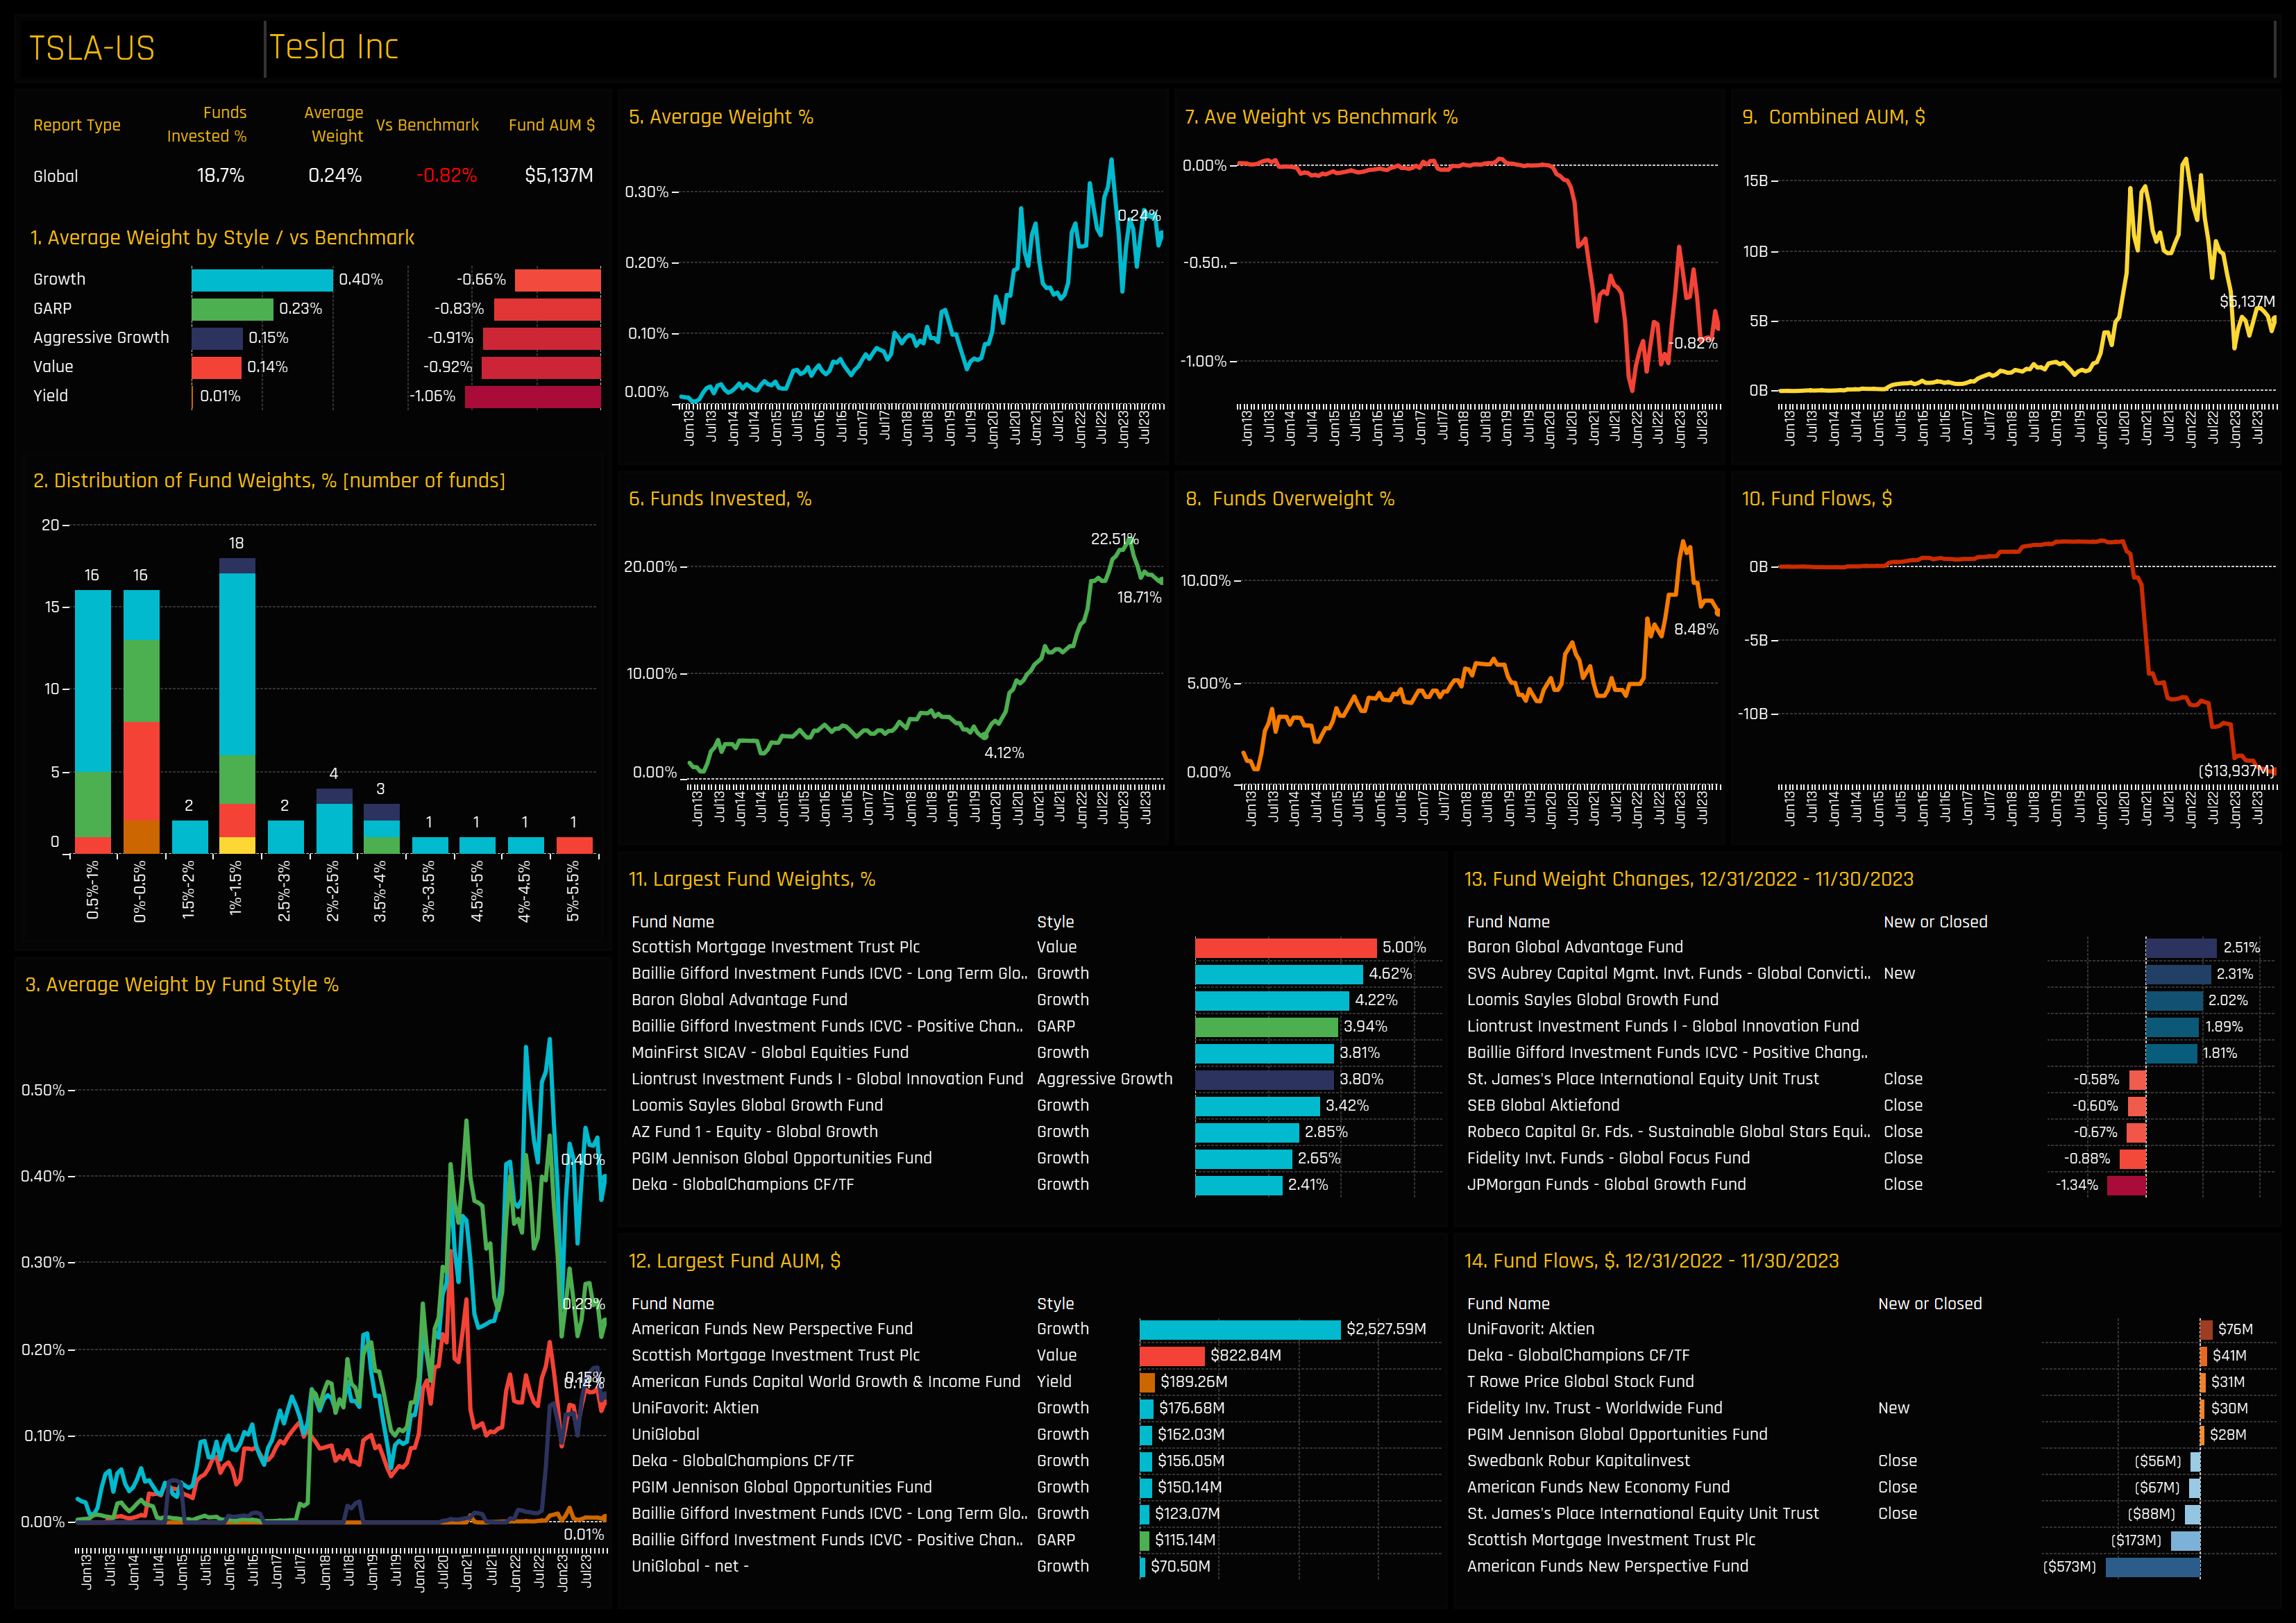
Tesla barely registered among Global funds up until it convincingly broke $20 back in 2020. The ensuing 10x price rally attracted Global investors to the stock, with the percentage of funds invested increasing from 4% to a peak of 22.5% in February of this year, as shown in chart 6. Since then, ownership metrics have declined, with notable outflows from American Funds and Scottish Mortgage, and exits from St James’s Place and Swedbank Robur (Chart 14). Remaining investors are modestly positioned, with the majority of holders below the 1.5% level (chart 2). Early holders Baillie Gifford, Baron Global and Mainfirst top a list of 7 funds with a 3%+ allocation. Profiles of all 7 stocks can be found in the PDF link at the end of this report.
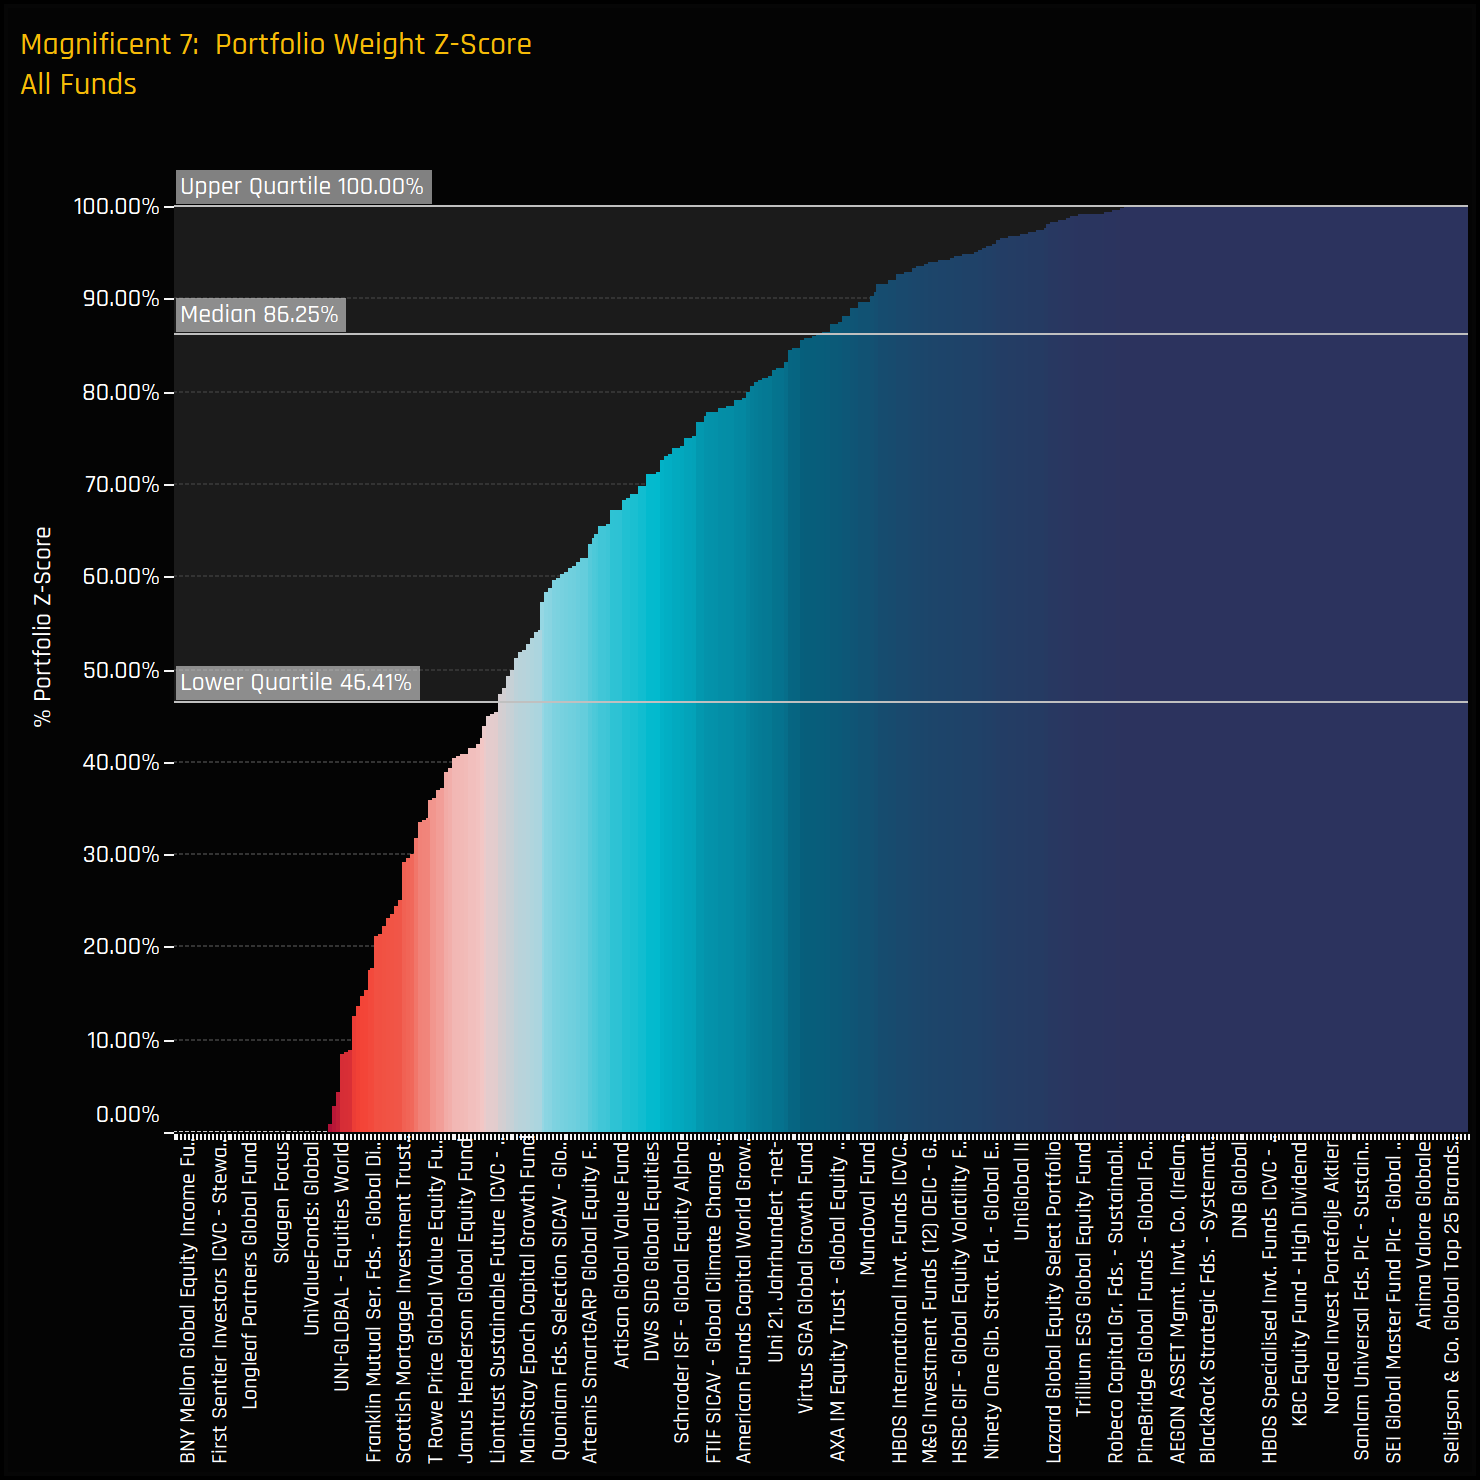
The adjacent chart displays the Z-score of current fund weights in the Magnificent 7 compared to historical data for all current and past holders. Here, a 100% Z-score signifies the highest recorded weight for a fund, while zero represents the lowest. The median Z-score of 86% and a lower quartile at 46.4% underscore the extent to which global managers are heavily positioned in these stocks relative to historical levels.
Collectively, the Magnificent 7 now constitute a significant portion of global fund allocations, effectively ranking as the second-largest country allocation and contributing substantially to the increasing underweight in the USA. Valuations clearly pose a challenge, particularly for funds at the Value end of the spectrum, so sustained growth will be needed to meet the expectations of the more heavily invested Growth-oriented funds in our analysis.
However, as our analysis shows, grouping these stocks together doesn’t fully capture the nuances of their individual ownership profiles. Microsoft’s dominance is clear, NVIDIA has attracted a new wave of investors this year, whilst Tesla has struggled to gain the same level of trust from active Global investors. This diversity in ownership and sentiment highlights the importance of considering each stock on its own merits, rather than as one homogeneous group.
Please click the link below for an extended data report on the Magnificent 7.
Happy Christmas Everyone!
For more analysis, data or information on active investor positioning in your market, please get in touch with me on steven.holden@copleyfundresearch.com
China allocations have recovered from the lows, but momentum has stalled—masking active shift ..
339 global equity funds, AUM $1.1tr Semiconductors: Winners Emerge as Allocations Hit Record Hi ..
336 Global Equity Funds, AUM $1.1tr Active Global Funds: Positioning Analysis, June 2025 Europe ..
Investor Positioning Report — Copley Fund Research Ltd · Last updated: July 2026 · Registered in England and Wales
Copley Fund Research Ltd provides proprietary institutional fund intelligence to listed companies and investor relations professionals. These terms govern every purchase of an Investor Positioning Report. By completing a purchase you confirm you have read, understood, and agreed to these terms in full.
The Investor Positioning Report is a bespoke PDF report mapping the institutional fund universe around your stock. It covers current investors, past investors, competitor investors, and white space investors. Every report is built from scratch for the specific company ordered and is not a standardised or templated product.
Following payment or invoice issuance, Copley Fund Research will contact you within one working day to agree your competitor set. Production begins once the competitor set is confirmed in writing. The completed report will be released to you within 48 hours of production starting, provided payment has been received in full; where payment is outstanding, the report will be withheld until payment clears. If the requested company falls outside our covered fund universes, or a competitor set cannot be agreed, Copley Fund Research will issue a full refund or cancel the outstanding invoice.
The competitor set is agreed with you in writing prior to production, and the report is built to that agreed specification. Requests to amend the competitor set after delivery, based on a change of preference rather than an error, may be treated as a new order.
Because each report is produced individually for your company, orders are non-refundable once production has begun, except as set out in clauses 3 and 5a below. By purchasing, you agree not to dispute the charge with your card provider on the basis that the service was not as described, provided the report has been delivered to the agreed specification or corrected under clause 5a.
If a delivered report contains a material error caused by Copley Fund Research — for example, an incorrect company analysed, a competitor omitted from the agreed set, or content missing from the specification in clause 2 — Copley Fund Research will correct and redeliver the report at no additional charge, within a reasonable timeframe. This is your sole remedy for such errors.
All fund positioning data in the report reflects holdings as disclosed at the most recently available reporting date at the time of compilation. The timing of fund holdings disclosures is determined by regulatory requirements applicable to each fund and is outside the control of Copley Fund Research Ltd. This data may not reflect current fund positions. Copley Fund Research takes reasonable care to ensure accuracy but makes no warranty, express or implied, as to the completeness or current accuracy of the underlying data — though this does not affect the quality remedy in clause 5a for errors in how that data was analysed or presented. Past fund positioning is not indicative of future fund behaviour or investment decisions.
The Investor Positioning Report is produced for investor relations intelligence purposes only. It does not constitute investment advice, financial advice, or a recommendation to buy, hold, or sell any security. The data reflects historical fund positioning and must not be relied upon as a prediction of future fund behaviour or investment decisions. Copley Fund Research Ltd is not authorised or regulated by the Financial Conduct Authority for the provision of investment advice.
The report is licensed for internal use by the purchasing organisation only. You may share it with employees and directors of your organisation. You may not: reproduce, redistribute, publish, or resell the report or any part of it; share it with any third party outside your organisation without prior written consent; use the fund or portfolio manager names contained in the report to approach those individuals on behalf of Copley Fund Research or in a manner that could damage Copley Fund Research's relationships with those funds; or use the data for any purpose other than your own investor relations strategy. The data, analysis, and methodology contained in the report are the intellectual property of Copley

