Early moves by Global investors hints at flight to safety well before SVB's eventual collapse.
Time-Series and US Bank Activity
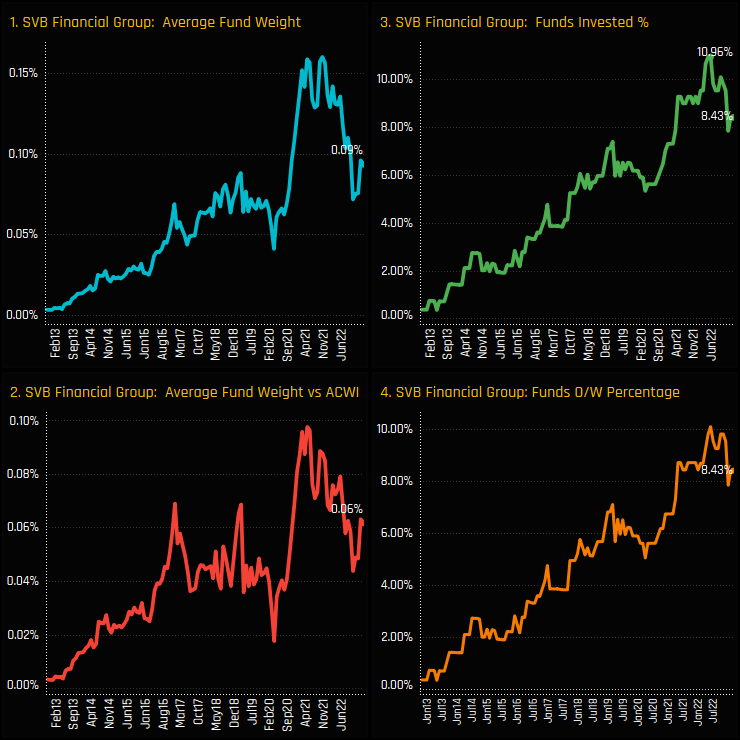
SVB Financial had enjoyed consistent ownership growth among active Global funds over the last decade. Moving from a relative unknown in 2013, fund ownership peaked with 11% of managers holding a position in May 2022. Since that peak, and well before any signs of trouble at the bank, active Global managers started to cut positions. The charts below highlight this ownership reversal, with average weights aggressively falling (ch1), driven by a drop in the percentage of funds with exposure (ch3).
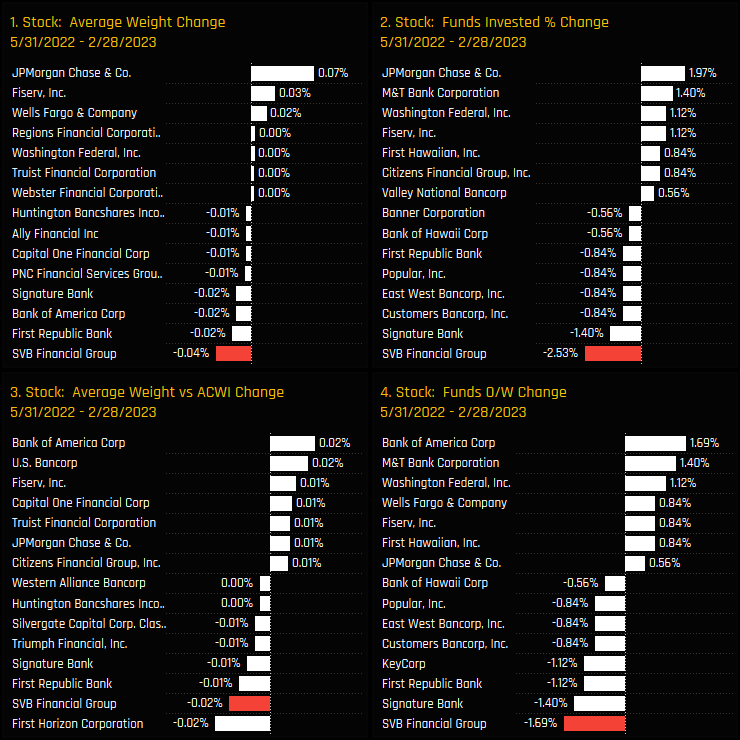
In fact, the declines in SVB Financial Corp ownership were the largest among US Banking peers, as the below charts show. The drop in average weights (ch1) and the percentage of funds invested (ch2) highlight a distinct reversal in sentiment, with Global managers instead raising allocations in the large cap Banks of JP Morgan, Wells Fargo and Bank of America. It seems the flight to safety was on well before SVB’s eventual collapse.
Fund Activity & US Banks Latest Positioning
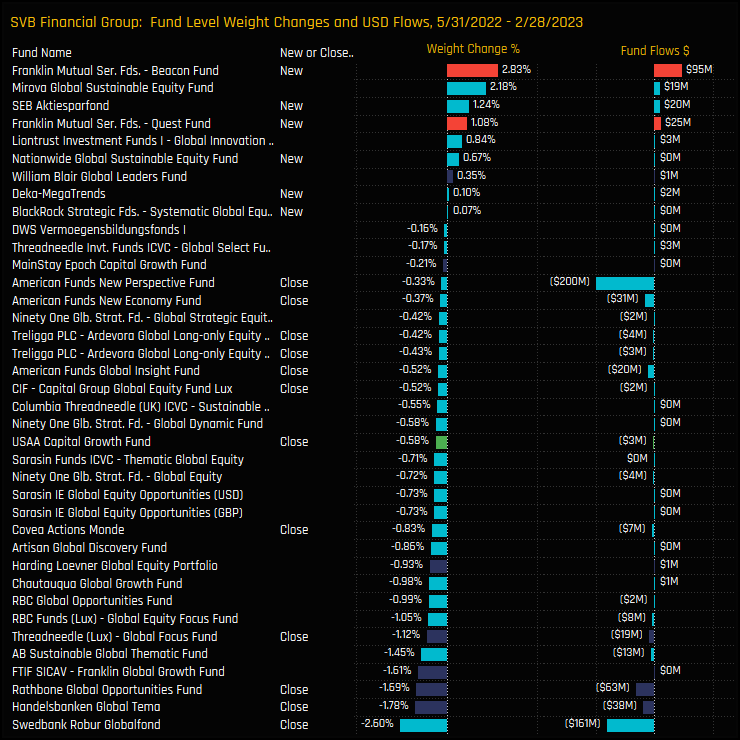
The decline in exposure was driven by Aggressive Growth and Growth funds, led by closures from Swedbank Robur Globalfond (-2.6%) and Handelsbanken Global Tema (-1.78%). Whilst closures outnumbered openings over the period by a factor of 2, new positions in SVB were opened, with Franklin Mutual Beacon Fund (+2.8%) and SEB Aktiesparfond (1.24%) among the larger openings.
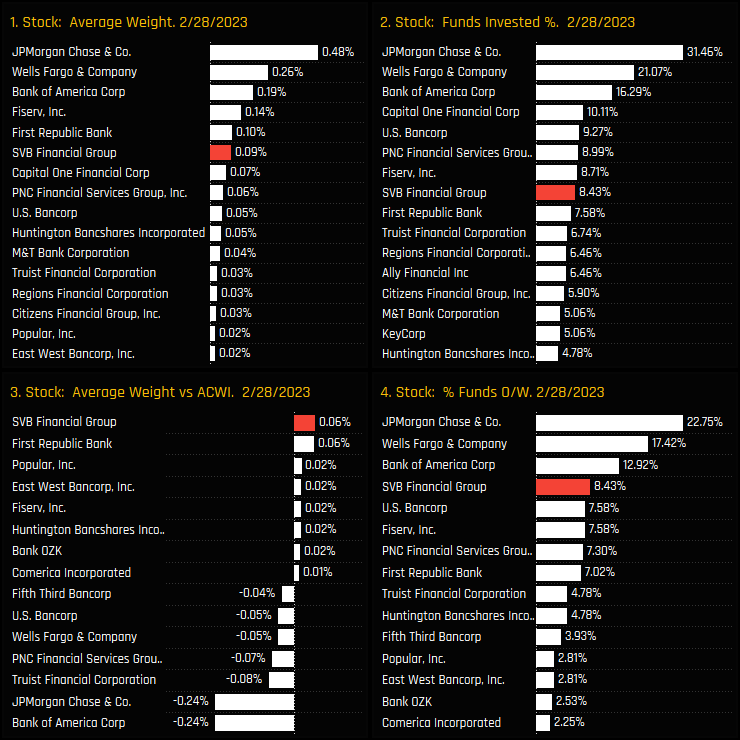
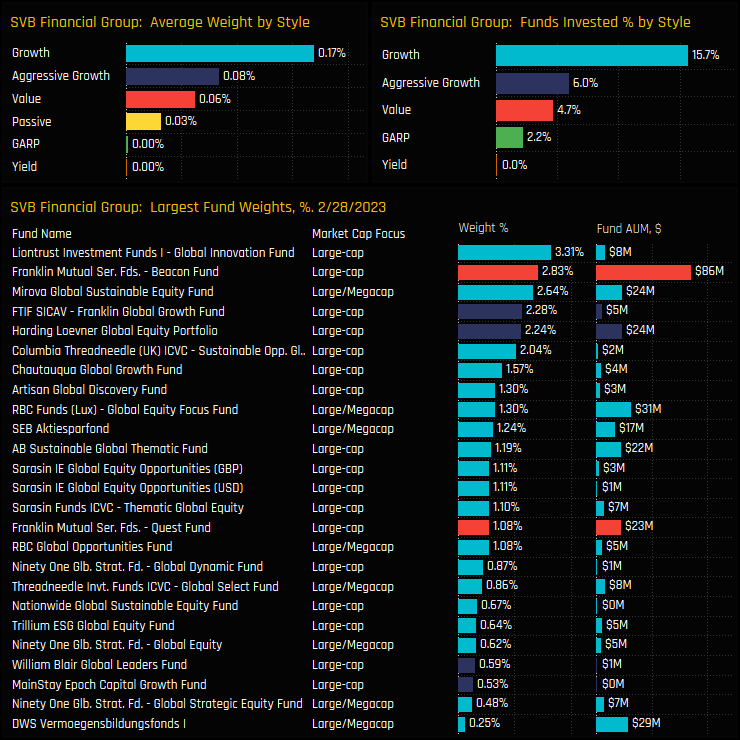
As of the end of February 2023, SVB Financial Corp was the 8th mostly widely held US Bank and the 6th largest average weight among Global investors. And despite the recent negative activity, it remained the top overweight position on average, albeit at a fraction (+0.06%) above benchmark (ch3). However, with just 8.4% of funds holding a position, SVB’s collapse does not represent a significant risk to the vast majority of the 356 Global funds in our analysis.
Conclusion and Data Report
Those potentially most at risk are listed in the chart opposite, which shows the largest holders as at the end of February 2023. It should be noted that with delays in fund reporting, these funds could have closed out before the main share price collapse last week.
It’s also worth considering that given the decline in SVB Financial Corp ownership in recent months, should such a move have created a red flag for investors? Are moves like this precursors to a bigger event? Obviously, not in all cases. There are 49 companies that experienced similar or worse declines in fund ownership over the period 05/31/2022 – 02/28/2023, and only 1 is in crisis. But we would say that any big move in ownership represents something of a signal, that active managers have assessed the investment case and have decided to cut exposure i.e something has changed. This doesn’t mean the company is about to go bankrupt, but it does mean that the investment case has taken a turn for the worse, relative to other companies.
We would group stocks seeing large negative moves together with stocks that are lightly owned compared to their benchmark weight, such as with the Adani Group of companies in Asia. At the very least, managers should reasses the investment case in all stocks with these attributes, in my view. After all, our research simply groups together the investment convictions of hundreds of experienced active managers – we’d like to think there was some alpha in that information.
Please click the link below for an extended data report on SVB Financial Corp.
Scroll down for 2 dashboard that screen for stocks in ownership decline, and stocks that are unloved by active Global investors.
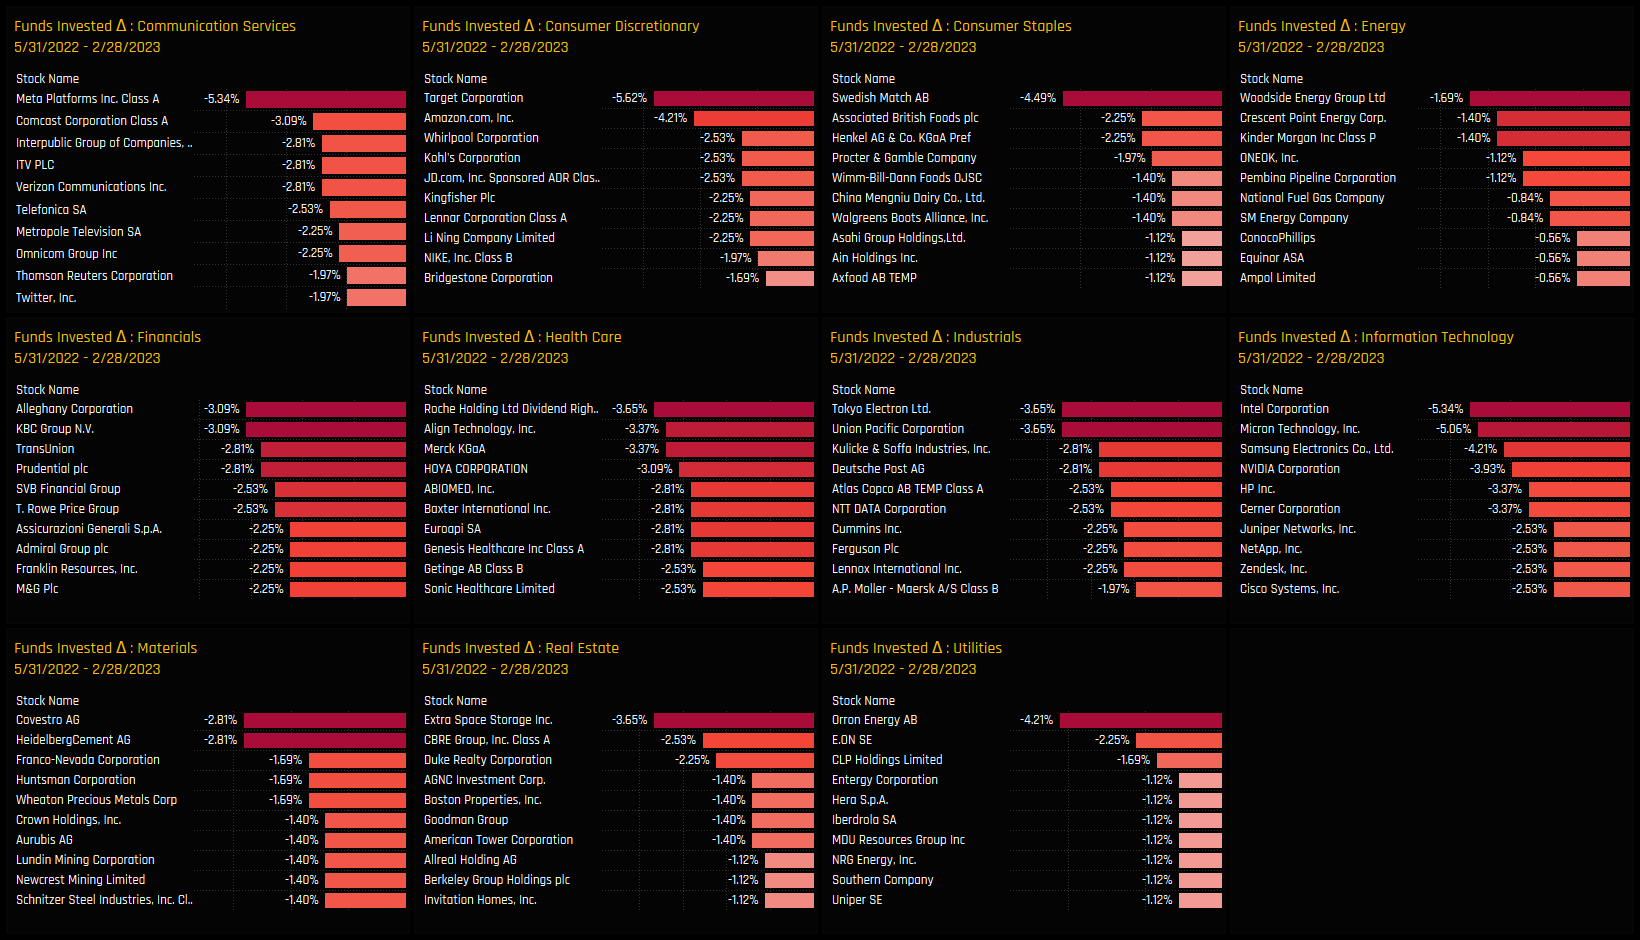
Global stocks seeing the largest declines in ownership, split by sector. Each stock is ranked based on the percentage of funds who owned it on 02/28/2023 minus the percentage who owned it on 07/31/2022.
Global Unloved Stocks
Stocks that are in the SPDRs ACWI ETF that are owned by less than 5% of the Global funds in our analysis, split by sector.
356 Global Equity Funds, AUM $938bn
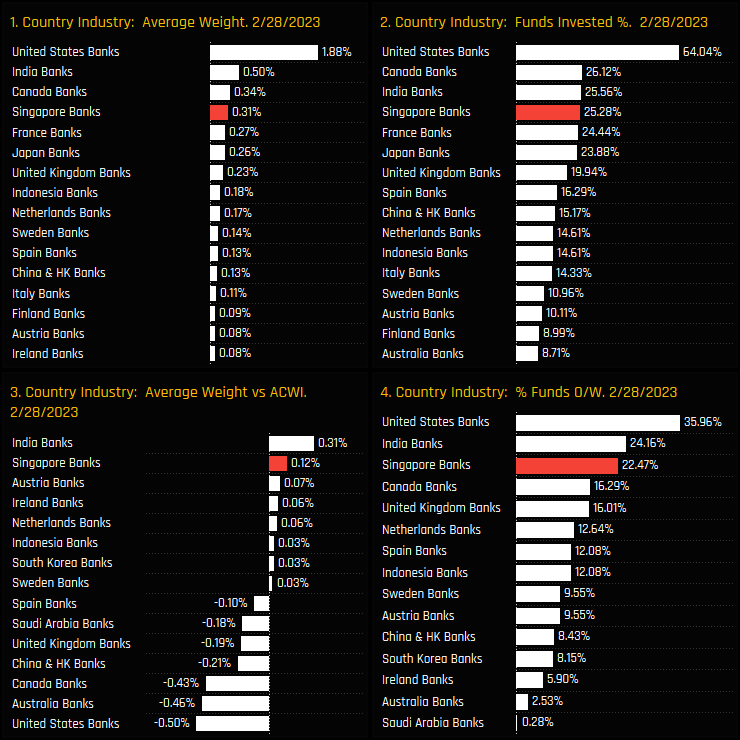
Singapore Banks: Breaking Out
Global Managers move to their highest ever ownership levels in Singapore Banks
Time-Series & Global Bank Rotation
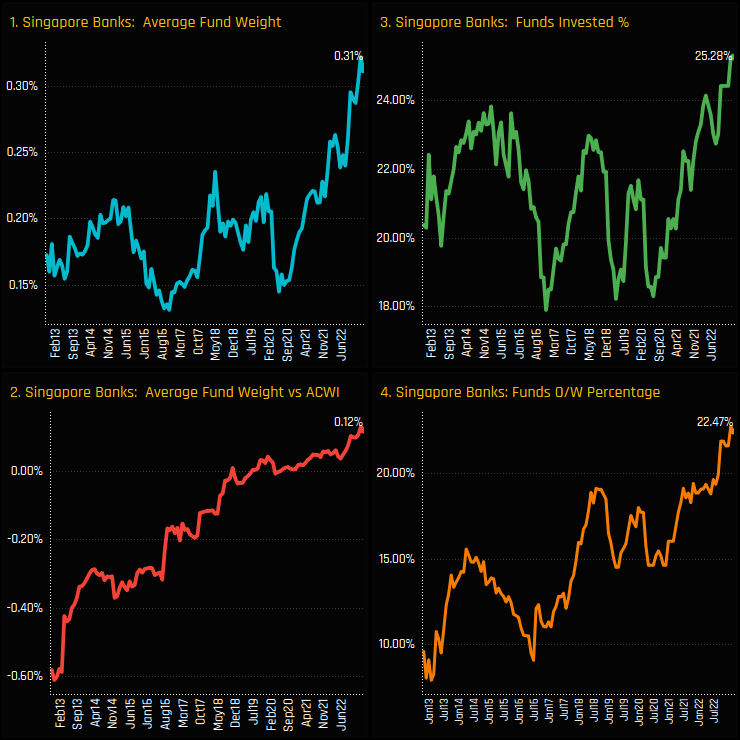
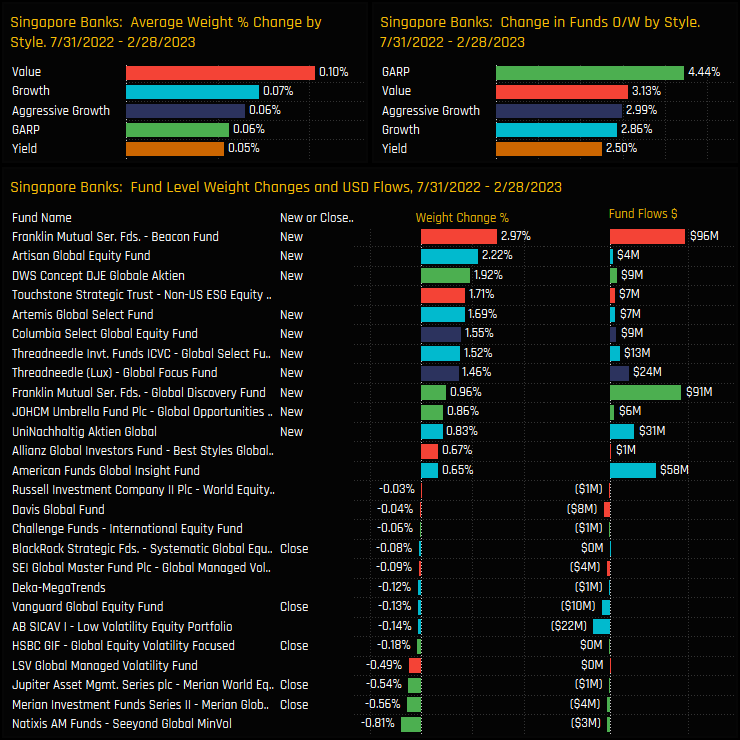
Global equity funds are increasing their exposure to Singapore Banks. A record 25.3% of the 356 Global strategies in our analysis now have exposure, breaking out of a range of between 18% and 24% over the last decade. This additional buying has pushed average weights to near record highs of 0.31% and overweights to a record +0.12% above the SPDRs ACWI ETF weight.
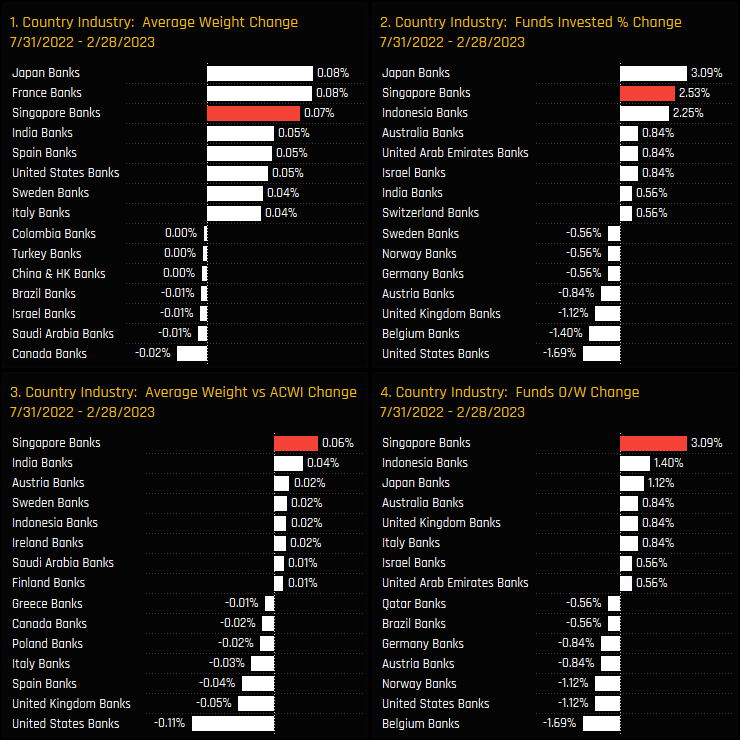
Since the breakout in ownership from July of last year, Singapore Banks have faired well versus Global Bank peers. The below charts show the change in our ownership metrics between 07/31/2022 and 02/28/2023, and highlight Singapore Banks as a key beneficiary of rotation, alongside Indonesian and Japanese Banks. Global Funds scaled back exposure to US, UK and Belgium Banks.
Fund Positioning & Activity
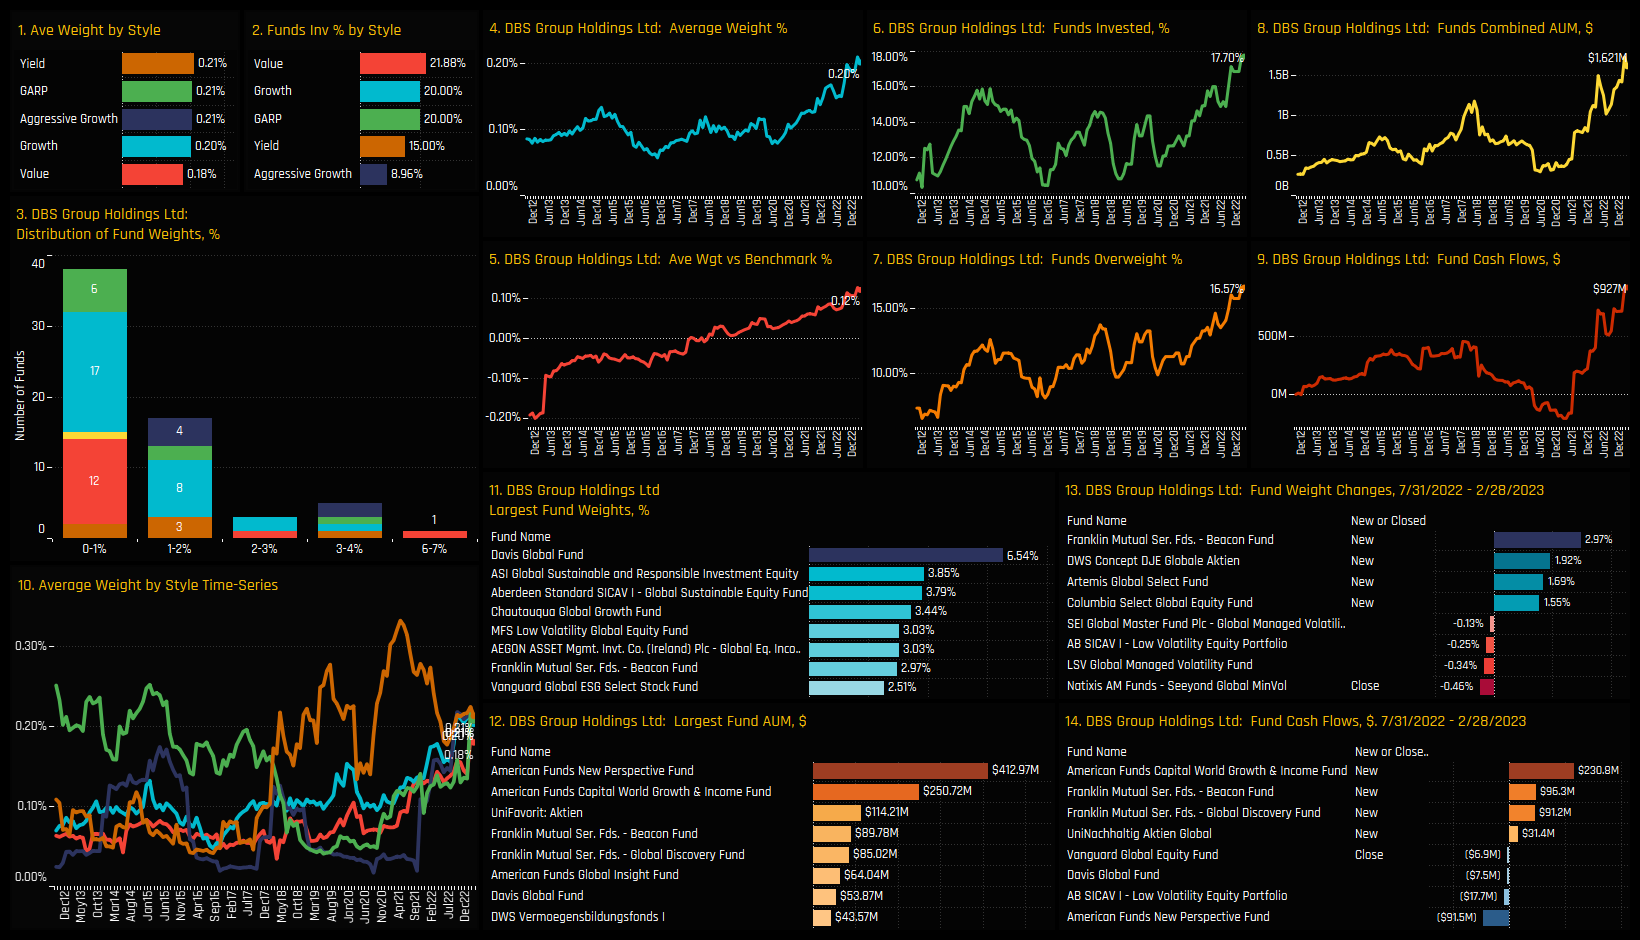
These increases in exposure were unpinned by new positions from funds across the Style groups. GARP and Value investors led the way, but all Style groups saw an increase in average weights and overweight positioning. Franklin Mutual Beacon (+2.97%) and Artisan Global Equity (+2.22%) were the largest opening positions, whilst Merian Global (-0.56%) and Merian World (-0.54%) led the closures.
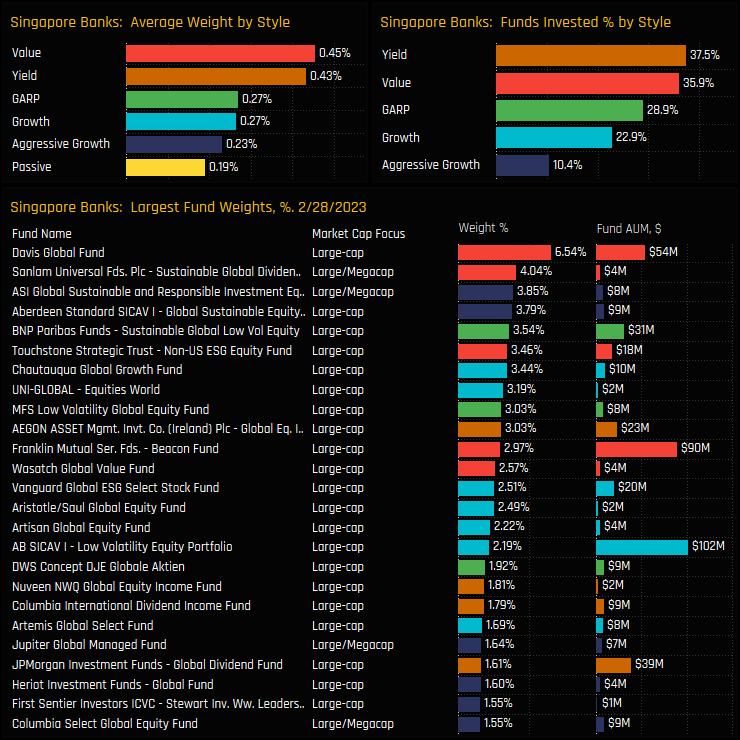
As it stands, the current investor base is skewed towards the Value/Yield end of the spectrum, with 35.9% and 37.5% of each Style group invested, respectively. Most funds hold less than a 3% stake in the sector, though 10 strategies hold more, led by Davis Global on 6.54%.
Stock Positioning & Activity
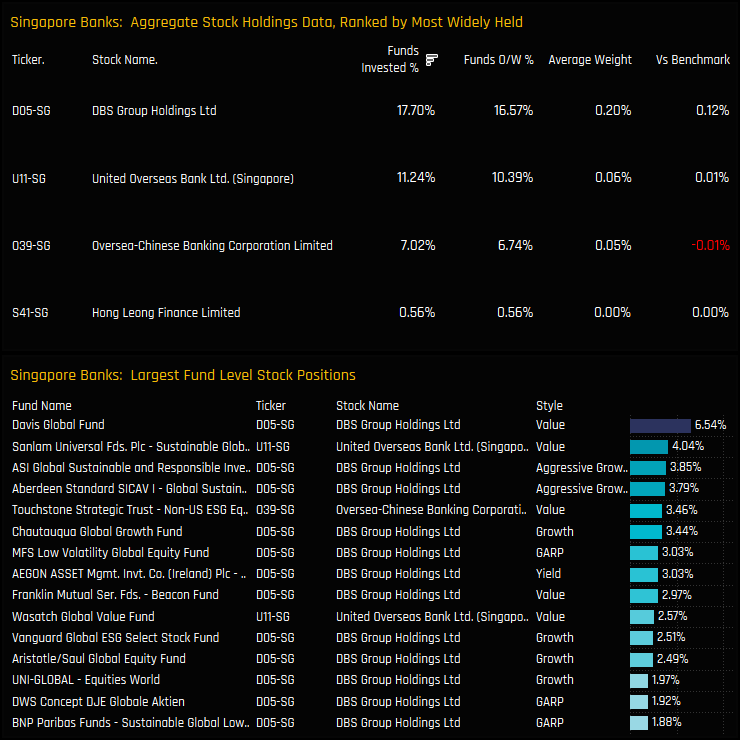
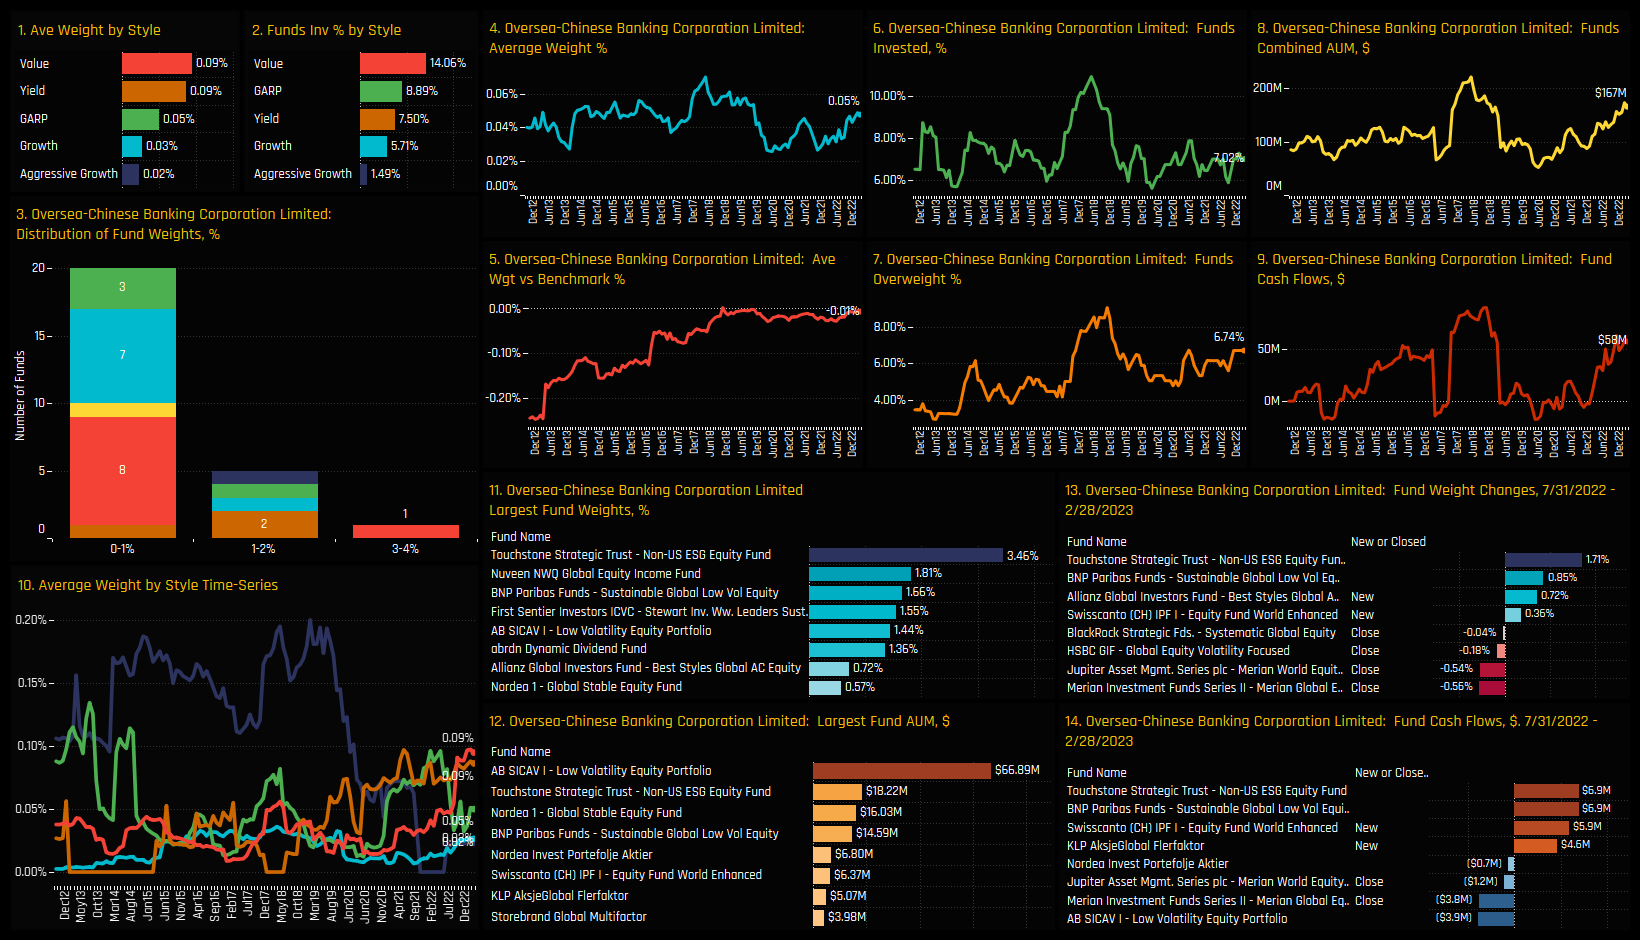
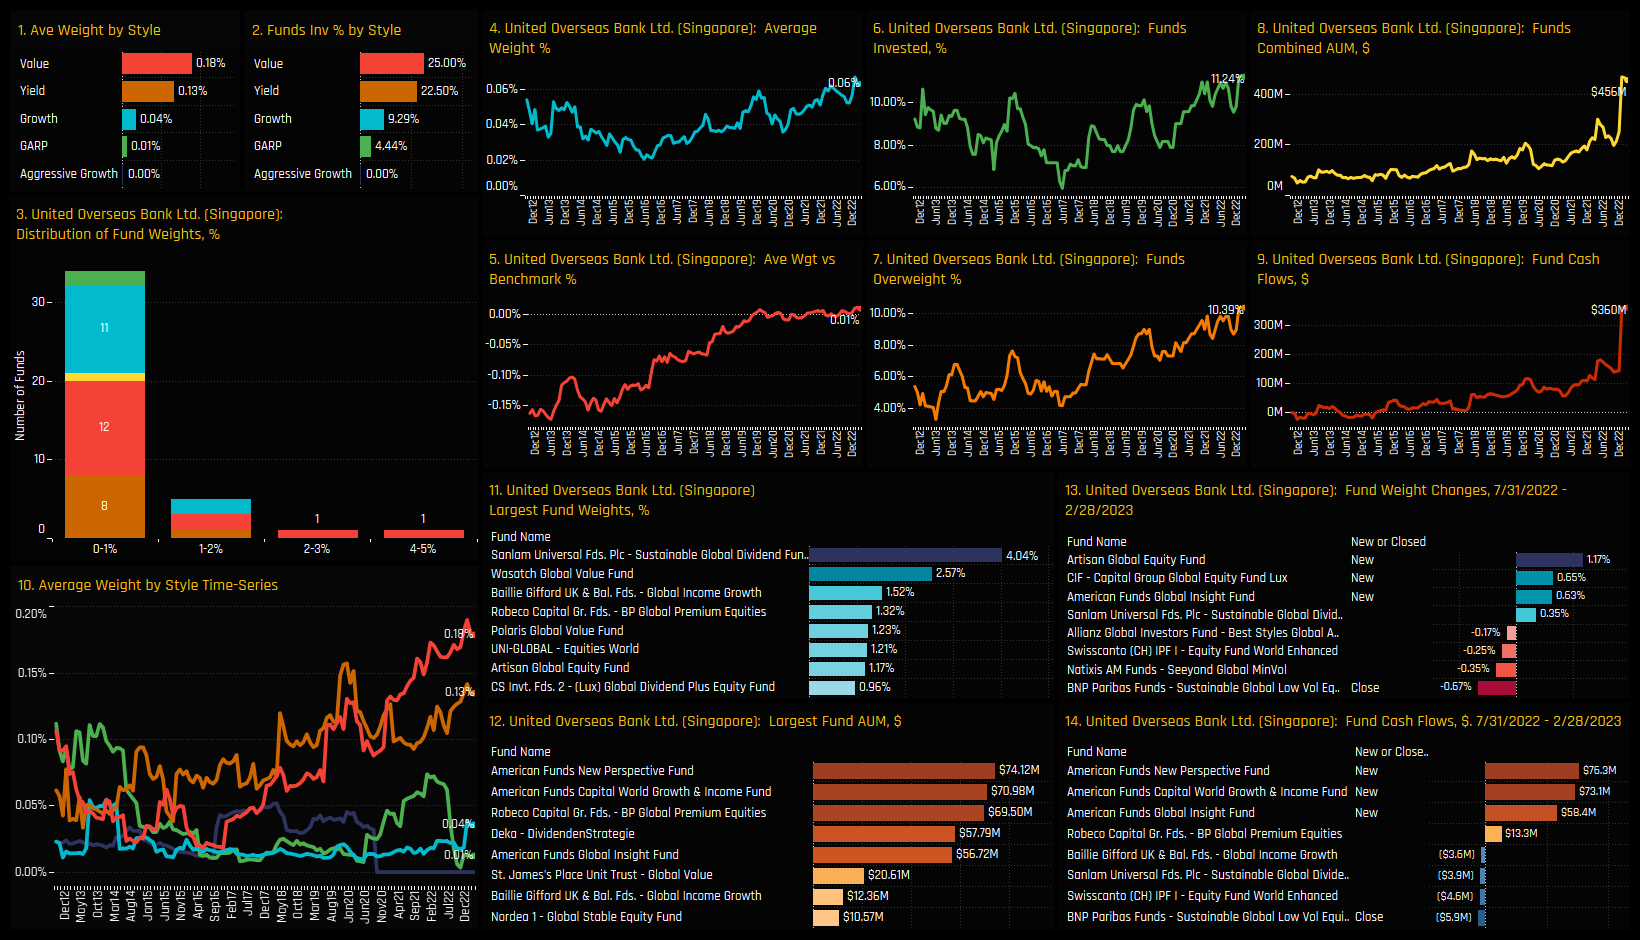
Of the 4 available Singapore Banks to choose from, DBS Group Holdings is the clear favourite, owned by 17.7% of investors compared to 11.2% in United Overseas Bank and 7% in Oversea-Chinese Banking Corp. DBS Group also dominates the list of high conviction positions in the bottom chart, led by Davis Global and strategies from Aberdeen, MFS and Aegon to name but a few.
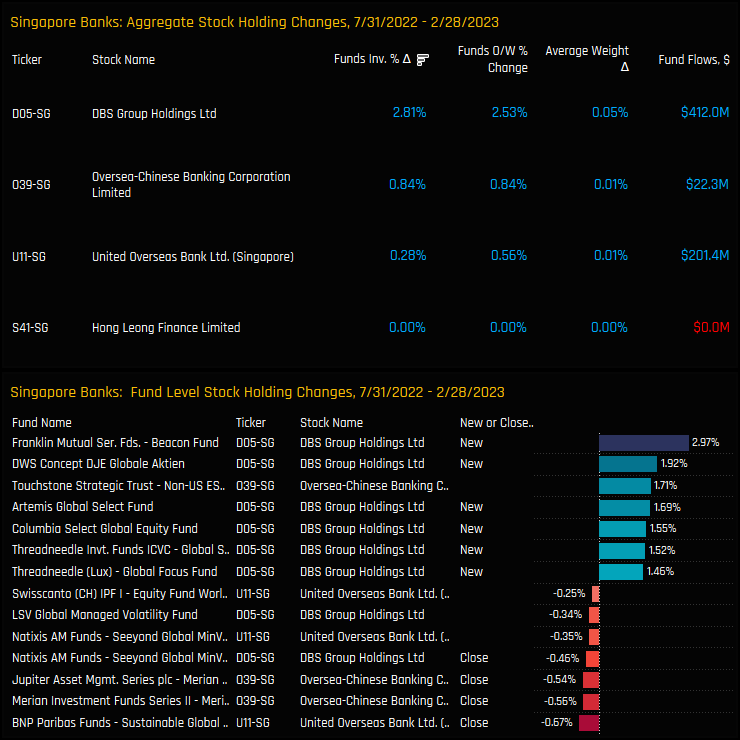
Aggregate stock activity between 07/31/2022 and 02/28/2023 also favours DBS Group, which attracted a further 2.8% of funds to its investor base, though OCBC and UOB also saw ownership levels increase. On a fund level, DBS Group holdings was prevalent among the larger opening positions, whilst UOB and OCBC feature among the larger closings.
Conclusions & Data Report
The chart opposite shows the Global Banks ownership breakdown by Country. US Banks are the most widely held and largest average weight among active Global investors by a margin. But after the recent Banks rotation, Singapore Banks now find themselves in 4th place, behind Indian and Canadian Banks but ahead of fellow European and Asian peers.
The trend of Singaporean Banks taking market share from the incumbent is mirrored in our Asia Ex-Japan fund research, but this time Singapore Banks are stealing allocations from China & HK Banks. If these moves were in some way driven by a ‘flight to quality’, then Singapore Banks look well placed to capture further market share from both the US and China in the months to come.
Please click on the links below for a data pack on Singapore Banks positioning among active Global equity funds and for the Global Banking industry group as a whole. Scroll below for individual profiles on DBS Group, OCBC and UOB.
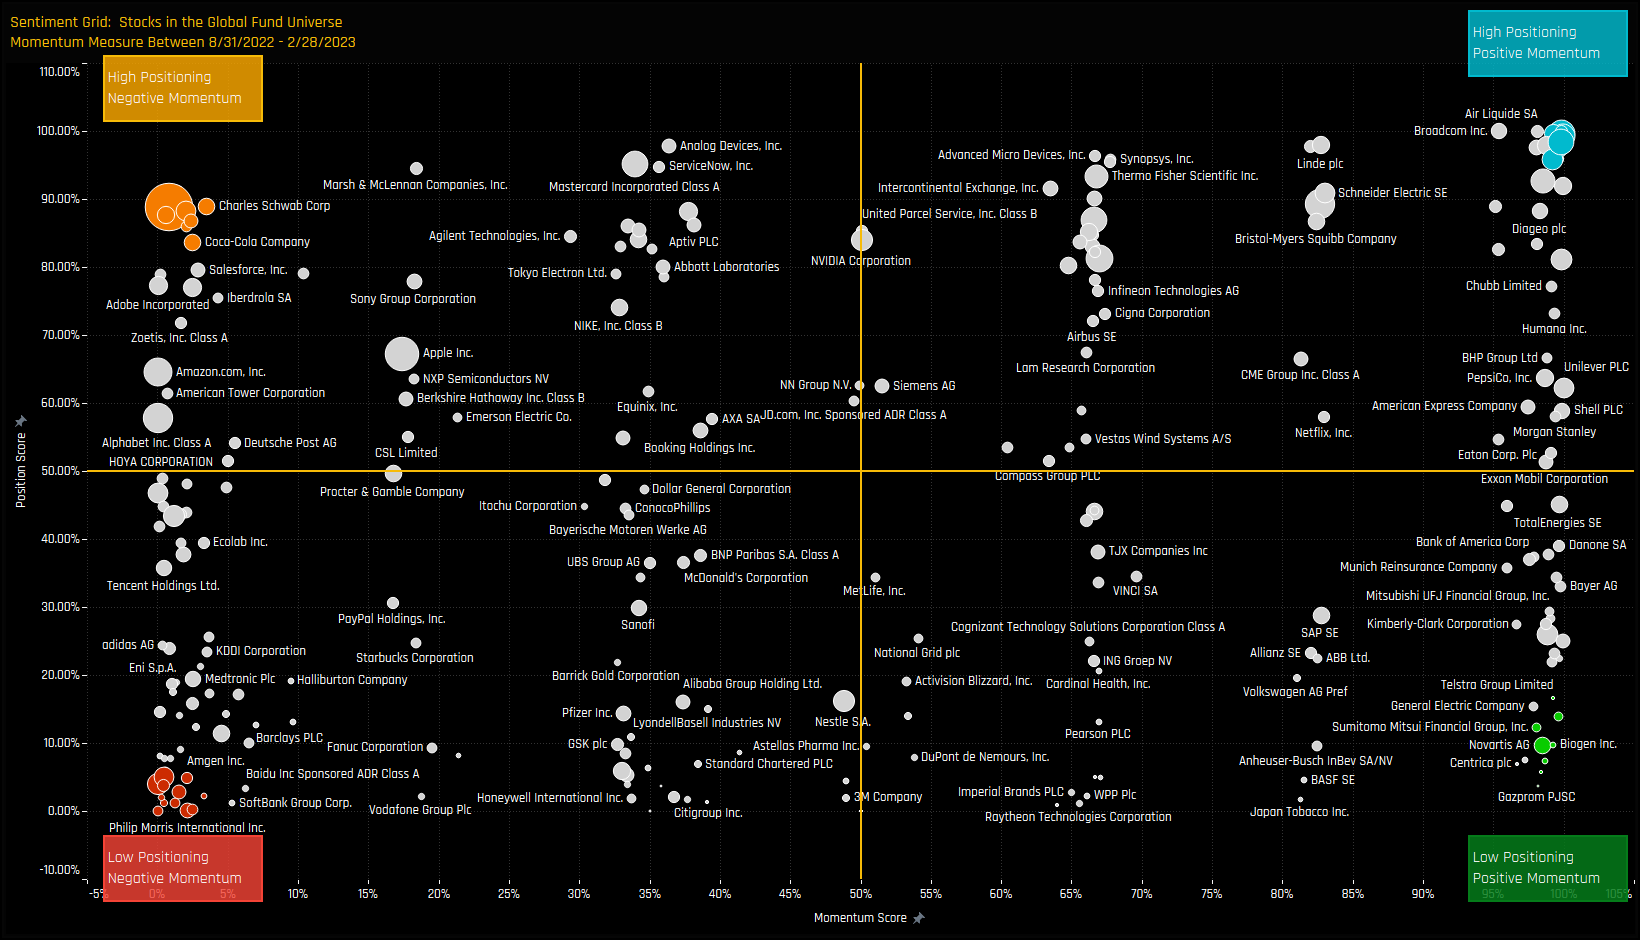
Investment levels among the thousands of stocks in the investible Global universe differ greatly. Some stocks are widely owned, others largely avoided with ownership levels changing every month. We combine current and historical positioning against shorter-term manager activity to get a handle on where sentiment lies for every stock in our Global analysis. We highlight 8 stocks at the extreme ends of their own positioning ranges whilst also seeing significant changes in fund ownership.
The Sentiment Grid
The Sentiment Grid below is designed to visualize the interplay between current fund positioning, long-term fund positioning and shorter-term fund manager activity for all stocks in the Global active fund universe. The Y-axis shows the ‘Position Score’, a measure of current positioning in each stock compared to its own history going back to 2012 on a scale of 0-100%. It takes in to account the percentage of funds invested in each stock versus history, the average fund weight versus history and the percentage of funds overweight the benchmark versus history. The higher the number, the more heavily a stock is owned by active Global managers compared to its own history.
The X-Axis shows the ‘Momentum Score’, a measure of fund manager activity for each stock between 08/31/2022 and 02/28/2023 on a scale of 0% (maximum negative activity) to 100% (maximum positive activity). The Momentum Score takes in to account the change in the percentage of funds invested in each stock over the period, the change in average weight and the change in the percentage of funds overweight. The chart also highlights the companies at the extreme ends of each quadrant by colour, which will shall explore in more detail below.
Extreme Stocks
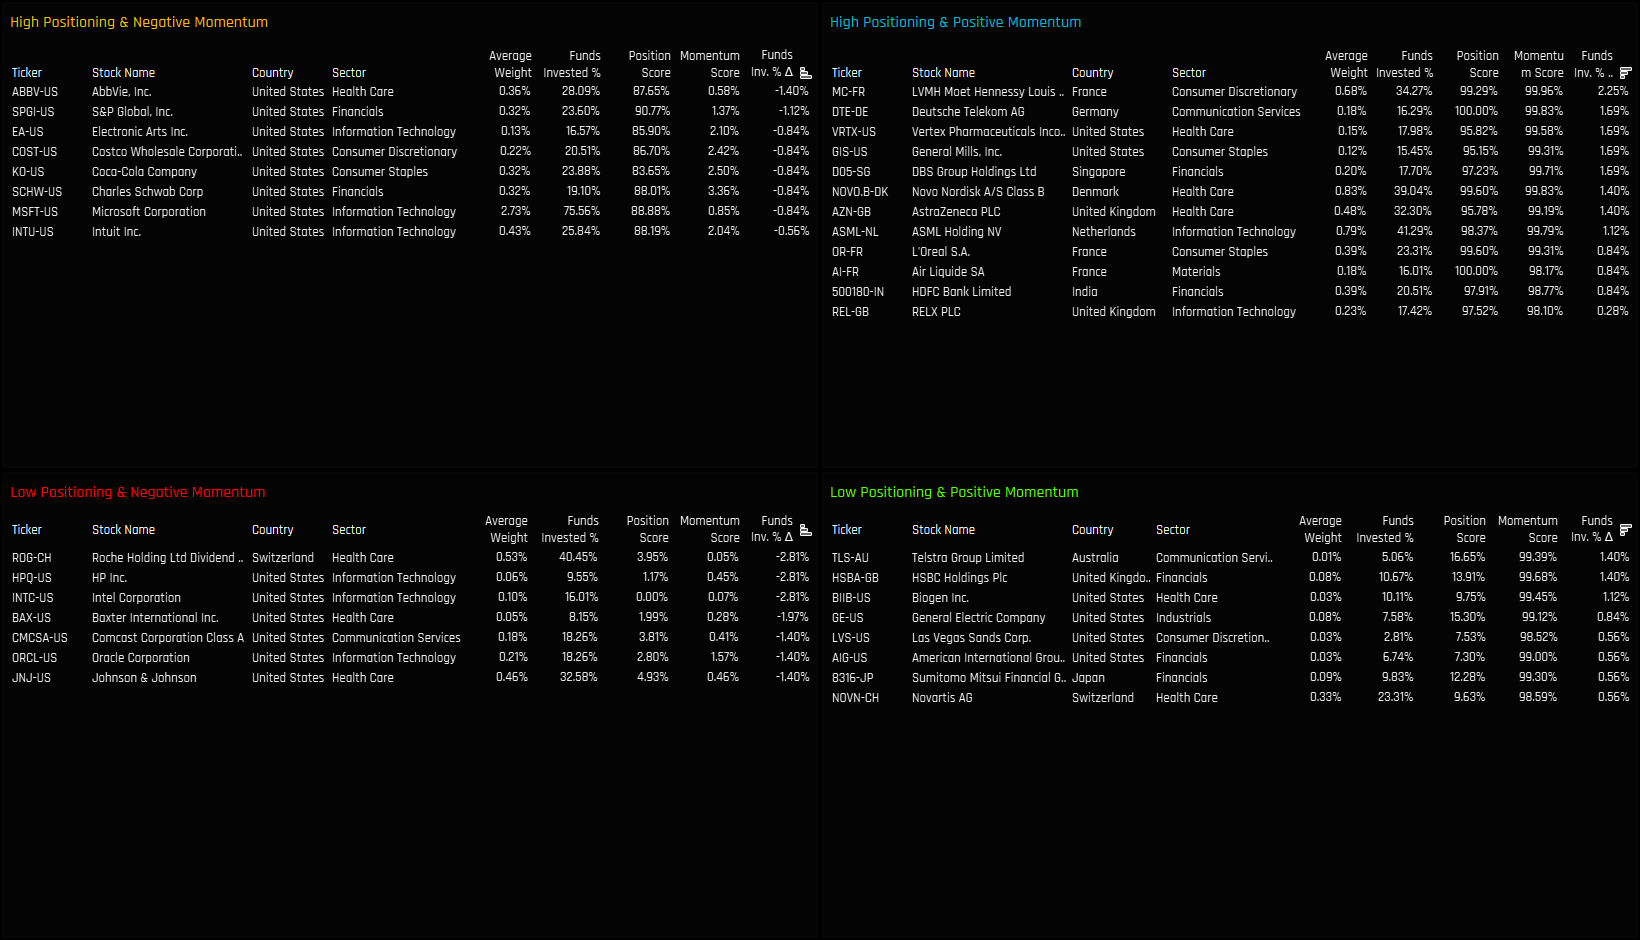
The tables below list the stocks in the extreme corners of each quadrant. The screening methodology is as follows:
High Positioning & Negative Momentum: Position Score > 80%. Momentum Score < 5%
High Positioning & Positive Momentum: Position Score > 95%. Momentum Score > 99%
Extreme Stocks
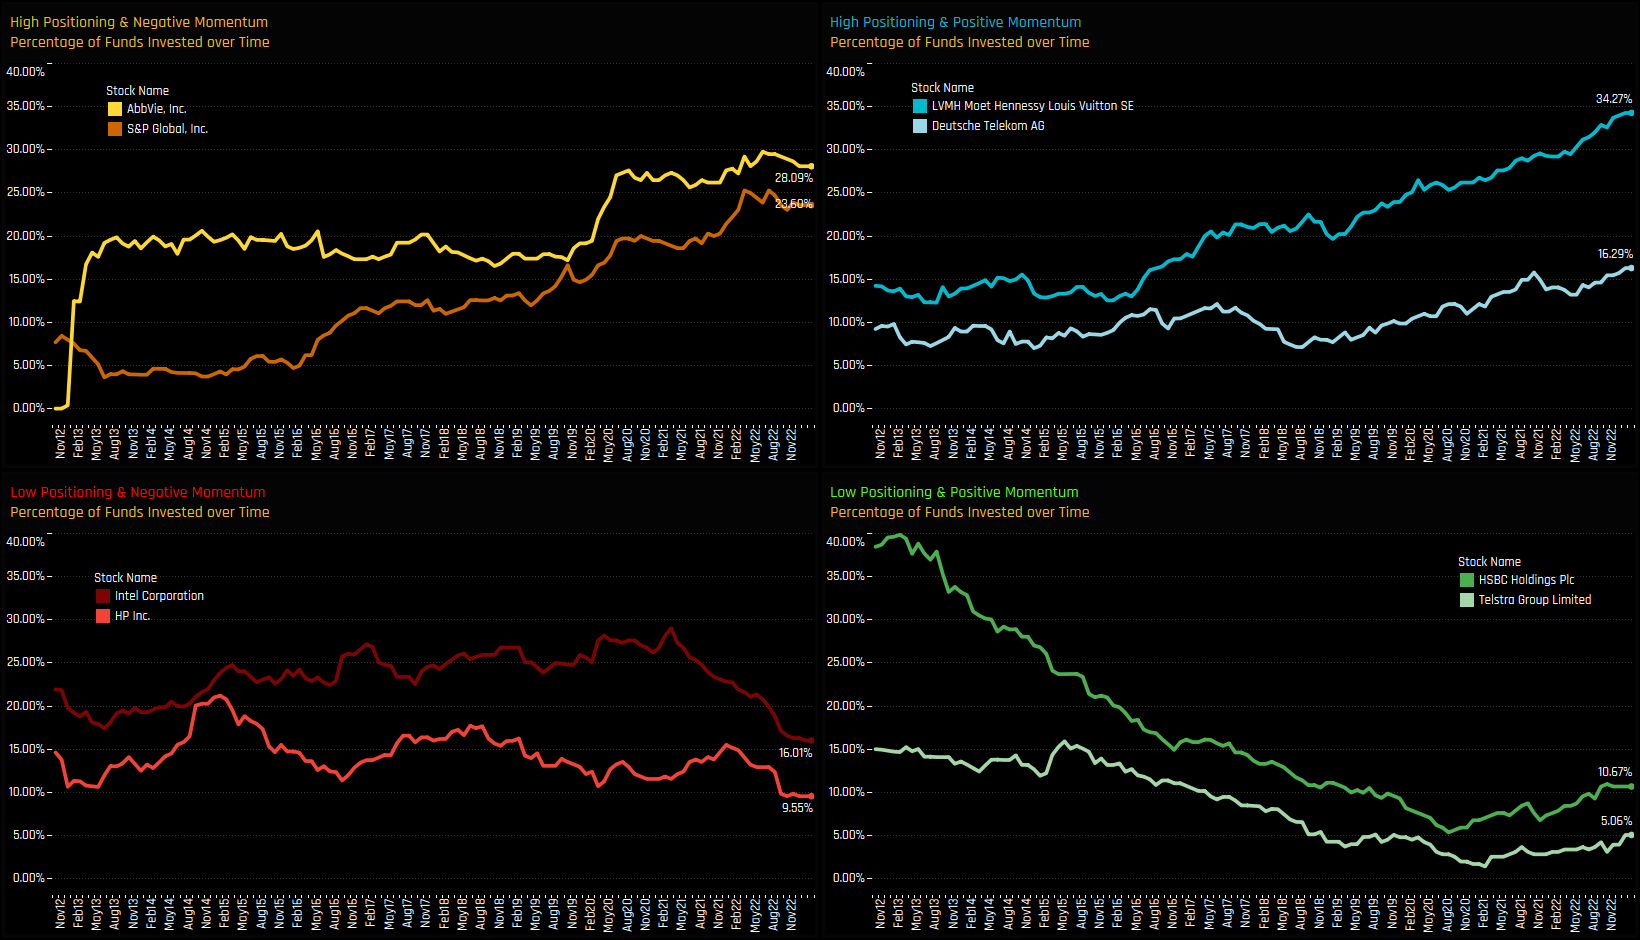
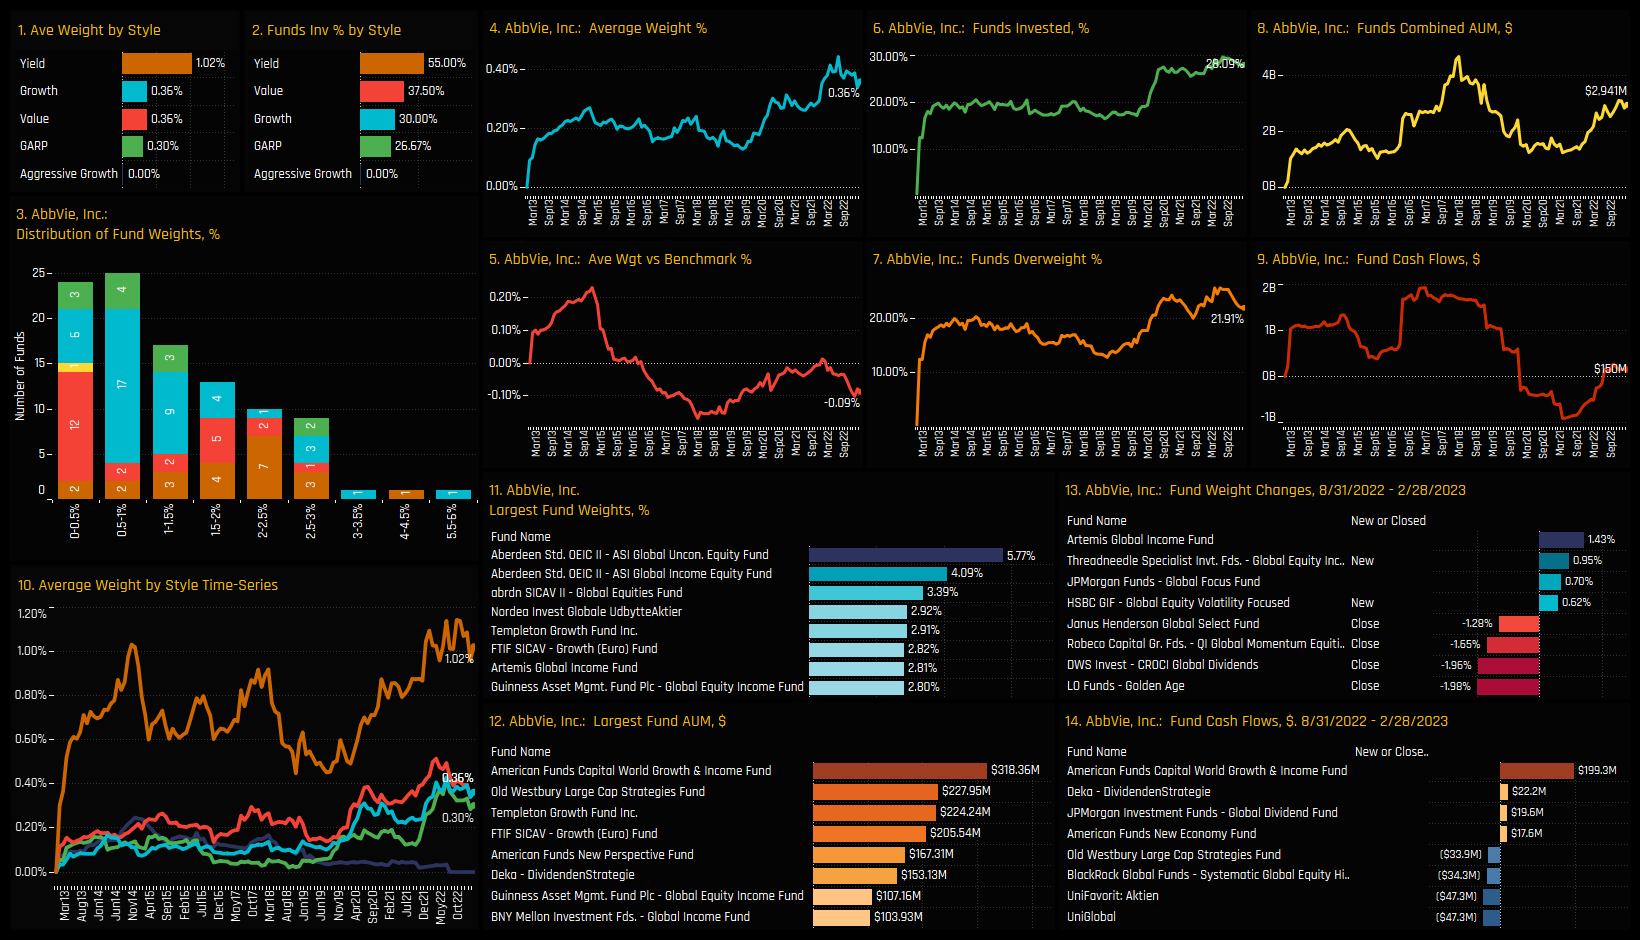
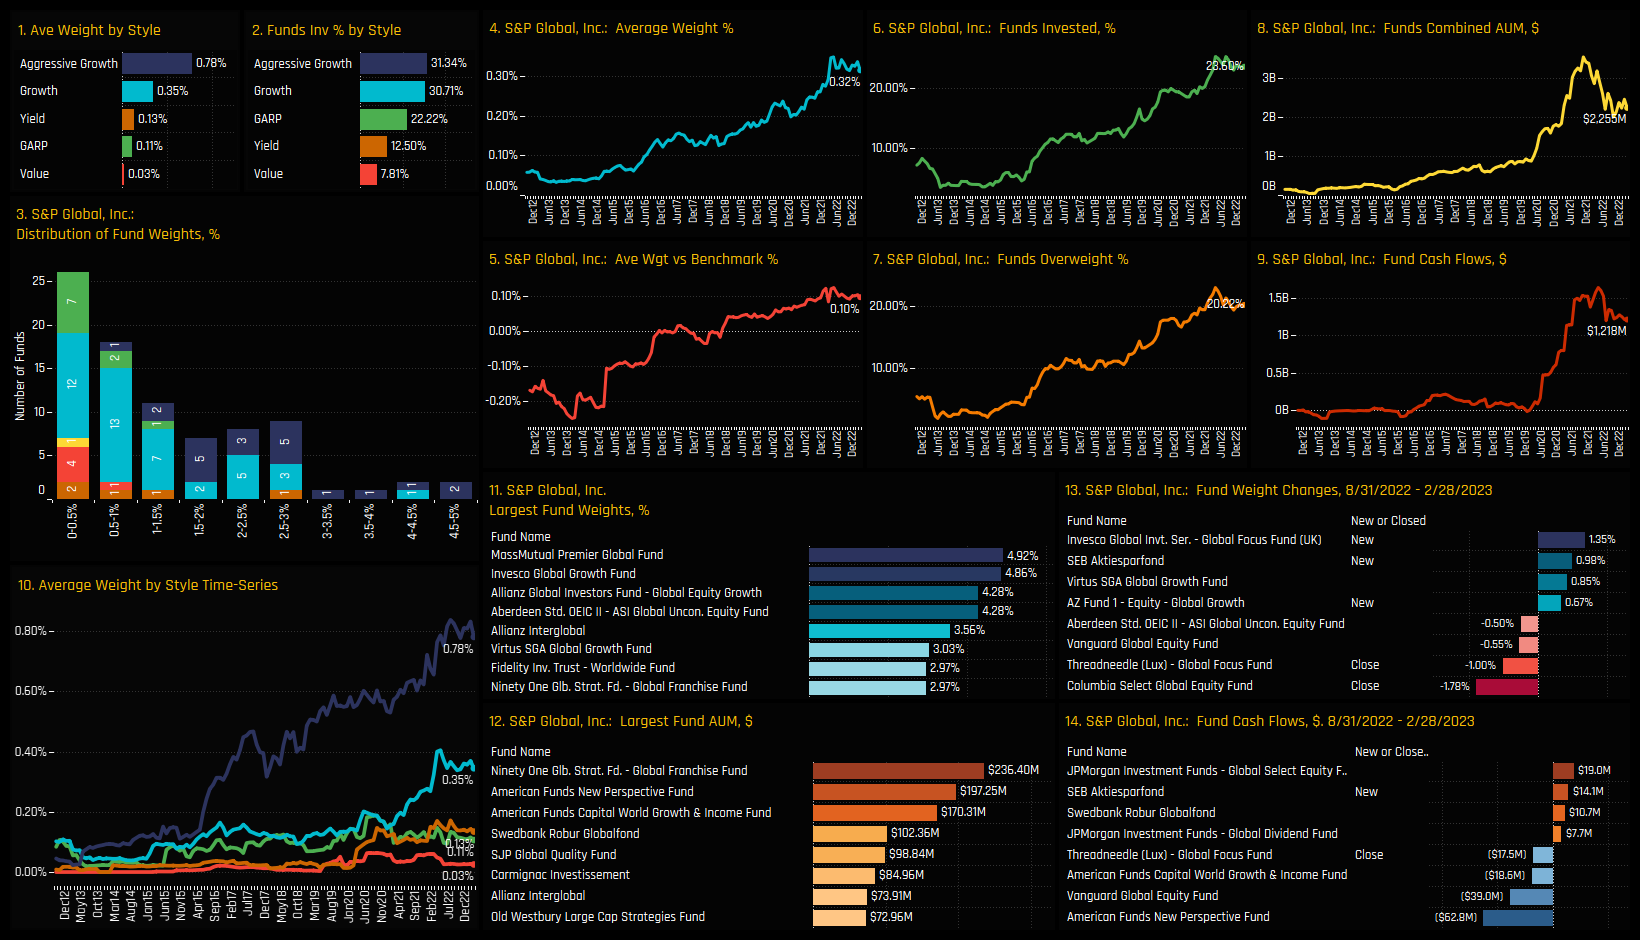
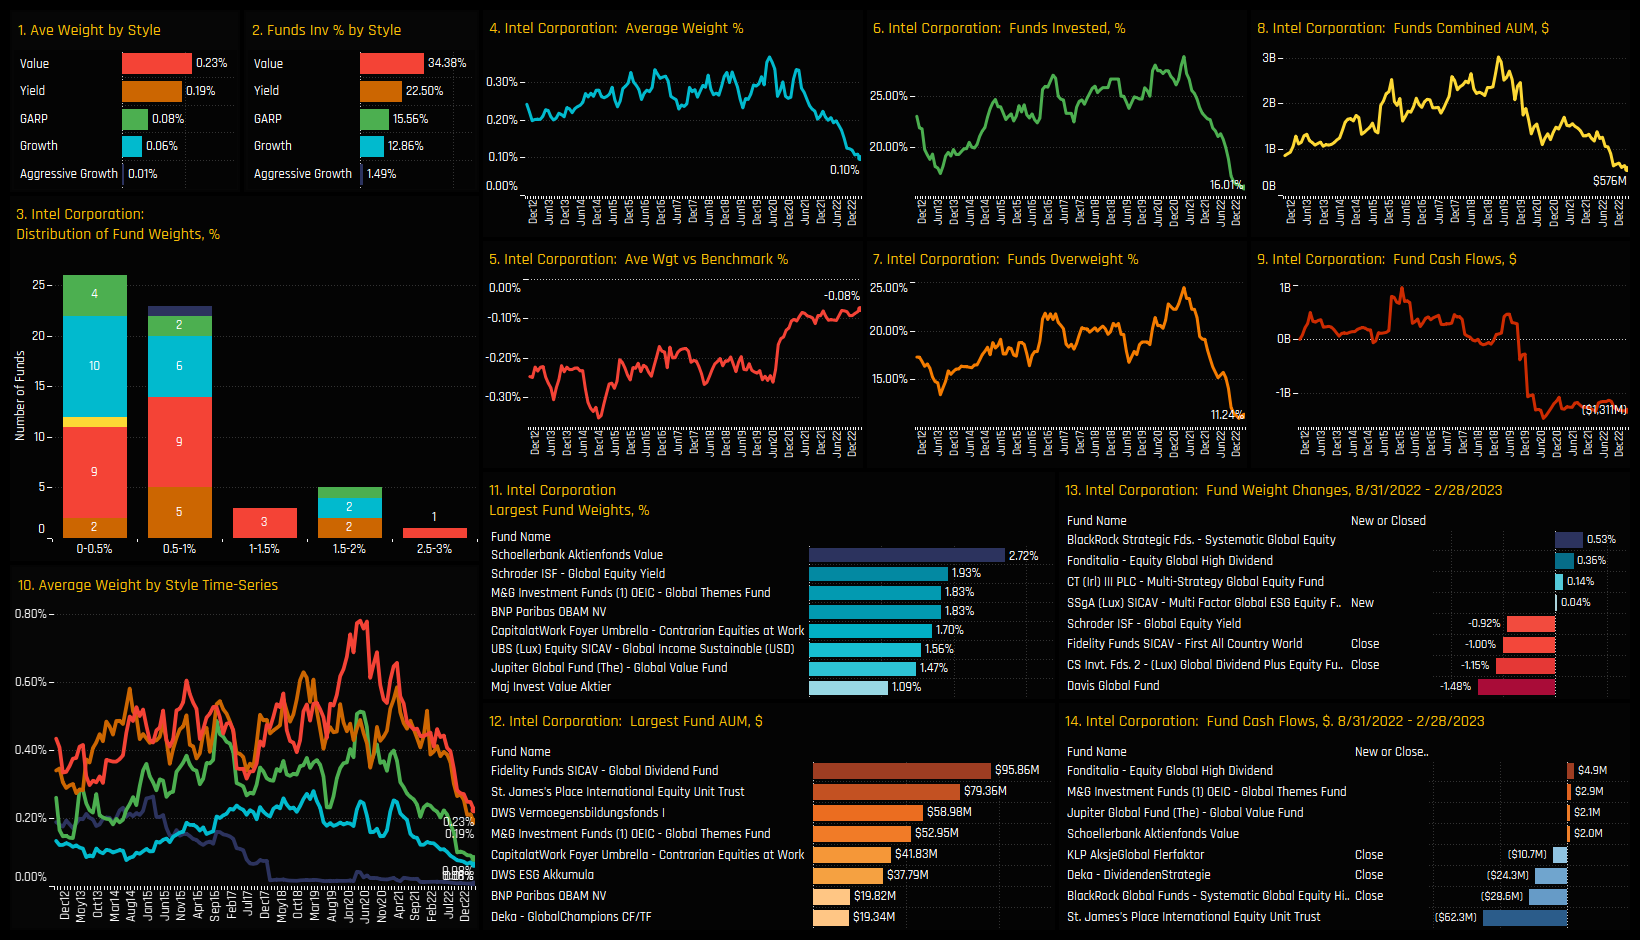
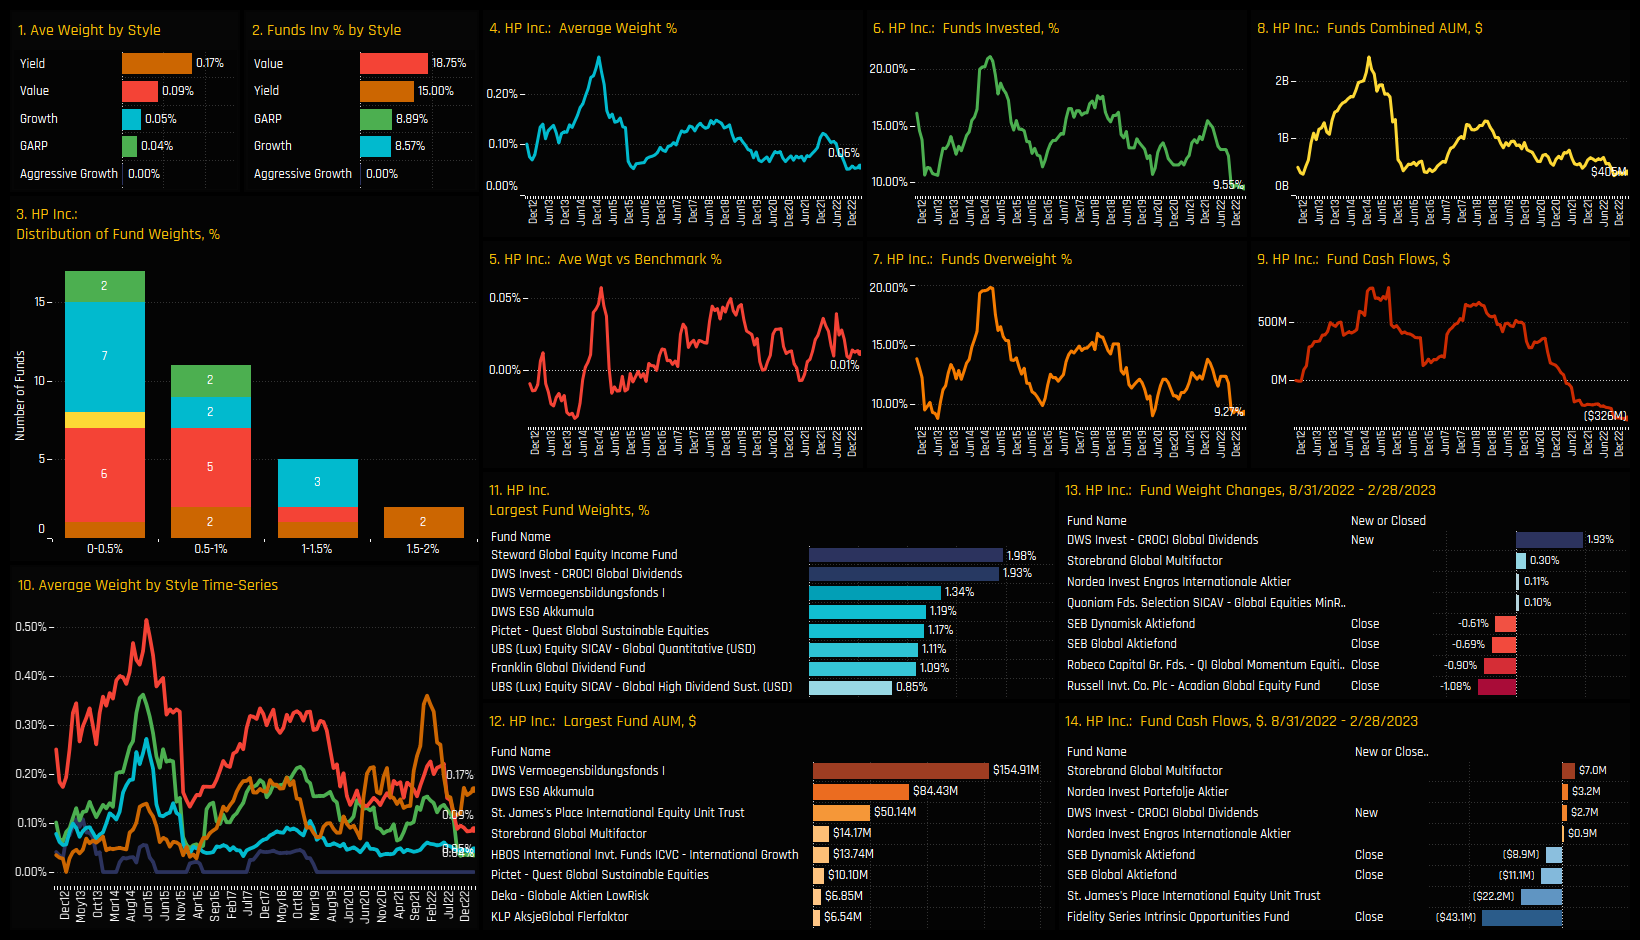
The charts below track the percentage of active funds invested in each of the top 2 stocks across the 4 categories. It’s another way to visualize how the Sentiment Grid works. For example, the top-left chart shows AbbVie Inc and A&P Global seeing fund ownership reversing from peak levels after sustained multi-year growth. In the bottom-left chart, both Intel Corporation and HP Inc have seen ownership levels drop to their lowest levels in the last decade after recent selling from active Global managers.
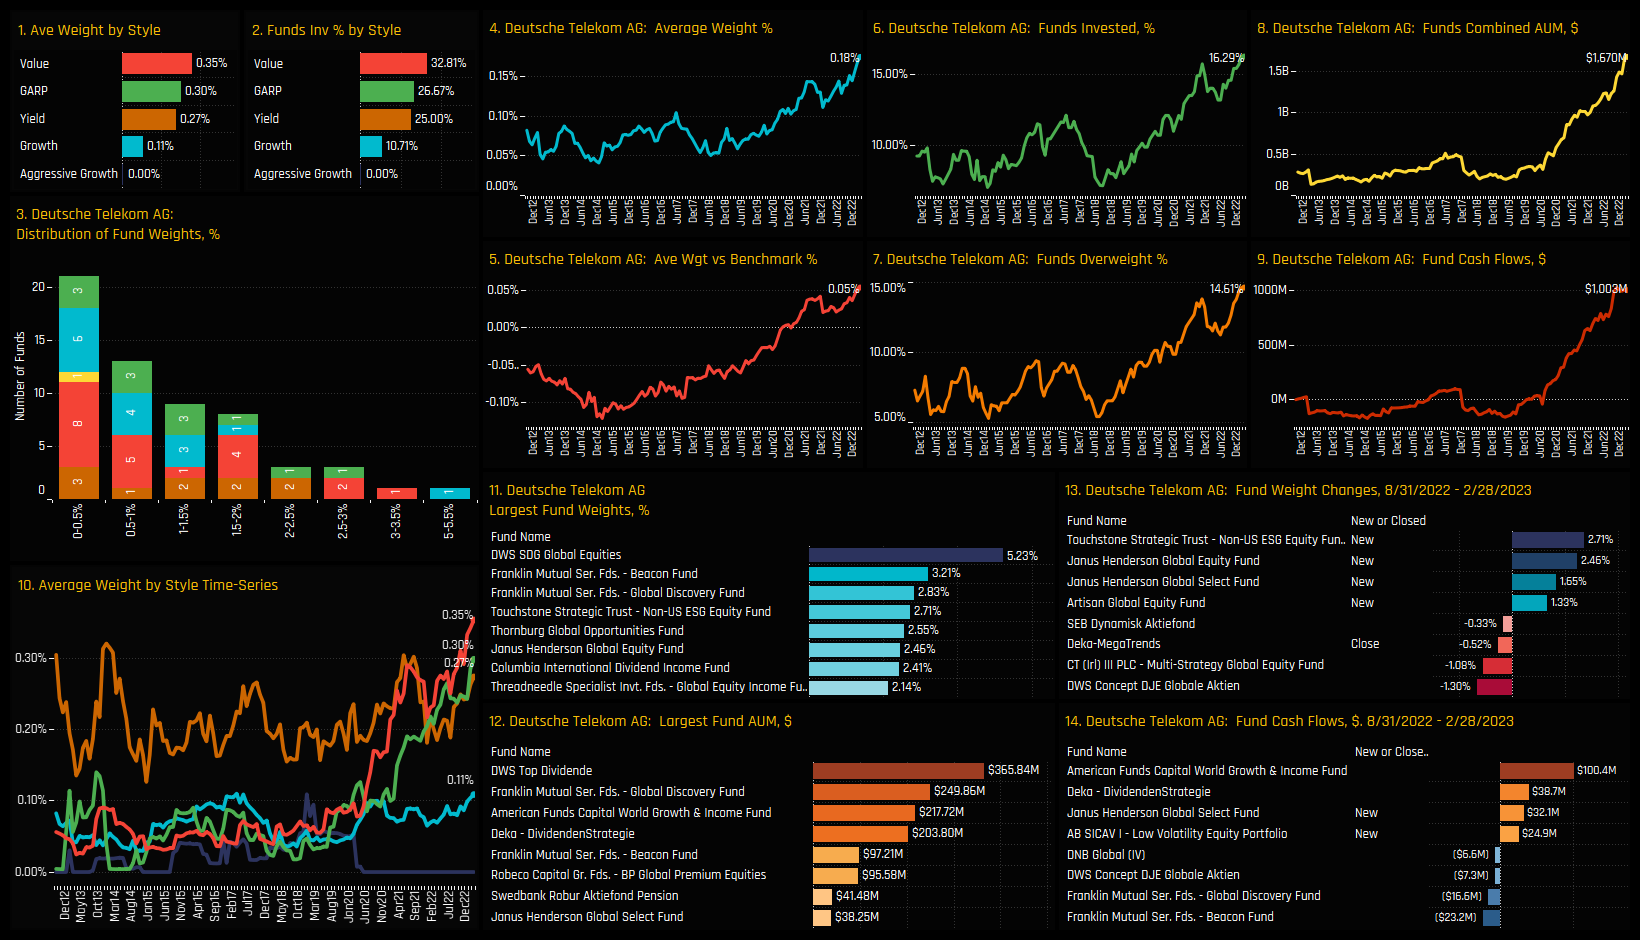
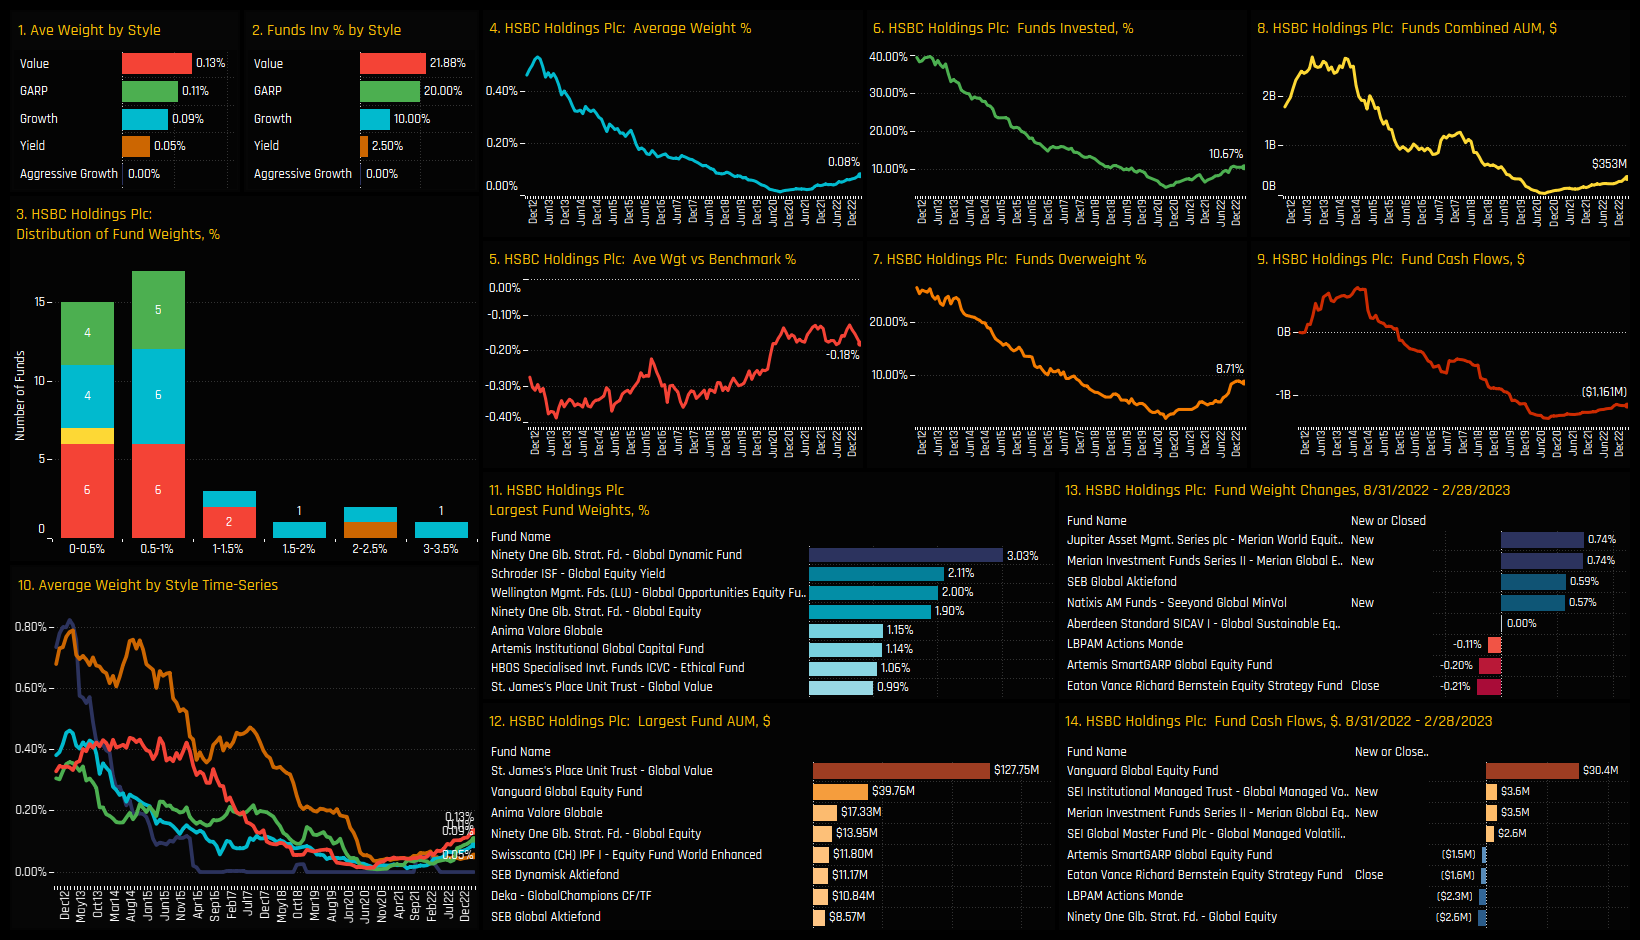
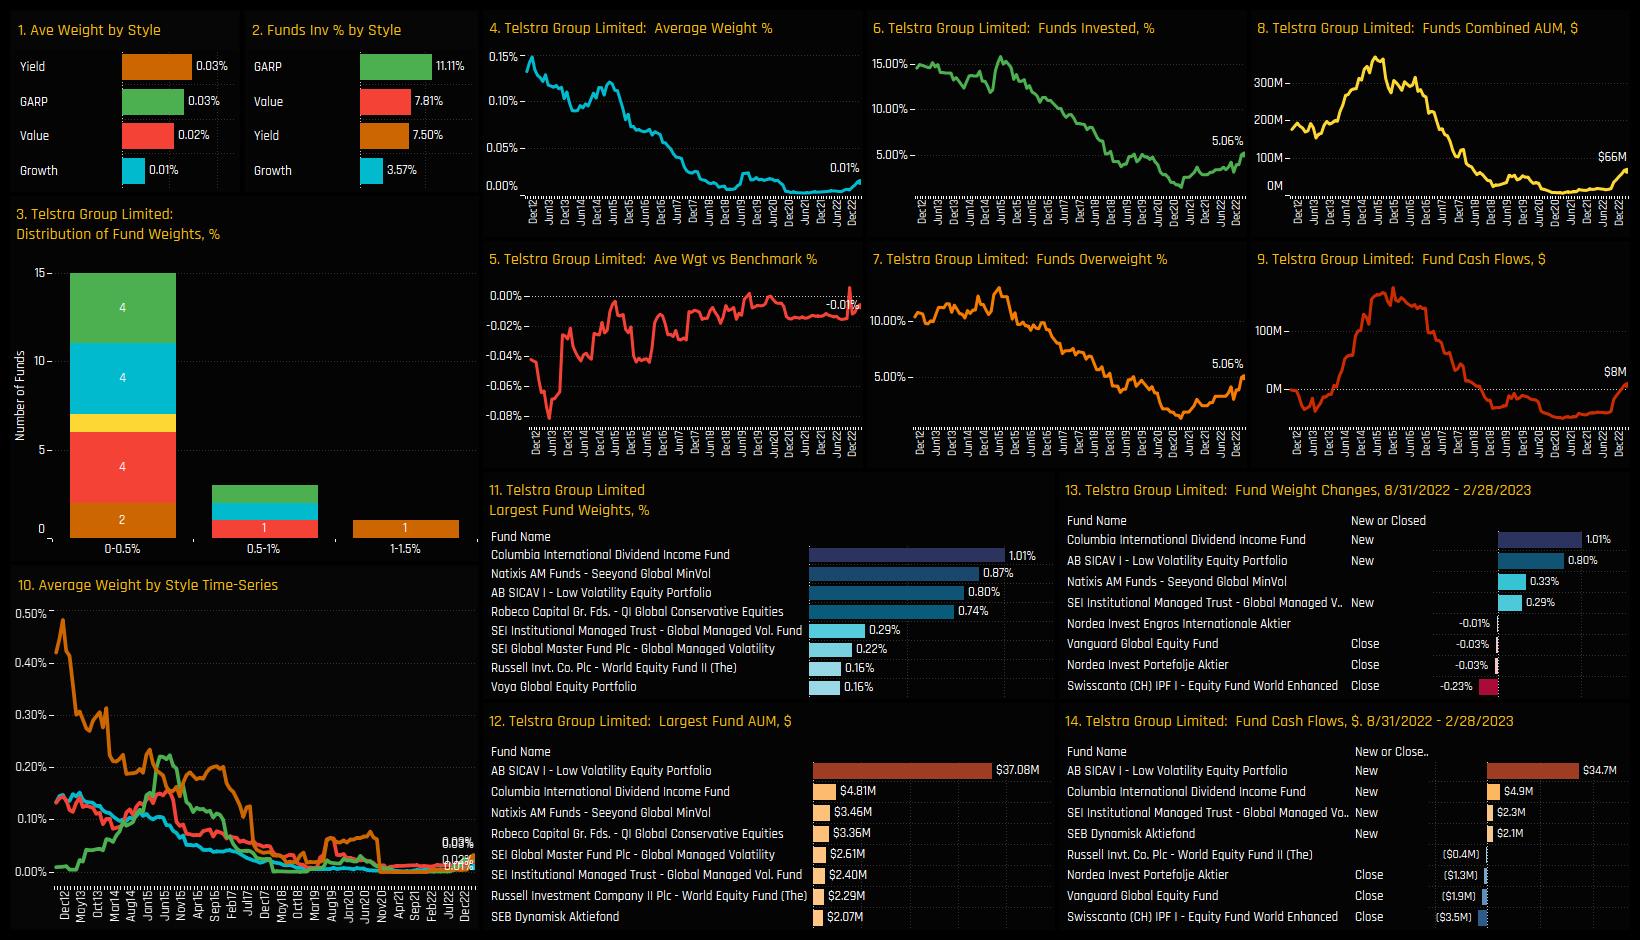
In the opposite case (bottom right), both HSBC Holdings Plc and Telstra Group Limited are at the bottom of their historical ownership ranges but both have started to climb from the lows. Top right shows LVMH and Deutsche Telekom at peak ownership after sustained increases in fund ownership in recent months. In the charts that follow we provide more detailed profiles of each of the 8 stocks at the extreme corners of our Sentiment Grid.
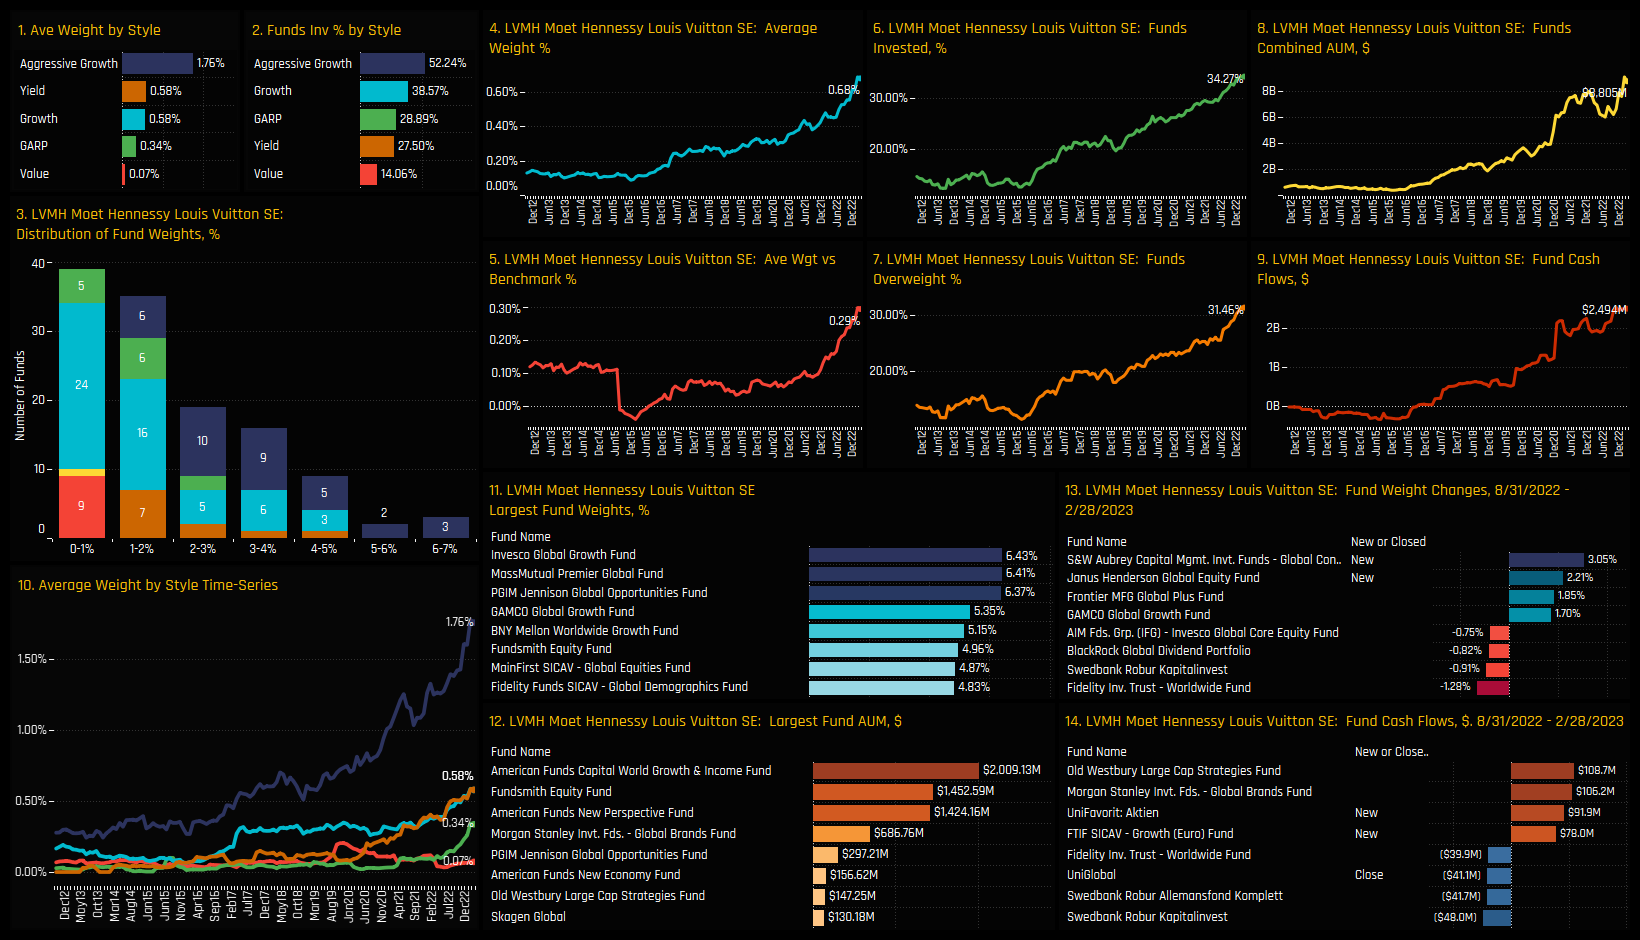
High Positioning & High Momentum: LVMH
High Positioning & High Momentum: Deutsche Telekom
High Positioning & Low Momentum: Abbvie Inc
High Positioning & Low Momentum: S&P Global
Low Positioning & Low Momentum: Intel Corporation
Low Positioning & Low Momentum: HP Inc.
Low Positioning & High Momentum: HSBC Holdings Plc.
Low Positioning & High Momentum: Telstra Group Limited
356 Global Equity Funds, AUM $938bn
Global Active Funds Ownership Report
To round off this month's Global research, please click on the link below for the full data report on Global active fund positioning
For more analysis, data or information on active investor positioning in your market, please get in touch with me on steven.holden@copleyfundresearch.com


