In this issue:
2023 Global Fund Positioning Update
Record Under-Allocation in Emerging Markets
Microsoft Corporation: Value Funds Lose Confidence
358 Global Equity Funds, AUM $914bn
2023 Global Fund Positioning Update
In this report, we look at the latest allocations among the 358 active funds in our analysis across regions, countries, sectors and country sectors. We look at average holdings, weights relative to benchmark and the key changes that occurred through 2022.
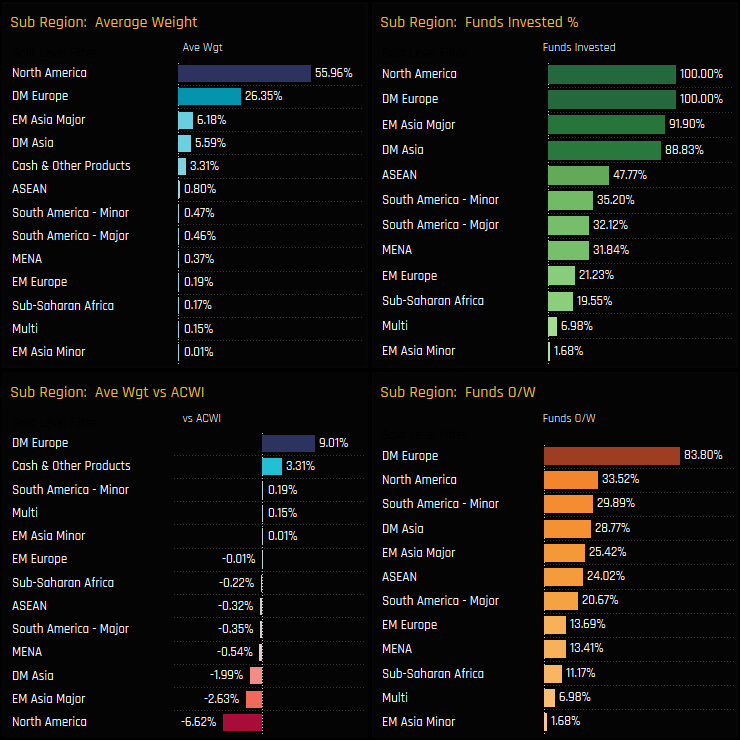
Regional Allocations
The major regional allocation splits are shown below. North America and DM Europe account for 82.3% of total allocations as we start the year, the remainder taken up by EM Asia Major (China, India, SK & Taiwan), DM Asia and Cash holdings. Versus the benchmark the picture is much the same as last year, with active Global managers running sizeable overweights in DM Europe versus underweights in North America. With 84% of managers overweight Developed Europe, it really is the consensus position for 2023.
Over the course of 2022, a rotation out of North America and in to DM Europe was evident. Average fund weights in DM Europe increased by +0.62% and overweights by +0.59%, whilst North American allocations dropped by -1.03% and underweights increased by -0.33%. The majority of Emerging Market regions saw ownership levels fall, led by EM Europe, South America and MENA.
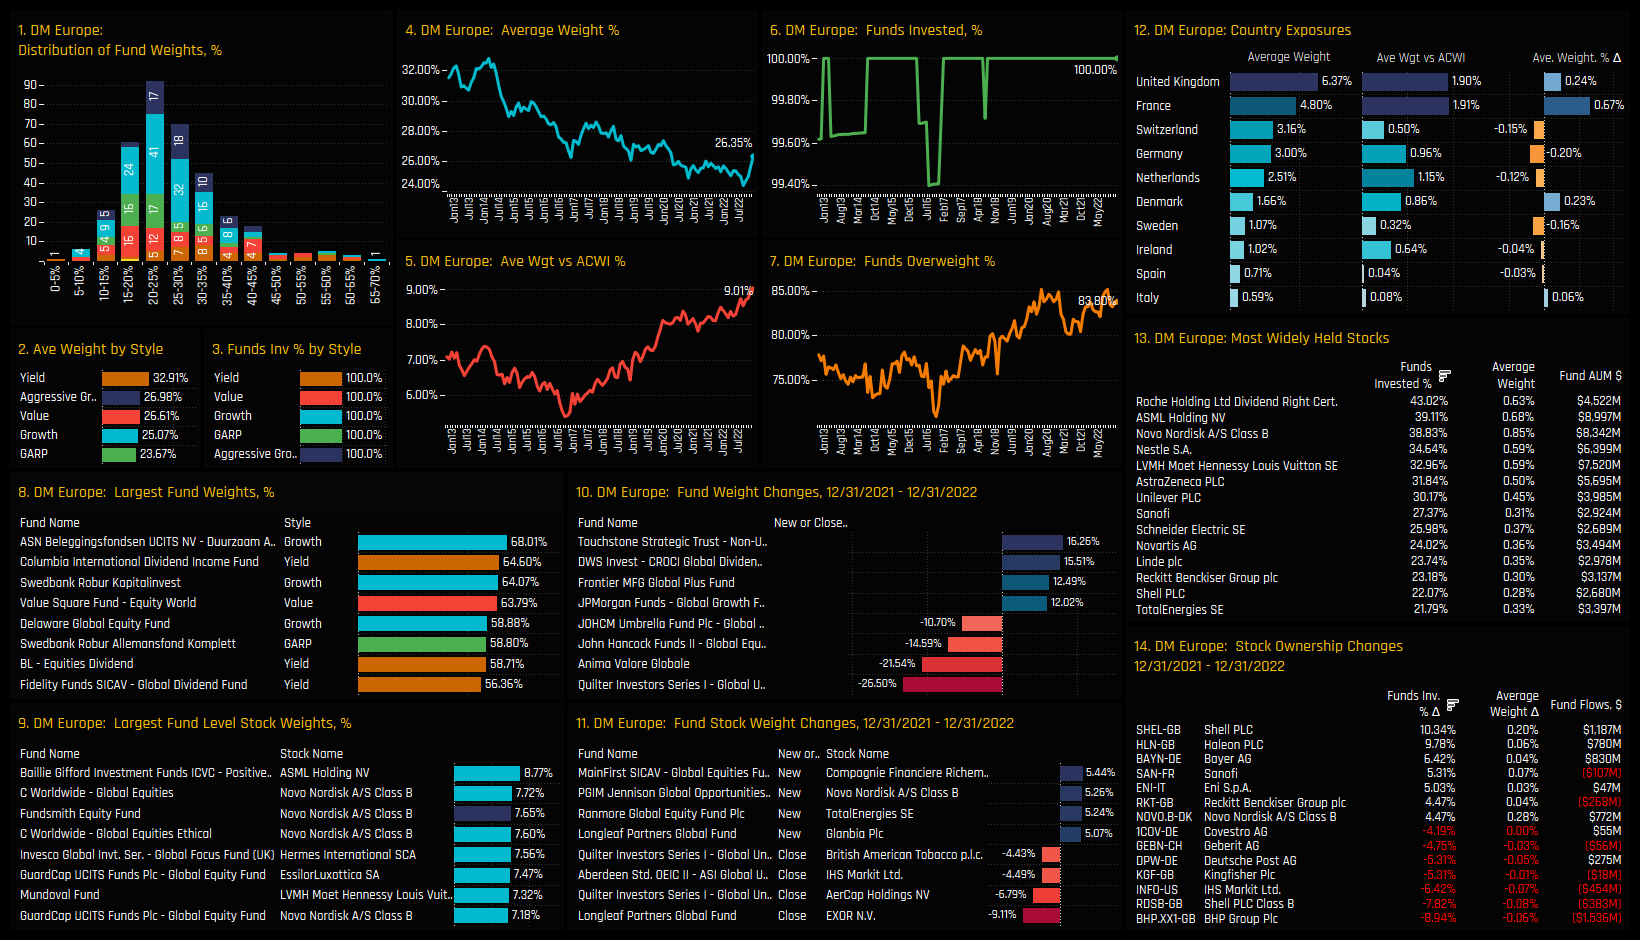
DM Europe Focus
The long-standing overweight in Developed European countries shows no signs of abating. In fact, the net overweight of +9.01% is the highest on record, with 83.8% of managers positioned overweight towards the top of the decade long range. On a Style basis, Yield funds hold the largest exposure with a 32.9% allocation, followed by Aggressive Growth on 27.0%. The bulk of the fund holdings distribution sits between 15% and 30%, though there is a tail to the upside occupied by ASN Duurzaam Aandelenfonds (68%) and Columbia International Dividend Income Fund (64.6%).
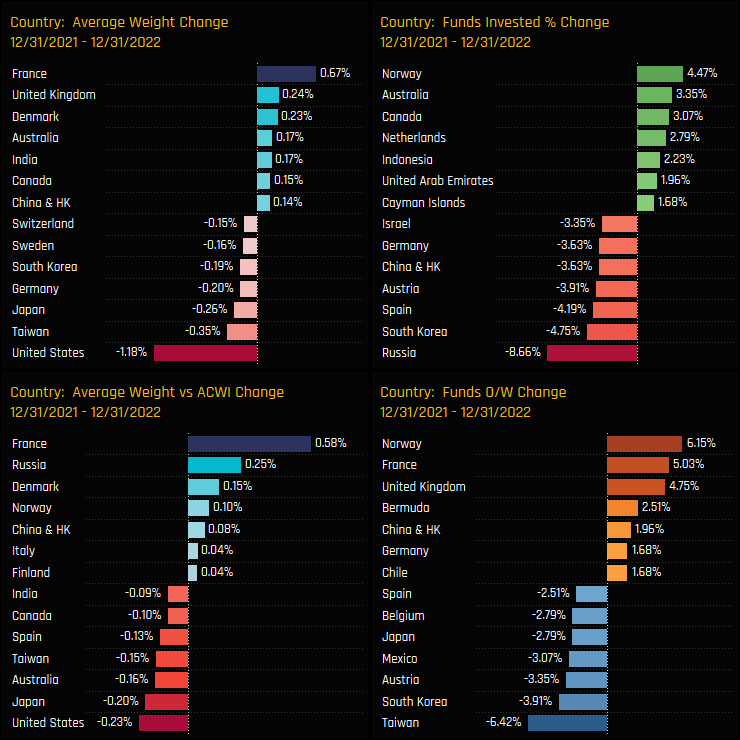
All of the major European countries are held overweight on average, led by the UK (+1.9% o/w) and France (1.91% o/w). Increases in fund weight last year were led by France (+0.67%), the UK (+0.24%) and Denmark (+0.23%). On a stock level, Roche Holding and Novo Nordisk as the most widely held and heavily allocated companies. Activity over 2022 saw increased ownership in Haleon PLC, Bayer AG and Sanofi, whilst Global funds scaled back on IHS Markit and Kingfisher, among others.
Country Positioning
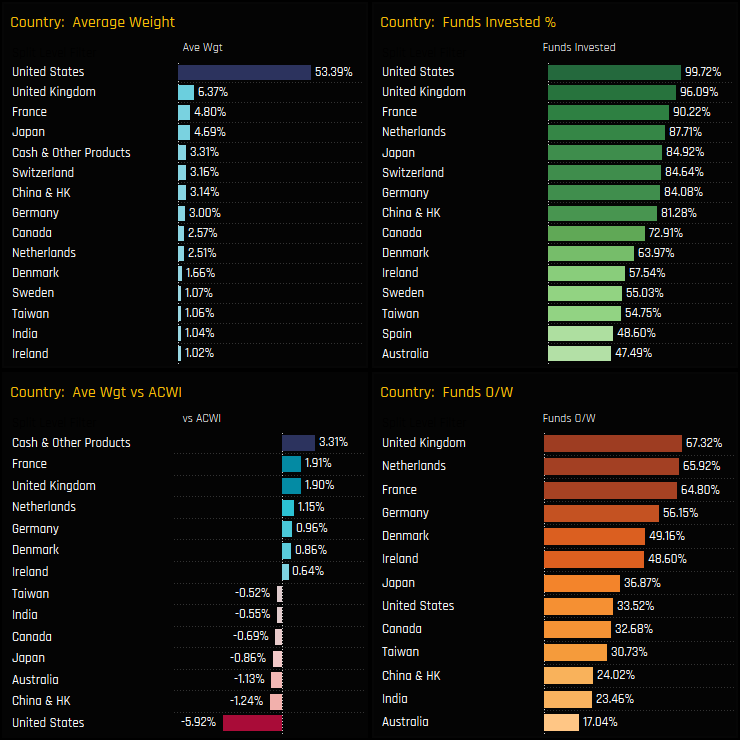
On a country level, the USA is of course dominant with a 53.4% weight on average, followed by the UK (6.7%), France (4.8%) and Japan (4.69%). Versus the benchmark, Global managers are running underweights in the USA, Australia and China & HK, to finance overweights in Cash, the UK and France. Global funds are not positioned for outperformance in either China & HK or Australia, with only 24% and 17% of funds positioned overweight respectively.
Country activity over the course of 2022 shows a shift towards French equities, with all measures of ownership moving higher on the year. Japan saw a degree of outward rotation, with average weights falling by -0.26% as -2.79% of managers switched to underweight. In line with GEM and Asia Ex-Japan funds, investment levels in Taiwan and South Korea declined over the year, whilst Russian allocations collapsed for obvious reasons.
Country Sentiment
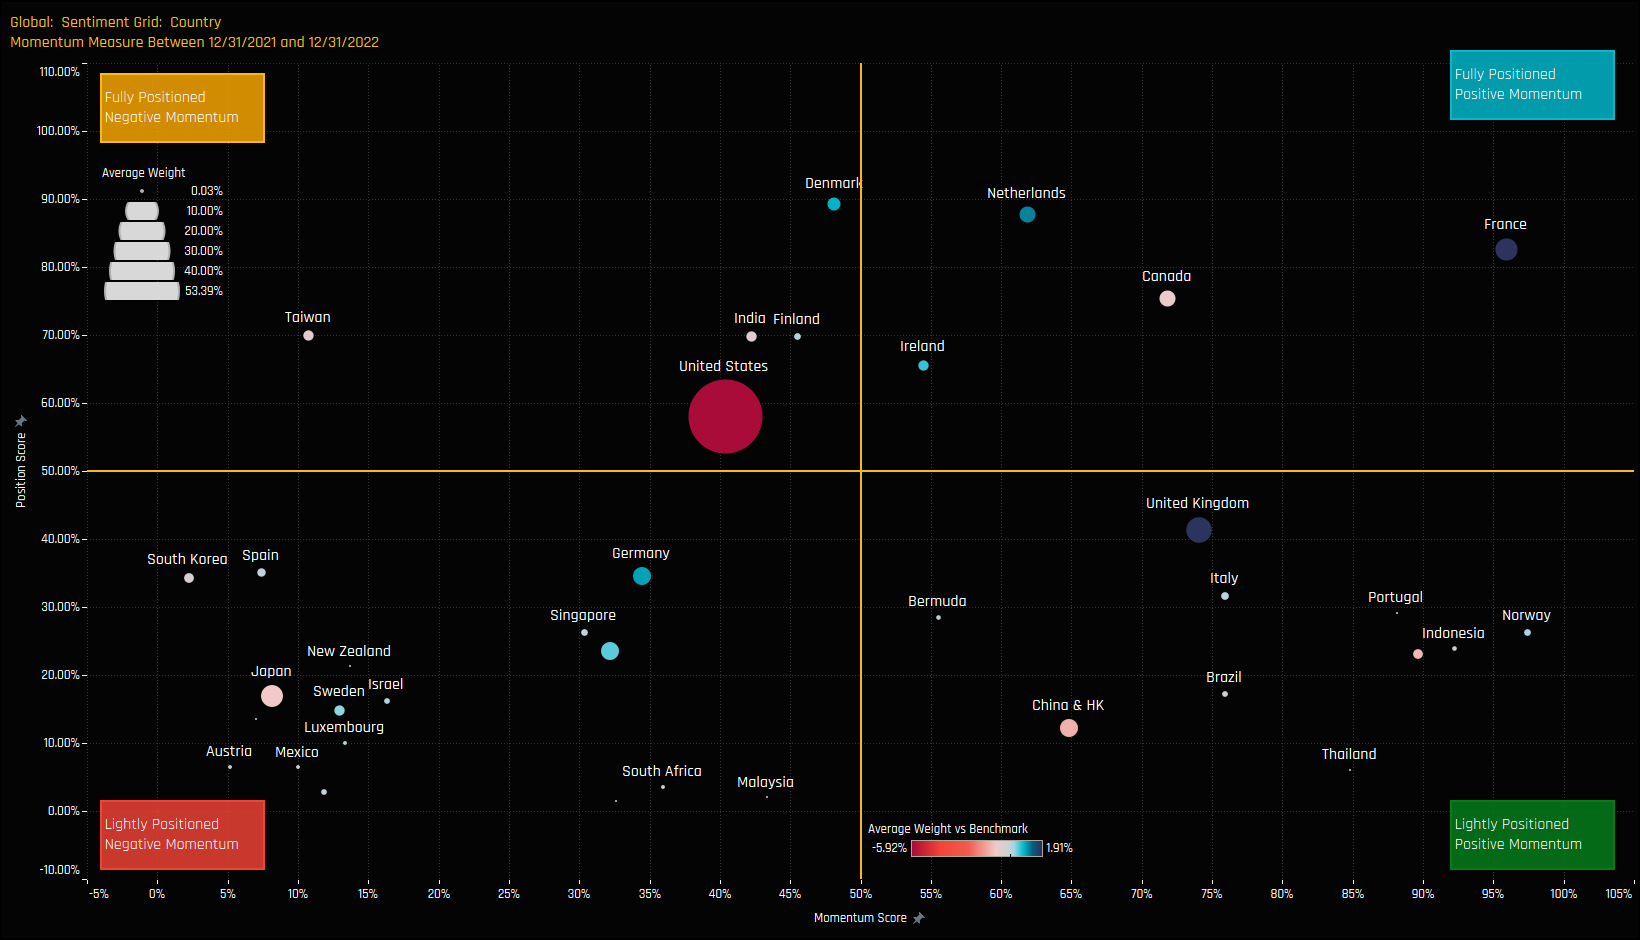
The sentiment grid below shows where current positioning in each country sits versus its own history going back to 2013 on a scale of 0-100% (y-axis), against a measure of fund activity for each country between 12/31/2021 and 12/31/2022 (x-axis).
The Grid highlights the strong sentiment in France, with momentum among the the highest whilst positioning closes in on record levels. The dominant USA sits in the middle of both positioning and momentum measures, whilst Taiwan, South Korea and Japan are on the far left, with the latter towards its lowest positioning levels on record.
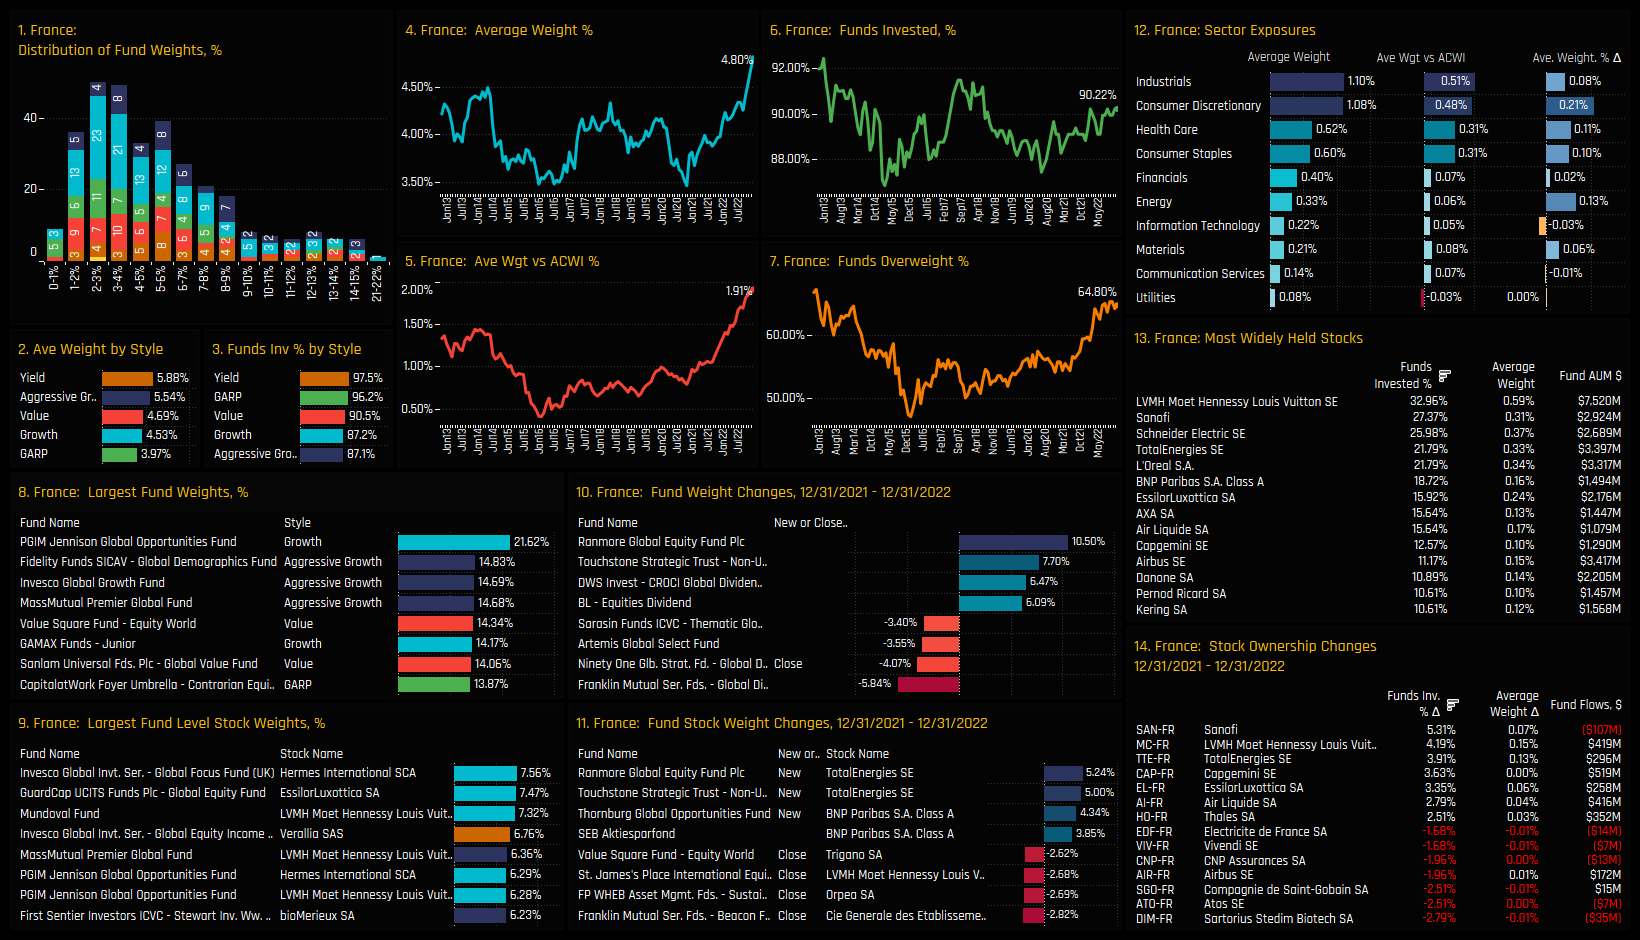
France Focus
Fund allocations in French equities are at their highest levels on record. France has always been a consistent overweight among Global managers, yet today’s average weight of 4.80% and overweight of +1.91% are both at peak levels, with nearly two-thirds of funds positioned overweight. Most funds hold between 2%-5% in France, with the most bullish above 10% led by PGIM Jennison Global Opportunities (21.6%) and Fidelity Global Demographics (14.8%).
Industrials and Consumer Discretionary are the key sector exposures in France, with both key overweights alongside Health Care and Consumer Staples. On a stock level, LVMH Moet Hennessy is the most widely held, heading a group of 3 stocks owned by more than 25% of managers. Sanofi, TotalEnergies, Capgemini and LVHM all captured ownership increases in 2022.
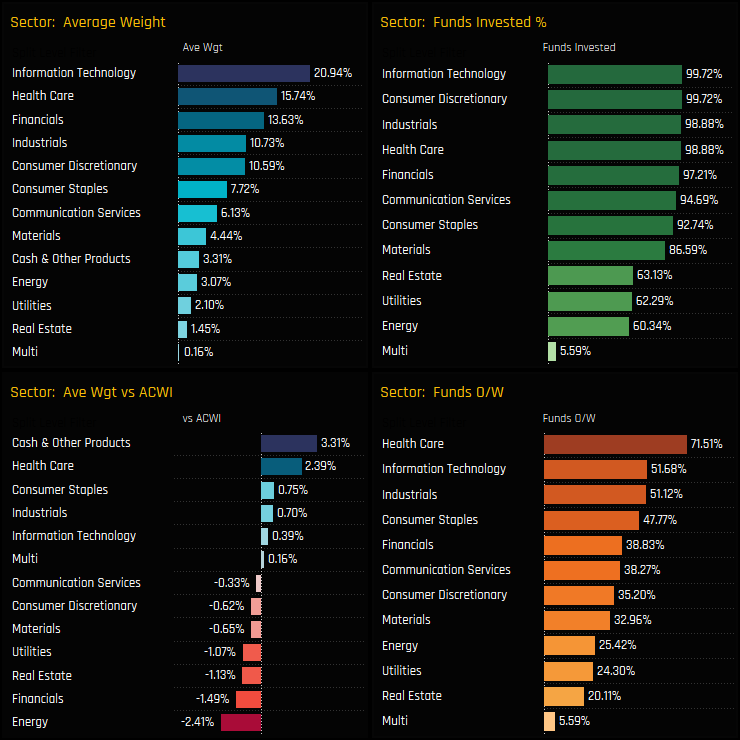
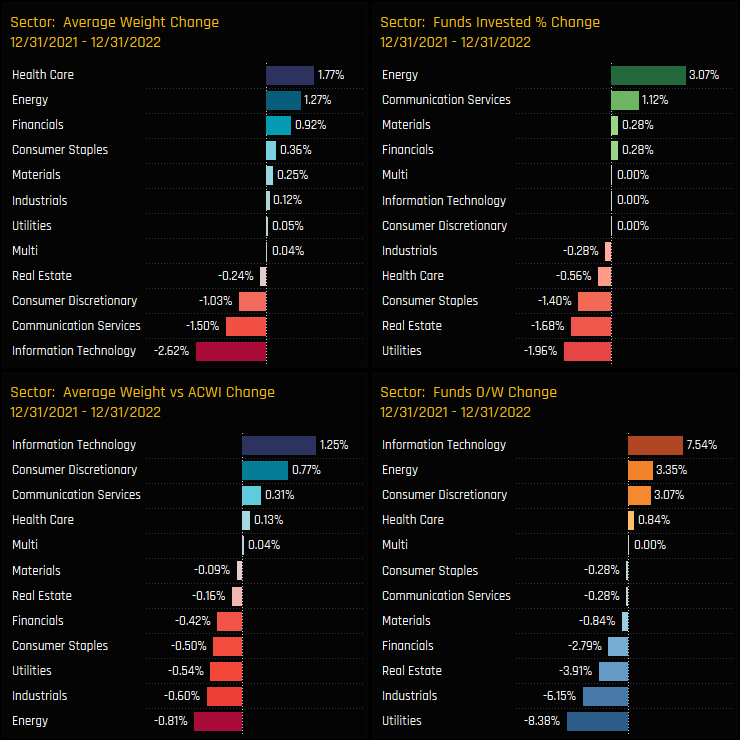
Sector Positioning
Technology remains the largest sector allocation as we start 2023, but Health Care is closing in. Versus the benchmark, Health Care is the consensus overweight, held above benchmark by 71.5% of managers at an average +2.39% overweight. In terms of outright sector ownership, Energy, Utilities and Real Estate appear the easiest to leave out of portfolios, with less than two-thirds of Global managers invested in each.
Over the course of last year, the spread between Technology and Health Care allocations narrowed by 4.4%. Energy was a clear winner on the year, attracting a further +3% of funds as average weights increased by +1.27%. The increase in relative positioning in the Tech sector was brought about mainly by underperformance among existing underweights (Apple/Nvidia), rather than any active repositioning.
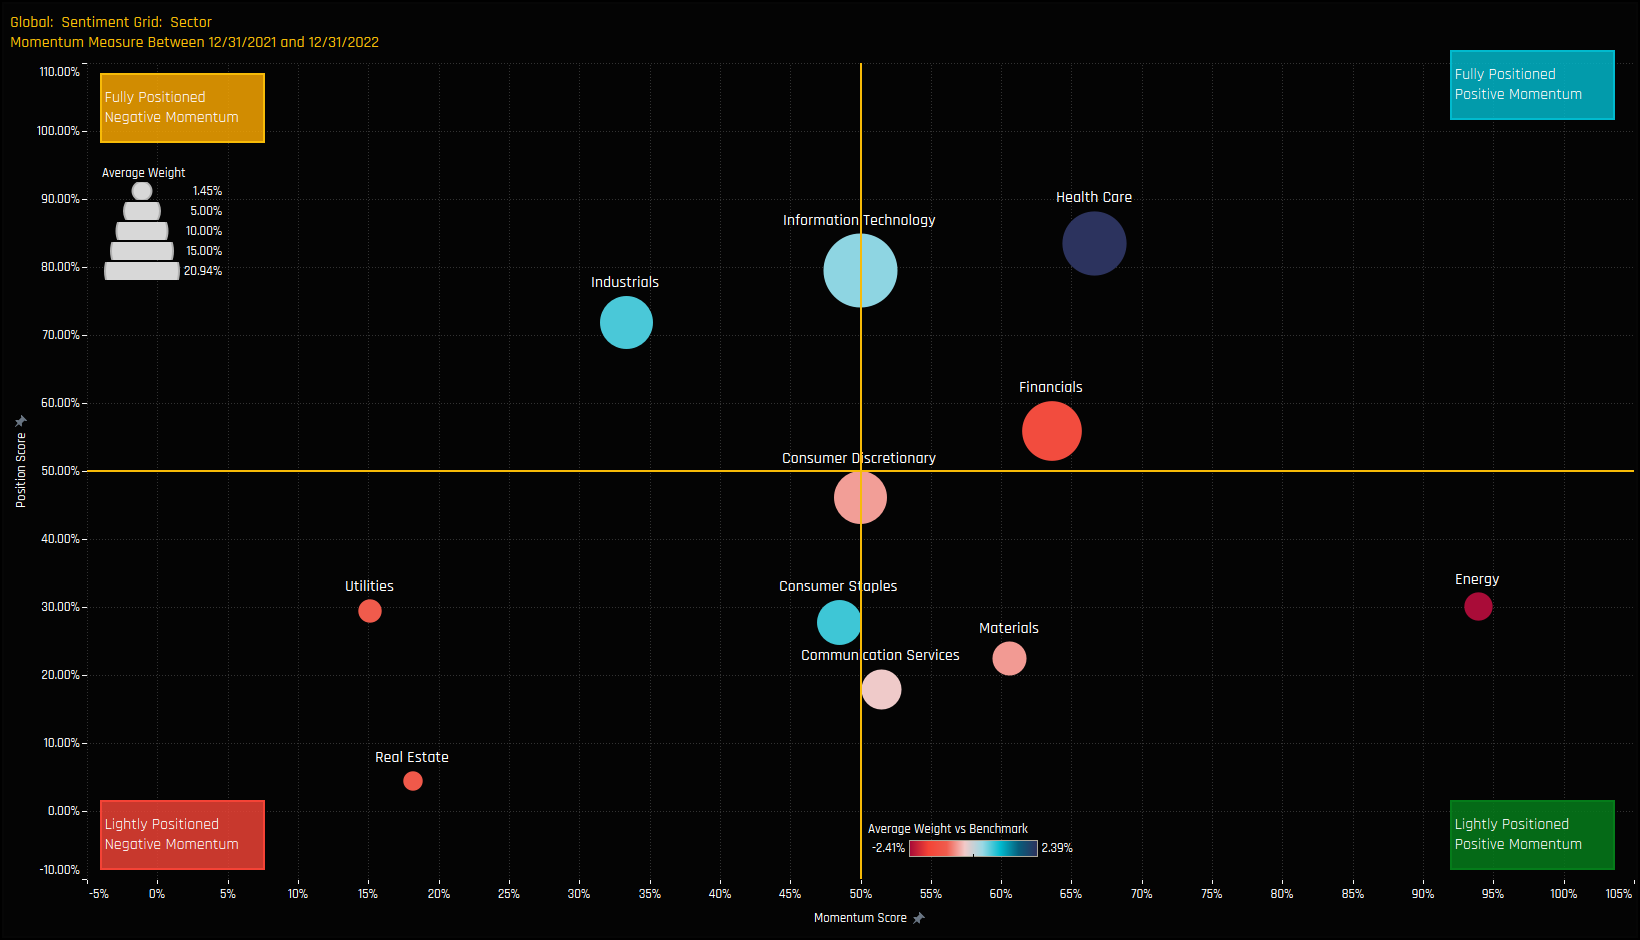
Sector Sentiment
The sentiment grid below shows where current positioning in each sector sits versus its own history going back to 2013 on a scale of 0-100% (y-axis), against a measure of fund activity for each sector between 12/31/2021 and 12/31/2022 (x-axis).
All the major sectors are clustered around the center in terms of momentum, though Health Care and Technology are still well positioned versus their own history. The real standout is Energy, with strong momentum but with positioning still near it’s lowest levels on record.
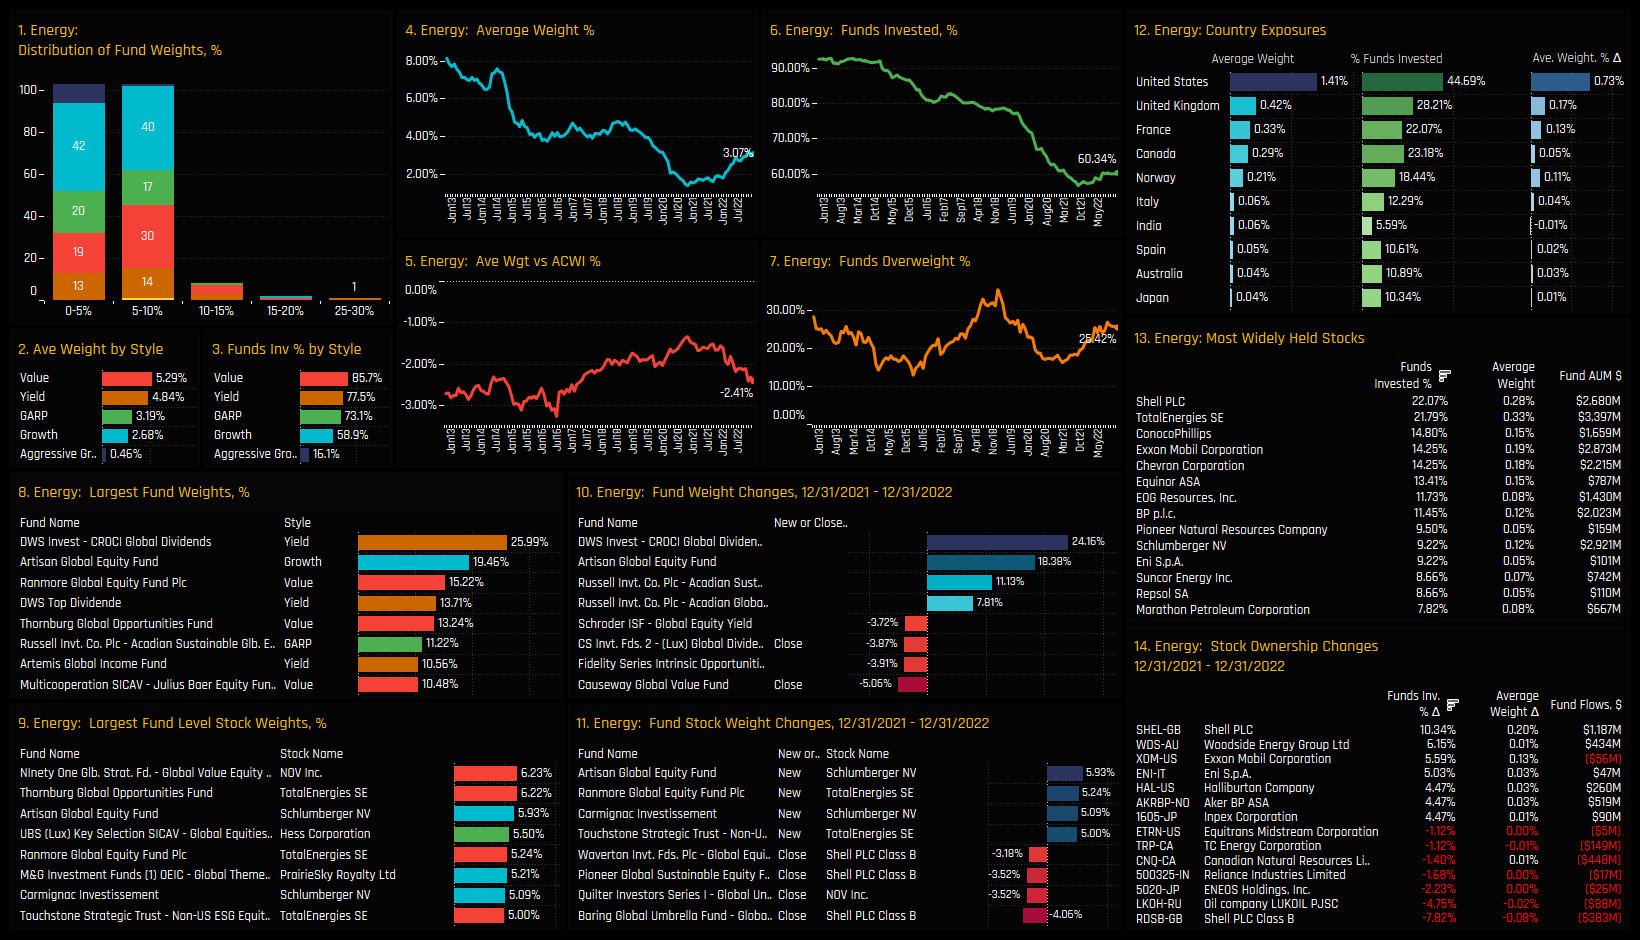
Energy Focus
Despite being a winner on the year, Energy allocations are still close to their lowest levels on record. Though average fund weights are moving higher, the percentage of funds invested remains stubbornly low at just 60.3%. There is a real reluctance among active Global investors to engage with the sector. The Style split is significant, with Value/Yield funds allocating far more than their Growth/Aggressive Growth peers.
On a country level the lack of investment is apparent, with just 45% invested in US Energy stocks, 28% in UK Energy and 22% in France. The most widely held stocks are far from widely held, with just 22% invested in TotalEnergies and Shell PLC. Stocks seeing investment levels rise in 2022 include Woodside Energy, Exxon Mobil Corp and ENI.
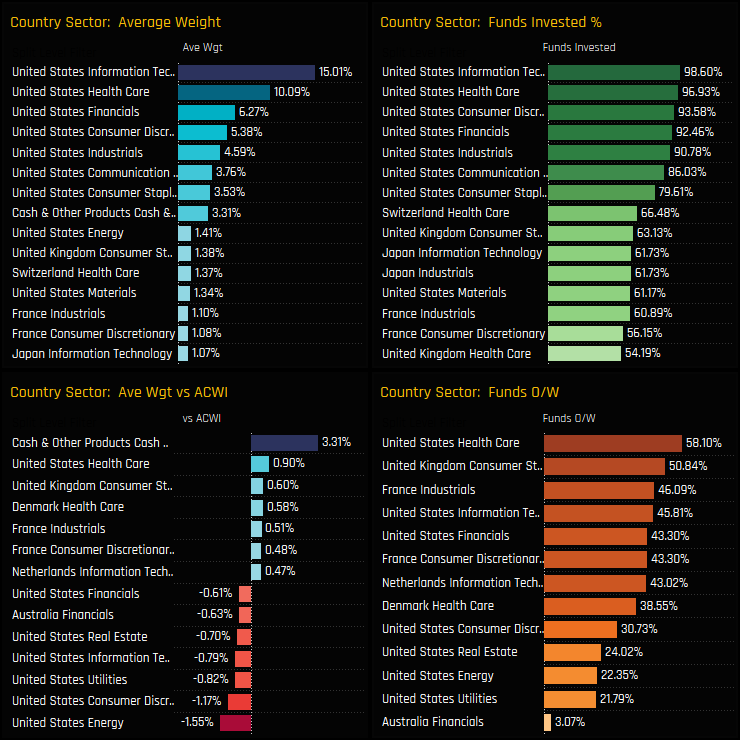
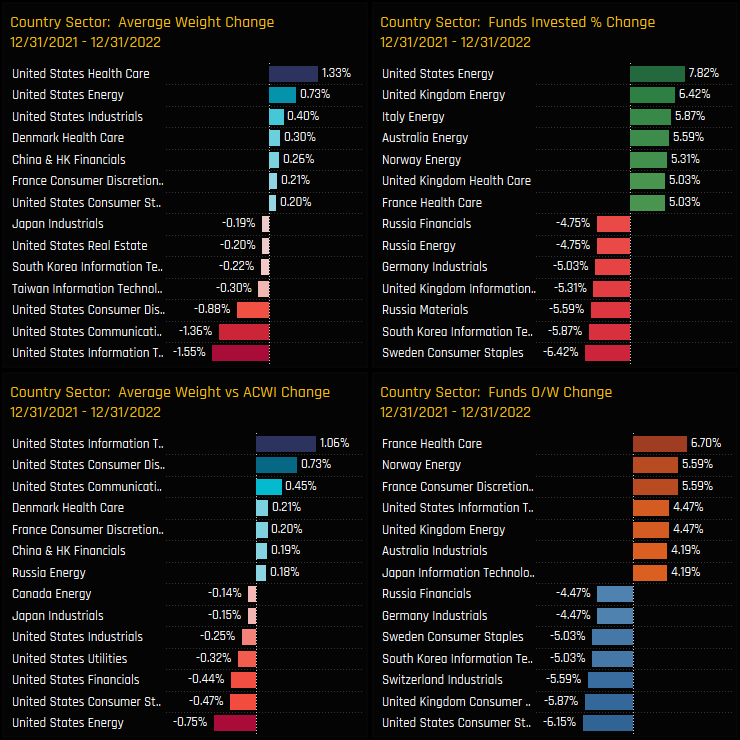
Country Sector Positioning
On a country/sector level, USA Technology and Health Care are the most widely held and largest allocations, accounting for a combined 25.1% of total Global fund portfolio weights, on average. Relative to benchmark, the key underweights are dominated by the major US sectors, save for US Health Care which is a consensus overweight. Outside of the USA, UK Consumer Staples, French Industrials and Denmark Health Care are all held above the SPDRs MSCI ACWI ETF weight, on average.
Activity over the last 12-months breaks down the rotation in to Energy, with the US, UK, Norway, Australia and Italian Energy sectors all seeing ownership levels increase. The Technology decline was led by the USA and Taiwan, though more funds (-5.87%) closed out their South Korea Tech exposure. Russian sectors saw some of the larger drops in funds invested, but in reality exposure was low among Global investors at the start of 2022.
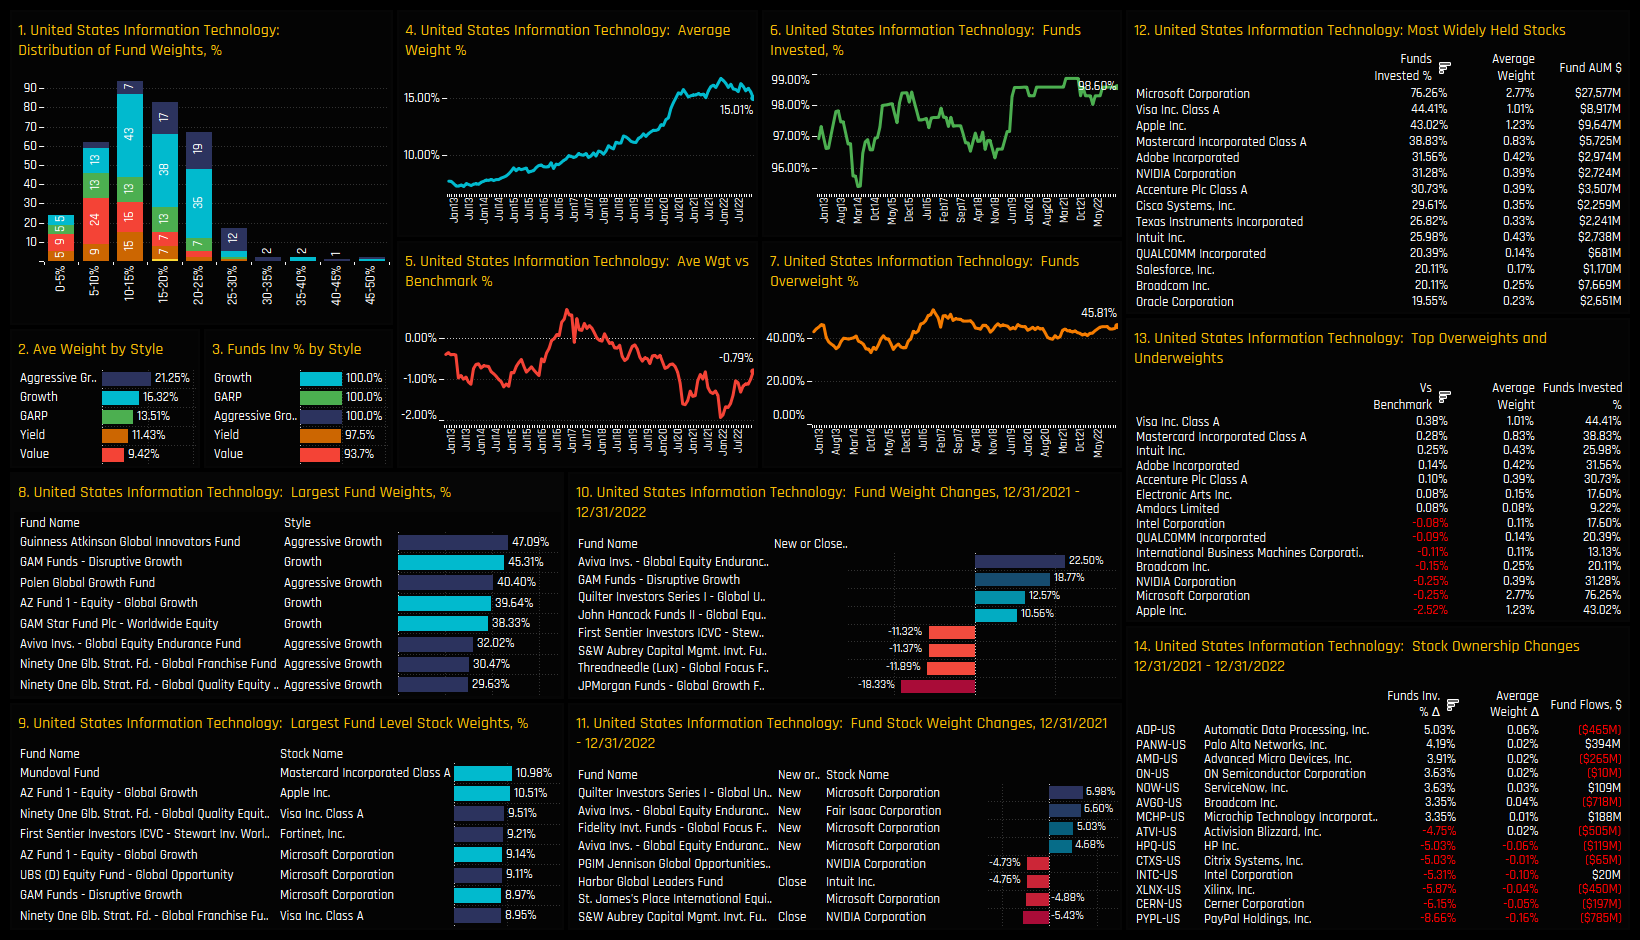
US Technology Focus
US Tech allocations are off the highs of 16.8% in November 2021 and stand at the base of the extended range achieved during the COVID pandemic. Underweights peaked at -1.92% at the same time but have since reduced on the back of sector underperformance. The sector encapsulates the Growth/Value divide like no other, with Aggressive Growth and Growth funds positioned overweight on average versus Value/Yield/Garp underweight.
The most widely held stock is Microsoft Corporation by some margin, held by 76.2% of funds at an average weight of 2.77%. Apple stands out through it’s relative lack of ownership (43% of funds) and net underweight of -2.52%. Stock activity within the sector was skewed to the sell-side last year, with ownership falling heavily in PayPal Holdings, Cerner Corp and Xilinx Inc.
Conclusion and Links
This concludes our analysis of top-down positioning among Global active investors. Click the link to the right for the latest version of the Global Fund Positioning Report, scroll down for further analysis on Emerging Market allocations and an analysis on Microsoft positioning among Value managers.
In this analysis, we investigate the drivers behind a significant rotation away from Emerging Market equities. We examine the countries, sectors and stocks contributing to the shift, resulting in allocations dropping to their lowest levels in over a decade.
Time-Series & Country Rotation
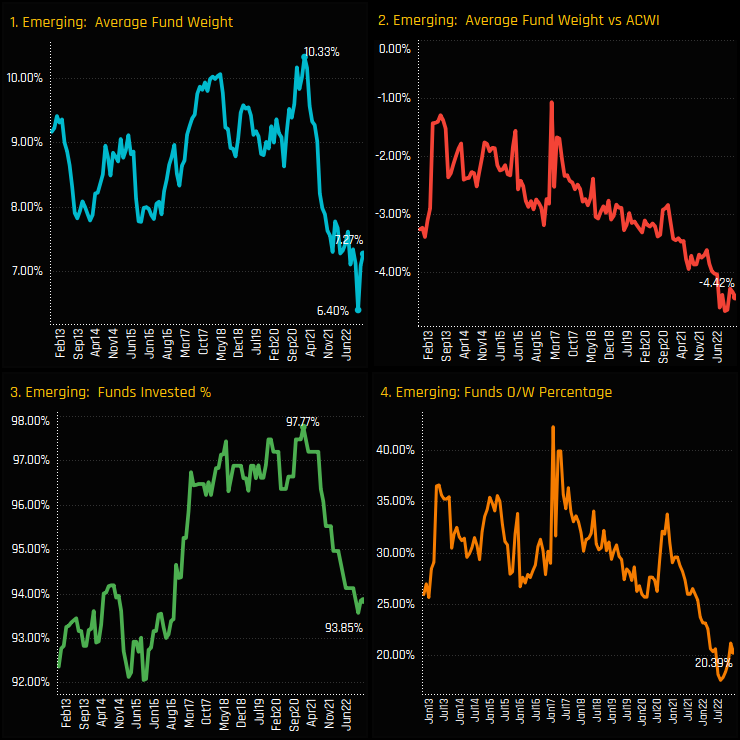
Emerging Market allocations among active Global funds are at depressed levels. From a peak of 10.3% in January 2021, average holding weights fell to a low of 6.4% in October last year, recovering slightly to 7.27% today. Over this period, the percentage of funds with exposure to EM fell from 97.8% to 93.85%, underweights increased from -3.4% to -4.4% and the percentage of funds overweight fell from 33.8% to 18.9%. This was an active rebalance away from EM, compounded by relative underperformance versus developed markets.
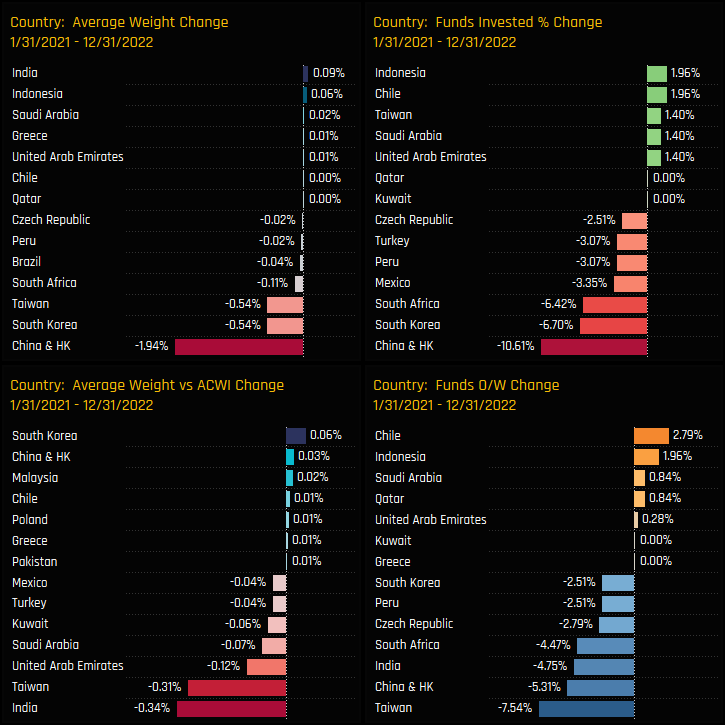
The changes in EM country ownership from the highs of 2021 are detailed in the below charts. The average weight decline was led by China & HK, with -10.6% of funds closing exposure and allocations falling by -1.94%. South Korea, Taiwan and South Africa also suffered, with all measures of ownership moving lower. Of the few bright spots, Global funds increased allocations to Indonesia, Chile and selected MENA countries over the period, but to a much smaller degree.
Sector & Stock Activity
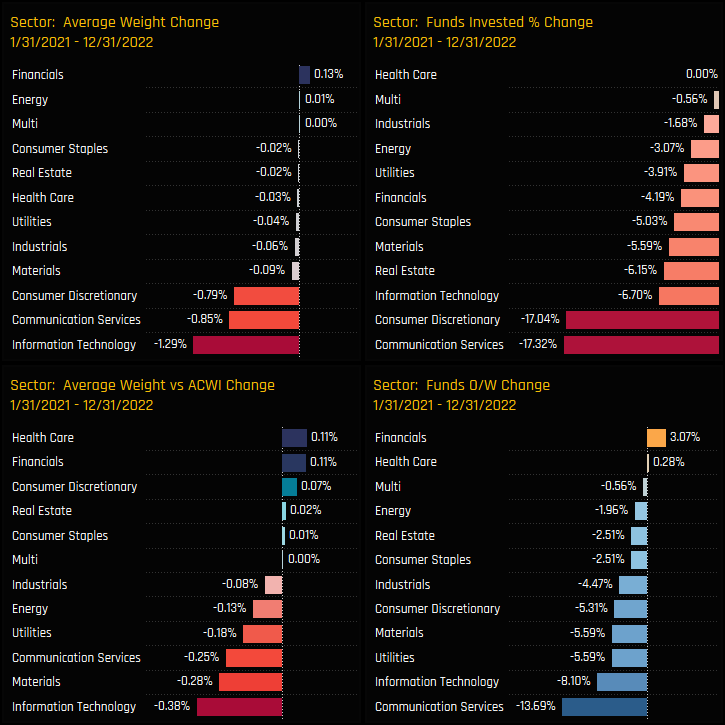
On a sector level, -17.3% of investors closed exposure to EM Communication Services and -17.04% to EM Consumer Discretionary. All sectors saw the percentage of funds invested decline, with the large average weight declines coming from Technology, Comm’ Services and Consumer Discretionary. The EM Financials sector was alone in capturing modest increases in exposure over the period.
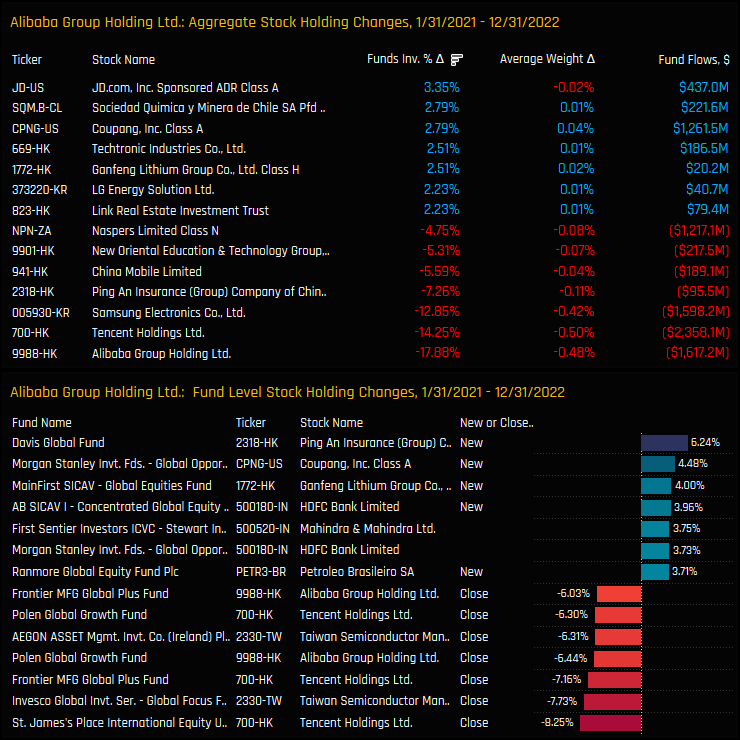
On a stock level, much of the declines can be attributed to the three large cap EM holdings of Alibaba Group Holdings, Tencent Holdings and Samsung Electronics. All three suffered significant outflows and position closures among Global investors from Jan 21 to Dec 22. At their peak in 2021, these three stocks were beginning to command good sized allocations in selected Global portfolios,
Latest Snapshot
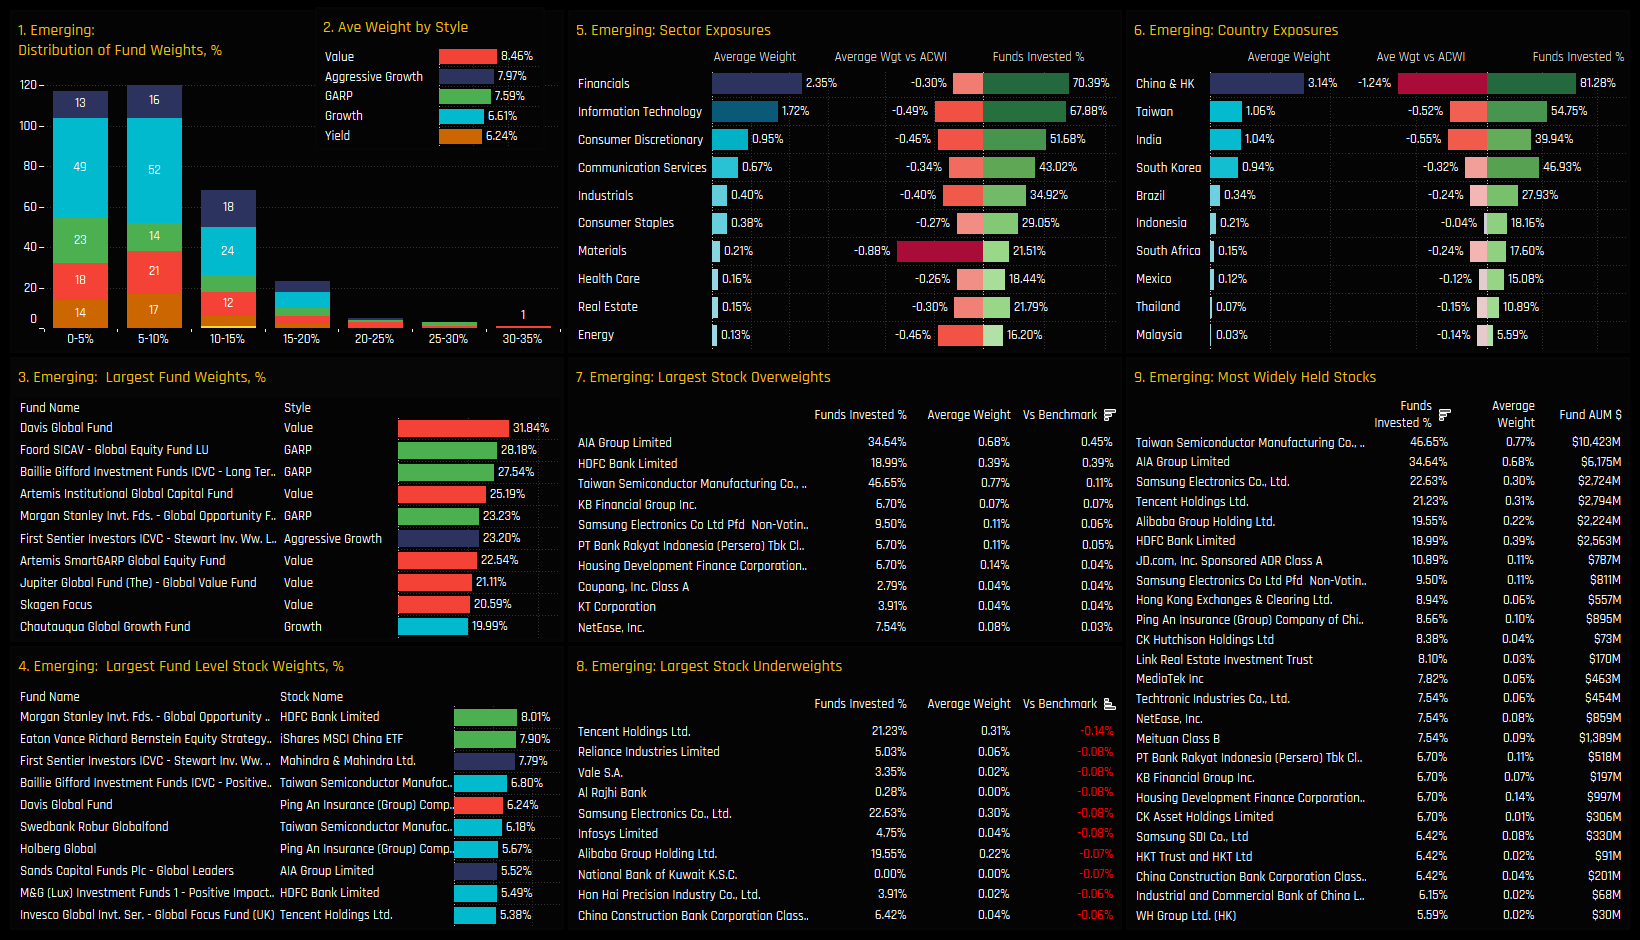
Where has this rotation left EM positioning? On a fund level, the majority of Global funds now hold less than a 10% stake in Emerging Market equities (ch1) with only a handful holding in excess of 20%, led by Davis Global (31.8%) and Foord Global Equity (28.2%). The Style split is fairly tight, with Value funds allocating 8.46% versus Yield on 6.24%, on average (ch2). Global funds start the year underweight in every EM sector on average, with EM Materials perhaps the standout with just 21.5% of funds invested and a net underweight of -0.88% (ch5).
On a country level, China & HK is the key underweight at -1.24% below benchmark, but it remains widely owned with 81.3% of the funds in our analysis invested. Other countries, notably India and Brazil are avoided by the majority, with all countries outside of the ‘top 5’ held by less than 20% of funds (ch6). Charts 7,8 and 9 show the aggregate stock holdings, with TSMC, AIA Group, Samsung Electronics and HDFC Bank among the most widely held and net overweights, whilst Tencent Holdings, Reliance Industries and Vale top the list of underweights.
Conclusions & Data Report
Among active Global funds, Emerging Market exposure has rarely been this low. On most measures of ownership, whether absolute or relative to benchmark, Global managers are not positioned for EM outperformance as they start the year. A big rotation out of China & HK, together with a decline in EM Tech exposure were the key drivers behind the moves lower.
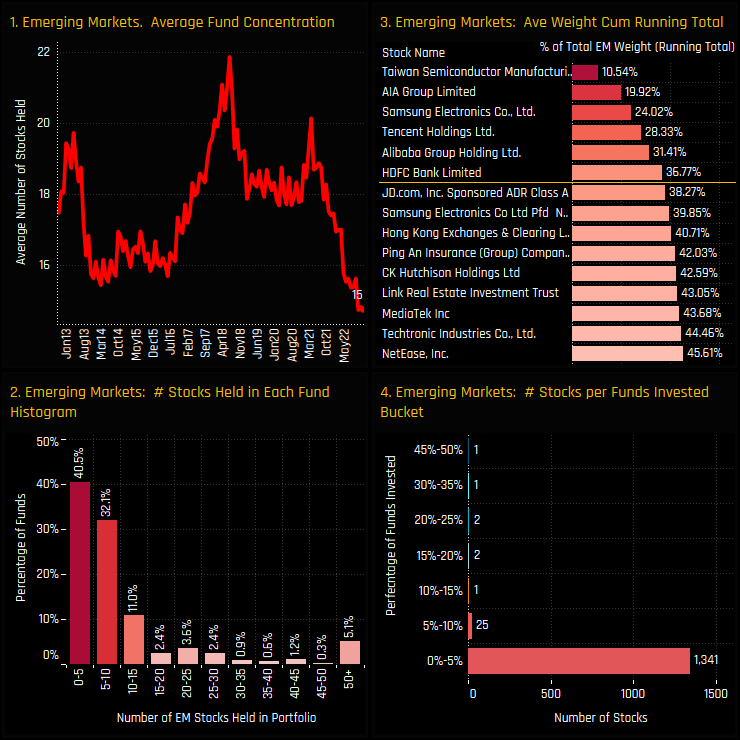
But it feels like more than that. It almost feels like Emerging Markets have been forgotten, with the focus switched to the USA over the last 3-years and specifically in megacap US Tech. The depth to the EM allocation has been reduced to just a handful of the larger index constituents. The chart set to the right puts some figures around this notion.
The average number of EM stocks held by the Global Funds in our analysis has dropped to an all-time low of 15
40.5% of funds hold less than 5 EM stocks in their portfolio, 72.6% hold less than 10.
The 6 most widely held stocks account for 36.7% of the total EM allocation
Only 32 EM stocks are held by more than 5% of the Global Funds in our analysis.
It certainly appears that Global managers are reluctant to make EM anything more than a fringe allocation. To be overweight EM here is the non-consensus trade, and to be overweight stocks outside the top 6 puts you in the clear minority. Either stance will deliver de-correlated returns versus an active peer group who are under-allocated as we head in to 2023.
Please click on the link below for the latest data report on EM positioning among active Global Funds.
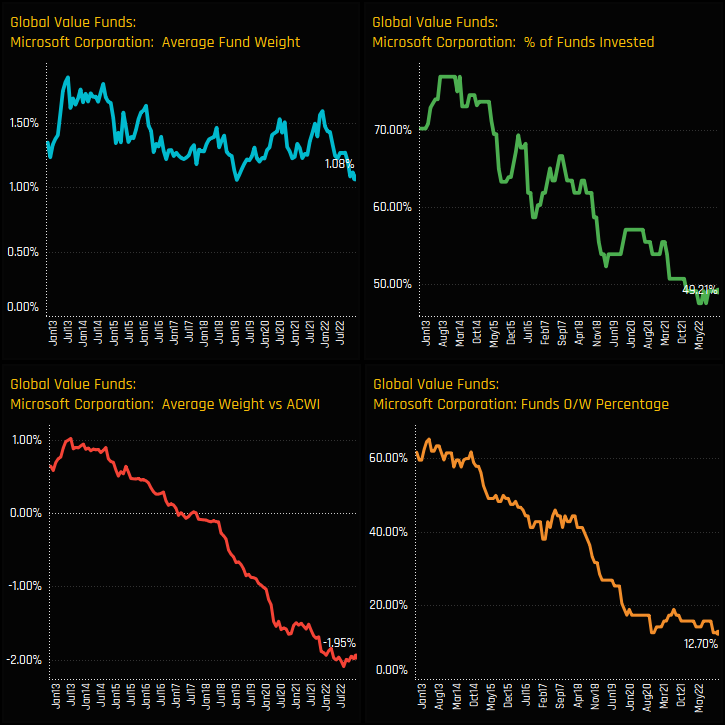
In this report, we look at the long-term ownership trends in Microsoft Corp.
Time-Series & Style Shifts
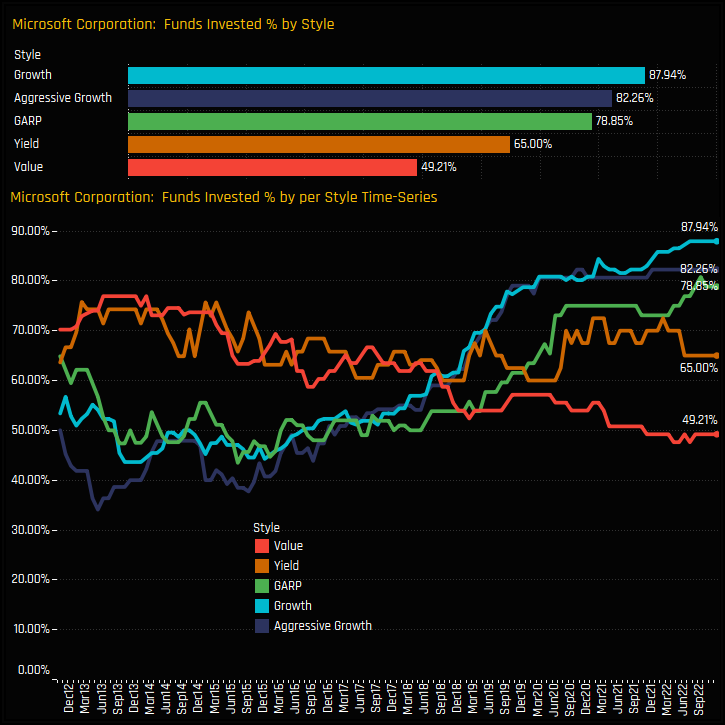
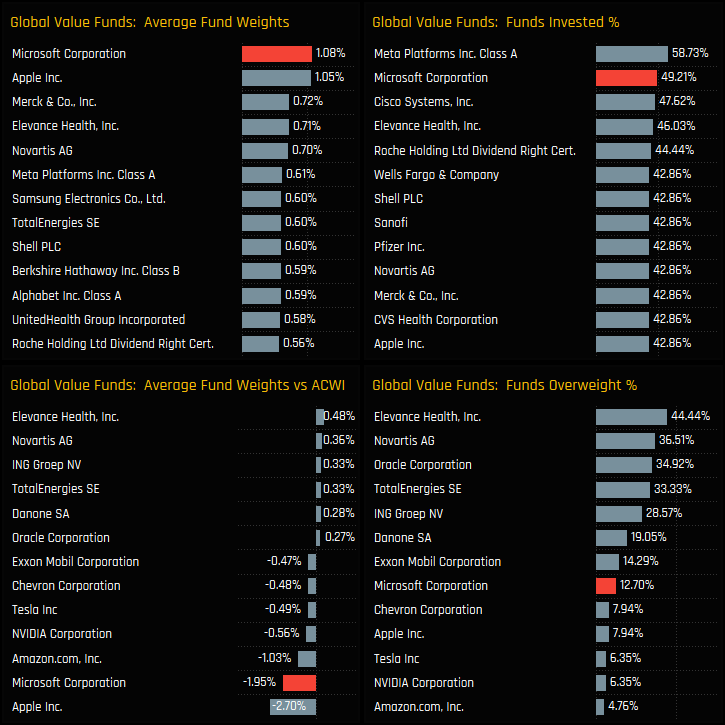
Ownership levels in Microsoft Corporation are at all-time lows among Global Value managers. The charts below show the ownership trends in Microsoft among the Global Value managers in our analysis. Average weights have fallen to record lows of 1.08%, with 49.2% of Value managers invested and just 12.7% overweight the SPDRs ACWI ETF.
This downward ownership trend goes against what we are seeing among the growth oriented strategies in our analysis. The percentage of Growth funds with a position in Microsoft stands at 87.9%, the highest on record, with Aggressive Growth and GARP funds not far behind.
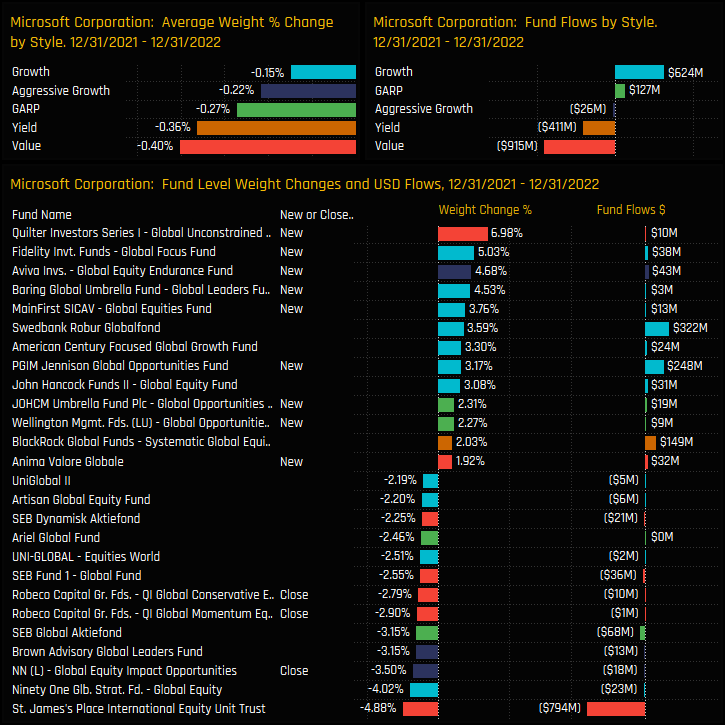
Fund Activity & Style Trends
Analysing allocation changes over the last 12-months, Value managers saw average weights fall the most of any Style group (-0.4%) following -$915m of fund outflows. On an individual fund level, the majority of the opening positions were among Growth and Aggressive Growth strategies, whilst Value funds from St. James Place and Robeco were among those to exit.
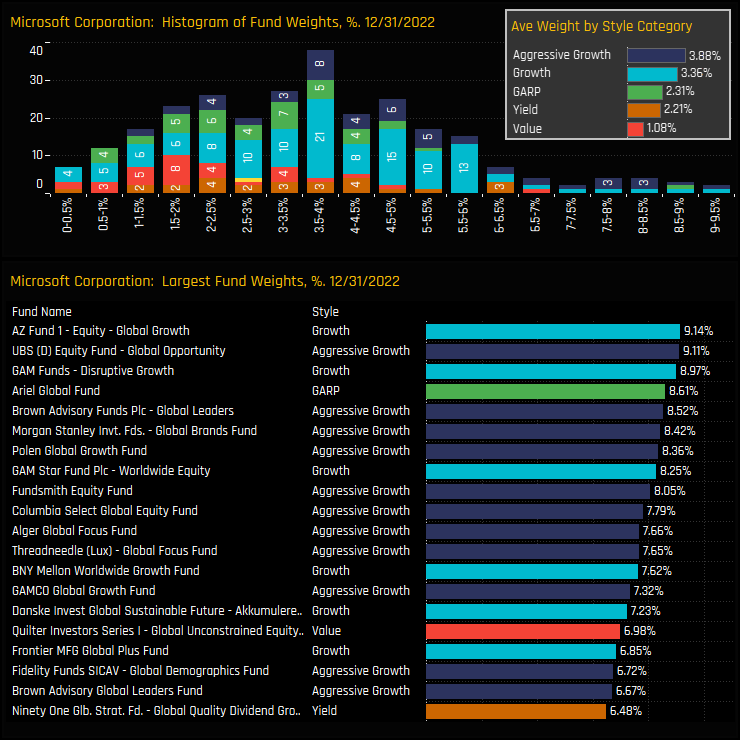
This leaves only a single Value manager (Quilter Global Unconstrained) in the top 20 fund holdings in Microsoft. Selected Growth and Aggressive Growth managers remain heavily invested, with 9 strategies allocating over 8% helping to push average weight above 3% for both Style groups.
Peer Group Positioning & Data Report
Despite this selling pressure, Microsoft remains the largest stock holding among Value managers on an average weight basis and the 2nd most widely held stock after Meta Platforms. Versus the benchmark, Microsoft is the 2nd largest underweight after Apple Inc, though we accept that Value managers may measure positioning versus a more Value oriented benchmark than the MSCI ACWI index.
Either way, the decline in Value fund exposure is a sure sign that valuations have become too high for the majority of Value managers to accept. Key to Microsoft’s future performance will be in it’s ability to generate Growth to satisfy the significant roster of Global growth investors, who remain heavily invested.
Please click on the link below for a data pack on Microsoft Positioning among active Global equity funds.
For more analysis, data or information on active investor positioning in your market, please get in touch with me on steven.holden@copleyfundresearch.com


