EM Active Fund 2023 Performance Review

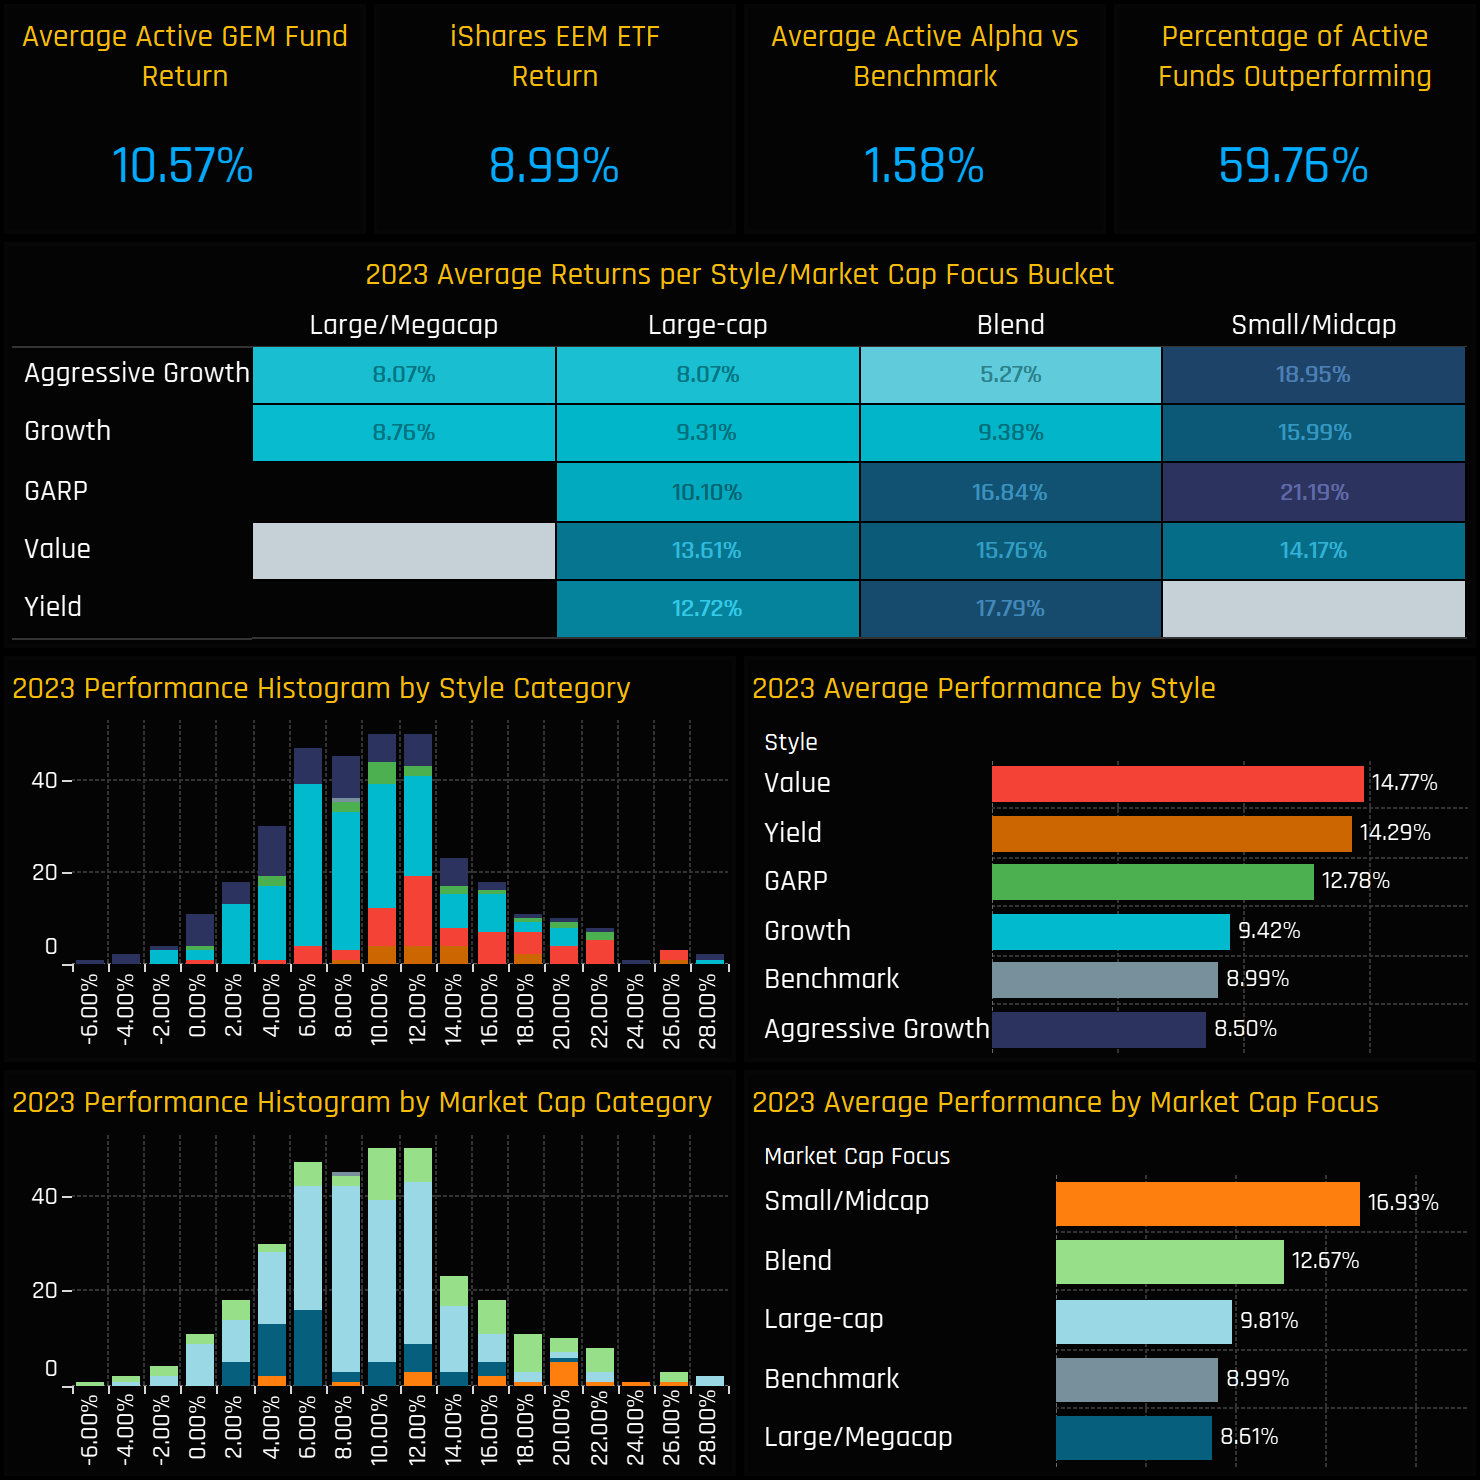
  • 2023 was a good year for active EM managers, as 60% outperformed generating +1.6% of alpha versus the tradable benchmark, on average.
  • Returns were driven higher by strong performance from Value and Small/Midcap managers, whilst high Growth struggled.
  • China & HK positions were costly, whilst LATAM and Technology contributed the most to outperformance.

2023 Fund Performance

Active EM funds had a good 2023. Average fund returns came in at a healthy 10.57%, ahead of the iShares MSCI Emerging Markets ETF by +1.58%, with 59.8% of funds outperforming. Broken down by Style, Value and Yield funds had the best year, averaging 14.77% and 14.29% respectively, with Aggressive Growth funds the only group to underperform the iShares MSCI EM return. From a Market Cap perspective, Small/Midcap funds were ahead by some margin, with 16.9% average returns compared to 8.6% for Large/Megacap. Across all funds, the core of the return distribution was between 6% and 12% on the year.
2023 Top Performers

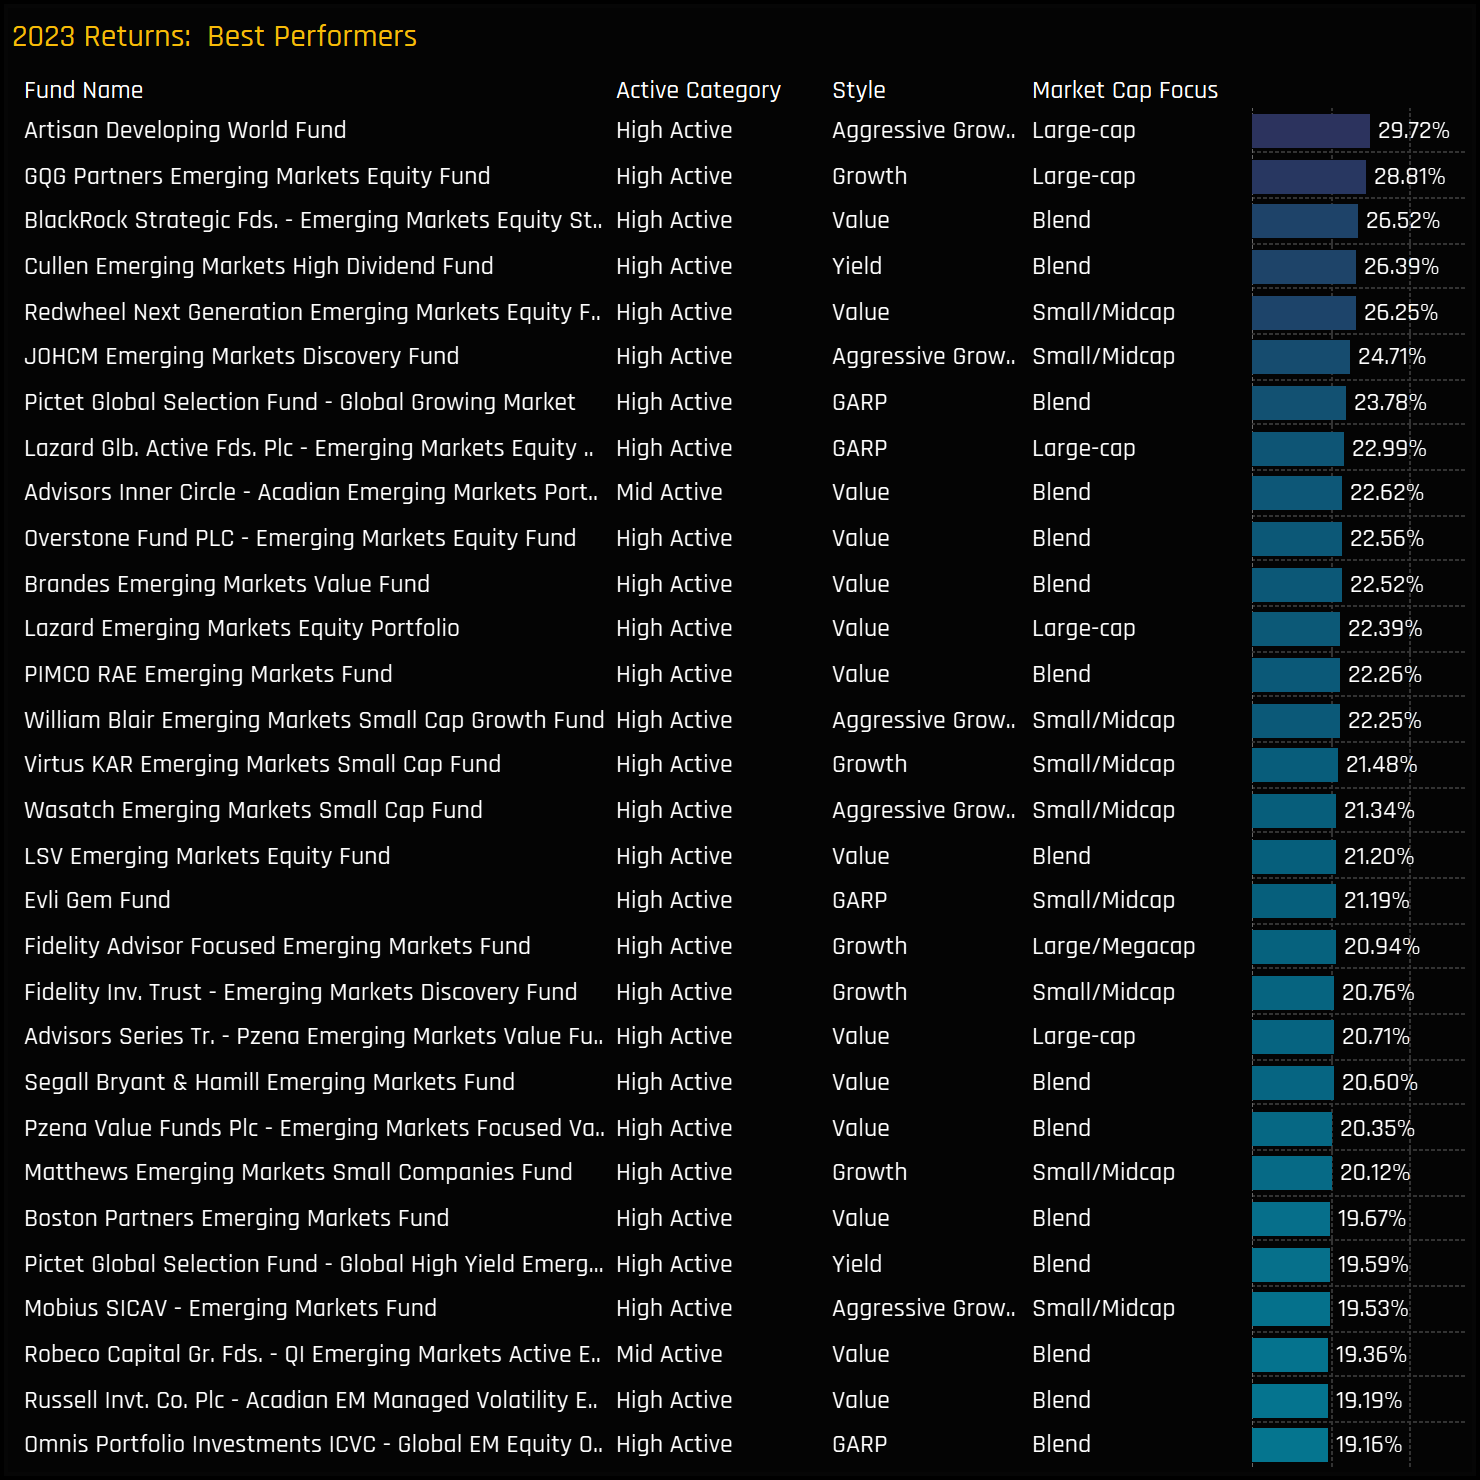
In 2023, 24 GEM funds achieved returns exceeding 20%. Leading the pack were Artisan Developing World at 29.7%, GQG EM Equity at 28.8%, and BlackRock’s Value/Blend EM Equity strategy at 26.5%. Notably, despite the list predominantly featuring Value strategies, the top two positions were secured by Growth-oriented funds. Our analysis indicates that both top performers diverged from conventional emerging markets strategies by incorporating high-growth developed market stocks with emerging market income streams.  

Artisan Developing World Fund

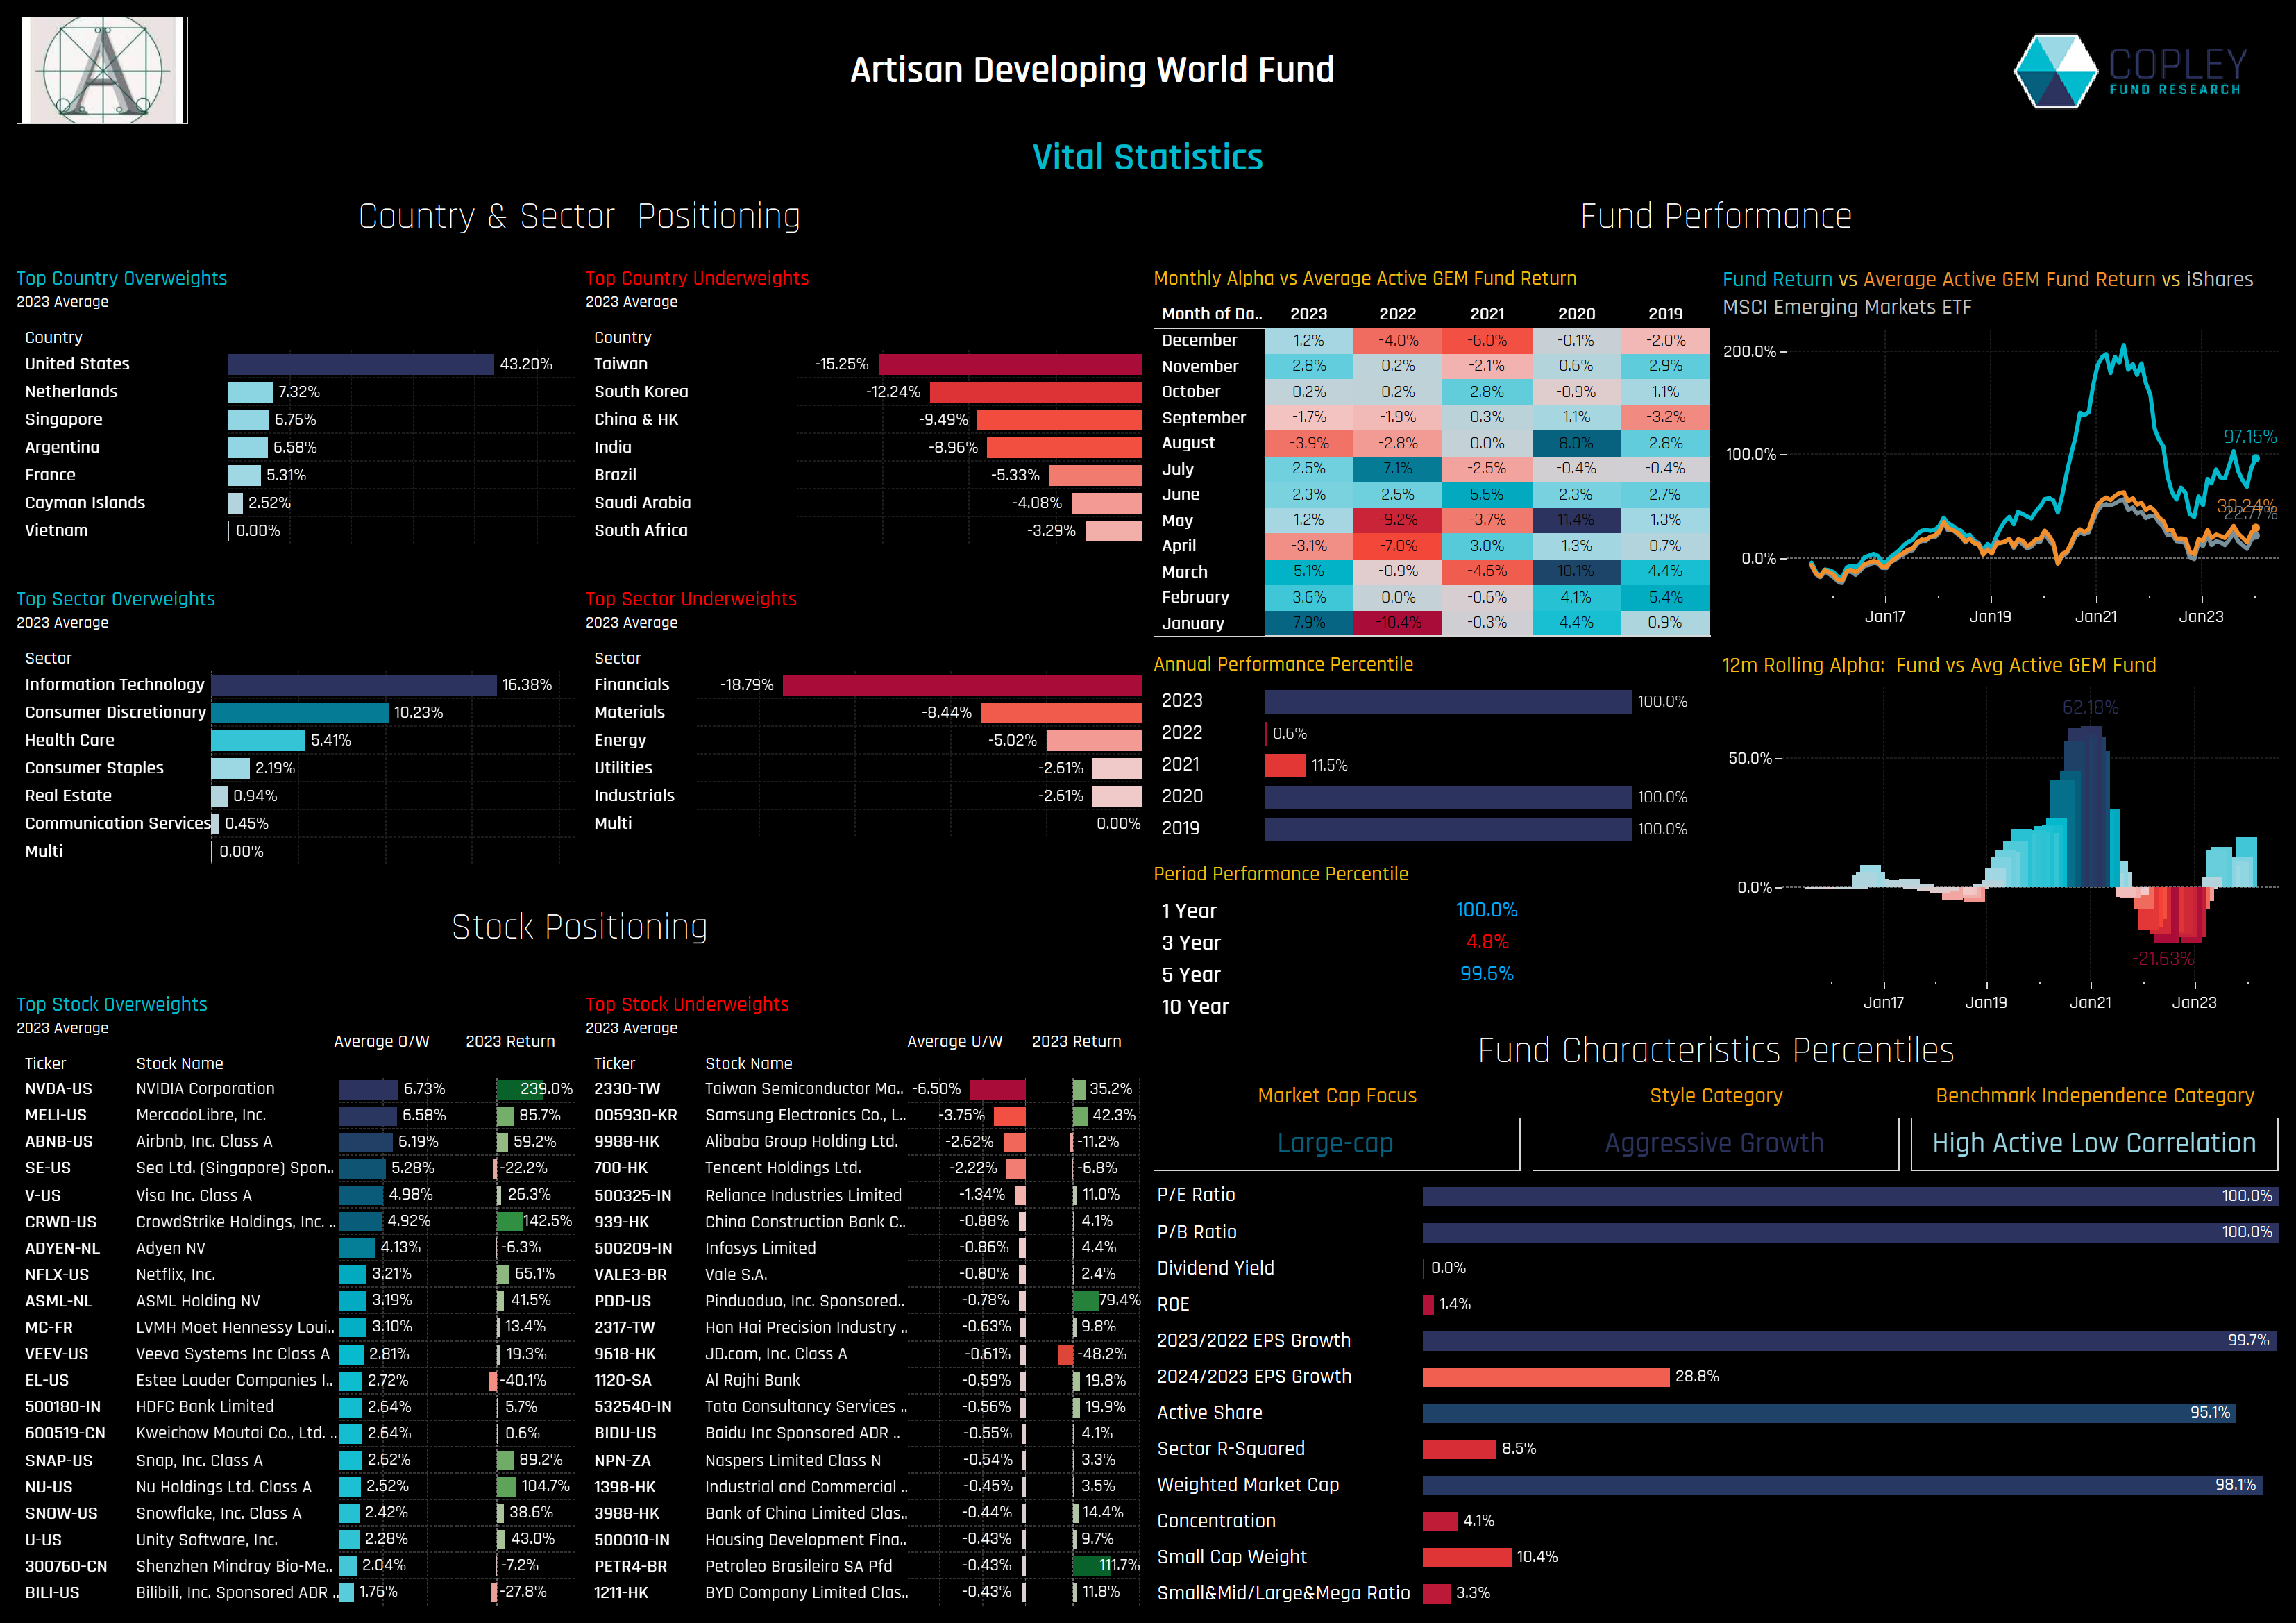
Artisan’s Developing World fund has topped the performance charts for another year, repeating the successes of 2019 and 2020, and rebounding strongly from its lower rankings in 2021 and 2022.  The fund, whilst benchmarked against the MSCI Emerging Markets Index, blends its investments in emerging markets with a significant allocation to developed market stocks, especially those generating substantial income streams from emerging market countries.  As such, the fund held all major Emerging Market countries as significant underweight positions through 2023, led by Taiwan (average underweight of -15.25%), South Korea (-12.24%) and China & HK (-9.49%).  Instead, it held an average overweight in US stocks of 43.2% over the year, and 65% in Developed Market securities overall. The fund’s strategy is geared towards high growth, and it has the highest P/E and P/B ratios among the 365 EM funds in our analysis. Returns last year were driven by strong performance in key holdings such as NVIDIA, MercadoLibre and CrowdStrike Holdings, whilst also avoiding the key EM underperformers of Alibaba and Tencent.  

Active vs Passive in EM

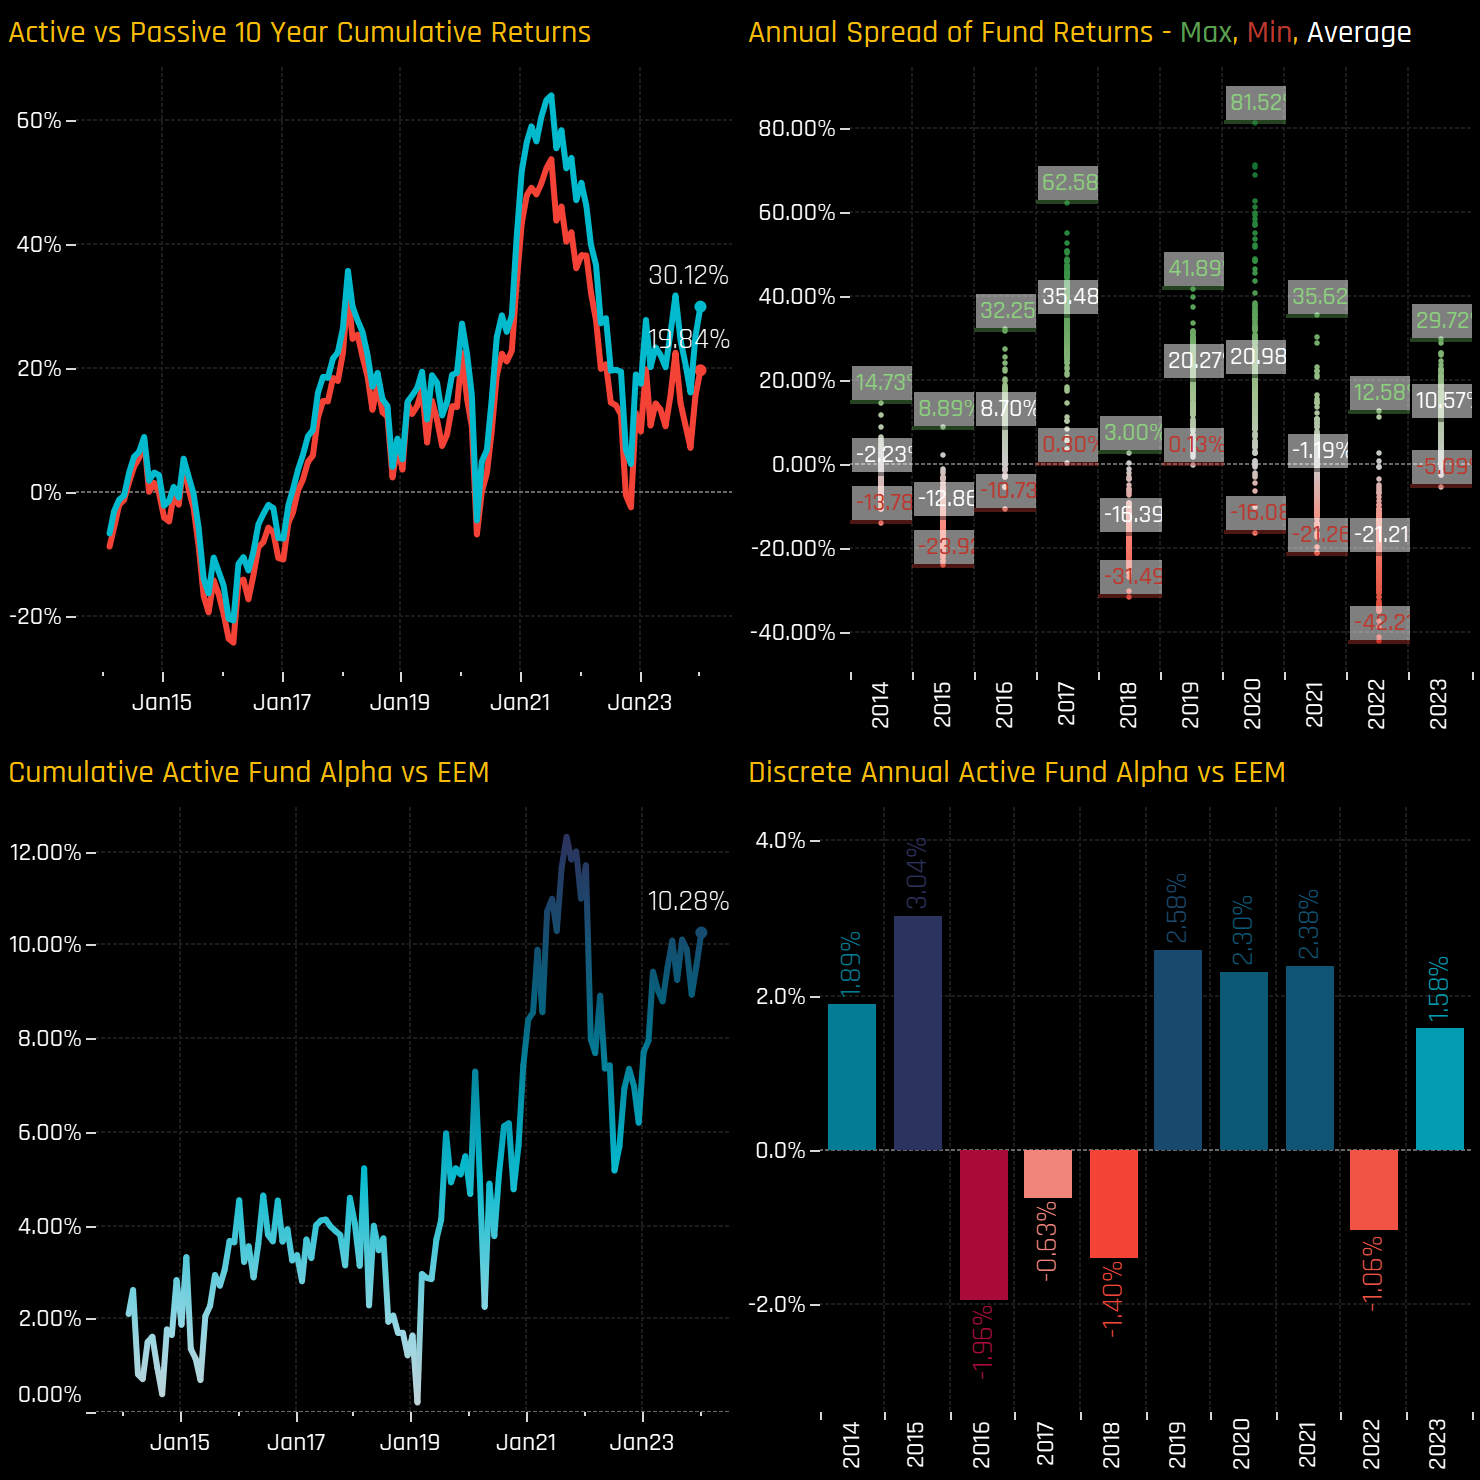
The spread between the highest and lowest returns on the year was 34.8%, with fewer occurrences of extreme outperformance than in 2020 or of extreme underperformance than in 2022. Cumulative 10-year returns for the active EM funds in our analysis stands at 30.12% versus 19.84% for the iShares MSCI EM ETF.

On an discrete annual basis, 2023 was the 4th year of outperformance for EM funds over the last 5-years.  This year’s +1.58% alpha helped push 10-year cumulative outperformance over the iShares MSCI Emerging Markets ETF to +10.28%.

The Drivers of Outperformance

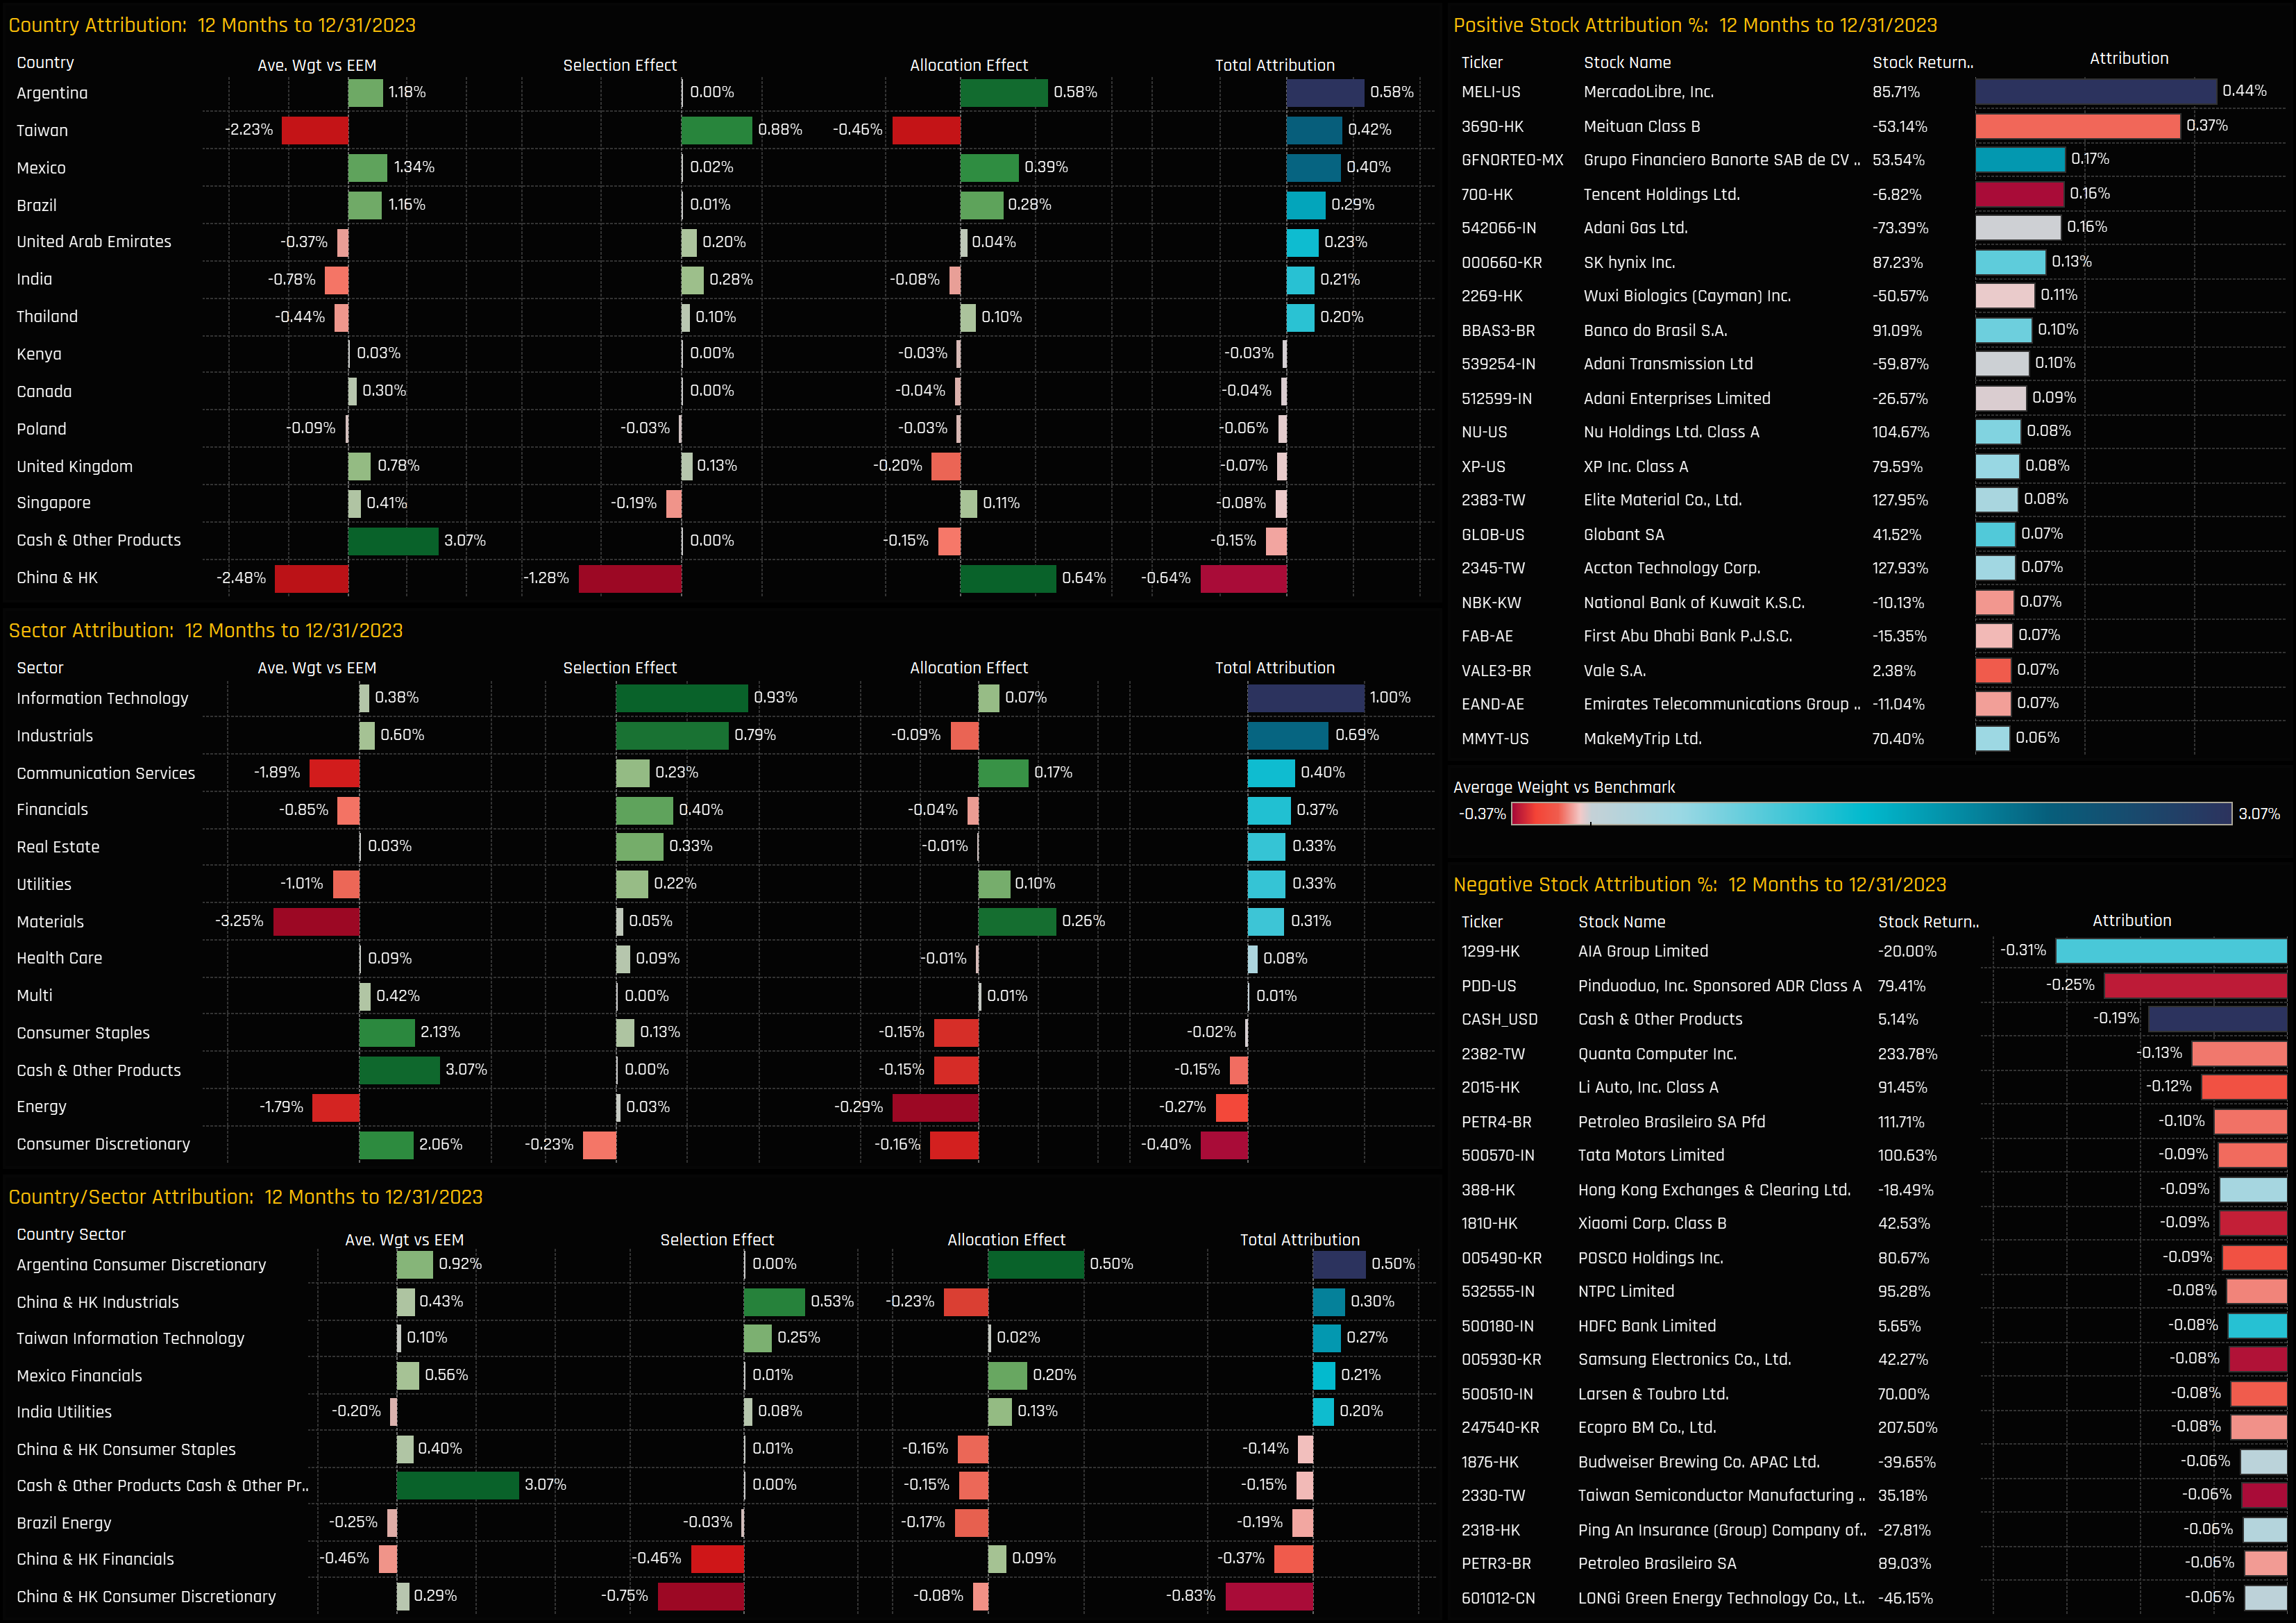
How did active EM managers outperform last year?  We perform attribution analysis on a portfolio based on the average holding weights of the 365 individual strategies in our analysis, versus a representation of the benchmark based on the iShares MSCI Emerging Markets ETF. As expected, and mirroring the outperformance seen in actual fund returns last year, the portfolio outperformed by +2.67% in 2023.  The winning positions on the year include LATAM overweights, China & HK underweights and excellent stock selection in Technology and Industrials. These positions far outweighed losses stemming from underweights in Taiwan, Cash Holdings and poor stock selection in China & HK.


Analysis taken from our Emerging Markets positioning research, covering 365 active strategies with a combined AUM of $400bn.  For more information on our research, contact me directly on the email below.


Terms and Conditions

Investor Positioning Report — Copley Fund Research Ltd  ·  Last updated: July 2026  ·  Registered in England and Wales

1. Who we are

Copley Fund Research Ltd provides proprietary institutional fund intelligence to listed companies and investor relations professionals. These terms govern every purchase of an Investor Positioning Report. By completing a purchase you confirm you have read, understood, and agreed to these terms in full.

2. What you are purchasing

The Investor Positioning Report is a bespoke PDF report mapping the institutional fund universe around your stock. It covers current investors, past investors, competitor investors, and white space investors. Every report is built from scratch for the specific company ordered and is not a standardised or templated product.

3. Delivery and process

Following payment or invoice issuance, Copley Fund Research will contact you within one working day to agree your competitor set. Production begins once the competitor set is confirmed in writing. The completed report will be released to you within 48 hours of production starting, provided payment has been received in full; where payment is outstanding, the report will be withheld until payment clears. If the requested company falls outside our covered fund universes, or a competitor set cannot be agreed, Copley Fund Research will issue a full refund or cancel the outstanding invoice.

4. Competitor set agreement

The competitor set is agreed with you in writing prior to production, and the report is built to that agreed specification. Requests to amend the competitor set after delivery, based on a change of preference rather than an error, may be treated as a new order.

5. Refund policy

Because each report is produced individually for your company, orders are non-refundable once production has begun, except as set out in clauses 3 and 5a below. By purchasing, you agree not to dispute the charge with your card provider on the basis that the service was not as described, provided the report has been delivered to the agreed specification or corrected under clause 5a.

5a. Quality remedy

If a delivered report contains a material error caused by Copley Fund Research — for example, an incorrect company analysed, a competitor omitted from the agreed set, or content missing from the specification in clause 2 — Copley Fund Research will correct and redeliver the report at no additional charge, within a reasonable timeframe. This is your sole remedy for such errors.

6. Data and accuracy

All fund positioning data in the report reflects holdings as disclosed at the most recently available reporting date at the time of compilation. The timing of fund holdings disclosures is determined by regulatory requirements applicable to each fund and is outside the control of Copley Fund Research Ltd. This data may not reflect current fund positions. Copley Fund Research takes reasonable care to ensure accuracy but makes no warranty, express or implied, as to the completeness or current accuracy of the underlying data — though this does not affect the quality remedy in clause 5a for errors in how that data was analysed or presented. Past fund positioning is not indicative of future fund behaviour or investment decisions.

7. Not investment advice

The Investor Positioning Report is produced for investor relations intelligence purposes only. It does not constitute investment advice, financial advice, or a recommendation to buy, hold, or sell any security. The data reflects historical fund positioning and must not be relied upon as a prediction of future fund behaviour or investment decisions. Copley Fund Research Ltd is not authorised or regulated by the Financial Conduct Authority for the provision of investment advice.

8. Permitted use and confidentiality

The report is licensed for internal use by the purchasing organisation only. You may share it with employees and directors of your organisation. You may not: reproduce, redistribute, publish, or resell the report or any part of it; share it with any third party outside your organisation without prior written consent; use the fund or portfolio manager names contained in the report to approach those individuals on behalf of Copley Fund Research or in a manner that could damage Copley Fund Research's relationships with those funds; or use the data for any purpose other than your own investor relations strategy. The data, analysis, and methodology contained in the report are the intellectual property of Copley