Asia Ex-Japan Fund Positioning Analysis, June 2023
India: Outperformance Potential in Doubt
Samsung Electronics: Return of the King
Asia Ex-Japan Stock Radar
86 Asia Ex-Japan Equity Funds, AUM $54.5bn
India: Outperformance Potential in Doubt
India moves to the 2nd largest country underweight in the Asia Ex-Japan region as managers reassess overweight exposure.
Time-Series & Country Rotation
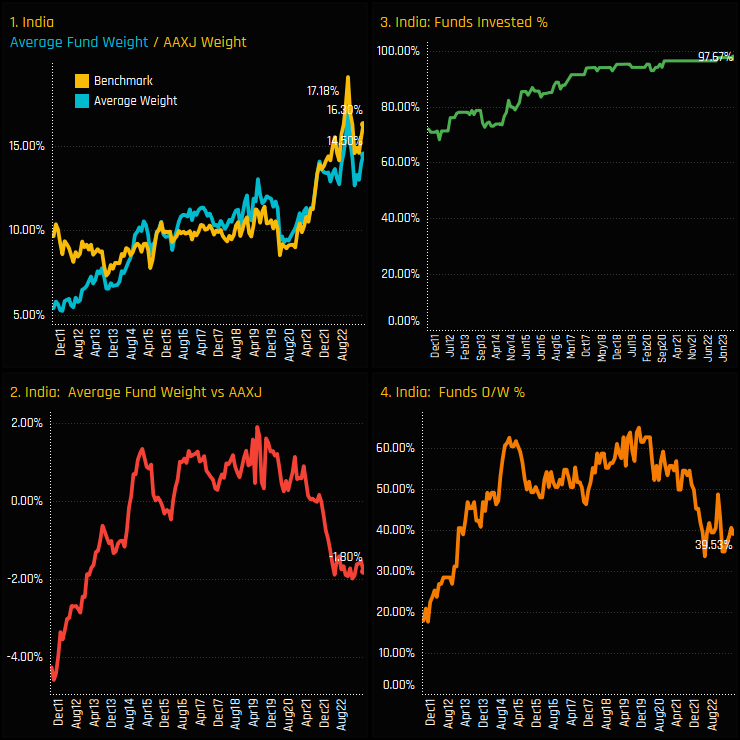
The growth of Indian exposure among Asia Ex-Japan investors has been fairly consistent over the last decade, and can be seen in chart 1 below. From just over 5% in 2011, today’s average fund weight of 14.5% is the 5th highest observation in our 142 month holdings history, albeit someway from the brief high of 17.2% in October 2022. Versus the benchmark, India’s journey has been less uniform. A key country underweight in the pre-Modi era (ch2), active managers switched to overweight during his first years in office and maintained this stance through to September 2021. Since then however, active managers have moved to an underweight stance, with 60.5% of managers positioned underweight at an average -1.8% below the iShares MSCI Asia Ex-Japan ETF.
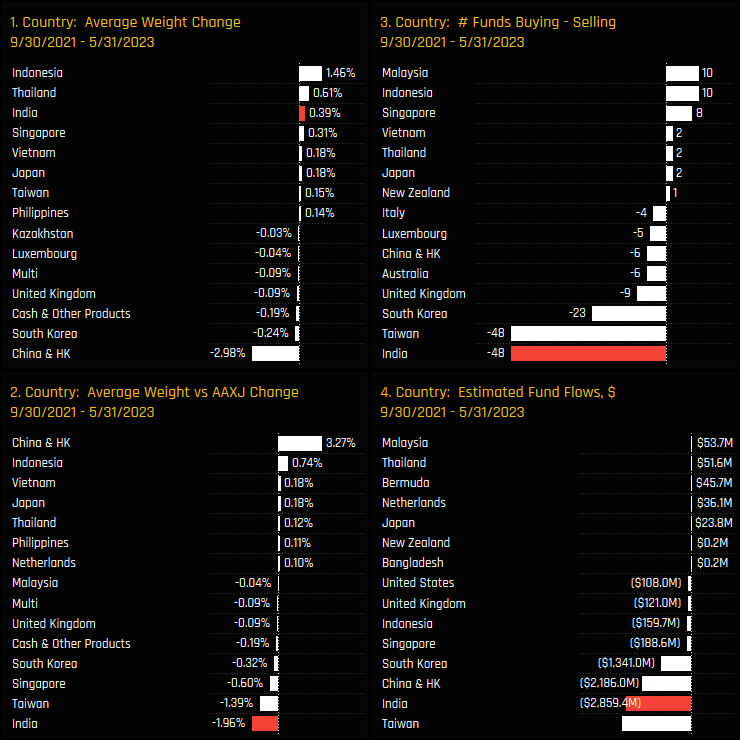
Since the last time Asia Ex-Japan managers were positioned overweight in September 2021, India has been the victim of some fairly aggressive manager rotation. The charts below document the changes in our ownership metrics between 09/30/2021 and 05/31/2023. As India outperformance pushed average weights higher by 0.31% (ch1), active managers sold in to this strength. A net 48 managers sold down Indian positions over the period (ch 3) with an total -$2.85bn of fund outflows. This pushed positioning relative to the iShares MSCI Asia Ex-Japan ETF lower by -1.96%, the largest decrease of any country over the period, with managers reducing underweights in China & HK in the process.
Sector Activity & Long-Term Positioning
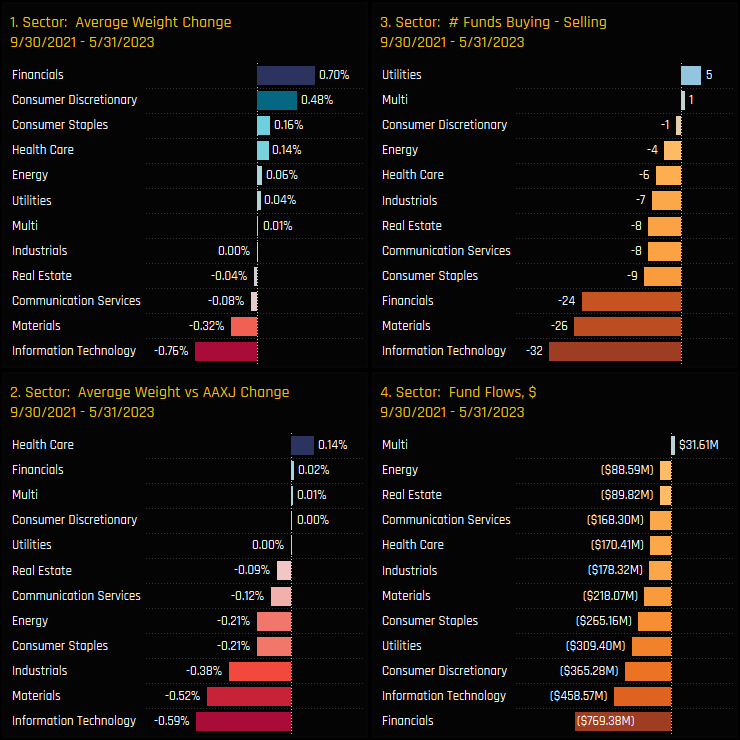
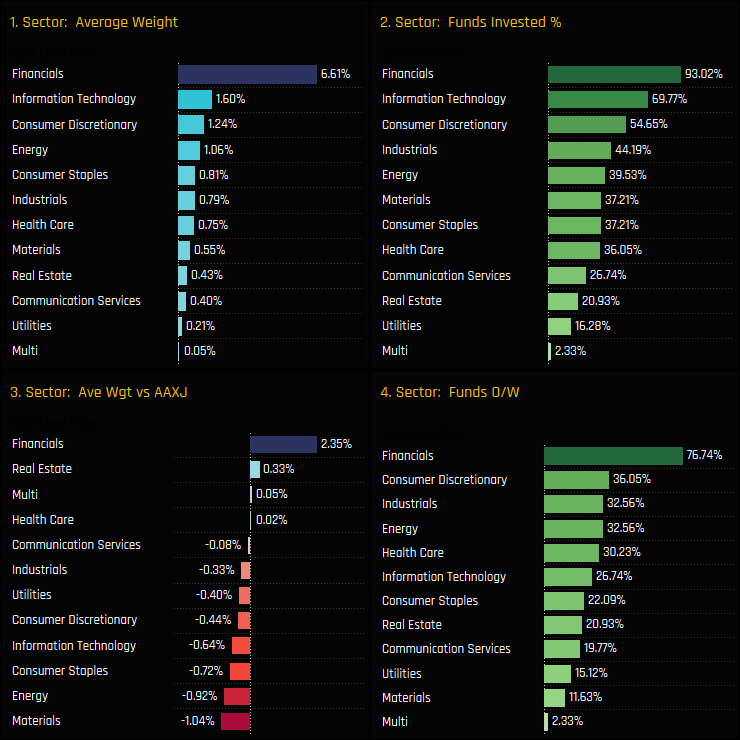
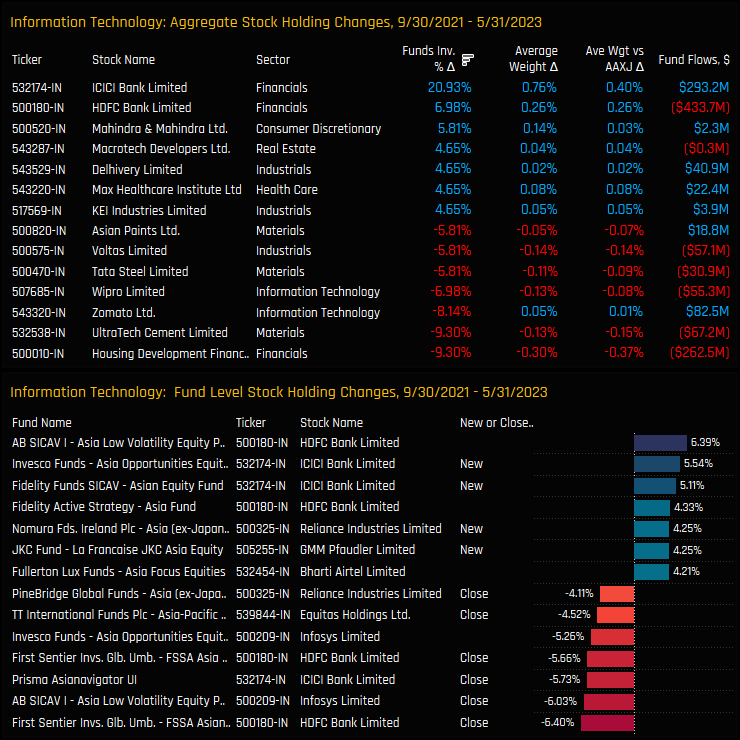
The below charts break down these Indian positioning changes by sector between 09/30/2021 and 05/31/2023. Whilst average weights in Financials and Consumer Discretionary increased in absolute terms (ch1), relative to benchmark, most sectors saw positioning decline, led by Information Technology, Materials and Industrials (ch2). Indian Technology stocks in particular took the brunt of the rotation, with absolute and relative declines the highest among sector peers after some heavy selling by active Asia Ex-Japan managers.
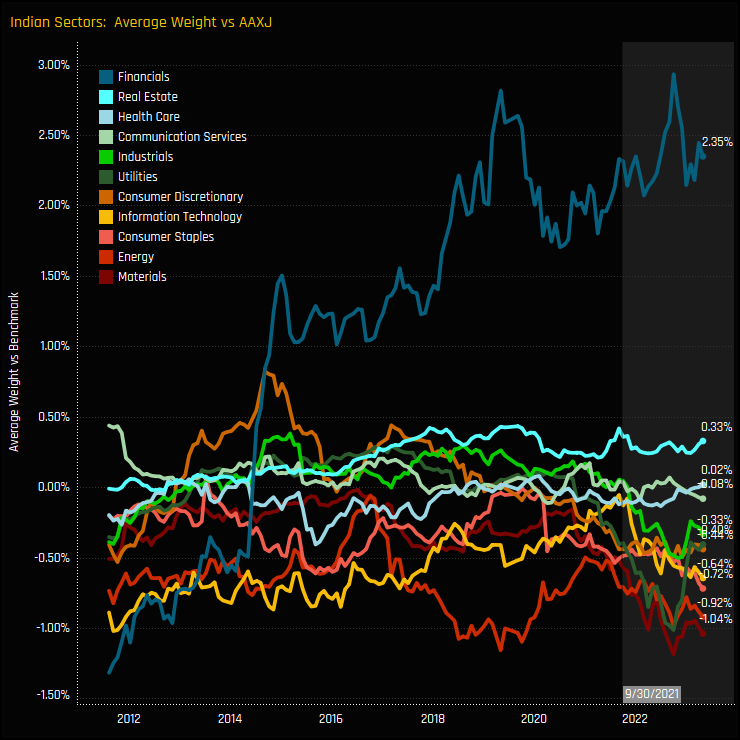
The long-term trends in Indian sector positioning versus the iShares MSCI Asia Ex-Japan ETF are shown in the chart below. Financials have been a long-standing overweight and remain so today, whilst underweights in Materials, Energy and Consumer Staples are towards their highest levels on record.
Latest Sector & Stock Positioning
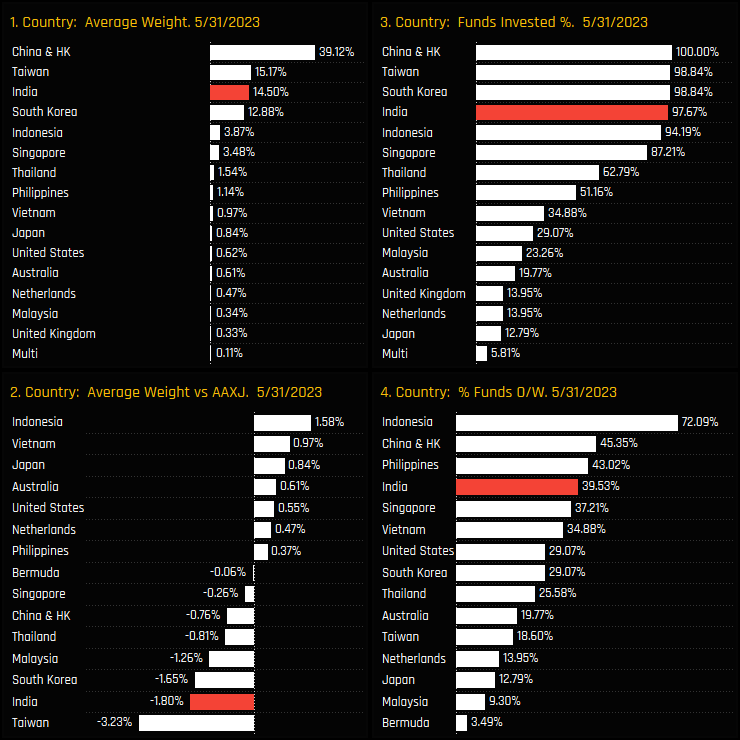
The latest stats for Indian sector ownership as of 05/31/2023 are shown in the chart quadrant below. Financials are the dominant sector by some margin, with average fund weights over 4% ahead of the chasing pack of Information Technology, Consumer Discretionary and Energy. This is a different stance from the benchmark, who hold these sectors much closer together in weight. As such, Financials represent a key overweight for active investors, with over 3/4 of the managers in our analysis positioned above the index, whilst the majority are underweight Indian Materials, Utilities and Communication Services.
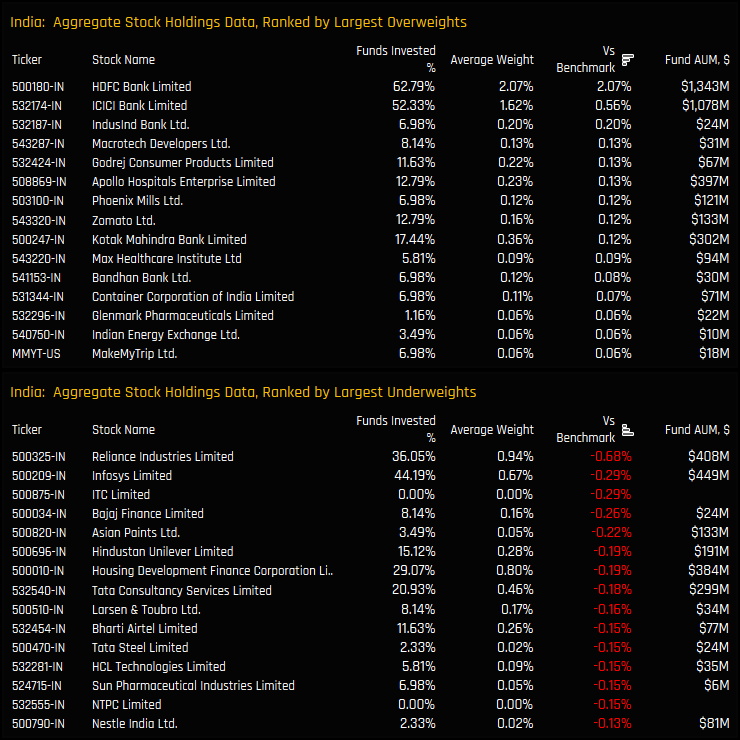
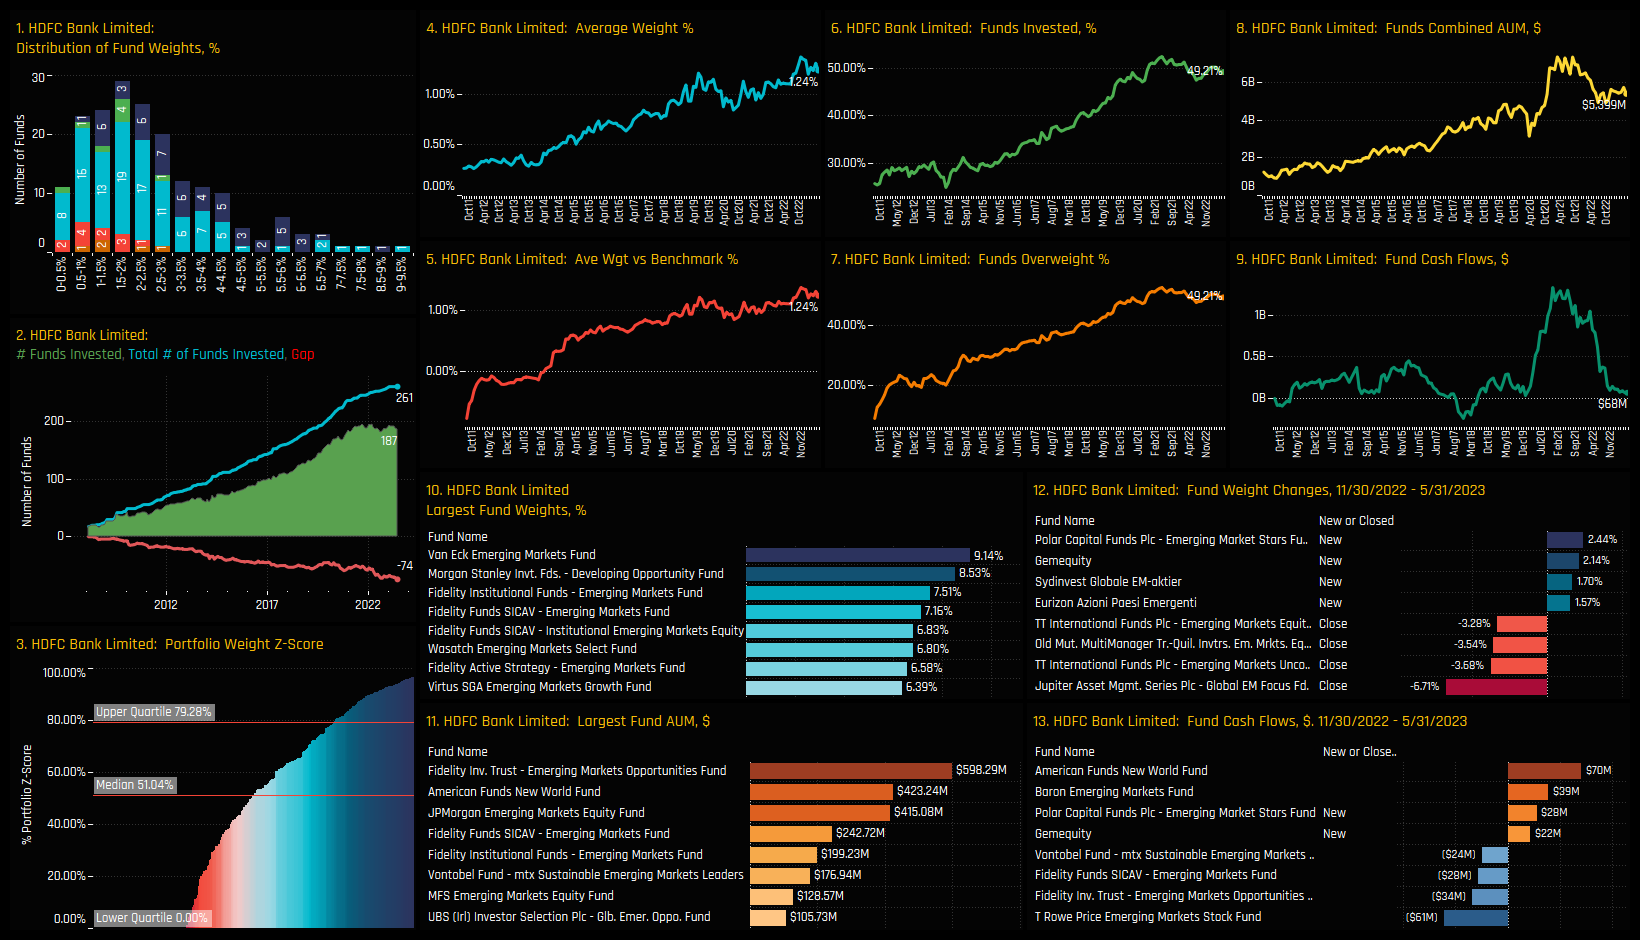
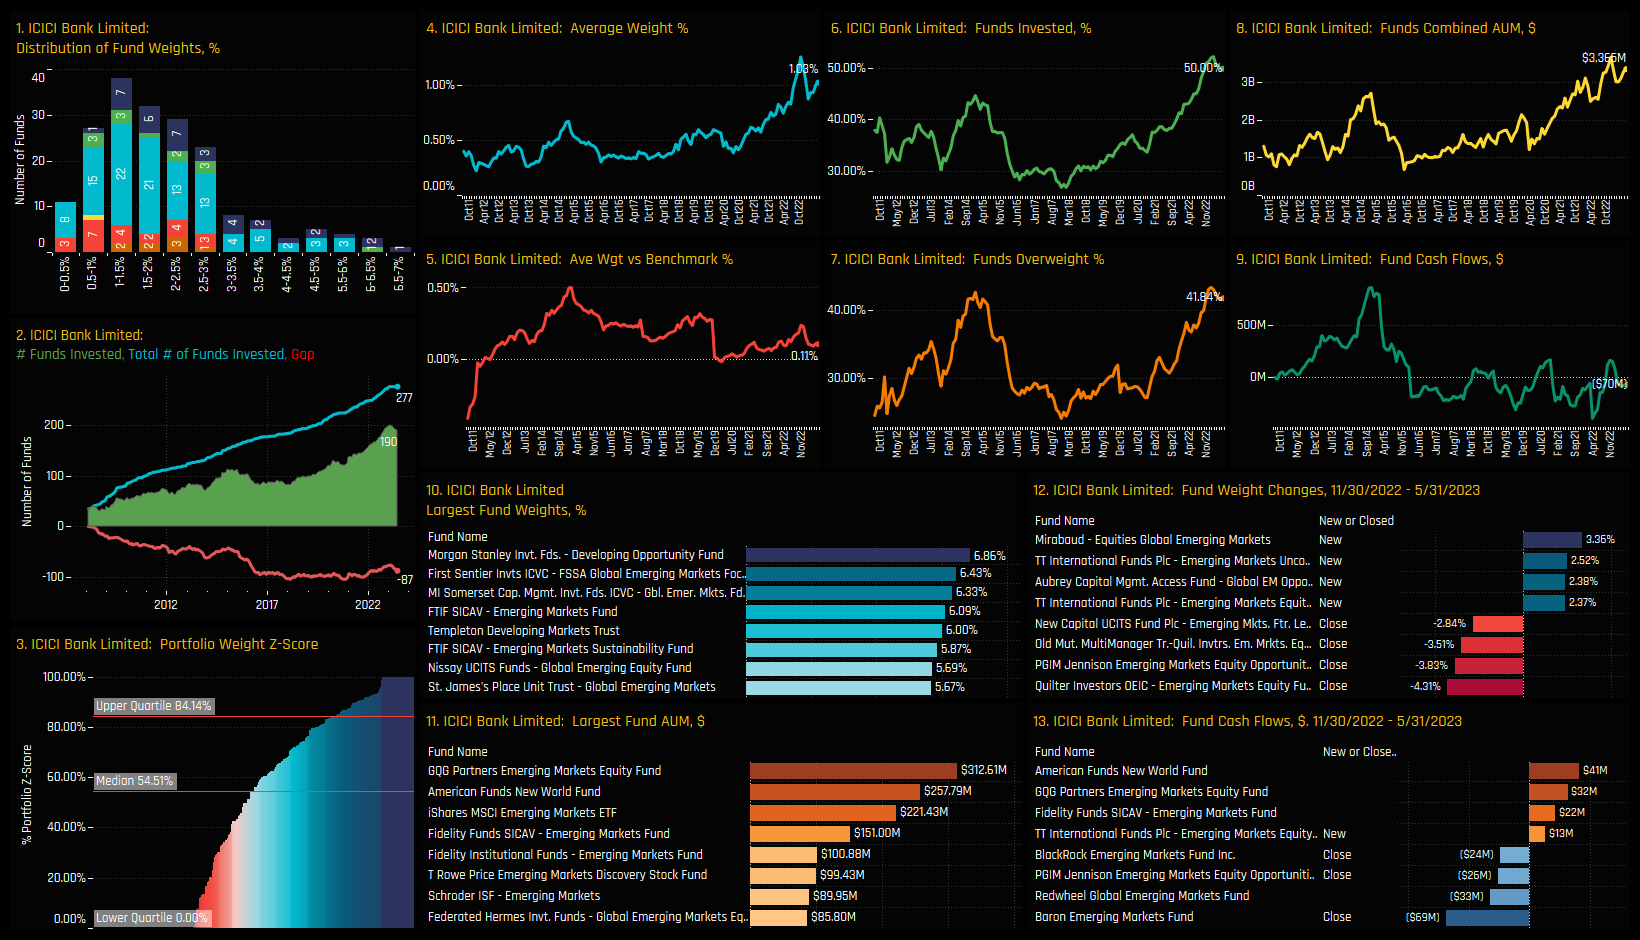
On a stock level, the largest net overweights and underweights are split in the 2 charts below. Overweights are led by out-of-benchmark HDFC Bank, a stock owned by 62.8% of managers at an average weight of 2.07%. ICICI Bank also stands out as a well owned stock held above benchmark on average. The underweights are led by Reliance Industries and Infosys, though these stocks are quite widely owned, in addition to the totally avoided ITC Limited and the lightly owned Bajaj Finance Limited.
Fund Holdings & Activity
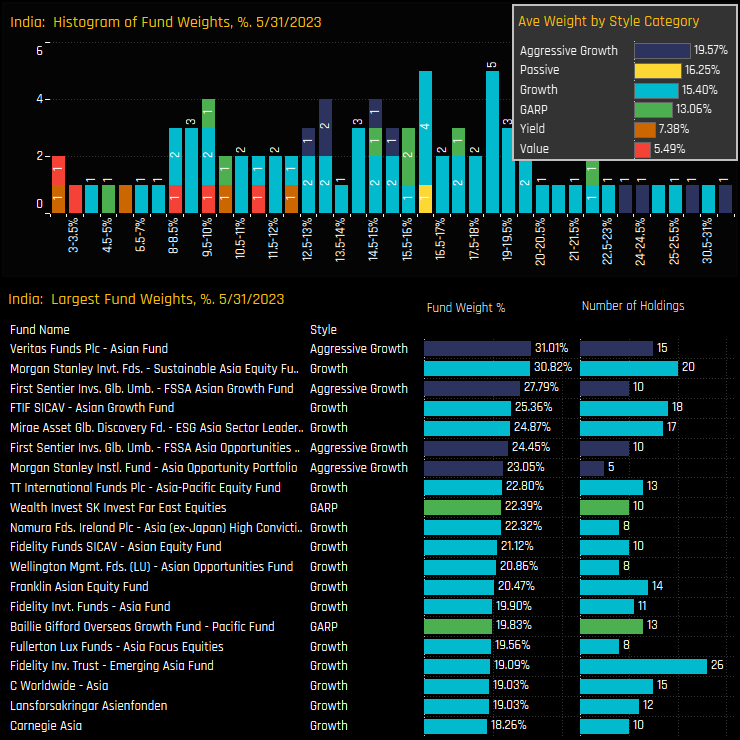
The histogram of fund weights in India is fairly evenly spread, with half of the managers in our analysis holding between a 10.5% and 18.1% weight. Those with a higher stake include the Veritas Asian Fund (31%) and Morgan Stanley Asia Equity (30.8%), whilst Hermes Asia Ex-Japan and Value Partners High Dividend hold less than a 1% stake. Split by Style, only Aggressive Growth funds are positioned overweight the benchmark, on average.
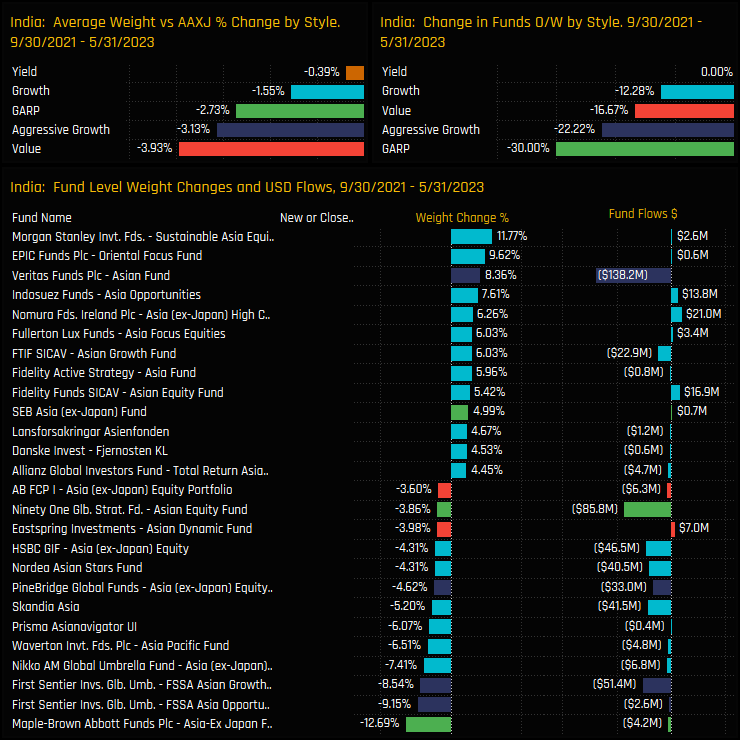
Fund level changes between 09/30/2021 and 05/31/2023 saw some significant rotation from selected funds, with Maple Brown Abbot and First Sentier among the heavy sellers versus Morgan Stanley and EPIC Funds the big buyers. With the benchmark weight in India increasing by +2.36% over the period, all Style categories saw their relative weights decrease on average, with fewer funds positioned overweight as a result.
Stock Holdings & Activity
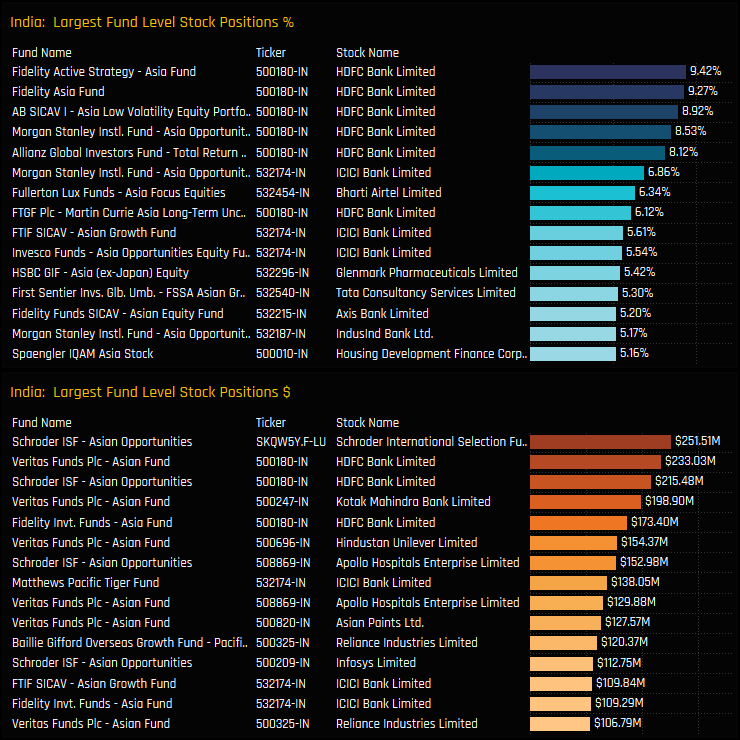
On an individual fund level, the larger stock holdings in percentage terms are in HDFC Bank Limited (Fidelity, Alliance Bernstein, Morgan Stanley) and ICICI Bank (Morgan Stanley, Templeton, Invesco). On a USD basis, positions from the larger funds in our Asian analysis such as Schroders Asian Opportunity, Veritas Asian Fund and Fidelity Asia dominate the bottom list across a number of companies.
Aggregate changes in stock holdings between 09/30/2021 and 05/31/2023 are shown in the top chart below. The total increase in Indian underweight was -1.96% over this period, and the stocks at the bottom half of the chart were the main drivers behind this, led by Housing Development Finance Corp, UltraTech Cement and Zomato Ltd. ICICI Bank was the standout on the positive side, attracting a further 20.9% of funds as overweights increased by +0.40%.
Conclusions
India remains a key holding for active Asia Ex-Japan managers. The charts below show the latest country level ownership statistics for the 86 active Asia Ex-Japan funds in our analysis. India is the 3rd largest weight (ch1) and the 4th most widely held country exposure behind China & HK, Taiwan and South Korea (ch3). But what is clear from our analysis is that managers are becoming less comfortable in holding India as an overweight position, with activity over the last 3-years moving India to the 2nd largest country underweight in Asia Ex-Japan, something that may have seemed unfeasible a few years ago.
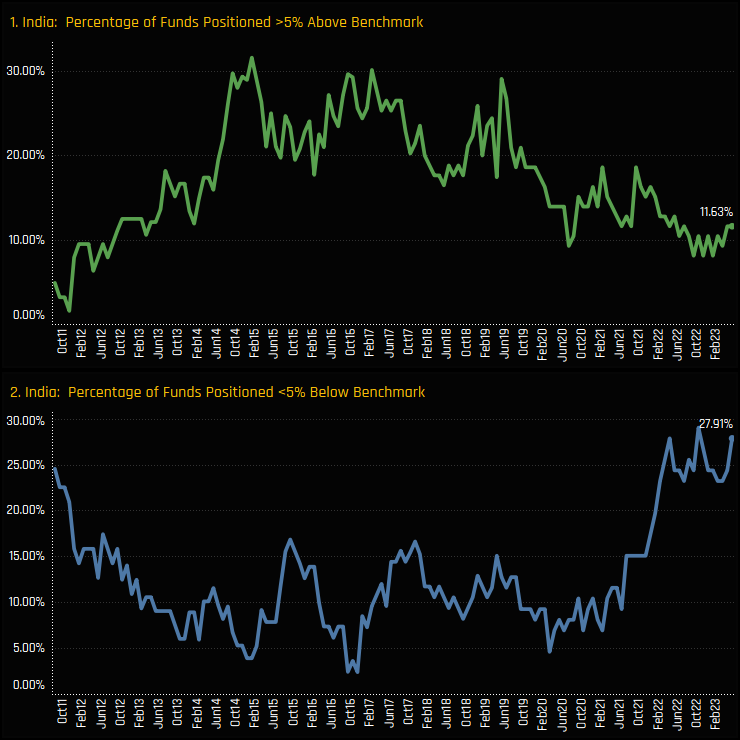
It’s not a slam dunk consensus underweight by any stretch, with 39.5% of funds still positioned overweight, but the averages have been skewed lower by funds taking a less extreme view at the top end, and a more extreme view at the bottom end. We can see this in the charts below, which plot the percentage of funds with a position 5% greater than the benchmark (green) and the percentage of funds with a position 5% lower than the benchmark (blue). In essence, there are fewer funds taking large overweight positions and more taking large underweight positions. Both point to the undeniable fact that active Asia Ex-Japan managers are less certain that India will outperform in the coming months.
Links & Stock Profiles
Click on the link to the right for an extended data report on Indian positioning among active Asia Ex-Japan equity funds. Scroll down for stock profiles on HDFC Bank Limited,
After a brief flirt with underweight in late 2022, active Asia Ex-Japan managers rotate back in to Samsung Electronics, pushing allocations towards record highs.
Time-Series & Stock Positioning
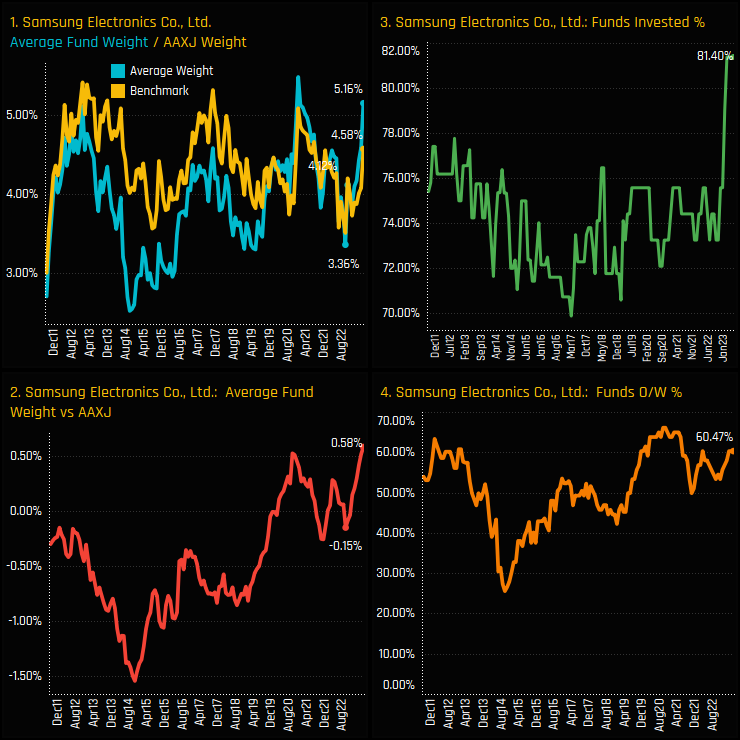
Asia Ex-Japan funds have increased ownership in Samsung Electronics to their highest levels on record. Samsung suffered something of a conviction crisis late in to last year, as average holding weights plunged to just 3.36% (ch1), or underweight the iShares MSCI Asia Ex-Japan ETF by -0.15% (ch2). But since then, fund managers have ramped up allocations, with the percentage of funds with exposure to Samsung Electronics spiking to a record 81.4% over the course of the last 6-months (ch3). We are now in a period where 60.5% of managers are positioned overweight (ch4).
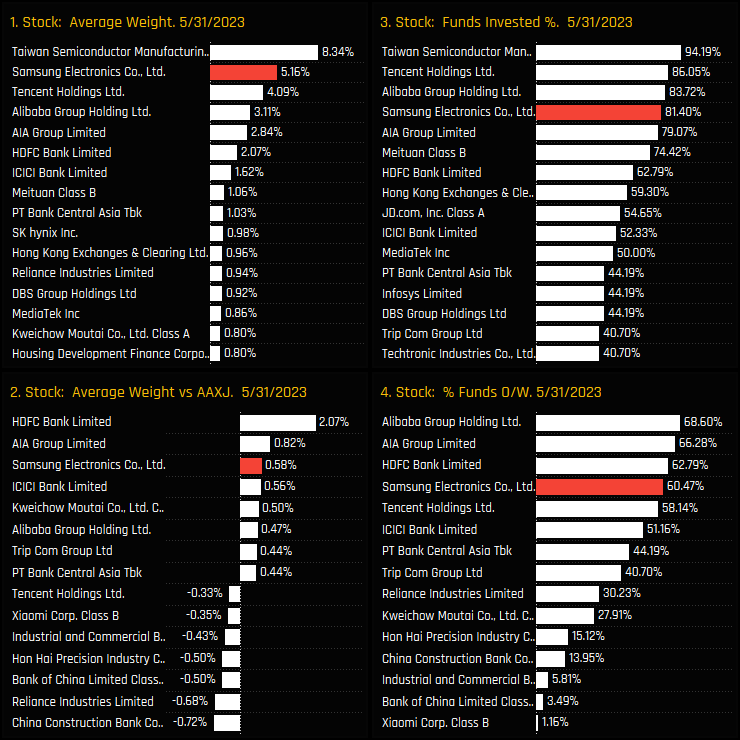
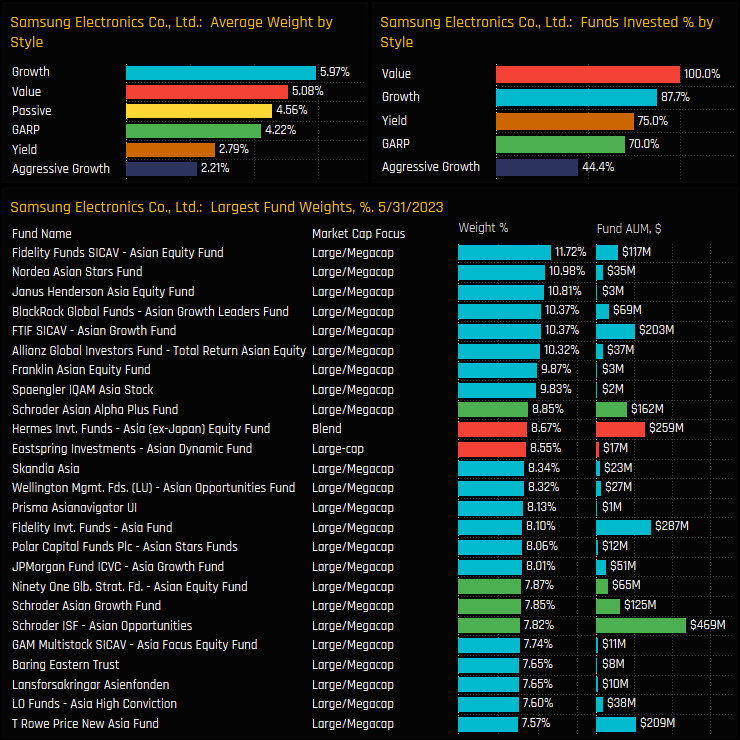
The charts below show the latest ownership statistics for companies in the Asia Ex-Japan stock universe. Whilst TSMC is the regional leader by some distance, Samsung Electronics has cemented itself as the 2nd largest holding on an average weight basis, but lags behind Tencent Holdings and Alibaba Group Holdings in terms of the percentage of funds invested. It is one of 6 stocks that are held overweight by the majority of the Asia Ex-Japan funds in our analysis (ch4), and the 3rd largest stock overweight behind non-benchmark HDFC Bank and AIA Group Limited.
Fund Positioning & Activity
Underpinning Samsung’s record exposure is a strong holding picture among the managers in our analysis, with a number showing a +10% allocation, led by Fidelity Asian Equity (11.7%) and Nordea Asian Stars (10.98%). Growth and Value managers are the larger allocators, whilst Aggressive Growth funds are notable in their absence, with just 44.4% holding exposure compared to 87.7% of Growth funds and 100% of Value funds.
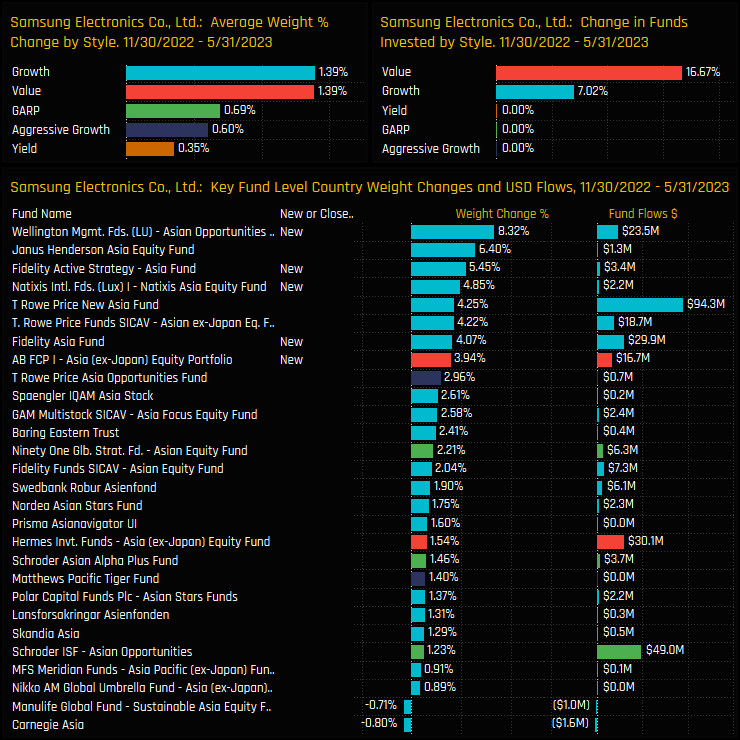
The below charts show the Style moves and fund level activity over the last 6-months. On a Style basis, Growth funds were responsible for much of the move higher, though all Style groups saw average weights increase over the period. On a fund level, between 11/30/2022 and 05/31/2023 a further 5 funds opened new positions with no closures, led by Wellington Asian Opportunities (8.3%) and Fidelity Active Strategy (5.45%).
Conclusions & Links
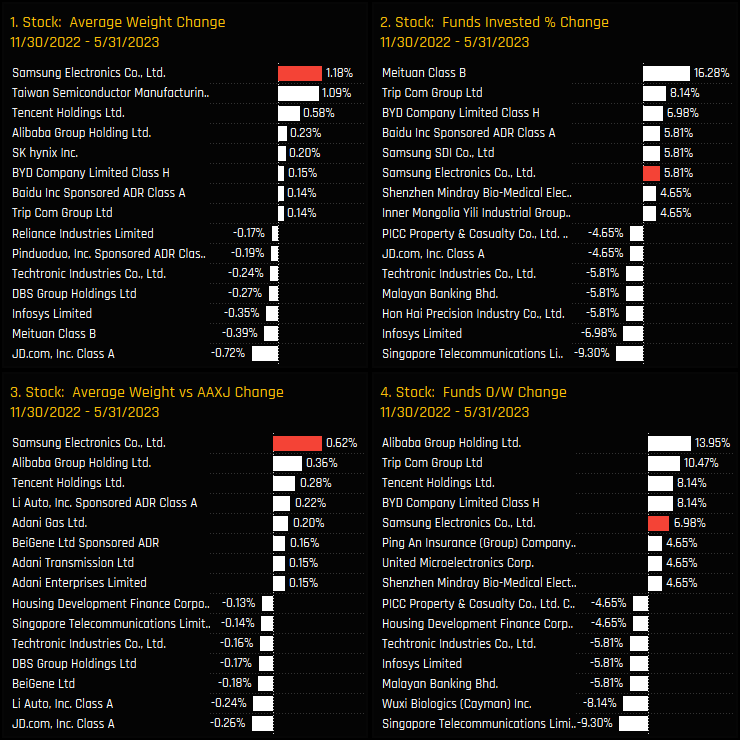
Over the last 6-months, Samsung has been a clear beneficiary of manager rotation. The charts opposite show Samsung capturing the largest increase in average holding weight (ch1) and the largest increase in net overweight (ch3) among Asia Ex-Japan peers over the last 6-months. It also saw the joint 4th largest increase in the percentage of funds with outright ownership (ch2), though was eclipsed by Meituan, Trip Com Group and BYD Company (see last month’s note BYD Company: Record Holdings for more info).
So despite being an easy stock for Asian funds to hold on account of its large index weight, active investors are going one step further, ramping up allocations to record levels and with the majority of managers positioned overweight. Samsung Electronics has cemented itself as one of the highest conviction holdings in the Asia Ex-Japan region right now.
Click on the link below for an extended data report on Samsung Electronics positioning among active Asia Ex-Japan funds.
Investment levels among the thousands of stocks in the investible Asia Ex-Japan universe differ greatly. Some stocks are widely owned, others largely avoided with ownership levels changing every month. We combine current and historical positioning against shorter-term manager activity to get a handle on where sentiment lies for every stock in our Asian analysis. We highlight 8 stocks at the extreme ends of their own positioning ranges whilst also seeing significant changes in fund ownership.
Stock Sentiment
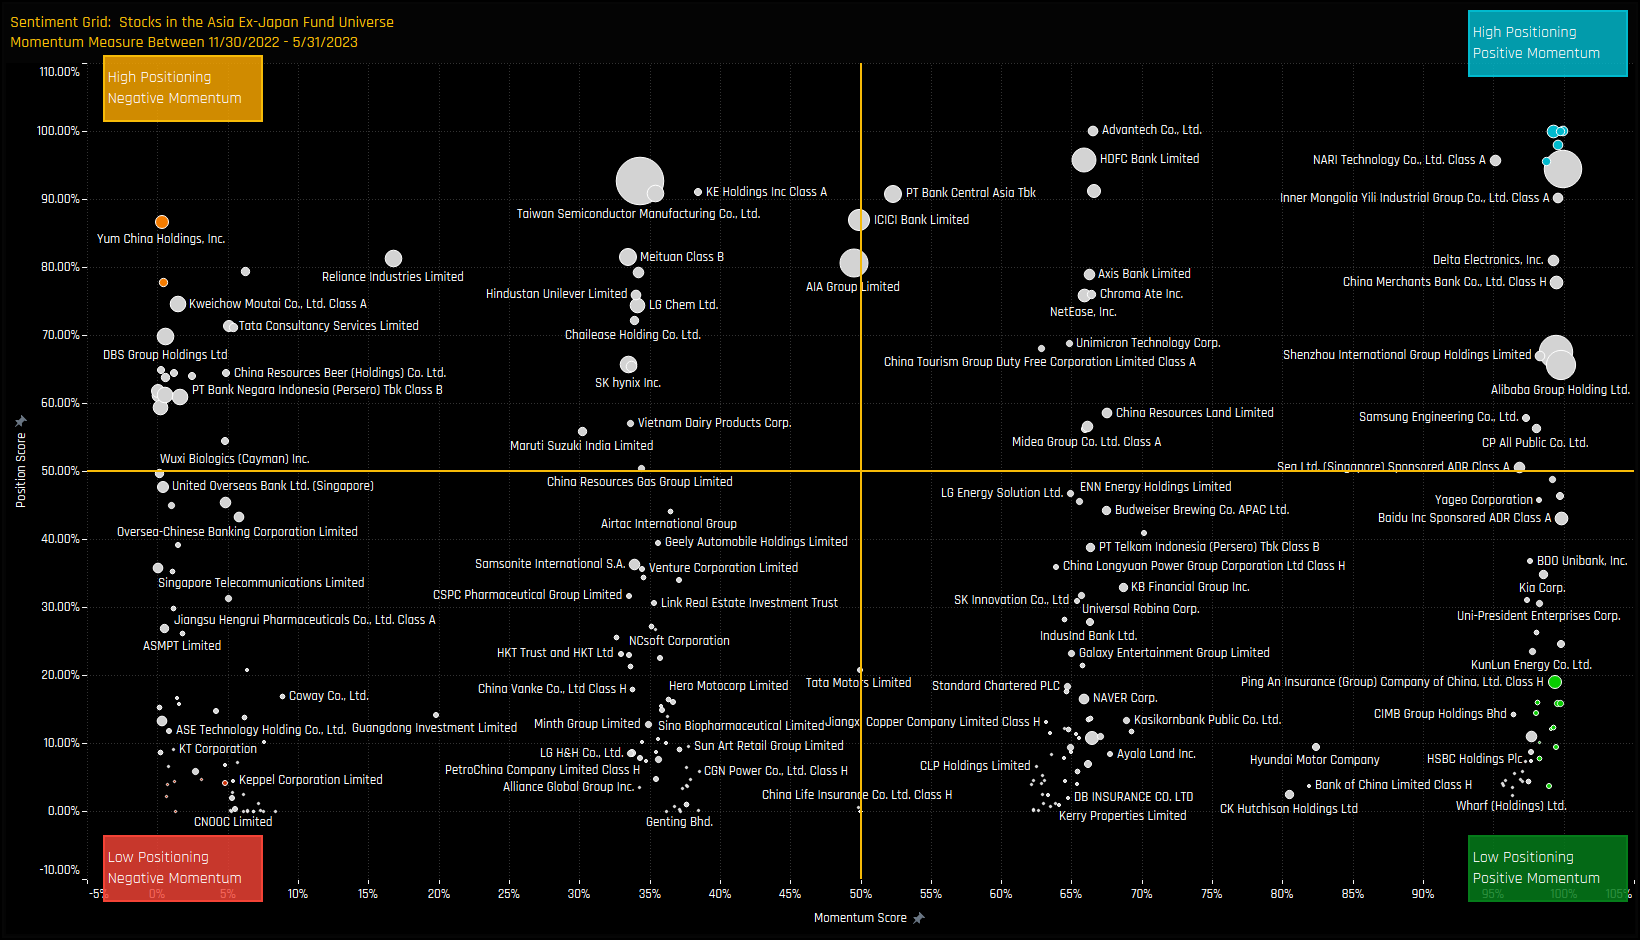
The Sentiment Grid below is designed to visualize the interplay between current fund positioning, long-term fund positioning and shorter-term fund manager activity for all stocks in the Asia Ex-Japan fund active universe. The Y-axis shows the ‘Position Score’, a measure of current positioning in each stock compared to its own history going back to 2011 on a scale of 0-100%. It takes in to account the percentage of funds invested in each stock versus history, the average fund weight versus history and the percentage of funds overweight the benchmark versus history. The higher the number, the more heavily a stock is owned by active Asia Ex-Japan managers compared to its own history.
The X-Axis shows the ‘Momentum Score’, a measure of fund manager activity for each stock between 11/30/2022 and 05/31/2023 on a scale of 0% (maximum negative activity) to 100% (maximum positive activity). The Momentum Score takes in to account the change in the percentage of funds invested in each stock over the period, the change in average weight and the change in the percentage of funds overweight. The chart also highlights the companies at the extreme ends of each quadrant by colour, which will shall explore in more detail below.
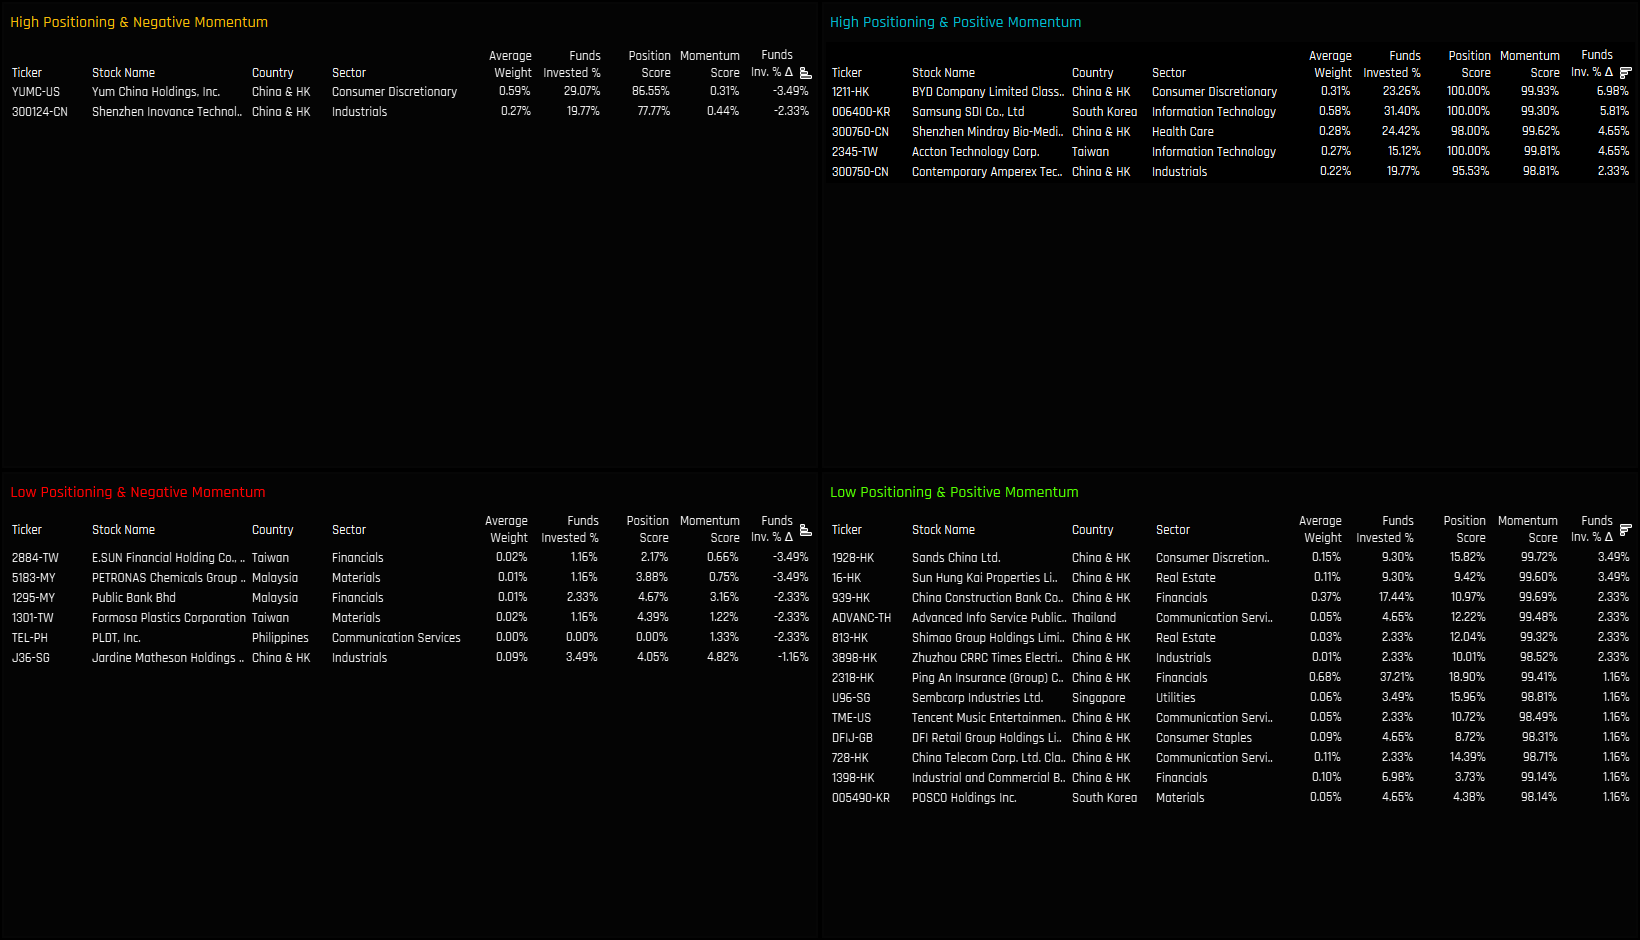
Extreme Stocks
The tables below list the stocks in the extreme corners of each quadrant. The screening methodology is as follows:
High Positioning & Negative Momentum: Position Score > 75%. Momentum Score < 5%
High Positioning & Positive Momentum: Position Score > 95%. Momentum Score > 98%
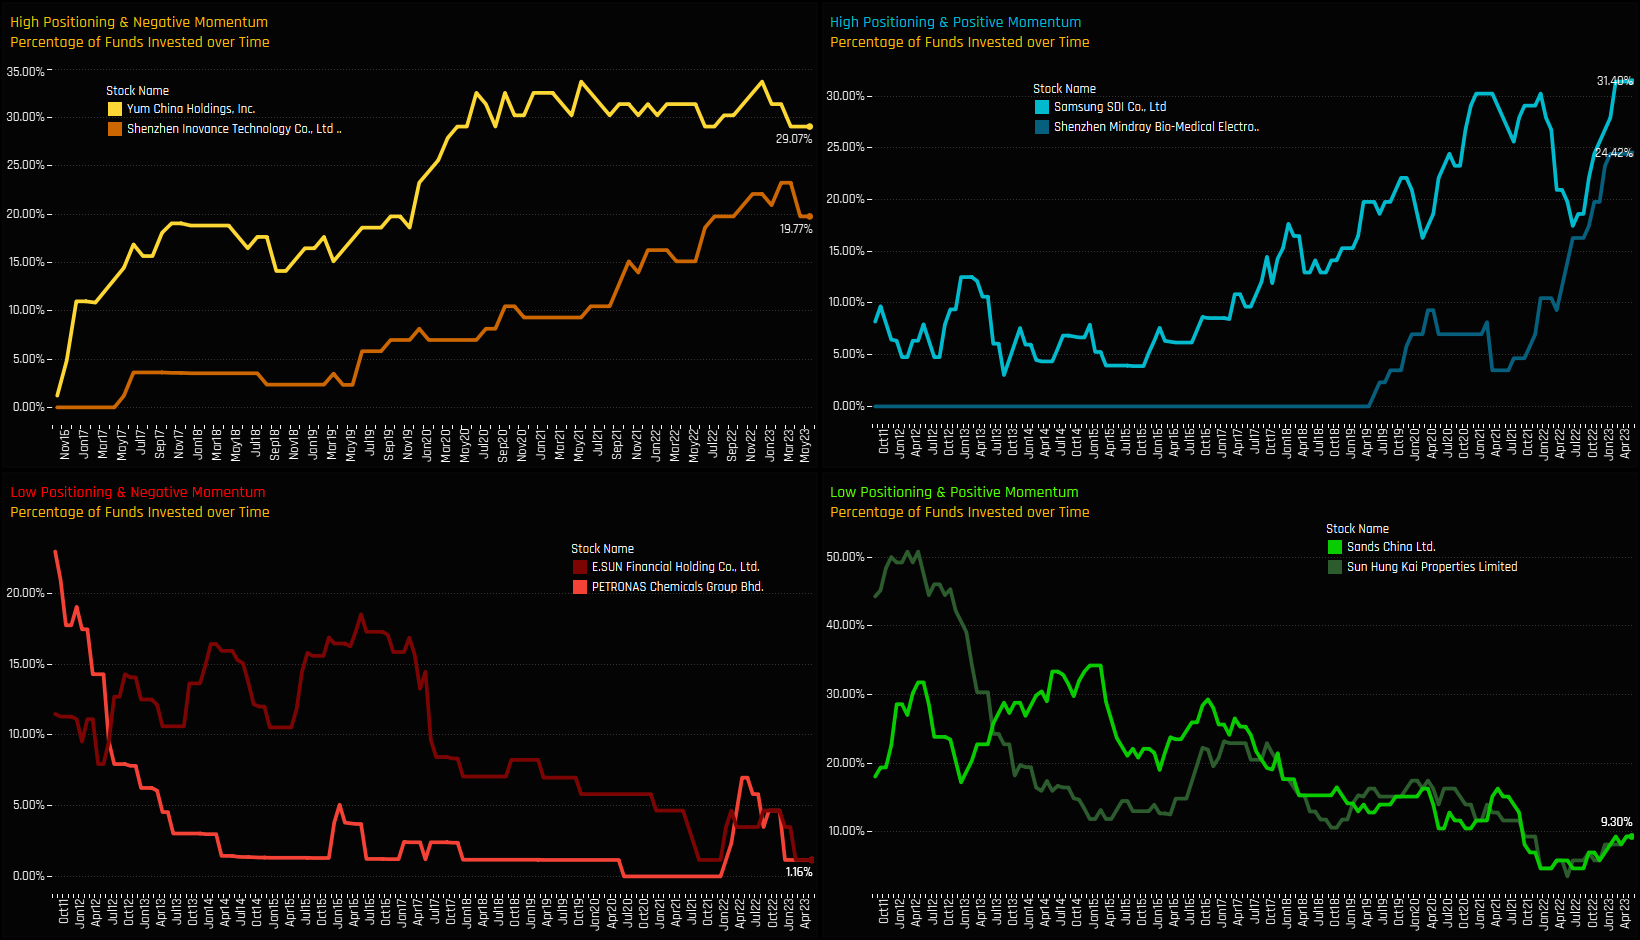
Extreme Stocks Focus
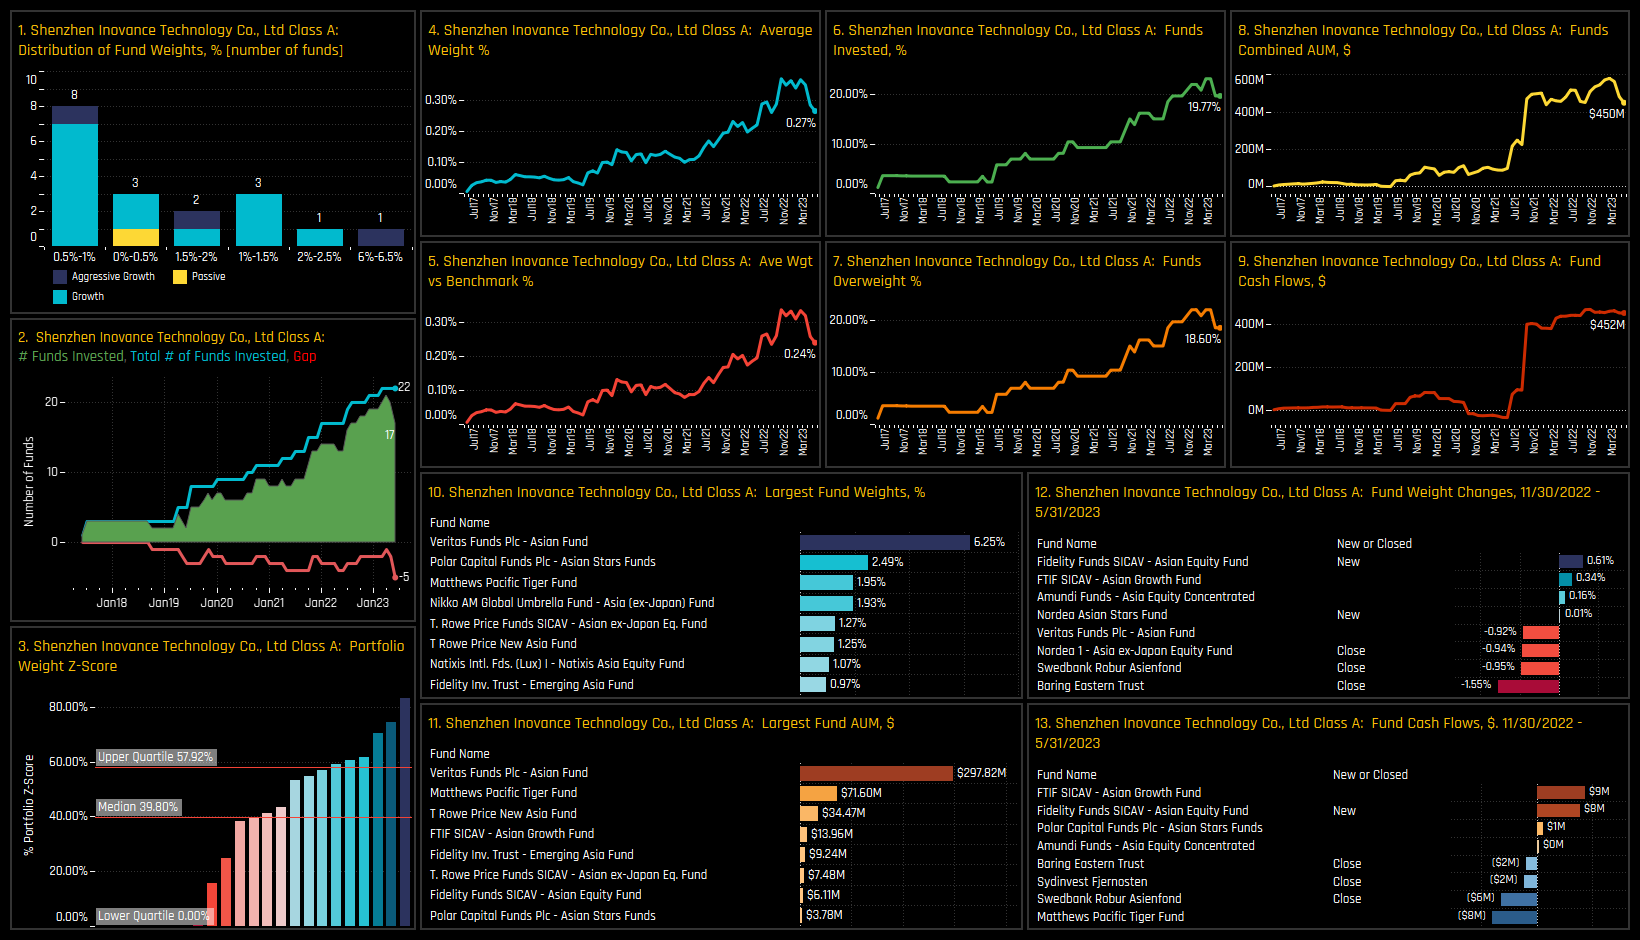
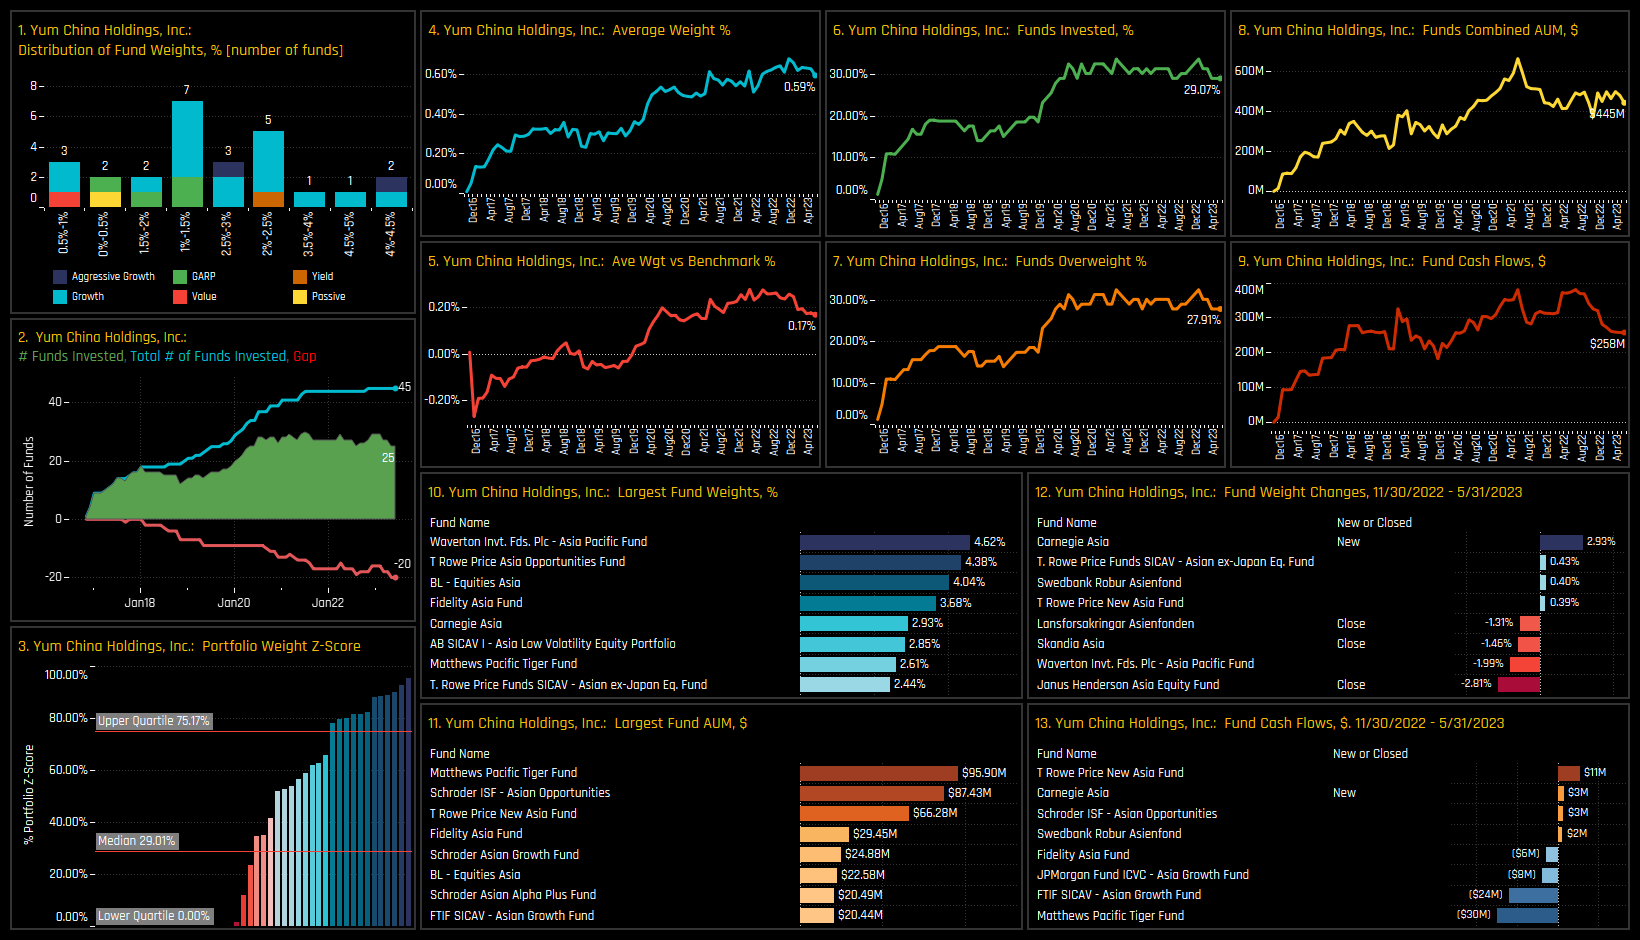
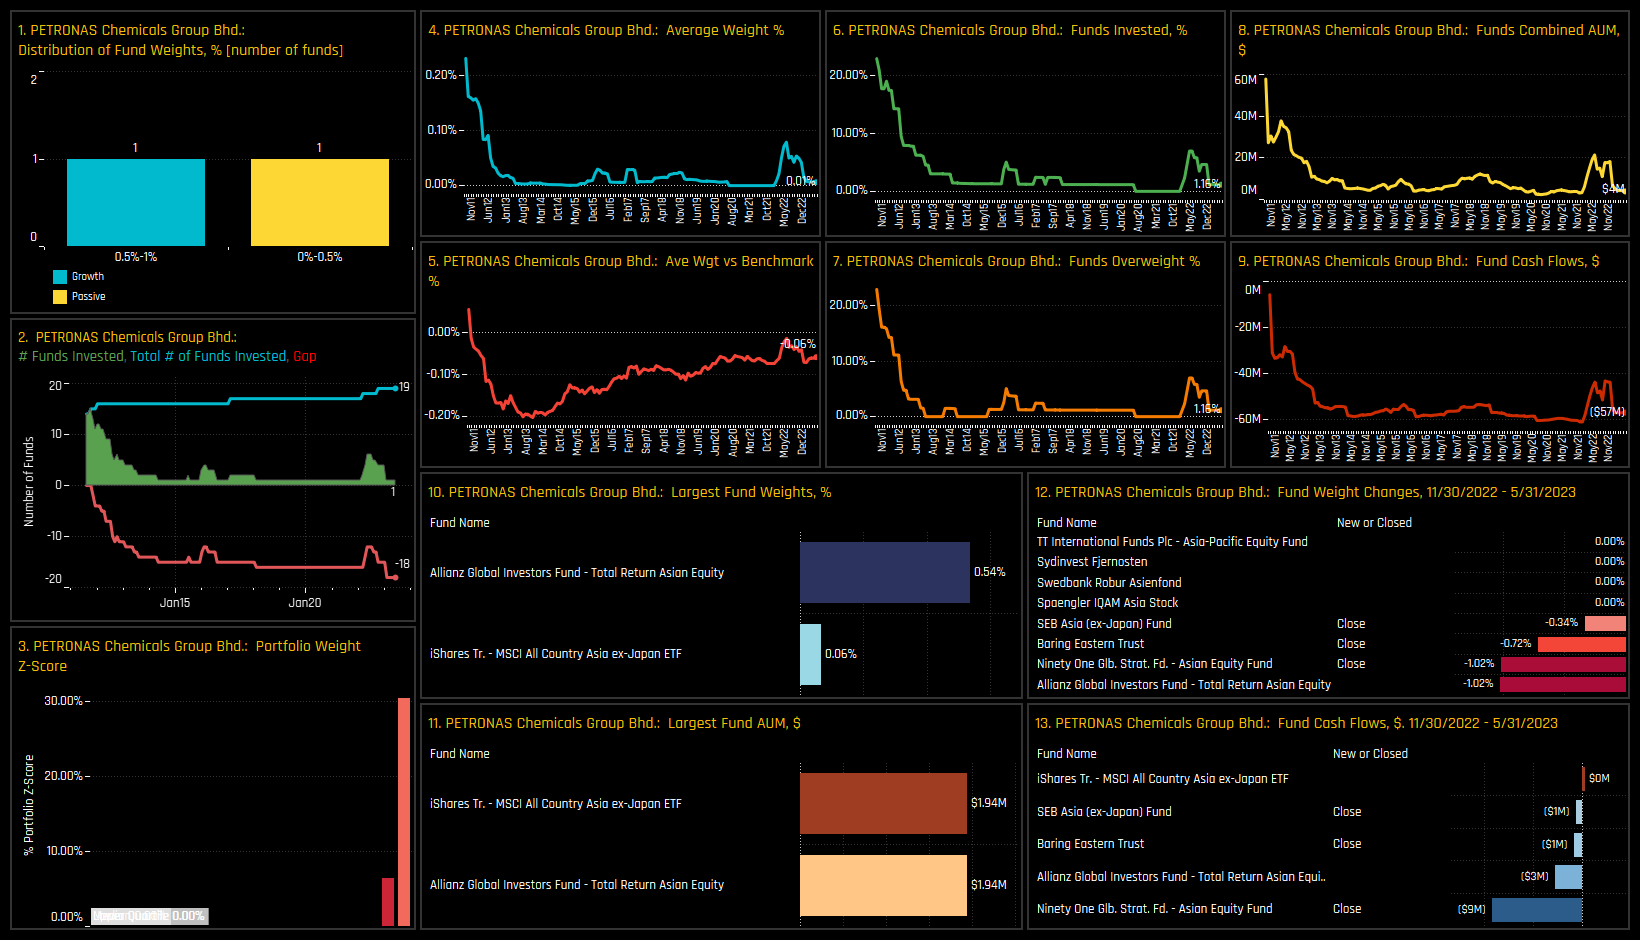
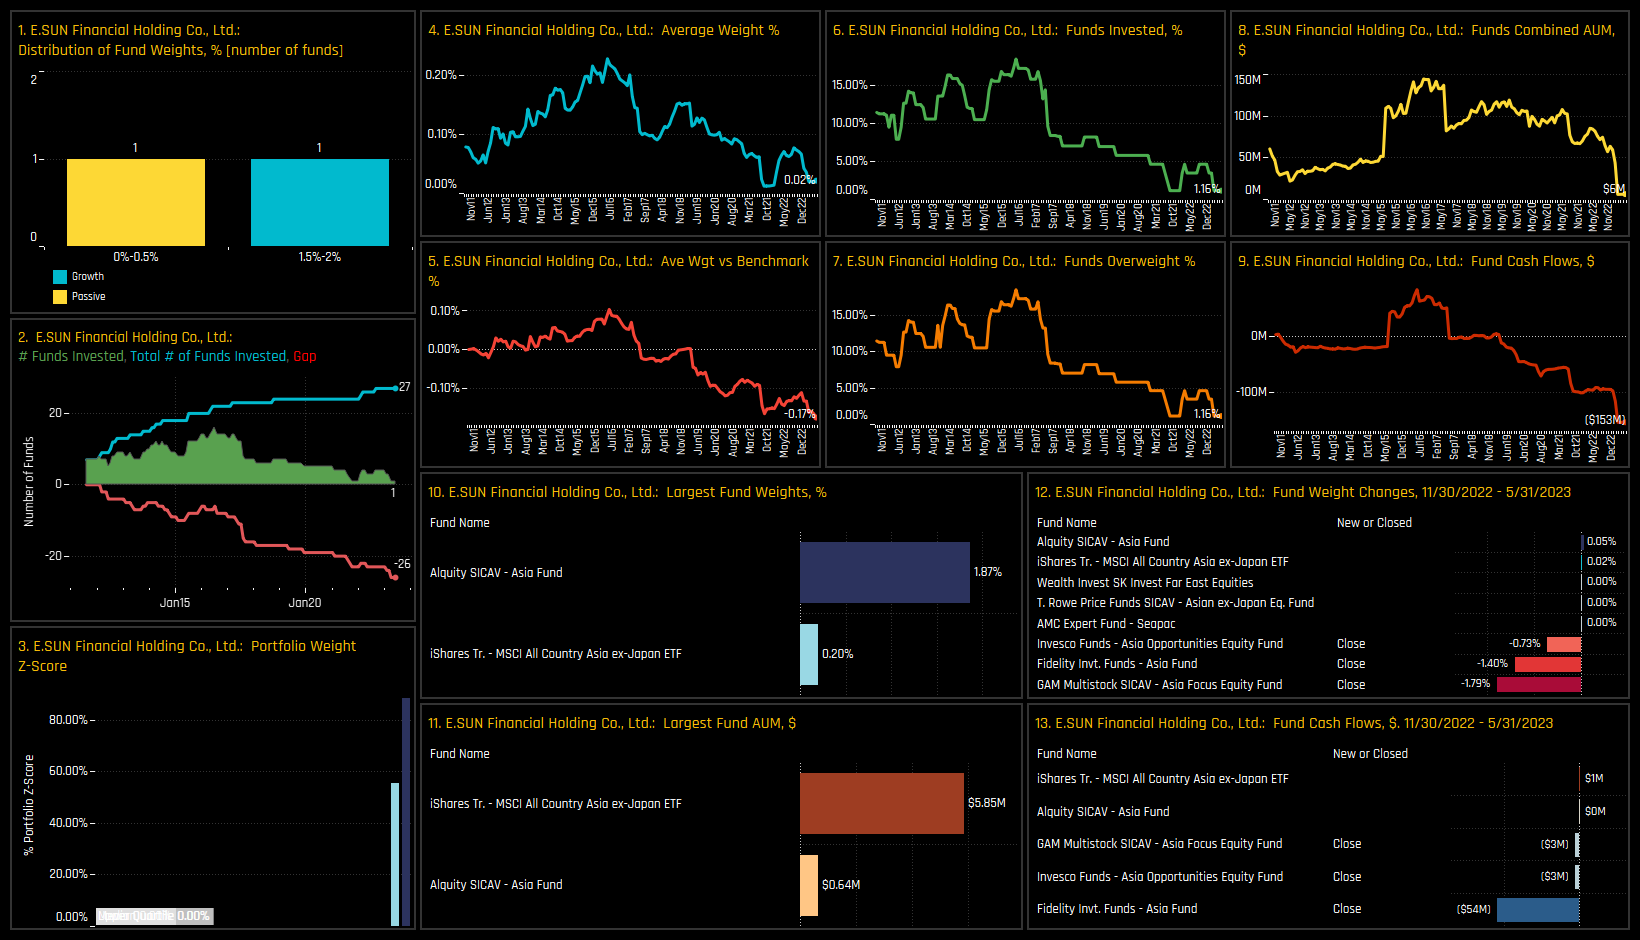
The following charts illustrate the proportion of active funds invested in the top 2 stocks within each of the 4 categories. This visualization provides an additional perspective how the Sentiment Grid works. For instance, in the chart located at the top-left, Yum China Holdings and Shenzhen Inovance Technology have experienced a decline in fund ownership from the all-time highs. Moving to the chart in the bottom-left, both E.SUN Financial and PETRONAS Chemicals are in long-term ownership decline, with additional selling in recent months pushing exposure to their lowest levels in 12 years.
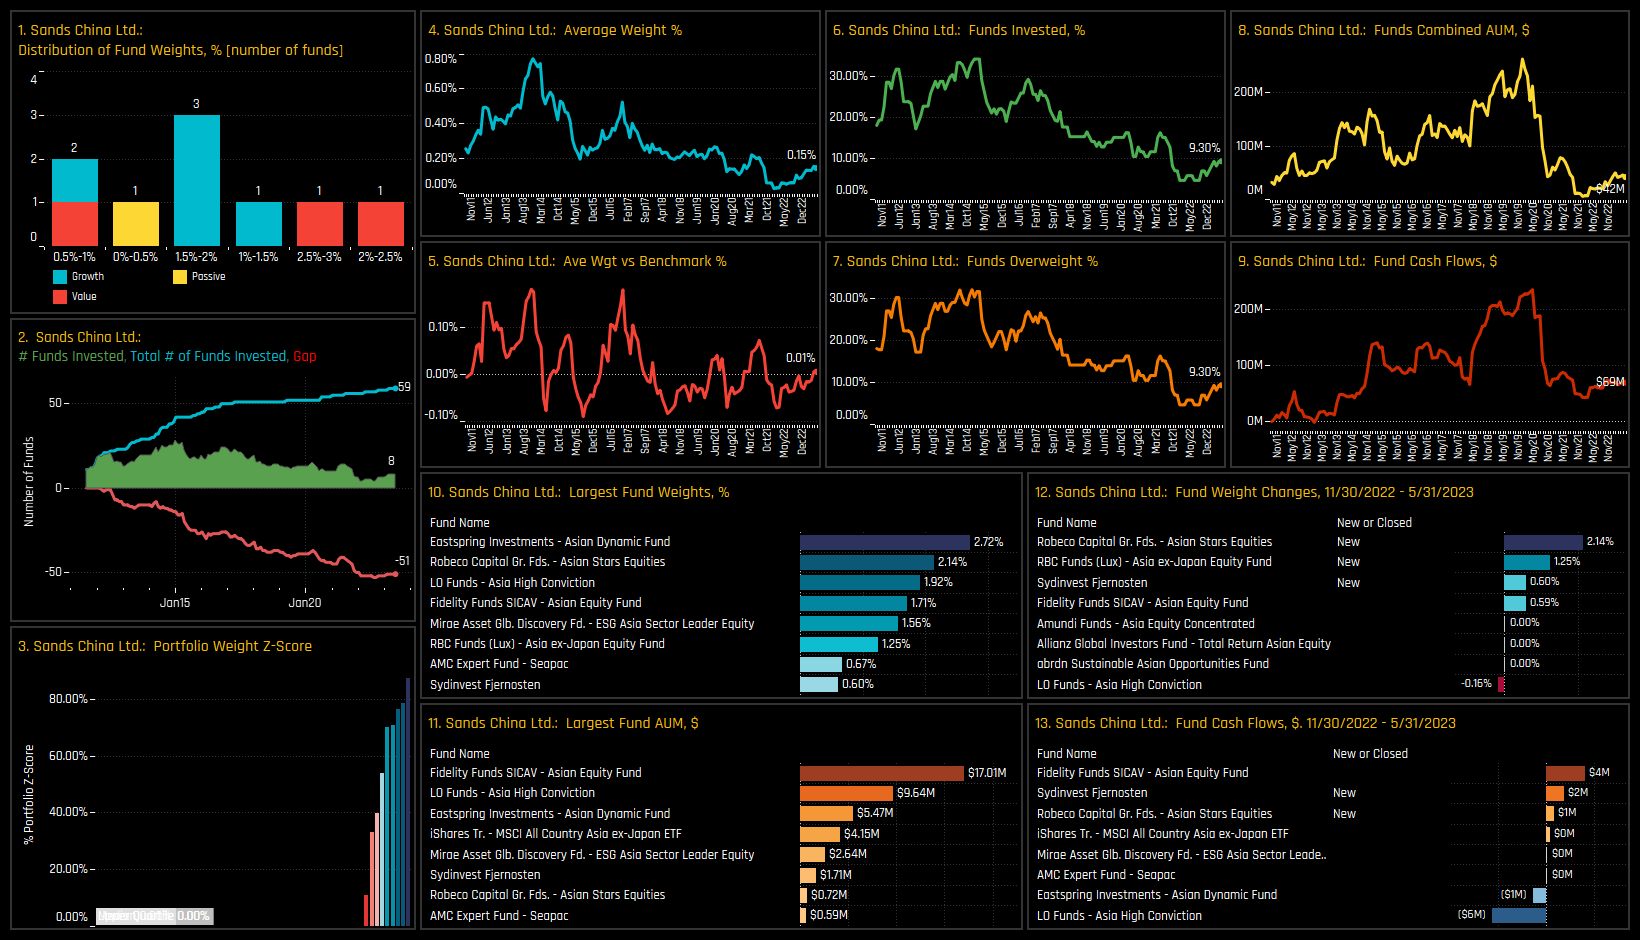
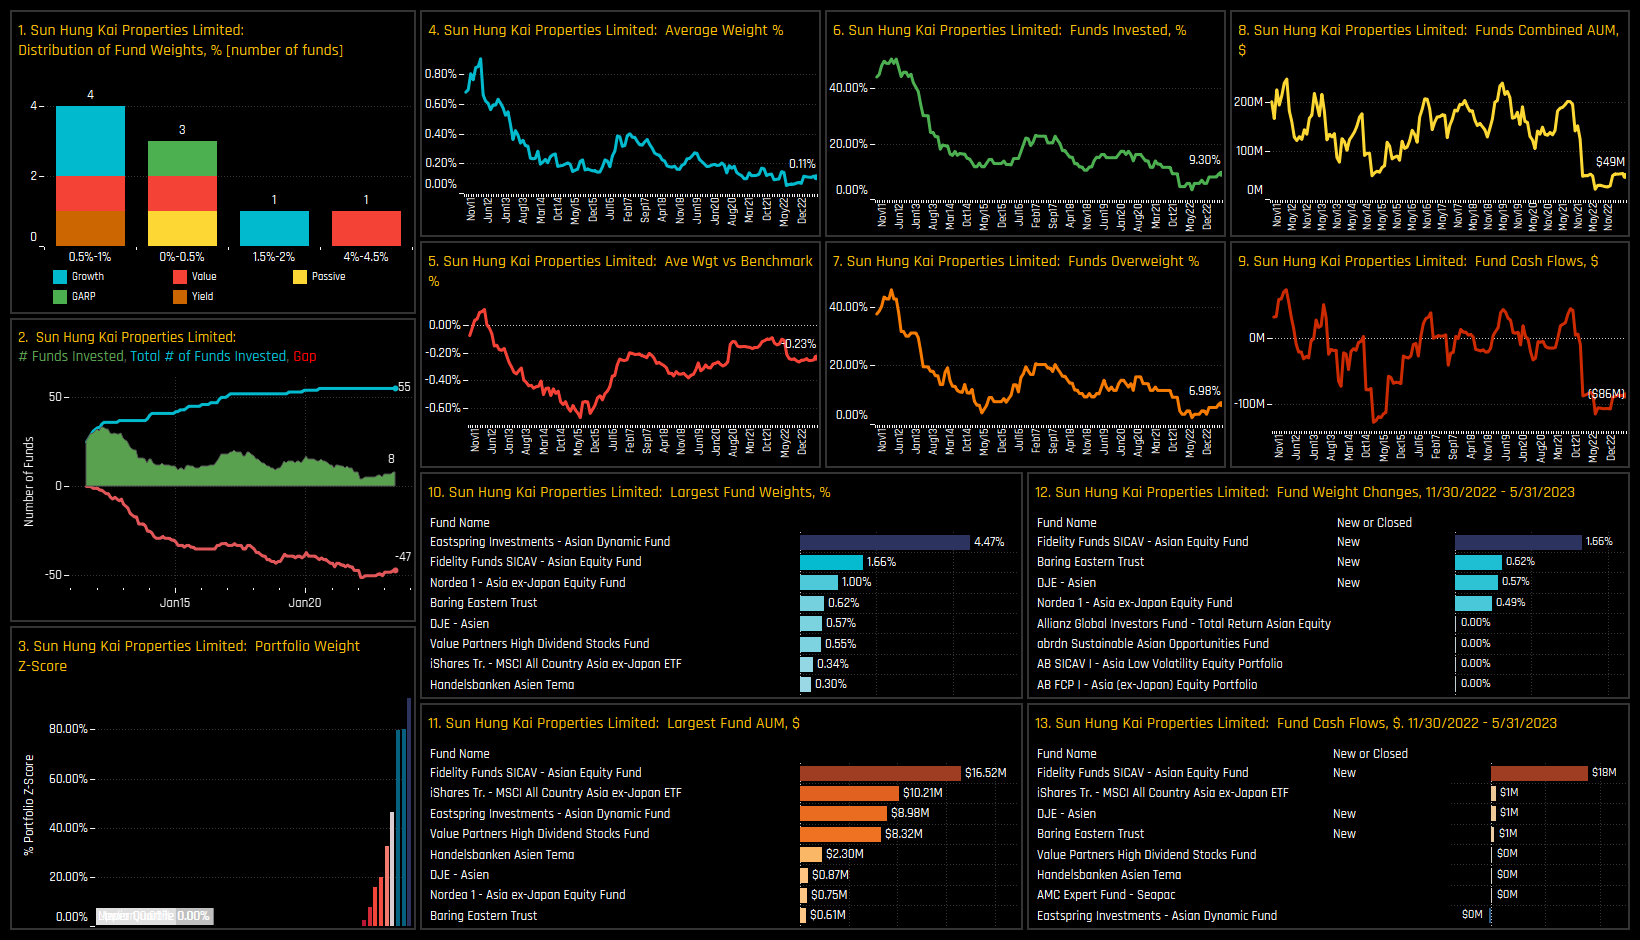
In the bottom right chart, both Sands China and Sun Hung Kai Properties are experiencing rising ownership after years of decline, sentiment has clearly started to shift to the upside in both names. Finally, in the top right chart, Samsung SDI Co and Shenzhen Mindray Bio-Medical Electronics are currently experiencing peak ownership levels, following consistent increases in fund exposure over the past few months. In the subsequent charts, we offer more comprehensive profiles of each of the 8 stocks located at the extreme corners of our Sentiment Grid.
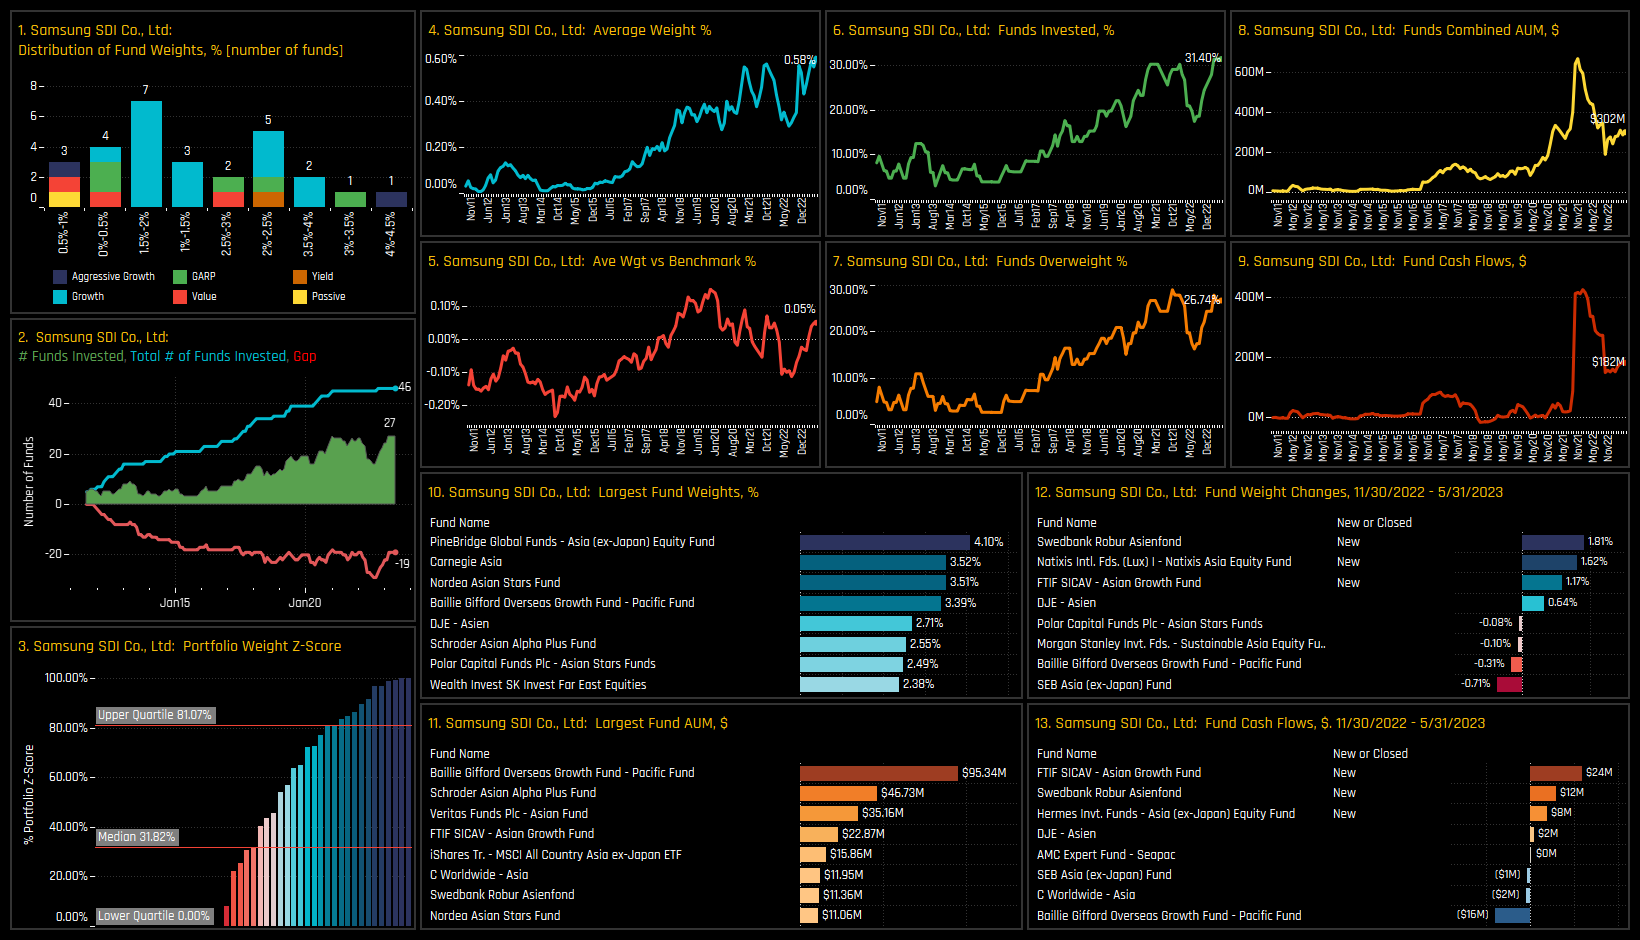
High Positioning & High Momentum: Samsung SDI Co
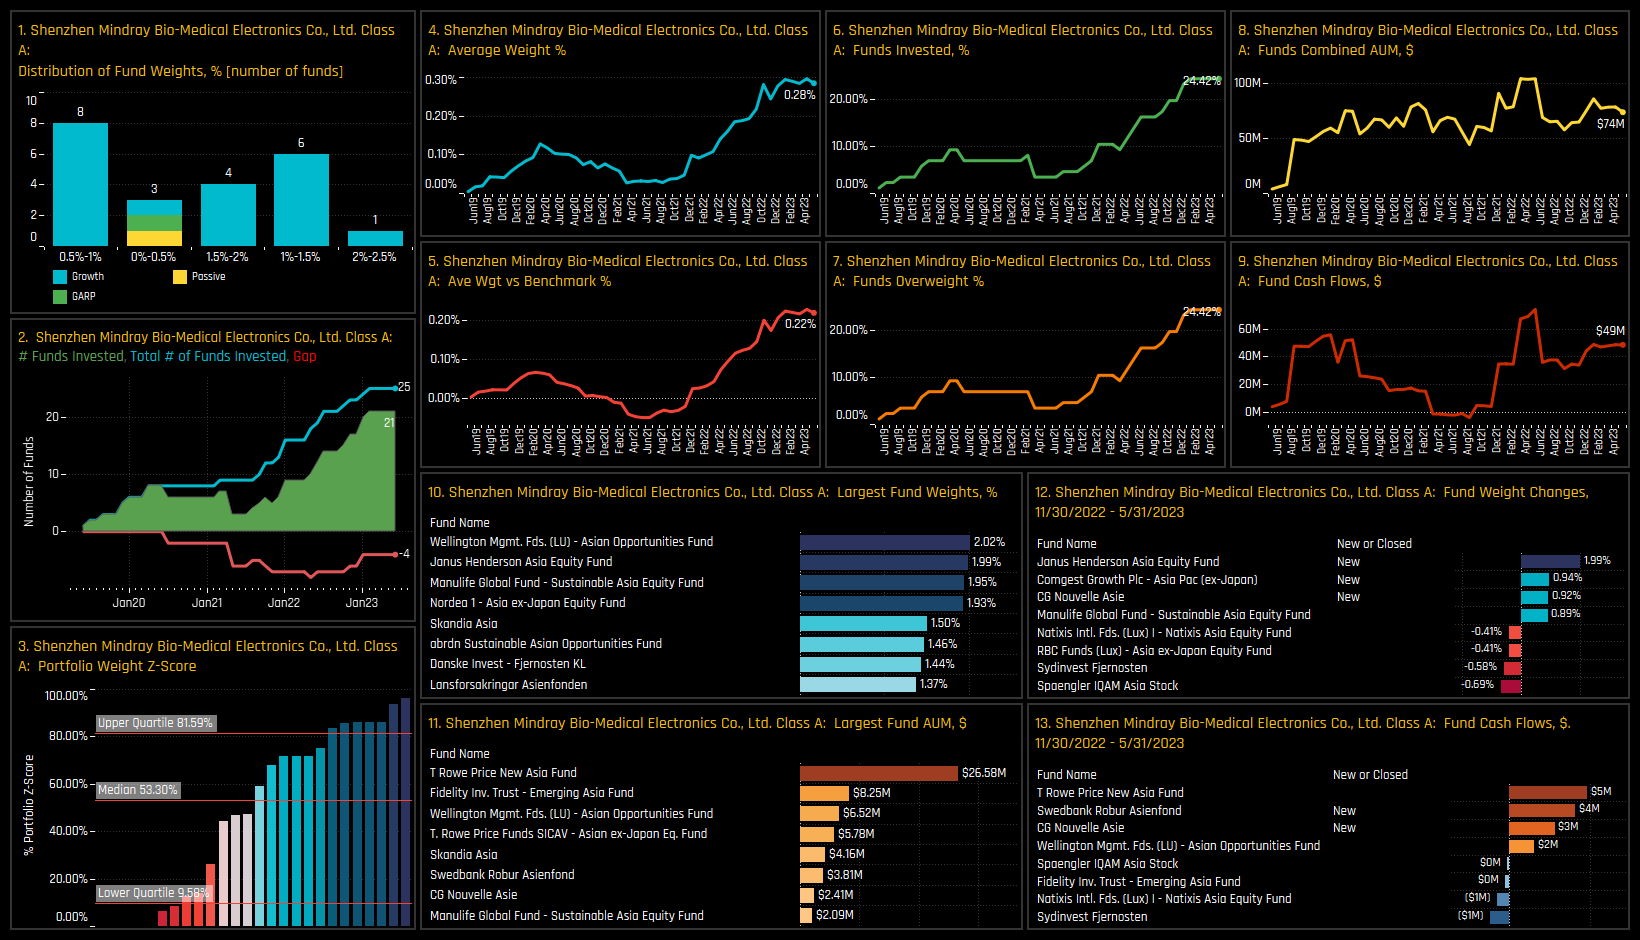
High Positioning & High Momentum: Shenzhen Mindray Bio-Medical Electronics
High Positioning & Low Momentum: Shenzhen Inovance Technology
High Positioning & Low Momentum: Yum China Holdings
Low Positioning & Low Momentum: PETRONAS Chemicals Group
Low Positioning & Low Momentum: E.SUN Financial Holding Co
Low Positioning & High Momentum: Sands China Ltd
Low Positioning & High Momentum: Sun Hung Kai Properties Ltd
86 Asia Ex-Japan Equity Funds, AUM $54.5bn
Asia Ex-Japan Active Funds Ownership Report
To round off this month's research, please click on the link below for the full data report on Asia Ex-Japan active fund positioning
For more analysis, data or information on active investor positioning in your market, please get in touch with me on steven.holden@copleyfundresearch.com
Investor Positioning Report — Copley Fund Research Ltd · Last updated: July 2026 · Registered in England and Wales
1. Who we are
Copley Fund Research Ltd provides proprietary institutional fund intelligence to listed companies and investor relations professionals. These terms govern every purchase of an Investor Positioning Report. By completing a purchase you confirm you have read, understood, and agreed to these terms in full.
2. What you are purchasing
The Investor Positioning Report is a bespoke PDF report mapping the institutional fund universe around your stock. It covers current investors, past investors, competitor investors, and white space investors. Every report is built from scratch for the specific company ordered and is not a standardised or templated product.
3. Delivery and process
Following payment or invoice issuance, Copley Fund Research will contact you within one working day to agree your competitor set. Production begins once the competitor set is confirmed in writing. The completed report will be released to you within 48 hours of production starting, provided payment has been received in full; where payment is outstanding, the report will be withheld until payment clears. If the requested company falls outside our covered fund universes, or a competitor set cannot be agreed, Copley Fund Research will issue a full refund or cancel the outstanding invoice.
4. Competitor set agreement
The competitor set is agreed with you in writing prior to production, and the report is built to that agreed specification. Requests to amend the competitor set after delivery, based on a change of preference rather than an error, may be treated as a new order.
5. Refund policy
Because each report is produced individually for your company, orders are non-refundable once production has begun, except as set out in clauses 3 and 5a below. By purchasing, you agree not to dispute the charge with your card provider on the basis that the service was not as described, provided the report has been delivered to the agreed specification or corrected under clause 5a.
5a. Quality remedy
If a delivered report contains a material error caused by Copley Fund Research — for example, an incorrect company analysed, a competitor omitted from the agreed set, or content missing from the specification in clause 2 — Copley Fund Research will correct and redeliver the report at no additional charge, within a reasonable timeframe. This is your sole remedy for such errors.
6. Data and accuracy
All fund positioning data in the report reflects holdings as disclosed at the most recently available reporting date at the time of compilation. The timing of fund holdings disclosures is determined by regulatory requirements applicable to each fund and is outside the control of Copley Fund Research Ltd. This data may not reflect current fund positions. Copley Fund Research takes reasonable care to ensure accuracy but makes no warranty, express or implied, as to the completeness or current accuracy of the underlying data — though this does not affect the quality remedy in clause 5a for errors in how that data was analysed or presented. Past fund positioning is not indicative of future fund behaviour or investment decisions.
7. Not investment advice
The Investor Positioning Report is produced for investor relations intelligence purposes only. It does not constitute investment advice, financial advice, or a recommendation to buy, hold, or sell any security. The data reflects historical fund positioning and must not be relied upon as a prediction of future fund behaviour or investment decisions. Copley Fund Research Ltd is not authorised or regulated by the Financial Conduct Authority for the provision of investment advice.
8. Permitted use and confidentiality
The report is licensed for internal use by the purchasing organisation only. You may share it with employees and directors of your organisation. You may not: reproduce, redistribute, publish, or resell the report or any part of it; share it with any third party outside your organisation without prior written consent; use the fund or portfolio manager names contained in the report to approach those individuals on behalf of Copley Fund Research or in a manner that could damage Copley Fund Research's relationships with those funds; or use the data for any purpose other than your own investor relations strategy. The data, analysis, and methodology contained in the report are the intellectual property of Copley


