In this issue:
EMEA Materials: Rock Bottom
Greece: Continued Rotation
Aggressive Growth Funds Raise Japan Stakes
GEM Funds Stock Radar
380 emerging market Funds, AUM $392bn
EMEA Materials: Rock Bottom
GEM Managers reassess their exposure to the EMEA Materials sector. Sellers overwhelm buyers in key stocks, with South Africa baring the brunt as Saudi saves some face.
Time-Series & Regional Sector Activity
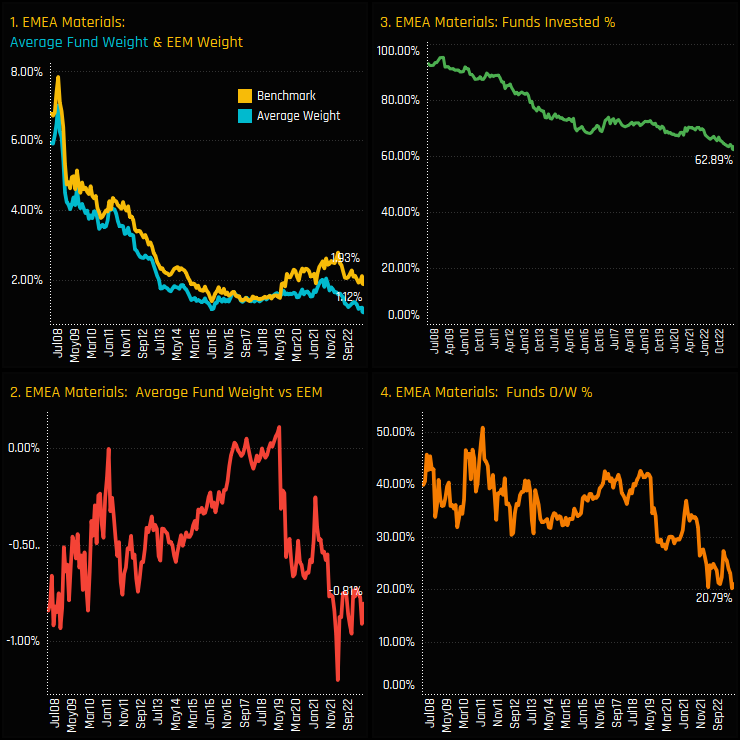
Ownership levels in the EMEA Materials sector have hit their lowest levels on record. From near full ownership back in 2008, just 62.9% of the 380 funds in our analysis now have exposure to the sector (ch3), with average portfolio weights falling to record lows of 1.12% (ch1). Versus the benchmark iShares MSCI EM ETF, active EM funds are net underweight by -0.81% (ch2), with only 20.8% of managers positioned ahead of the benchmark (ch4).
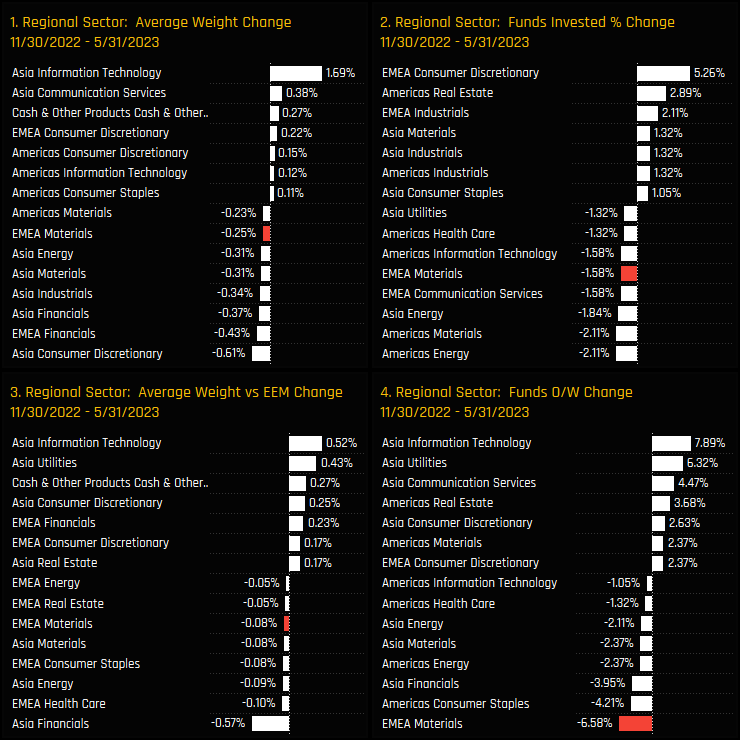
Aggregate fund level activity over the last 6-months only serves to compound the longer-term trend of falling exposure. All 4 measures of fund ownership declined over the period, with -6.6% of funds moving to underweight and -1.6% closing exposure completely. This led to a decline in average weights and increasing underweights over the period.
Latest Holdings & Sentiment
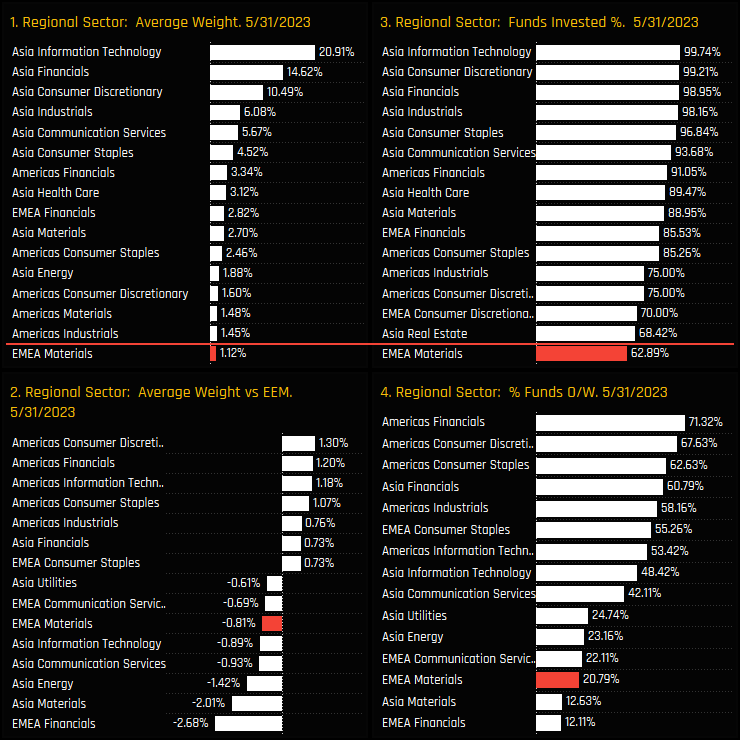
From being the 4th largest weight in active EM portfolios in 2008, EMEA Materials have drifted down the ranks to 18th, and the 19th most widely held. This places them as the 6th largest regional sector underweight globally, with active EM investors overweight a raft of American sectors, Asia Financials and EMEA Consumer Staples.
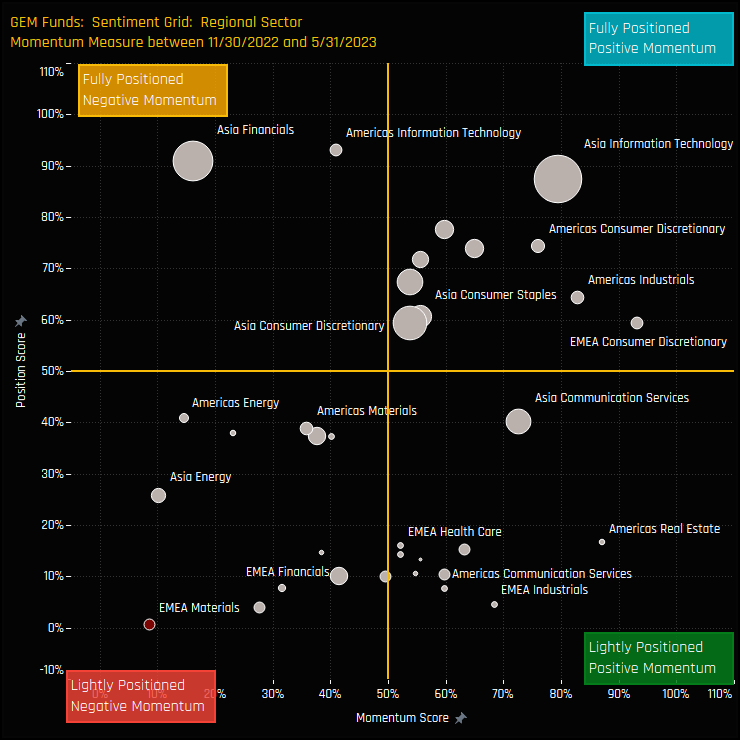
The sentiment grid below shows where current positioning in each Regional sector sits versus its own history going back to 2008 on a scale of 0-100% (y-axis), against a measure of fund activity for each sector between 11/30/2022 and 05/31/2023 (x-axis). EMEA Materials are out on their own in the bottom-left quadrant, indicative of depressed positioning and negative manager activity.
EMEA Materials: Country Positioning
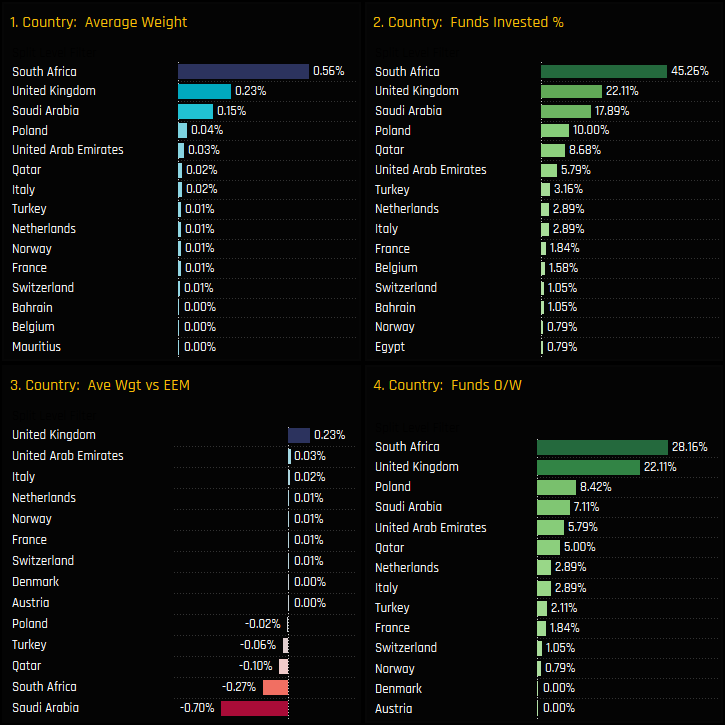
Three countries form the bulk of EMEA Materials positioning among the EM funds in our analysis. South African Materials lead the pack, held by 45.26% of investors at an average weight of 0.56%, exactly half of the total EMEA Materials exposure. UK Materials and Saudi Arabia Materials are the other key country exposures, with the UK an out-of-benchmark overweight holding and Saudi Materials the main underweight.
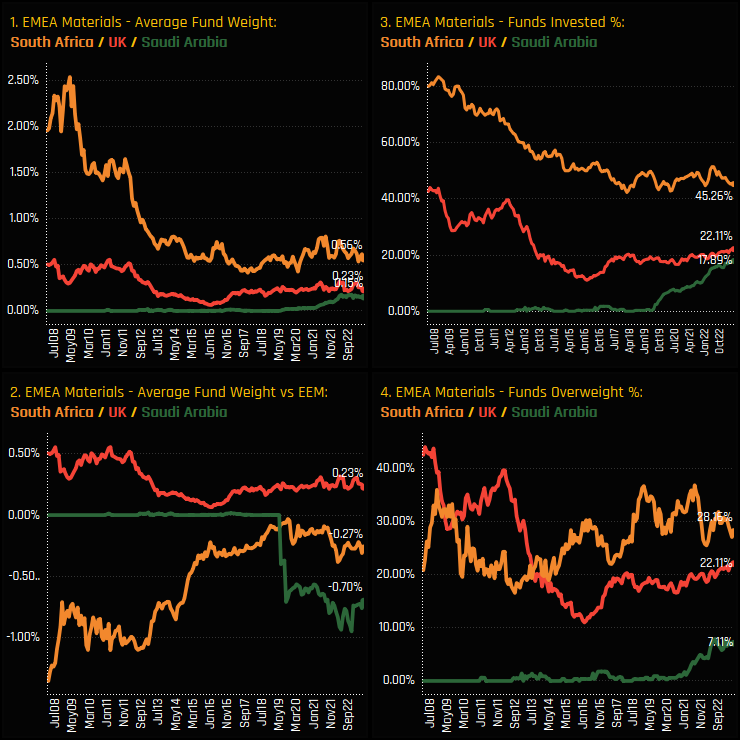
The time-series of positioning for the 3 major EMEA Materials country exposures are shown in the chart quadrant below. They show a major decline in South African Materials ownership, with average holding weights falling from over 2.5% in early 2009 to just 0.56% today. Saudi Arabian Materials fund ownership is rising on the back of their entry in to the MSCI Emerging Markets index, but not enough to offset the decline in South Africa.
Fund Holdings & Activity
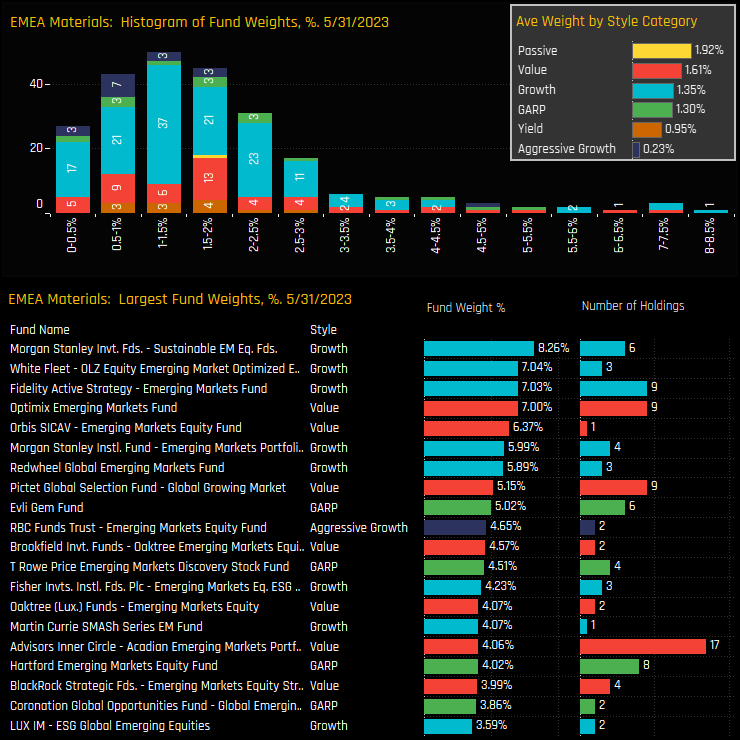
The histogram of fund holdings in the EMEA Materials sector is shown in the top chart below. It highlights the meat of the distribution at between 0.5% and 3%, with an extended tail to the upside led by Morgan Stanley EM Sustainable (8.26%) and White Fleet EM Optimised ESG (7.04%). All Style groups are positioned underweight the iShares MSCI EM ETF, with Value funds more heavily allocated than their Aggressive Growth peers.
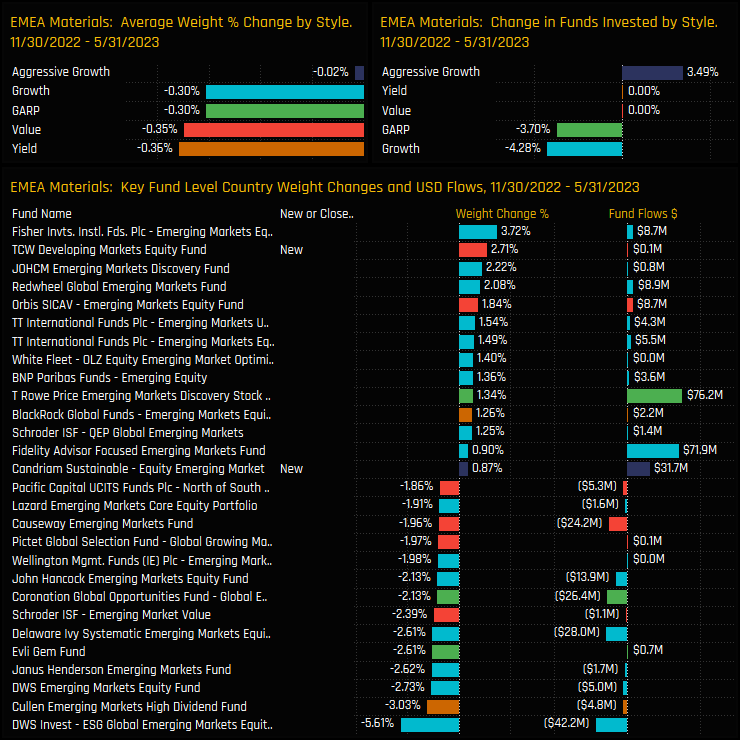
Fund level activity between 11/30/2022 and 05/31/2023 was heavily skewed to the sell-side, with average weights falling for all Style groups and led by Yield (-0.36%) and Value Funds (-0.35%). Over the period, there were 12 closures versus 6 openings, though the larger changes in positioning were adjustments, such as DWS ESG EM (-5.61%) and Cullen EM High Dividend (-3.03%).
Stock Holdings & Activity
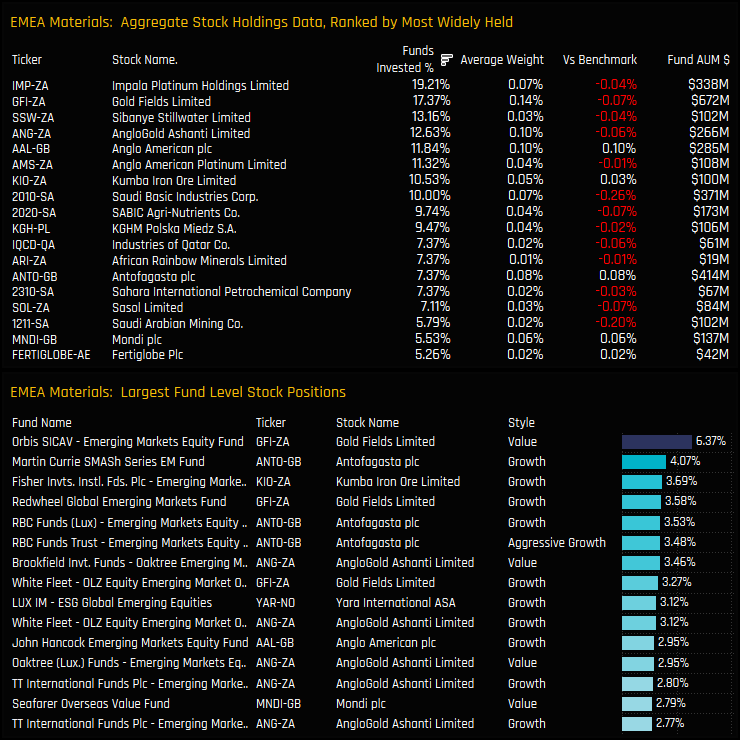
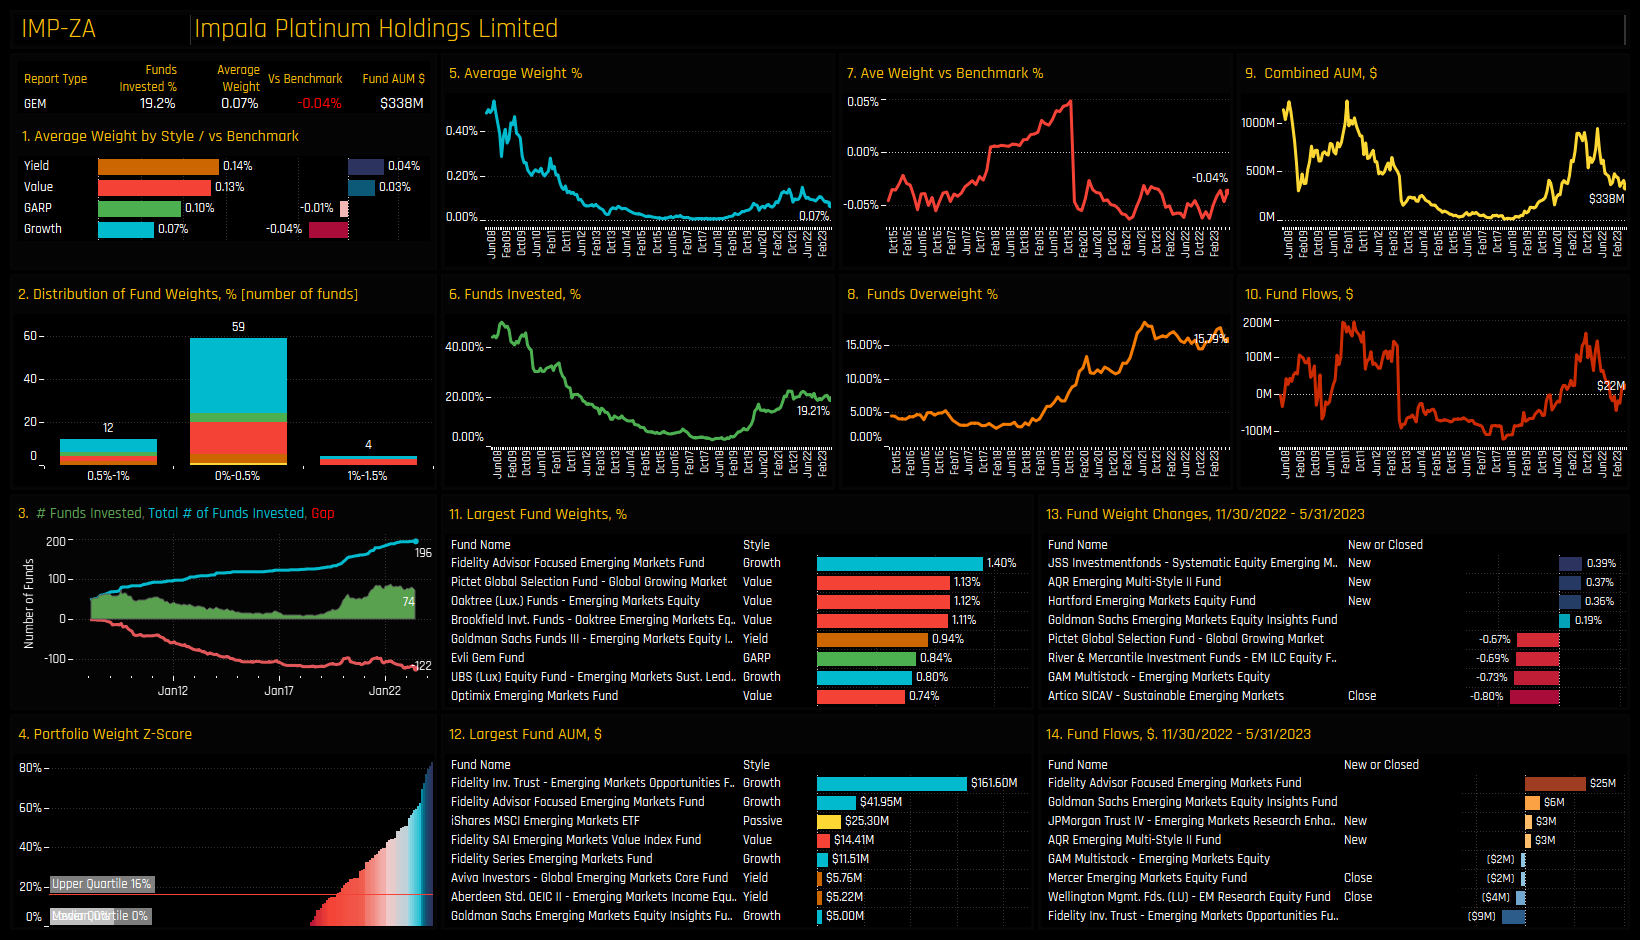
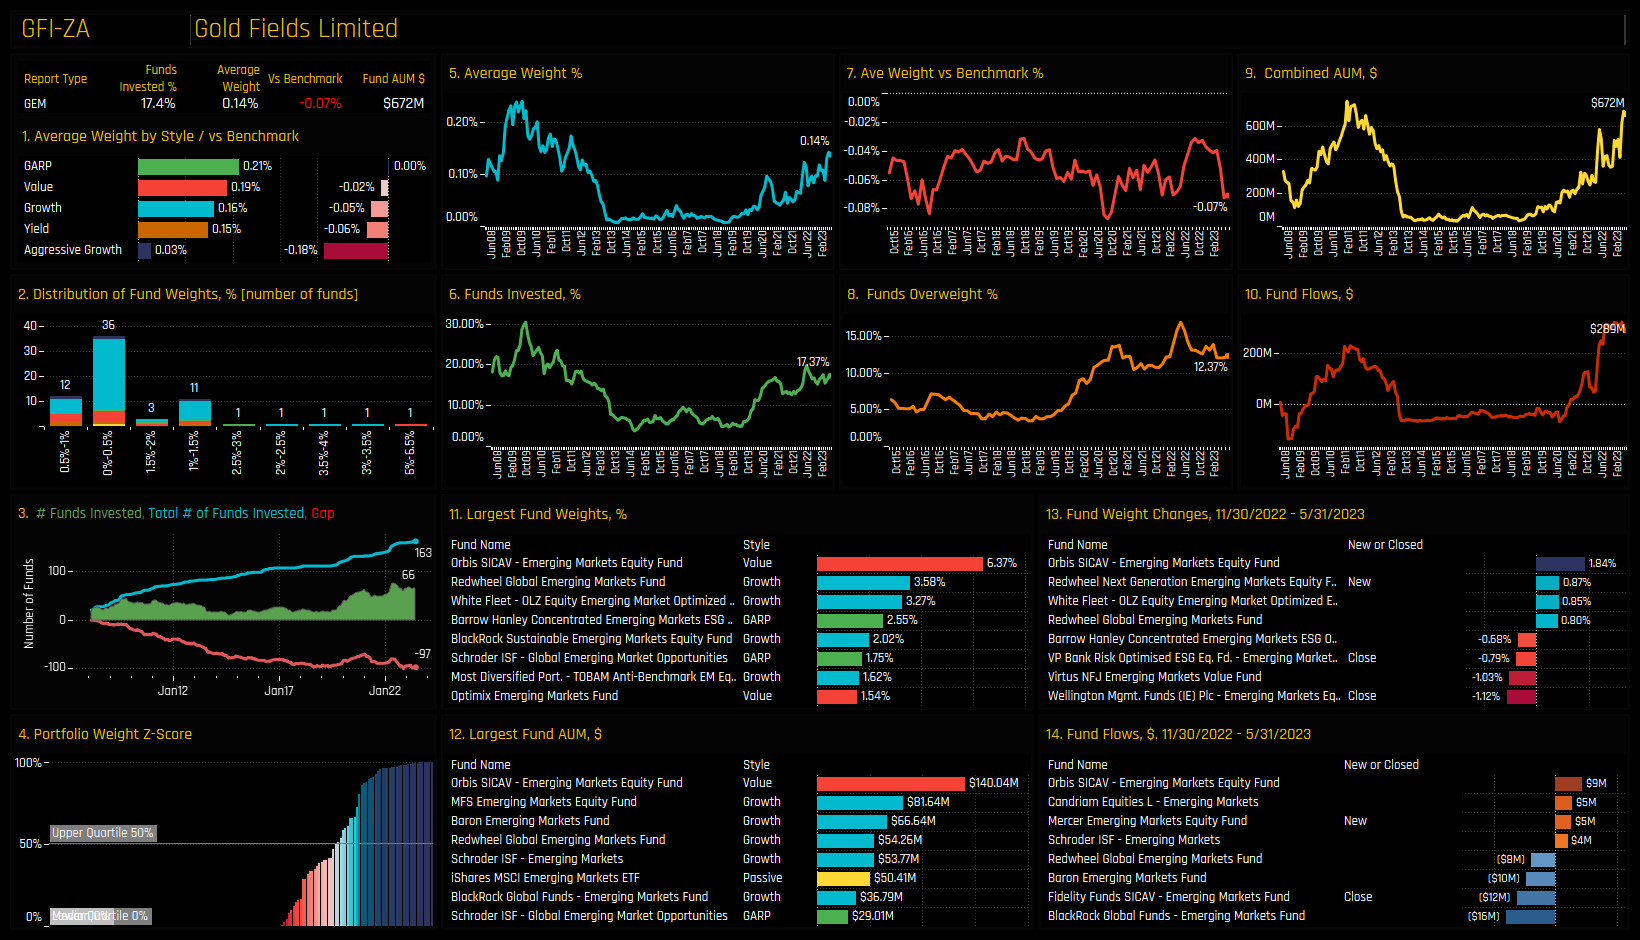
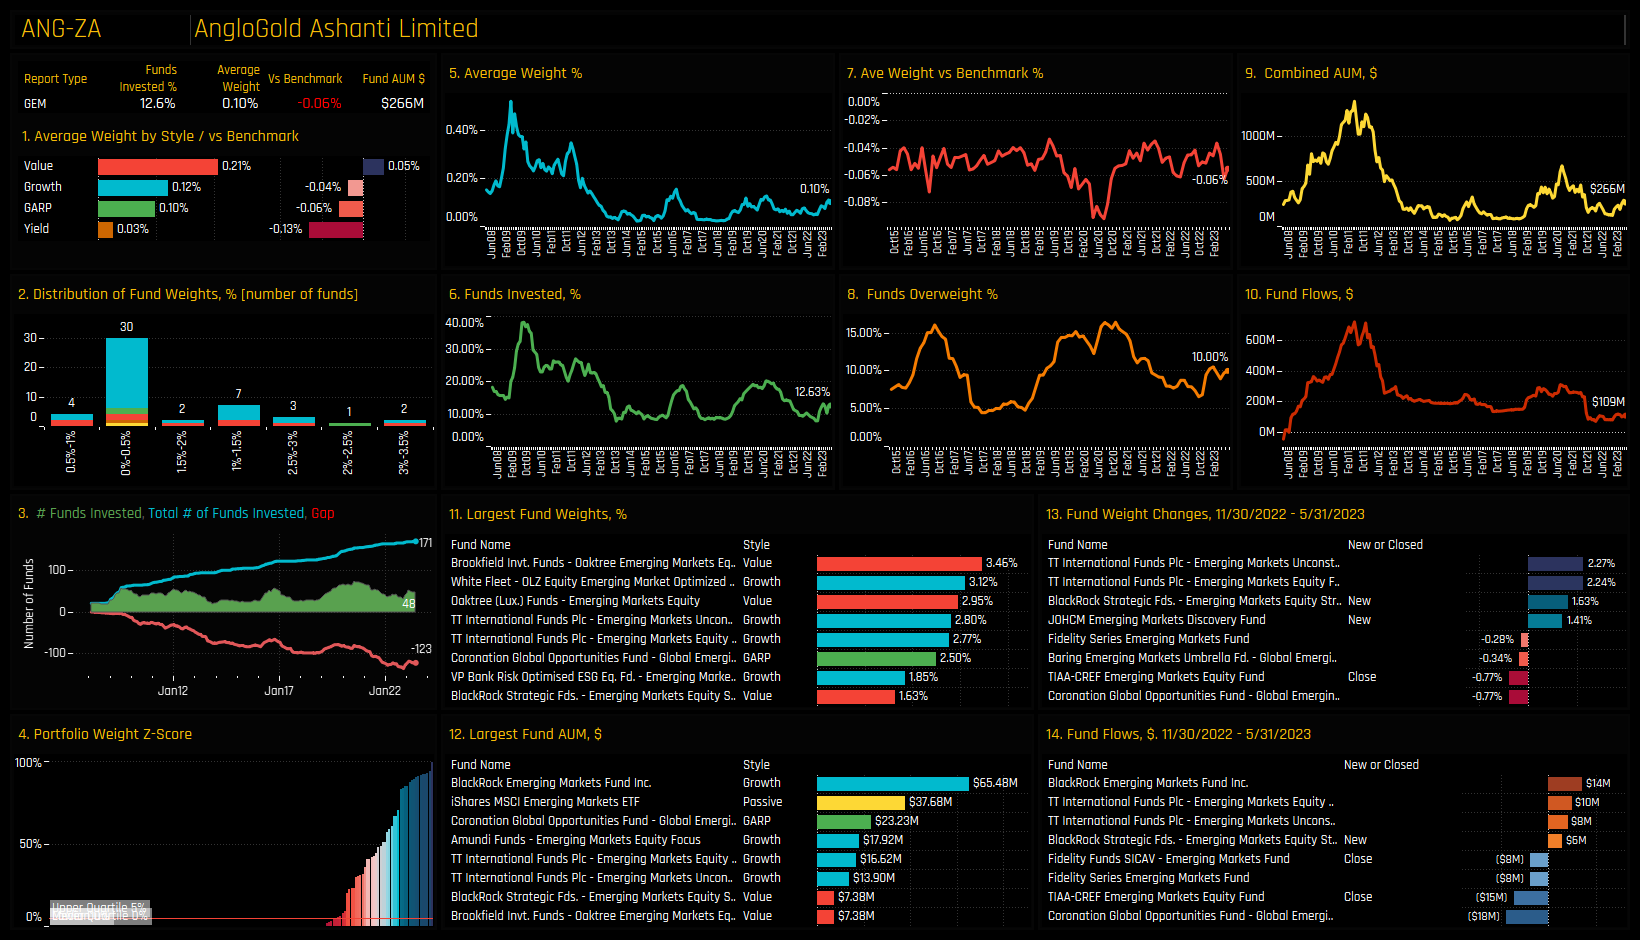
The most widely held stock in the sector is Impala Platinum, owned by 19.2% of the funds in our analysis at an average weight of 0.07%. Gold Fields Limited leads a pack of 7 additional companies that are held by more than 10% of funds, though most are held at weights lower than benchmark on average. Gold Fields accounts for the largest single fund position by Orbis EM Equity (6.37%), with Antofagasta and AngloGold Ashanti also prevalent among the larger positions.
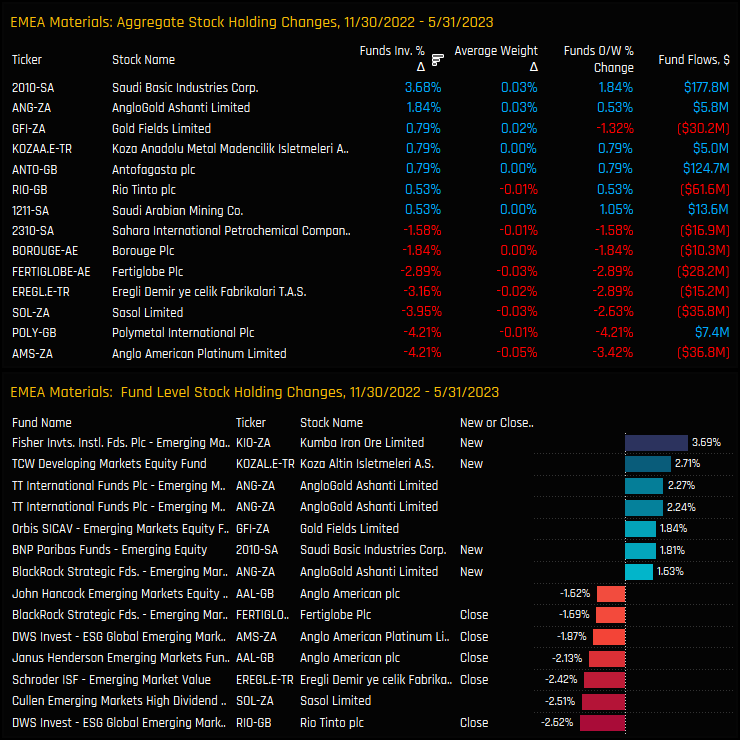
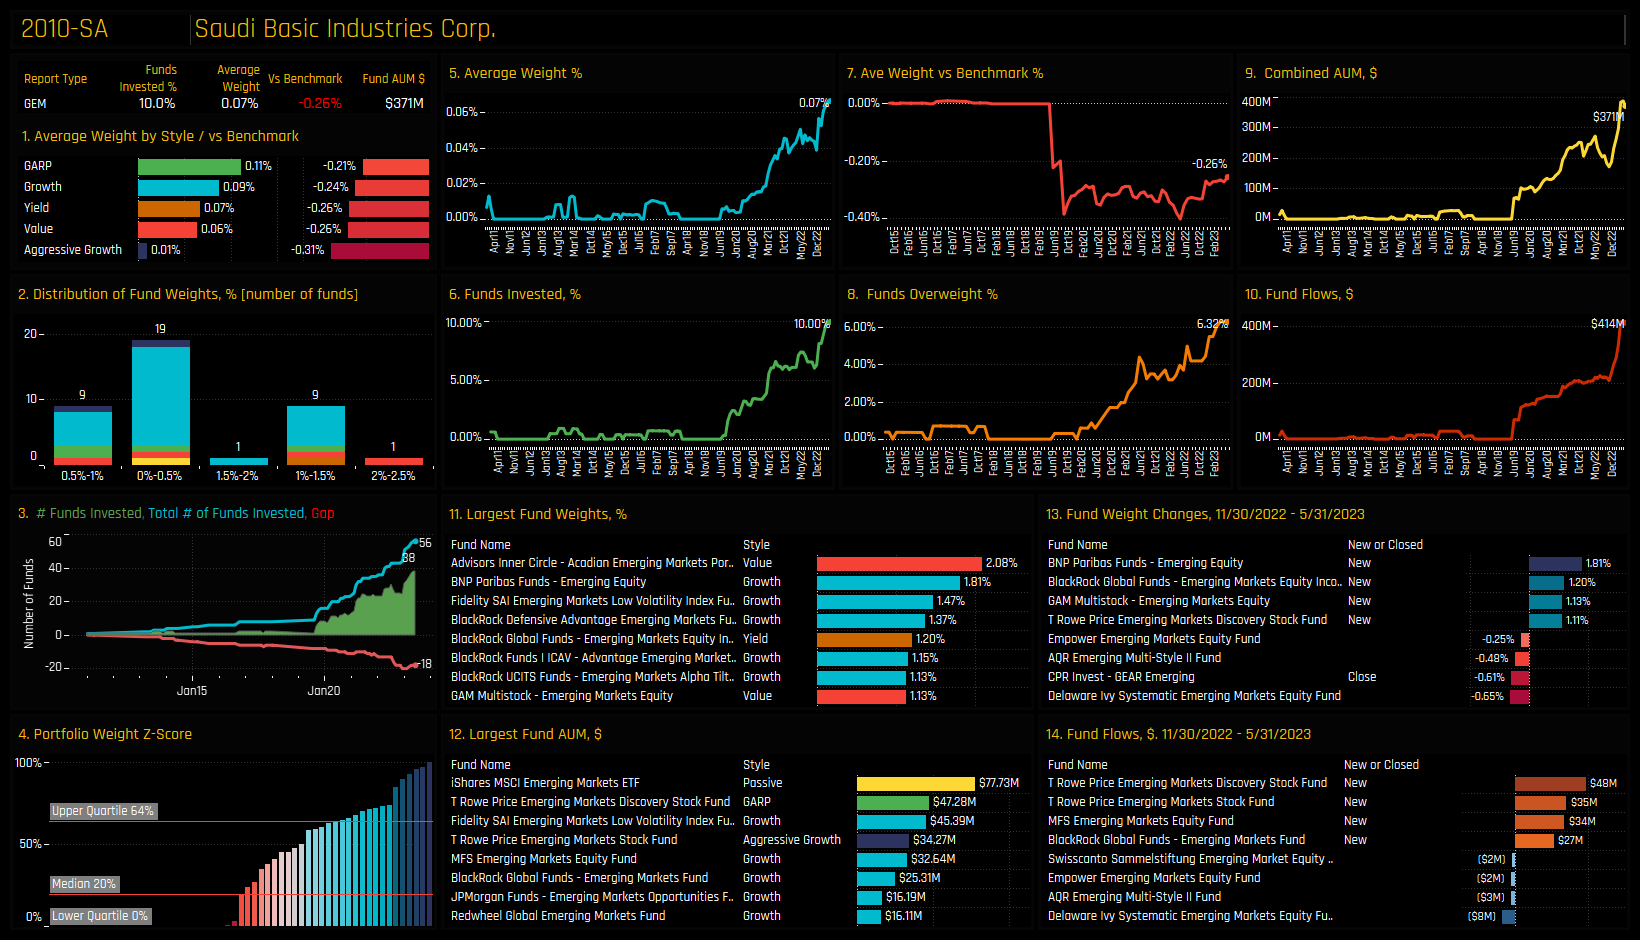
Stock level activity was, as we would expect, negative on balance with more stocks seeing ownership drops than increases. Both Anglo American Platinum and Polymetal International saw -4.2% of the funds in our analysis close positions, in addition to Sasol losing -3.95% and Eregli Demir -3.16%. The main shining light was Saudi Basic Industries, which saw +3.6% of funds open new positions after a combined $177m of inflows.
Conclusions & Data Report
Sentiment is at an all-time low in the EMEA Materials sector. A record number of managers have taken the decision to avoid the sector completely, closing positions in key stocks and becoming increasingly comfortable in running an underweight position. Instead, active EM managers have rotated towards Asian Information Technology and EMEA Consumer Discretionary stocks, whilst maintaining overweights in a number of Latin American sectors.
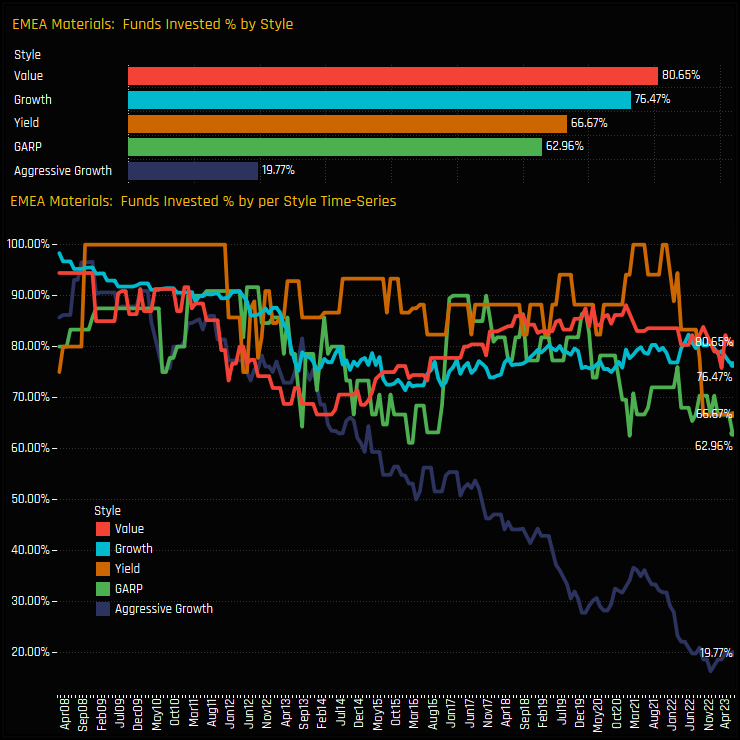
The chart to the right shows the percentage of funds invested in EMEA Materials over time, split by fund Style. The decline in ownership has in part been driven by funds at the Aggressive Growth end of the spectrum. From near full ownership in 2008, just 19.8% of Aggressive Growth managers remain exposed, a huge decline. Whilst Yield, Growth and GARP fund ownership has also fallen to near record lows, they remain quite well invested with between 60% and 80% of funds exposed. Only Value funds are maintaining something close to average levels of exposure.
So clearly, EMEA Materials are not the flavour of the month. Saudi Materials, in the form of Saudi Basic Industries are the one remaining bright spot. Elsewhere though, sentiment has hit rock bottom, and it feels that current holders will be questioning their positions more than those who have no exposure at all.
Click on the link below for a detailed report on fund positioning in the EMEA Materials sector. Scroll down for stock profiles on Impala Platinum, Gold Fields, Saudi Basic Industries and AngloGold Ashanti.
As the Macro picture improves, an increasing number of active EM funds are turning to Greece to bolster their EMEA exposure.
Time-Series & EMEA Country Activity
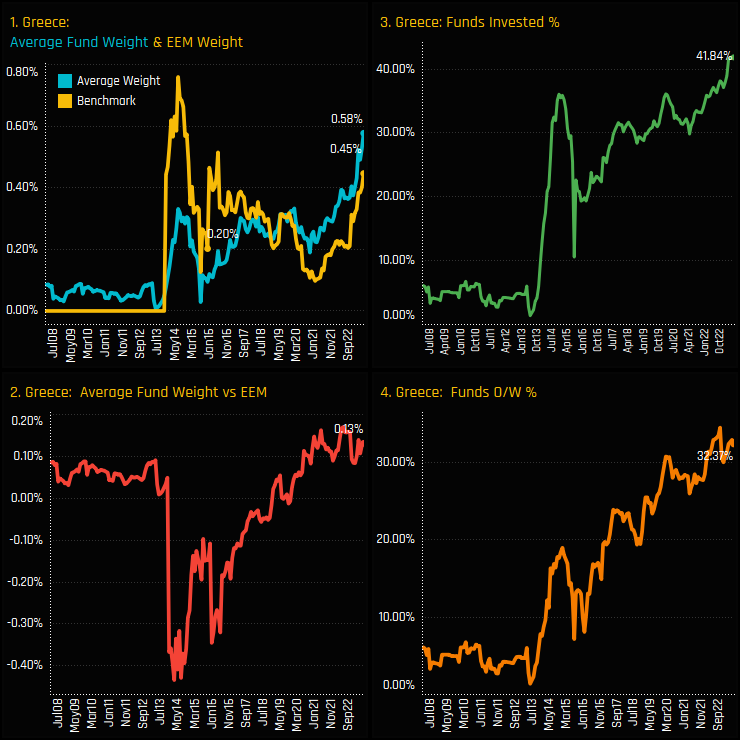
We wrote about the renaissance in Greek exposure among EM managers earlier in the year, but we thought it was worth revisiting given exposure has hit fresh highs again this month. The percentage of EM managers with exposure now stands at 41.8% at an average weight of 0.58%, both the highest levels on record. EM active managers moved overweight on average in late 2019 and remain so today, with 32.4% position ahead of the iShares MSCI EM ETF.
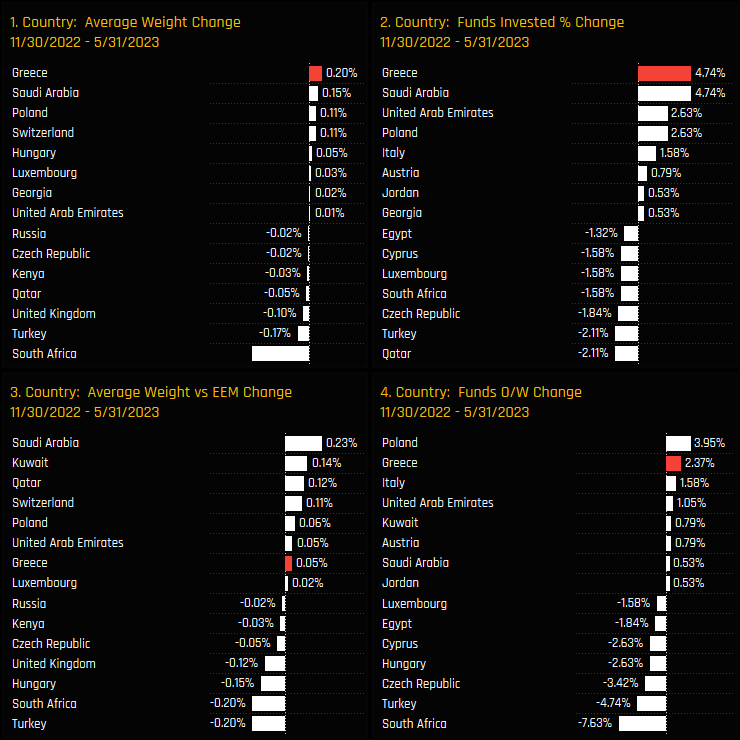
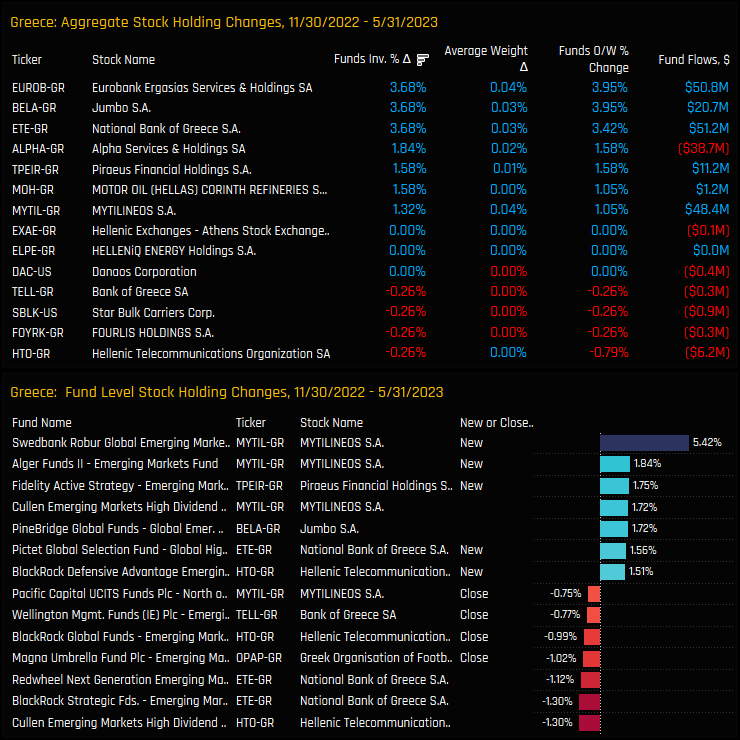
Focusing on countries in the EMEA region, Greece has been a key beneficiary of fund rotation over the last 6-months. Alongside Saudi Arabia, Greece captured new investment from +4.74% of the EM funds in our analysis, with average weights increasing more than any country at +0.2%. Instead, active managers reduced exposure to EM stalwarts South Africa and Turkey, whilst dialing back weights in Hungary and the Czech Republic. Managers are effecting an active rebalance in the EMEA region.
Fund Holdings & Activity
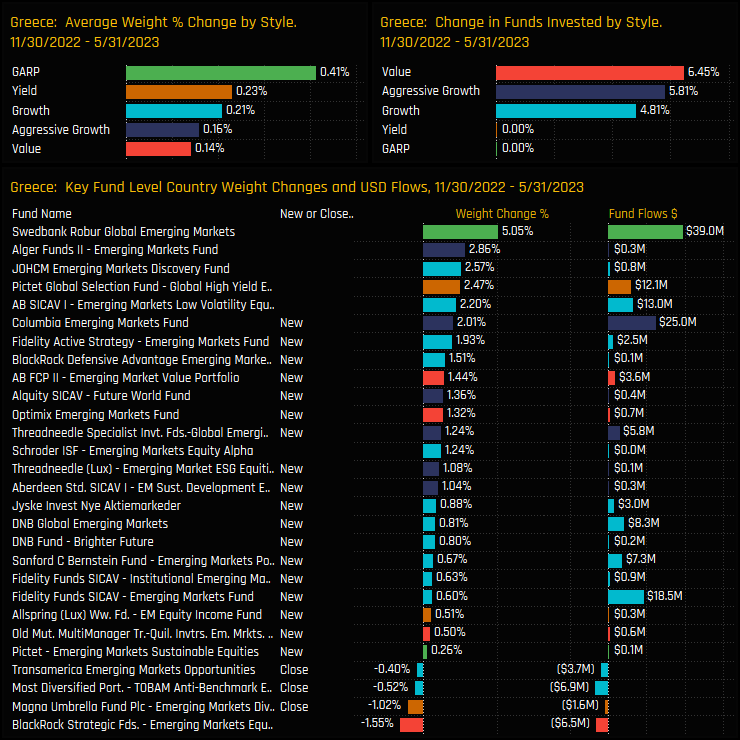
Over the last 6-months, new positions outnumbered closures by a factor of 6 (18 vs 3), whilst managers such as Swedbank Global EM and Alger EM increased existing exposure by +5.05% and +2.86% respectively. All Style groups saw allocations rise, with both Value and Growth managers buying in to the Greek market over the period.
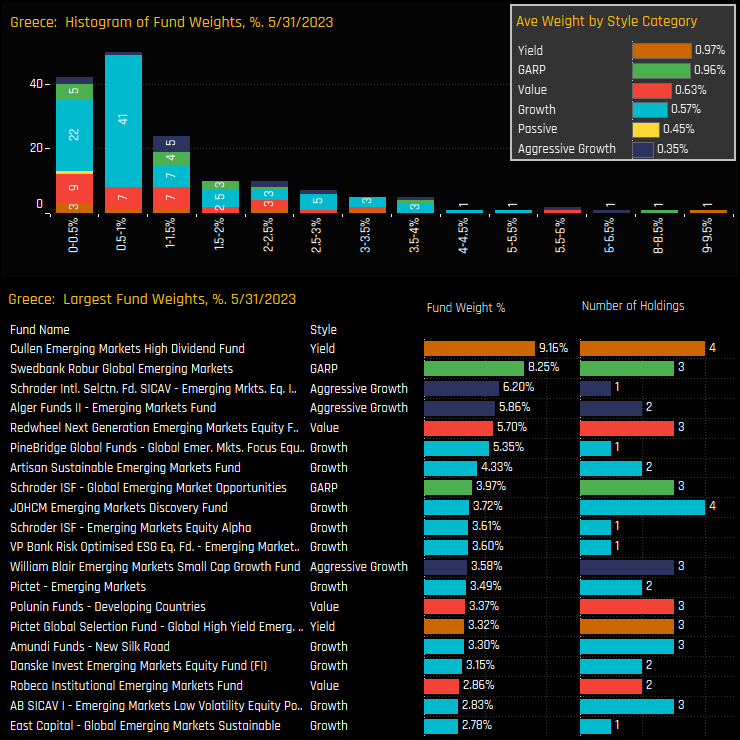
Outright positioning in Greece for the current crop of holders is still relatively small. The top chart below shows the bulk of holdings below 1.5%, though there are a group of 37 funds holding between 1.5% and 4%. The most bullish are above 4% and led by the Cullen EM High Dividend Fund on 9.16% and Swedbank Robur Global EM on 8.25%.
Stock Holdings & Activity
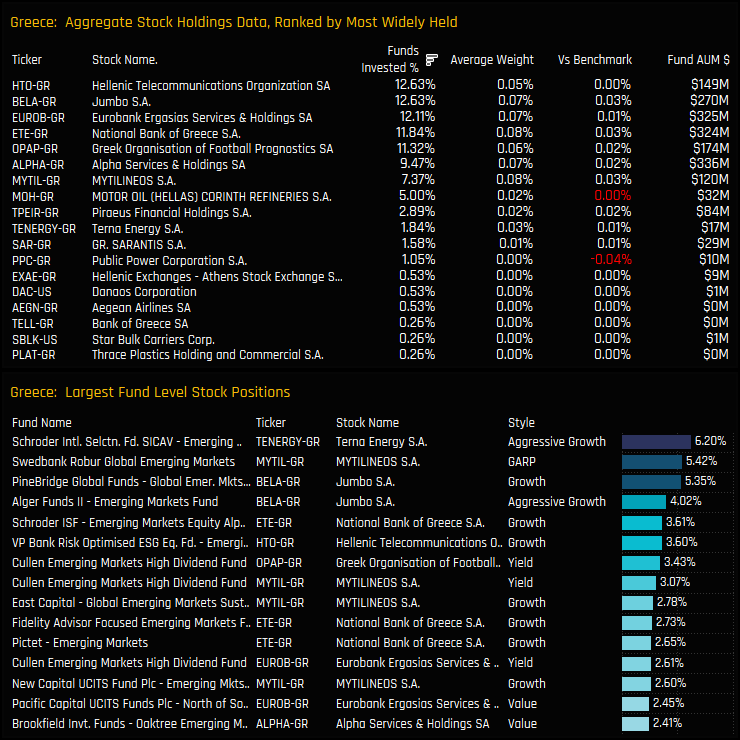
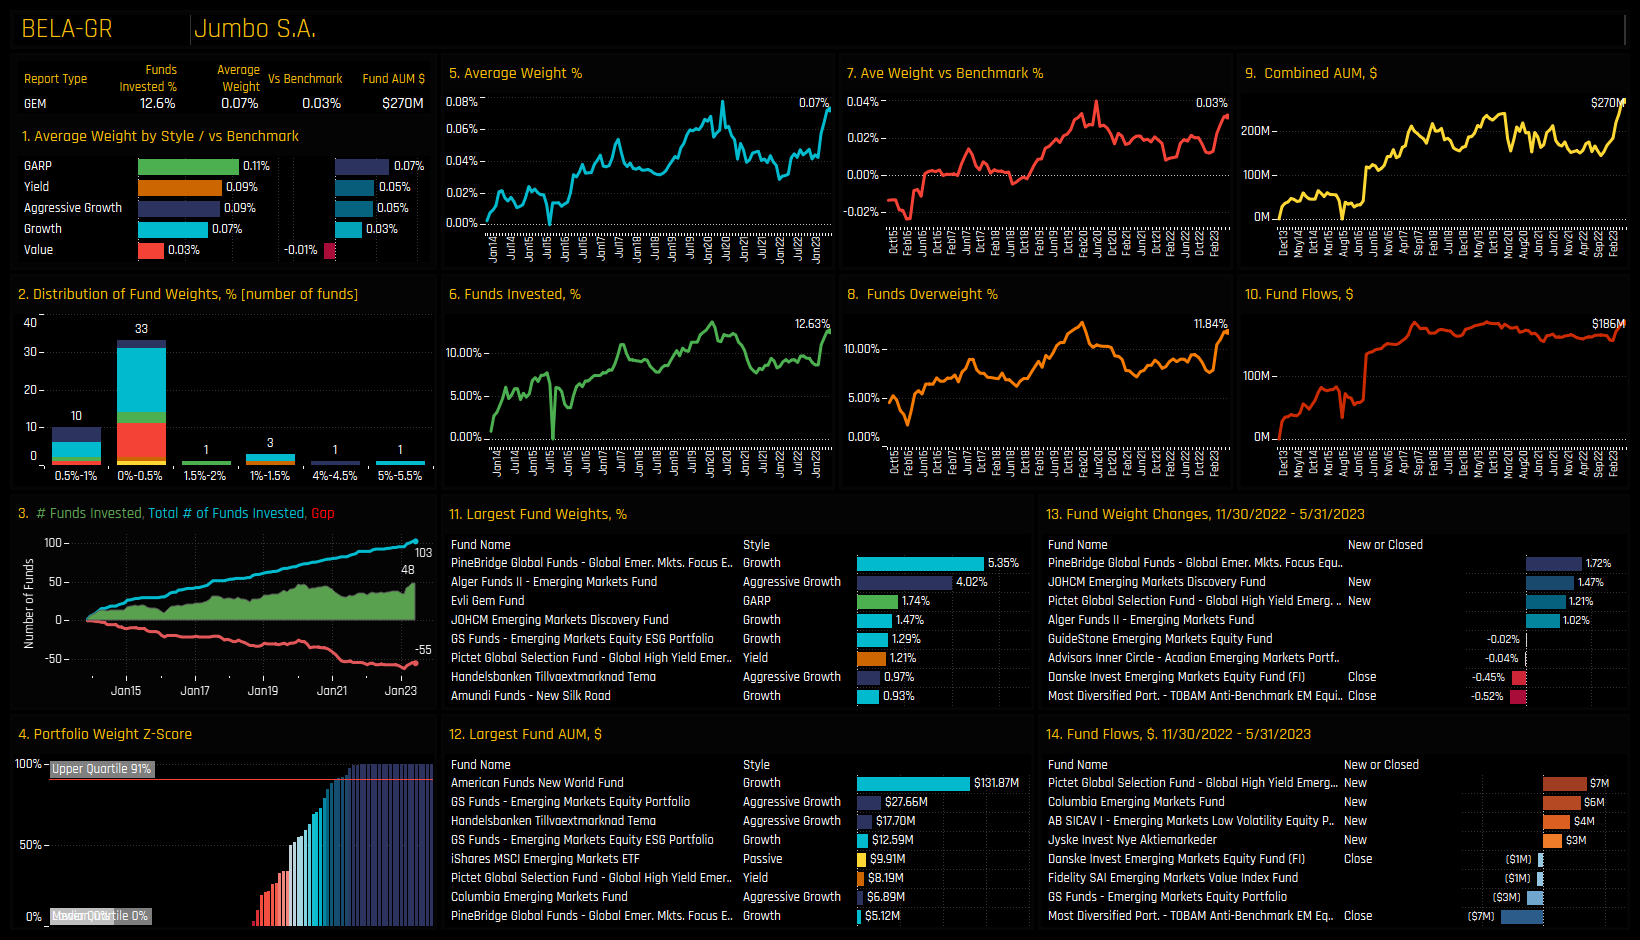
The top stock holdings are spread quite evenly across 5 companies, all held by between 11% and 13% of funds and led by Hellenic Telecommunications and Jumbo S.A. The high conviction positions in the bottom chart are led by Schroders EM Equity Impact in Terna Energy and Swedbank Robur Global EM in MYTILINEOS SA.
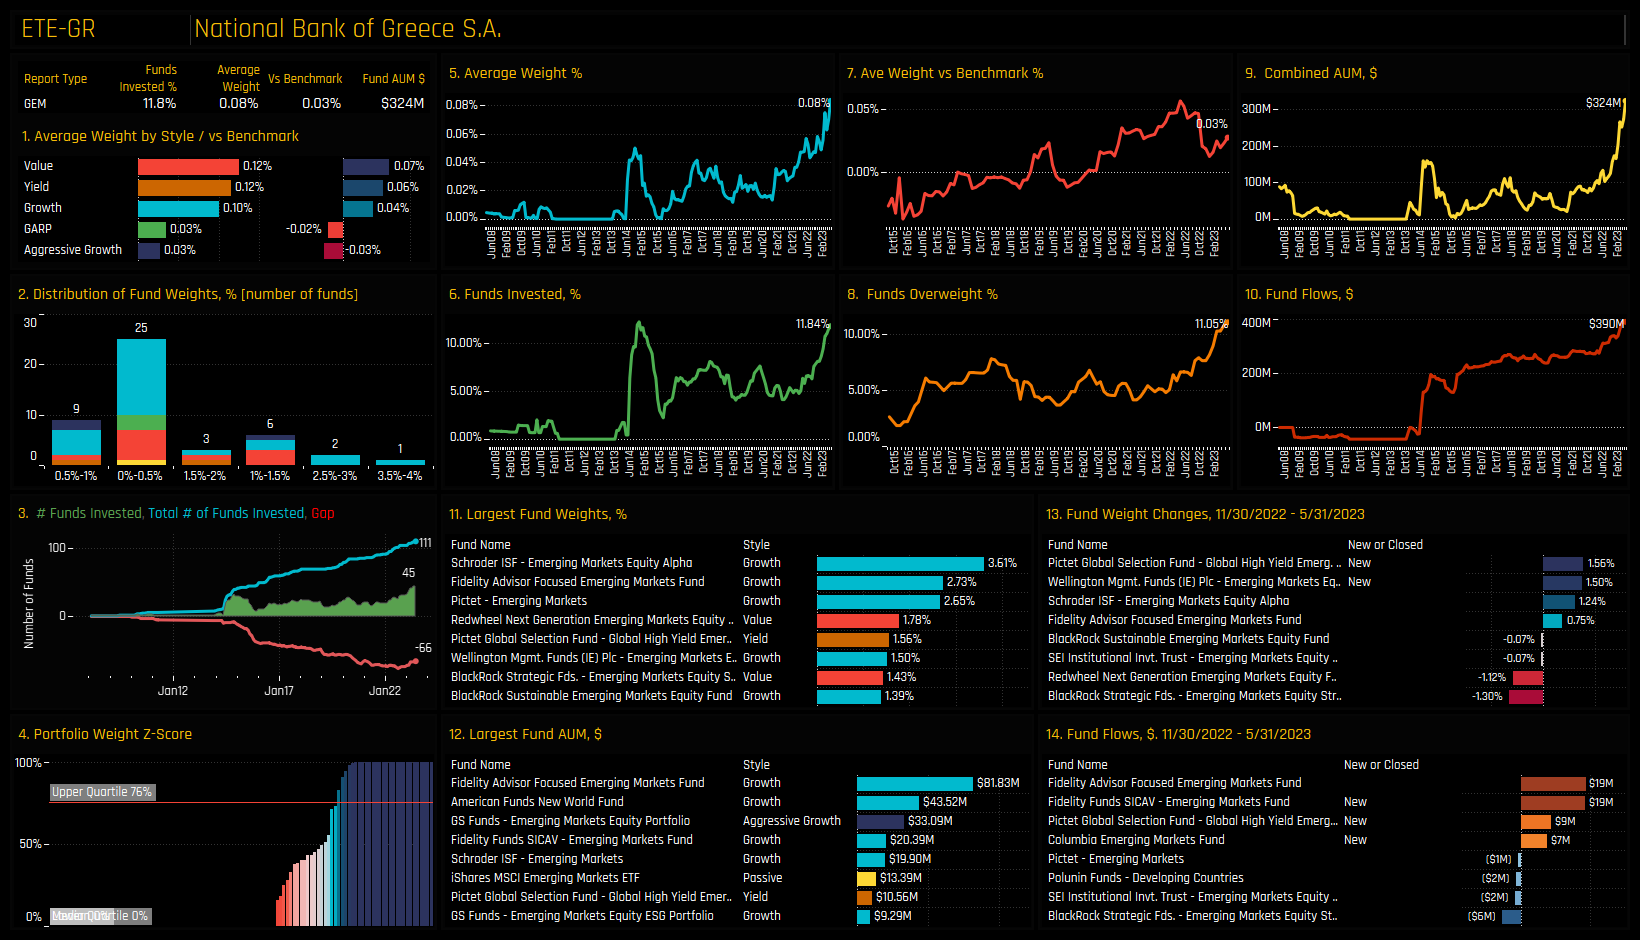
The stocks underpinning the Greek rotation are shown in the charts below. The bulk of the stock repositioning between 11/30/2022 and 05/31/2023 was positive, with Eurobank Ergasias, Jumbo SA and National Bank of Greece capturing the largest increases in investment. On a single fund level, new positions in MYTILINEOS by Swedbank Robur and Alger Funds top the list.
Conclusions & Data Report
Over the last 2 years there has been a clear shift in sentiment towards Greece. An improving Macro picture driven by strong GDP growth, structural reforms and improved fiscal discipline has restored investor confidence.
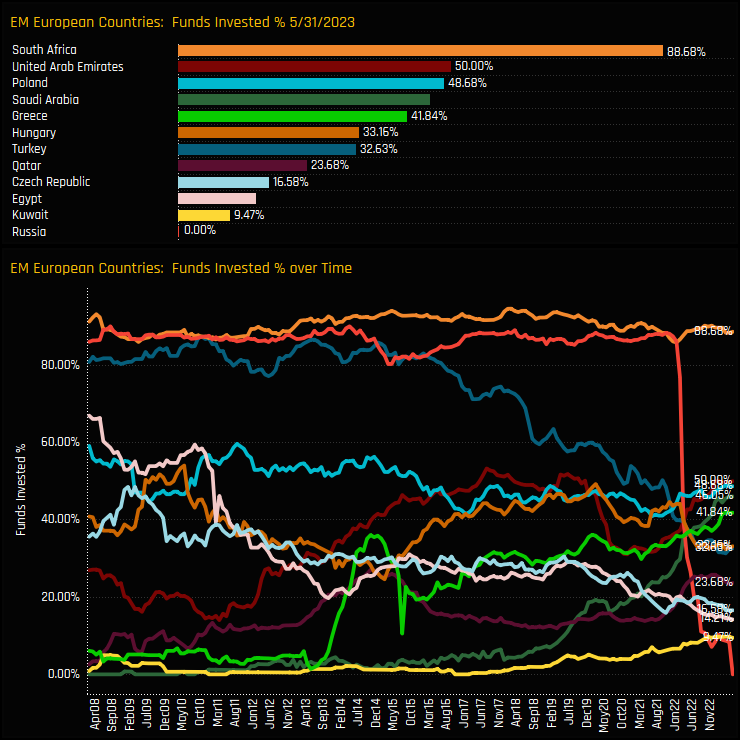
The rotation in to Greece follows something of a shift in EM European investment preferences since the removal of Russia from financial markets in 2022. The charts to the right show the percentage of EM funds invested in each EM European country over time (bottom) and as of the end of last month (top). Whilst South Africa has maintained a 80%+ investor base over the last 15 years, Turkey has seen year-on-year declines and Russia has of course disappeared as positions are marked to zero. In their place, Greece has risen to the 5th most widely held country allocation behind Saudi Arabia, and Qatar and Kuwait have seen allocations rise to near record levels.
This rotation is in its infancy, with all countries bar South Africa owned by less than 50% of funds. If momentum continues and more funds gain exposure, these countries will become harder for EM investors to ignore, and Greece is front and centre of this trend.
Click on the link below for the latest data pack on Greek positioning among active EM funds. Scroll down for stock profiles on Hellenic Telecommunications, Eurobank, National Bank of Greece and Jumbo S.A.
Aggressive Growth managers in our EM analysis are increasing exposure to non-benchmark Japanese equities. Selected stocks with EM exposure are proving attractive to high growth investors.
Fund Style Classification
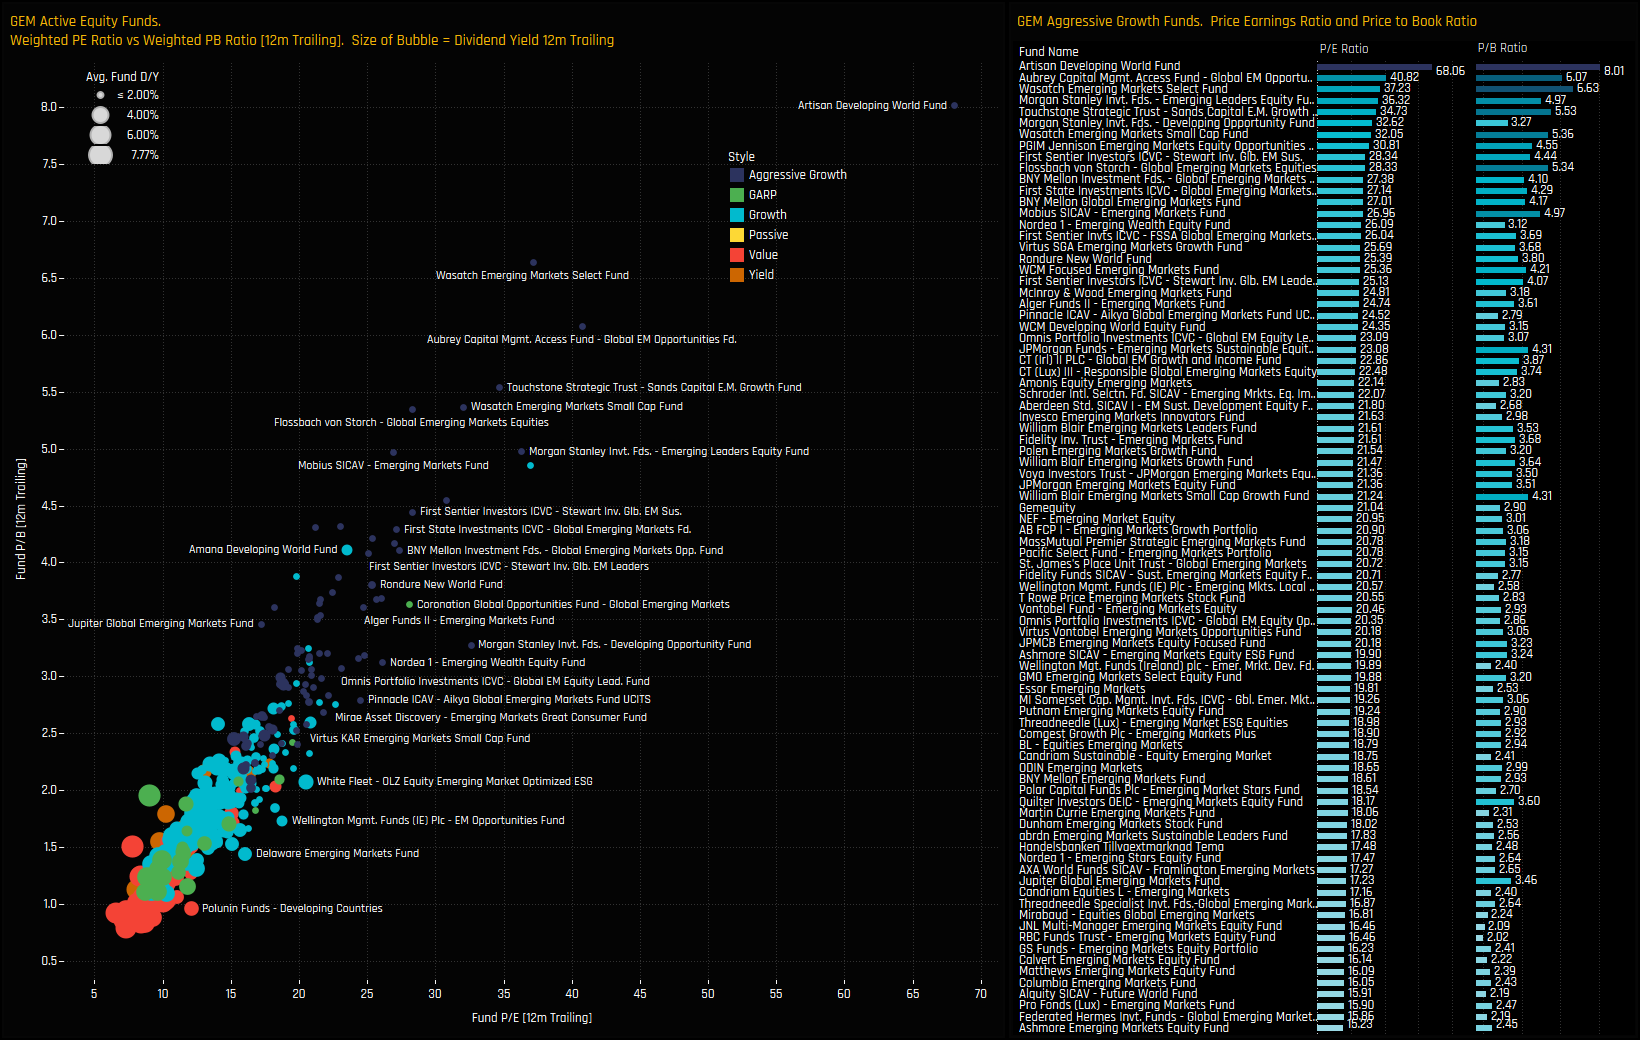
We categorise the 380 EM funds in our analysis into a Style category based on the P/E and P/B ratios of their portfolio compared to the benchmark iShares MSCI EM ETF. The left hand chart below plots the weighted P/E and P/B ratios for each fund, with the colour of the dot representing the Style and the size it’s Dividend Yield.
To be classified as Aggressive Growth, at least 70% of the portfolio must be in stocks with a higher P/E than the iShares MSCI EM ETF average, and at least 70% with a higher P/B ratio. Of the 380 funds, 86 come under the Aggressive Growth category, details of which can be seen in the right hand chart below.
Aggressive Growth Funds in Japan
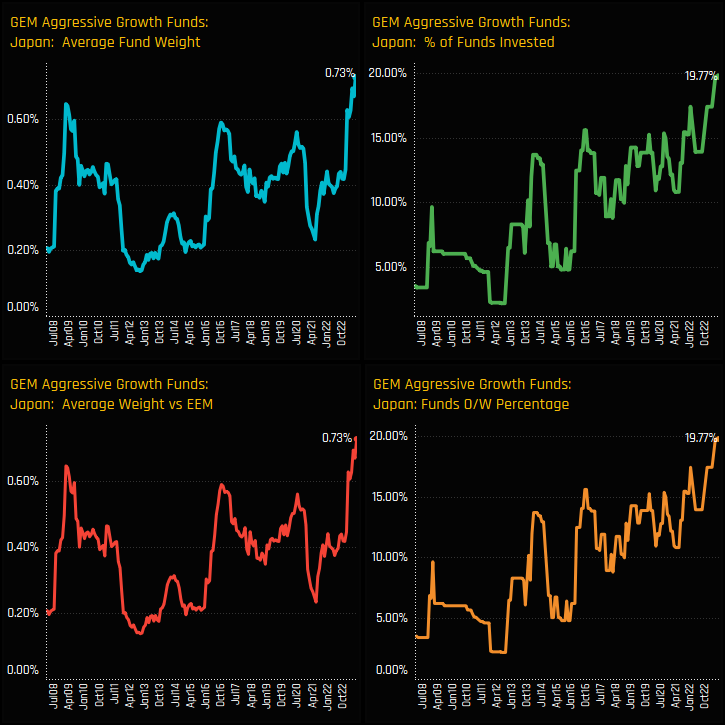
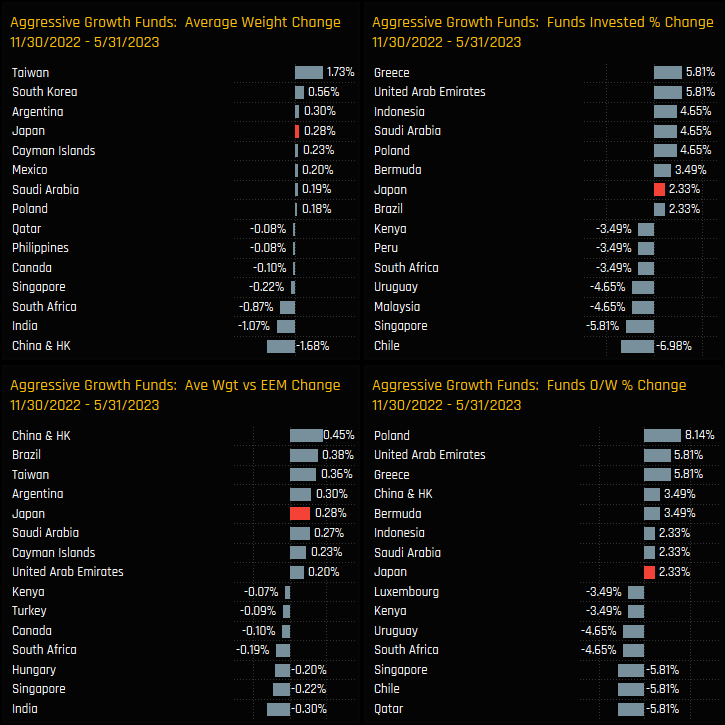
In this analysis, we look at Aggressive Growth strategies and their exposure to Japanese equities. It might come as a surprise that such an exposure exists at all among Emerging Market strategies, but quite often EM managers invest outside of benchmarks in developed market stocks with EM exposure. The charts below show ownership levels in Japan increasing to record levels, with 19.8% of Aggressive Growth funds invested at an average weight of 0.73%.
The growth in Japanese exposure has really accelerated over the last 6-months. Compared to country peers, Japan features among the top performers over the period, attracting a further +2.3% of funds and with average weight increases of 0.28% – the 4th highest after South Korea, Argentina and Taiwan. This has been an active and deliberate rotation.
Fund and Stock Level Holdings
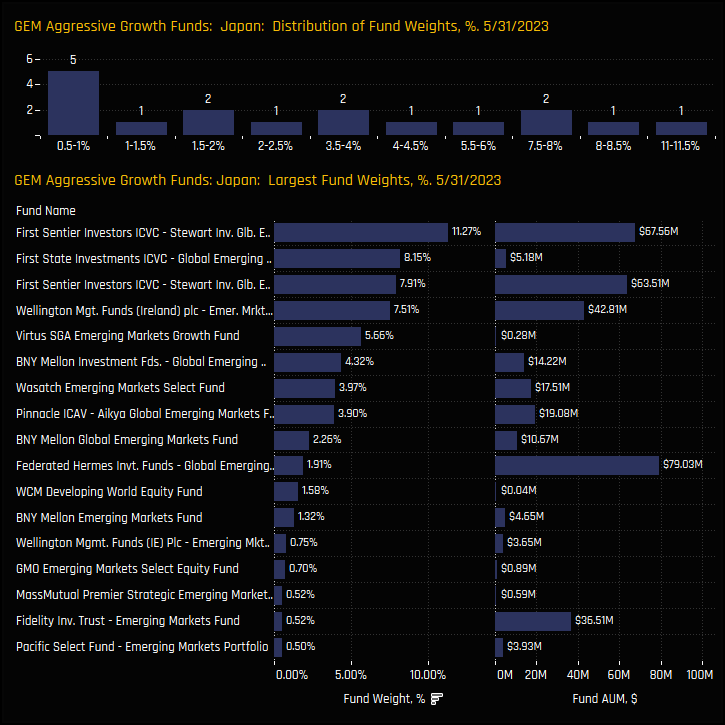
Fund holdings in Japan are spread across a wide range. At the bottom end are a number of funds with a sub-1% holding, but at the top end are some fairly high conviction holdings, led by the First Sentier suite of EM strategies (EM, EM Leaders, EM Sustainable).
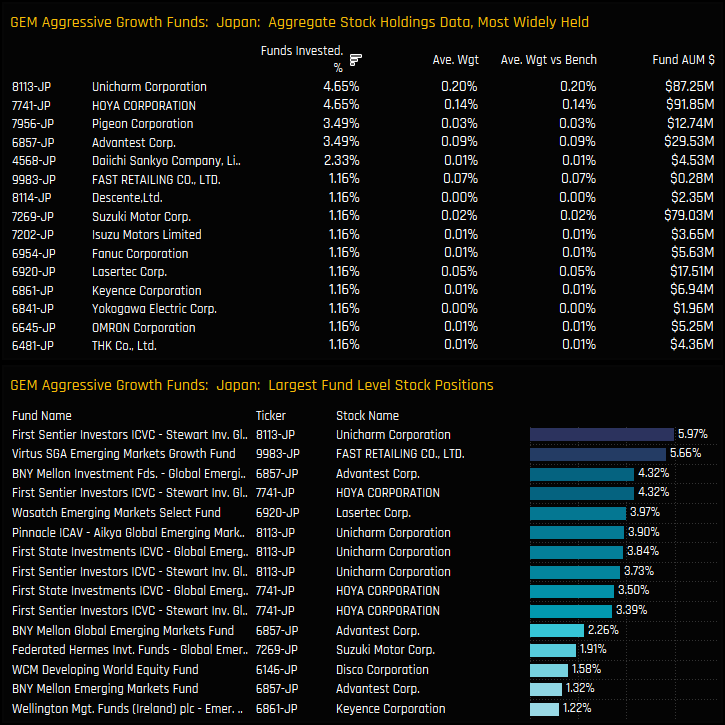
On a stock level, Unicharm Corporation and HOYA Corporation are the most widely held stocks, accounting for almost half of the total Japan allocation among Aggressive Growth funds. High conviction positions are led by Stewart EM Leaders in Unicharm (5.97%) and Virtus EM Growth in FAST Retailing (5.66%).
Conclusions
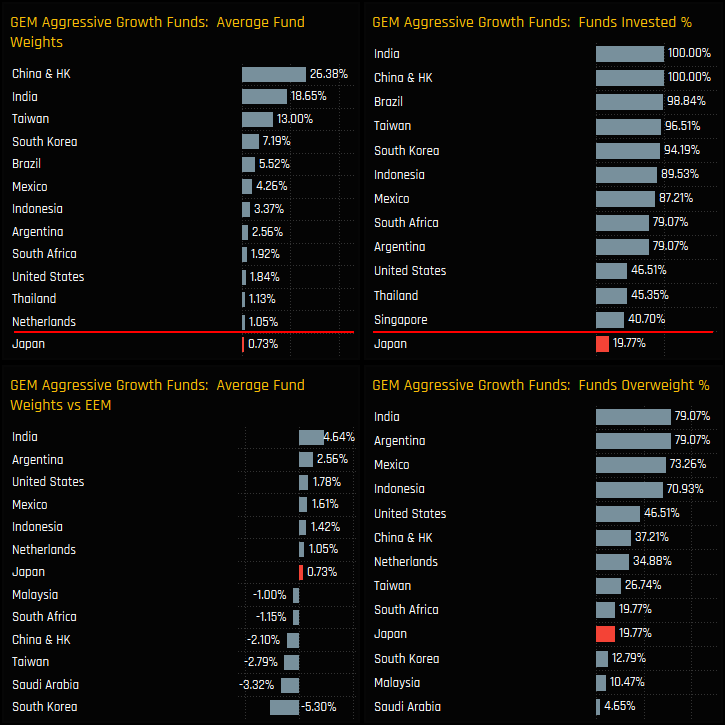
The charts to the right show the latest country ownership statistics for Emerging Market Aggressive Growth funds. Japan is more than just a rounding error, being the 15th largest country holding on an average weight basis – ahead of more established EM countries such as Poland, Saudi Arabia and The Philippines.
Versus the benchmark, Japan is the 9th largest country overweight and underscores the commitment of active managers in identifying Emerging Market opportunities beyond conventional indices, exemplified by companies like Unicharm Corp (8113 JP) with significant revenue from EM and Frontier countries.
Click below for a detailed report on Japan equity positioning among the active EM funds in our analysis.
Investment levels among the thousands of stocks in the investible Emerging Markets universe differ greatly. Some stocks are widely owned, others largely avoided with ownership levels changing every month. We combine current and historical positioning against shorter-term manager activity to get a handle on where sentiment lies for every stock in our EM analysis. We highlight 8 stocks at the extreme ends of their own positioning ranges whilst also seeing significant changes in fund ownership.
Stock Sentiment
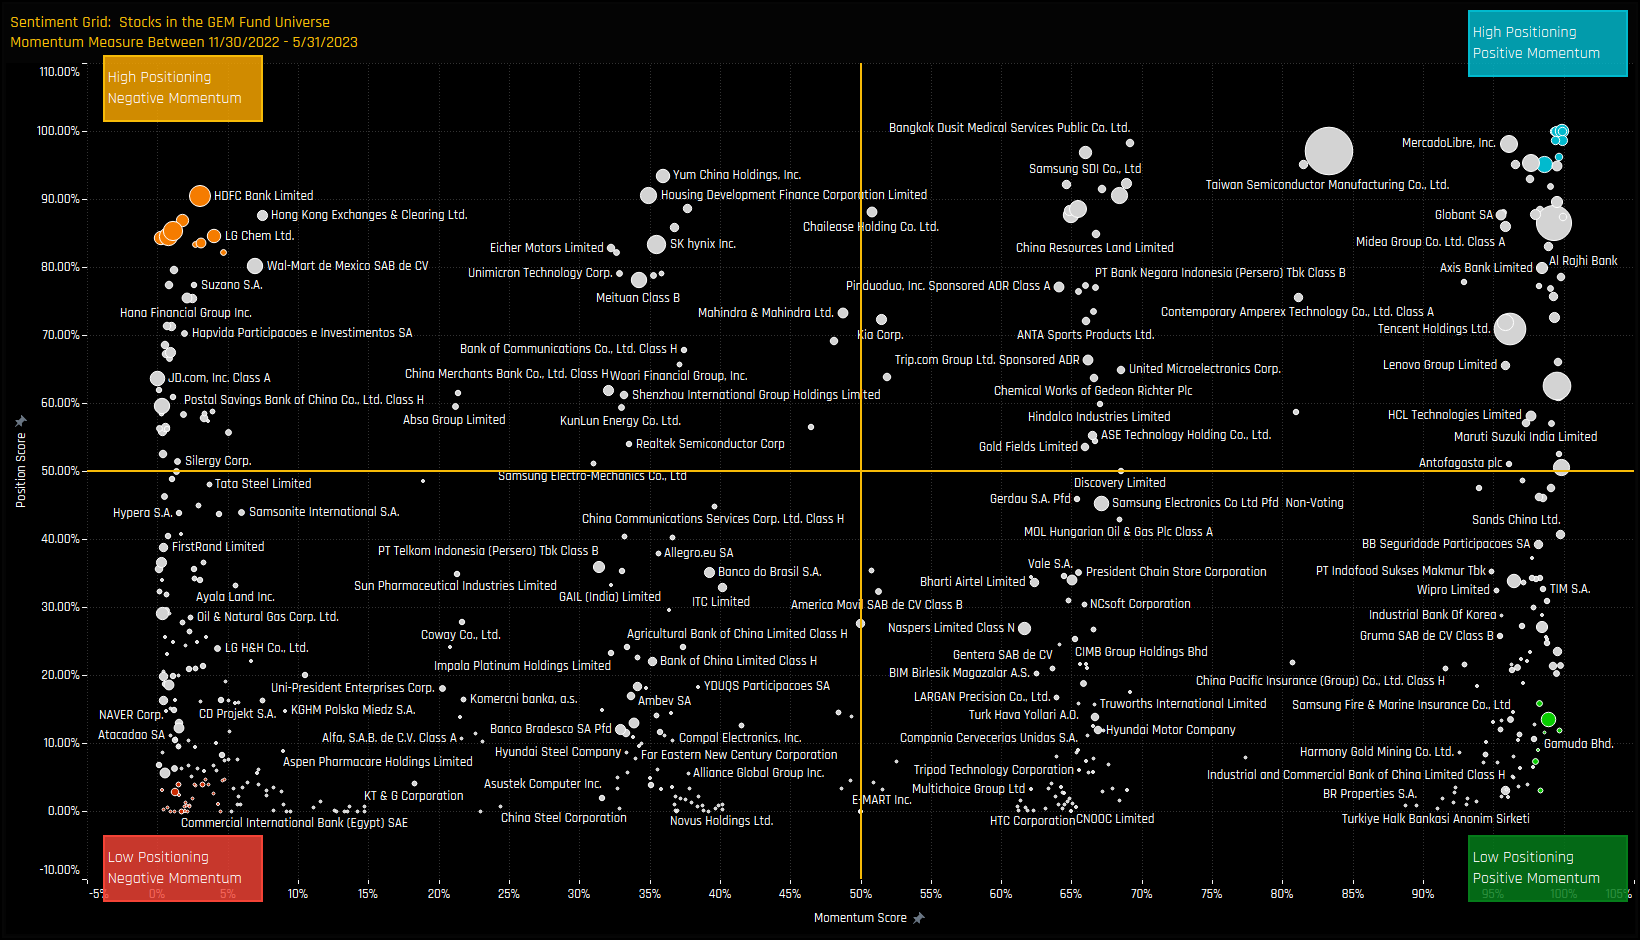
The Sentiment Grid below is designed to visualize the interplay between current fund positioning, long-term fund positioning and shorter-term fund manager activity for all stocks in the GEM fund active universe. The Y-axis shows the ‘Position Score’, a measure of current positioning in each stock compared to its own history going back to 2008 on a scale of 0-100%. It takes in to account the percentage of funds invested in each stock versus history, the average fund weight versus history and the percentage of funds overweight the benchmark versus history. The higher the number, the more heavily a stock is owned by active EM managers compared to its own history.
The X-Axis shows the ‘Momentum Score’, a measure of fund manager activity for each stock between 11/30/2022 and 05/31/2023 on a scale of 0% (maximum negative activity) to 100% (maximum positive activity). The Momentum Score takes in to account the change in the percentage of funds invested in each stock over the period, the change in average weight and the change in the percentage of funds overweight. The chart also highlights the companies at the extreme ends of each quadrant by colour, which will shall explore in more detail below.
Extreme Stocks
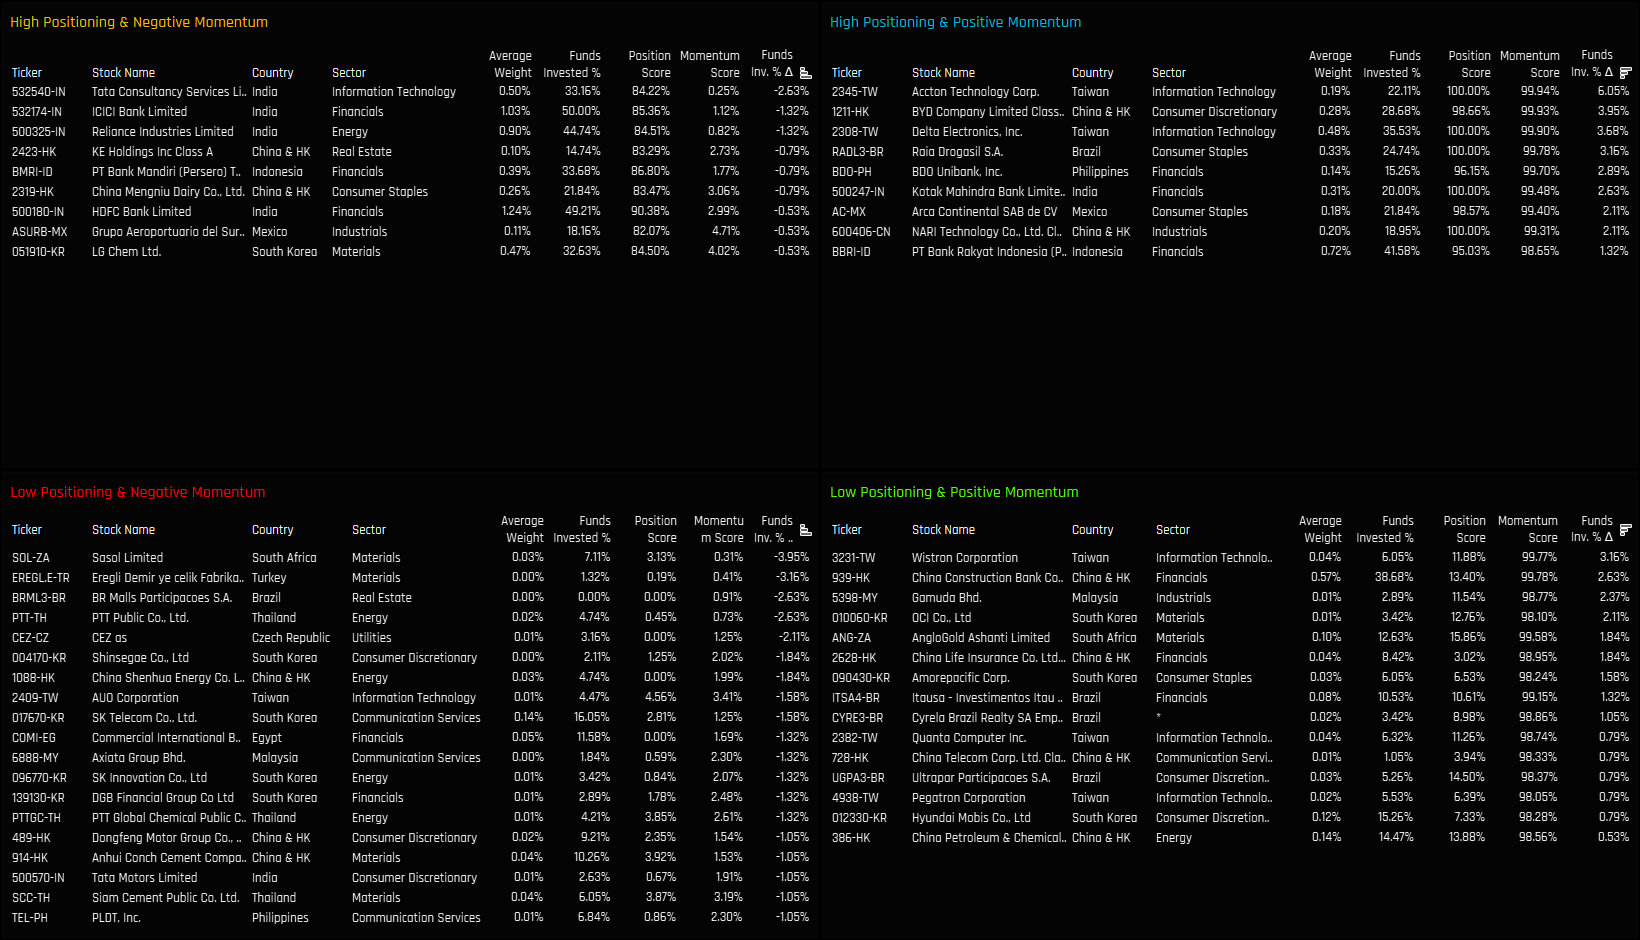
The tables below list the stocks in the extreme corners of each quadrant. The screening methodology is as follows:
High Positioning & Negative Momentum: Position Score > 80%. Momentum Score < 5%
High Positioning & Positive Momentum: Position Score > 95%. Momentum Score > 98%
Extreme Stocks Focus
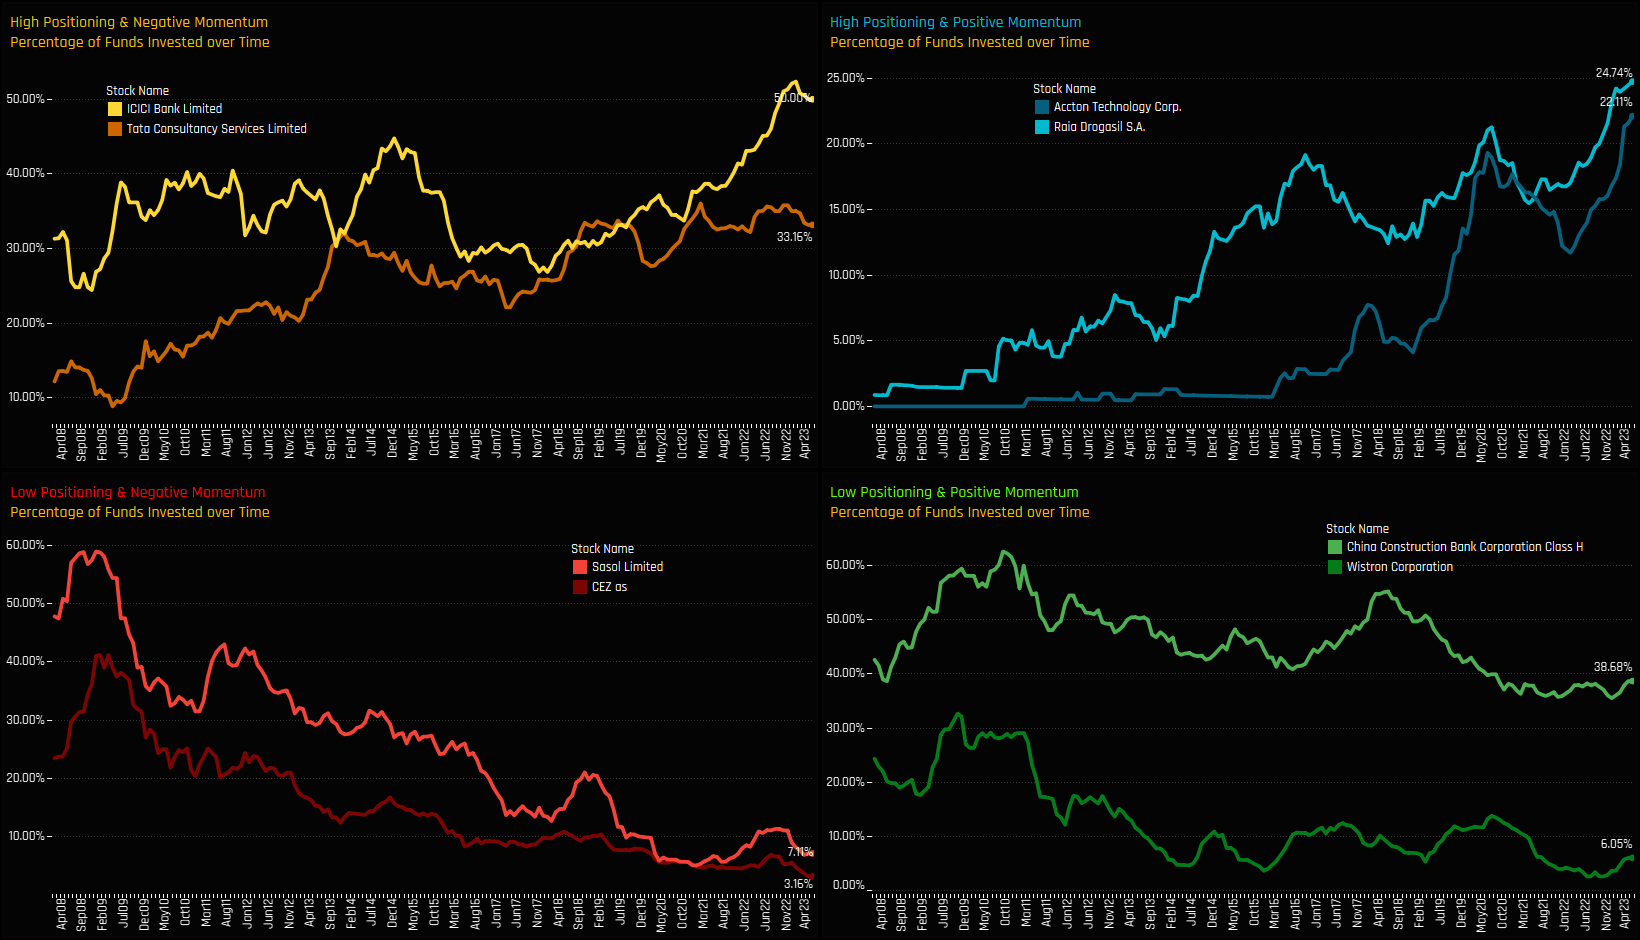
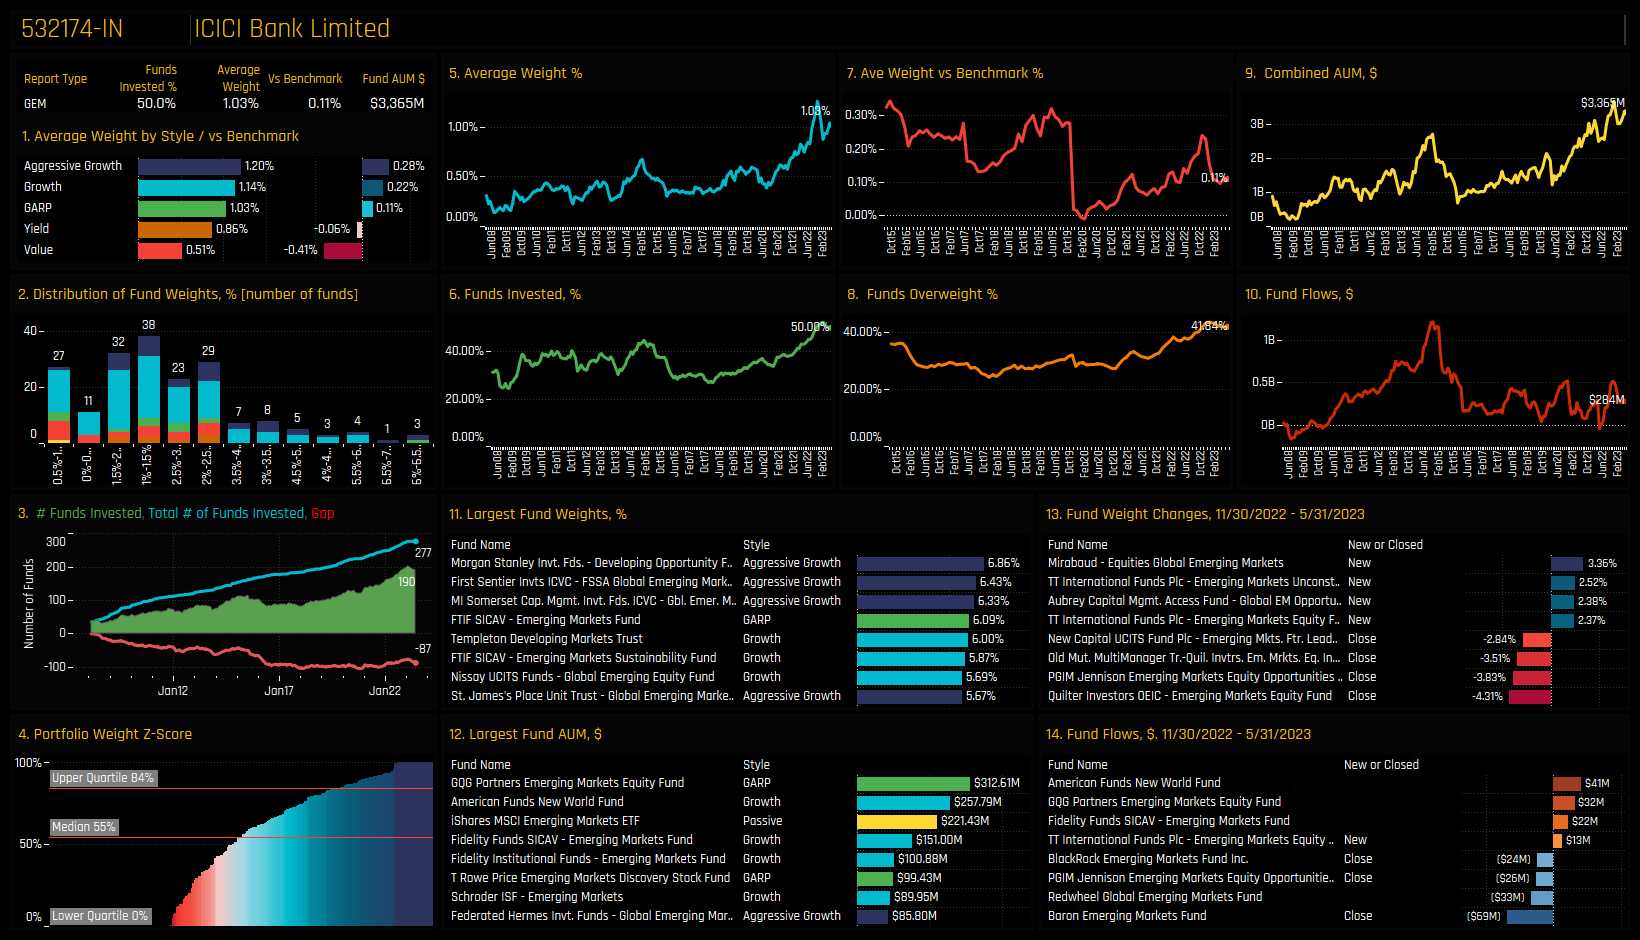
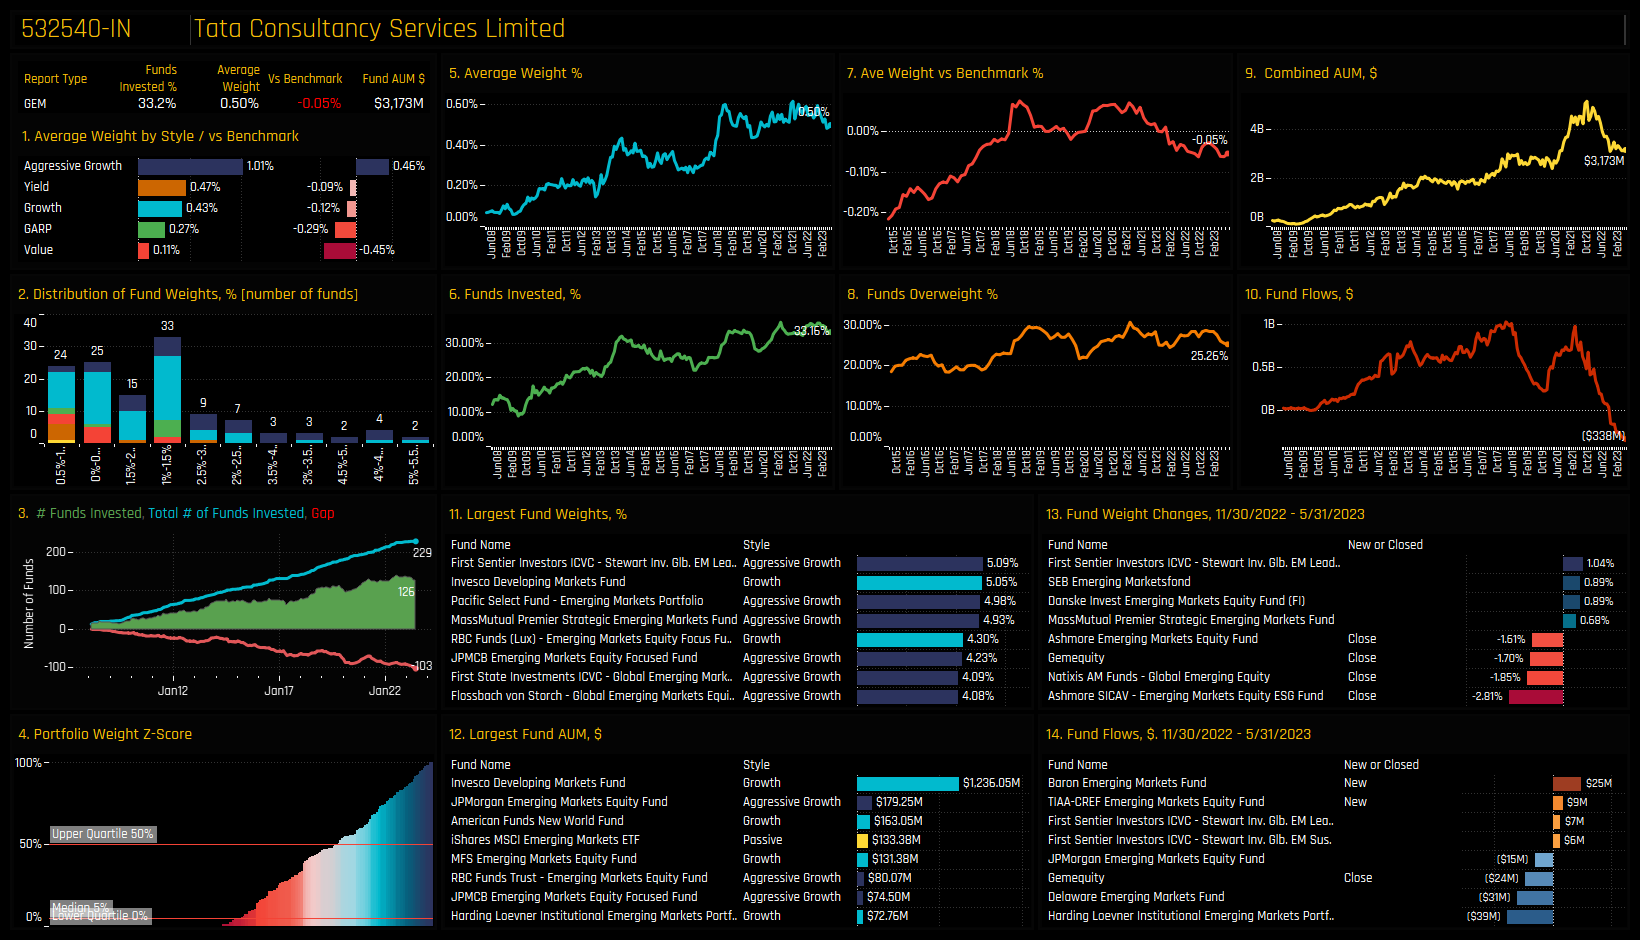
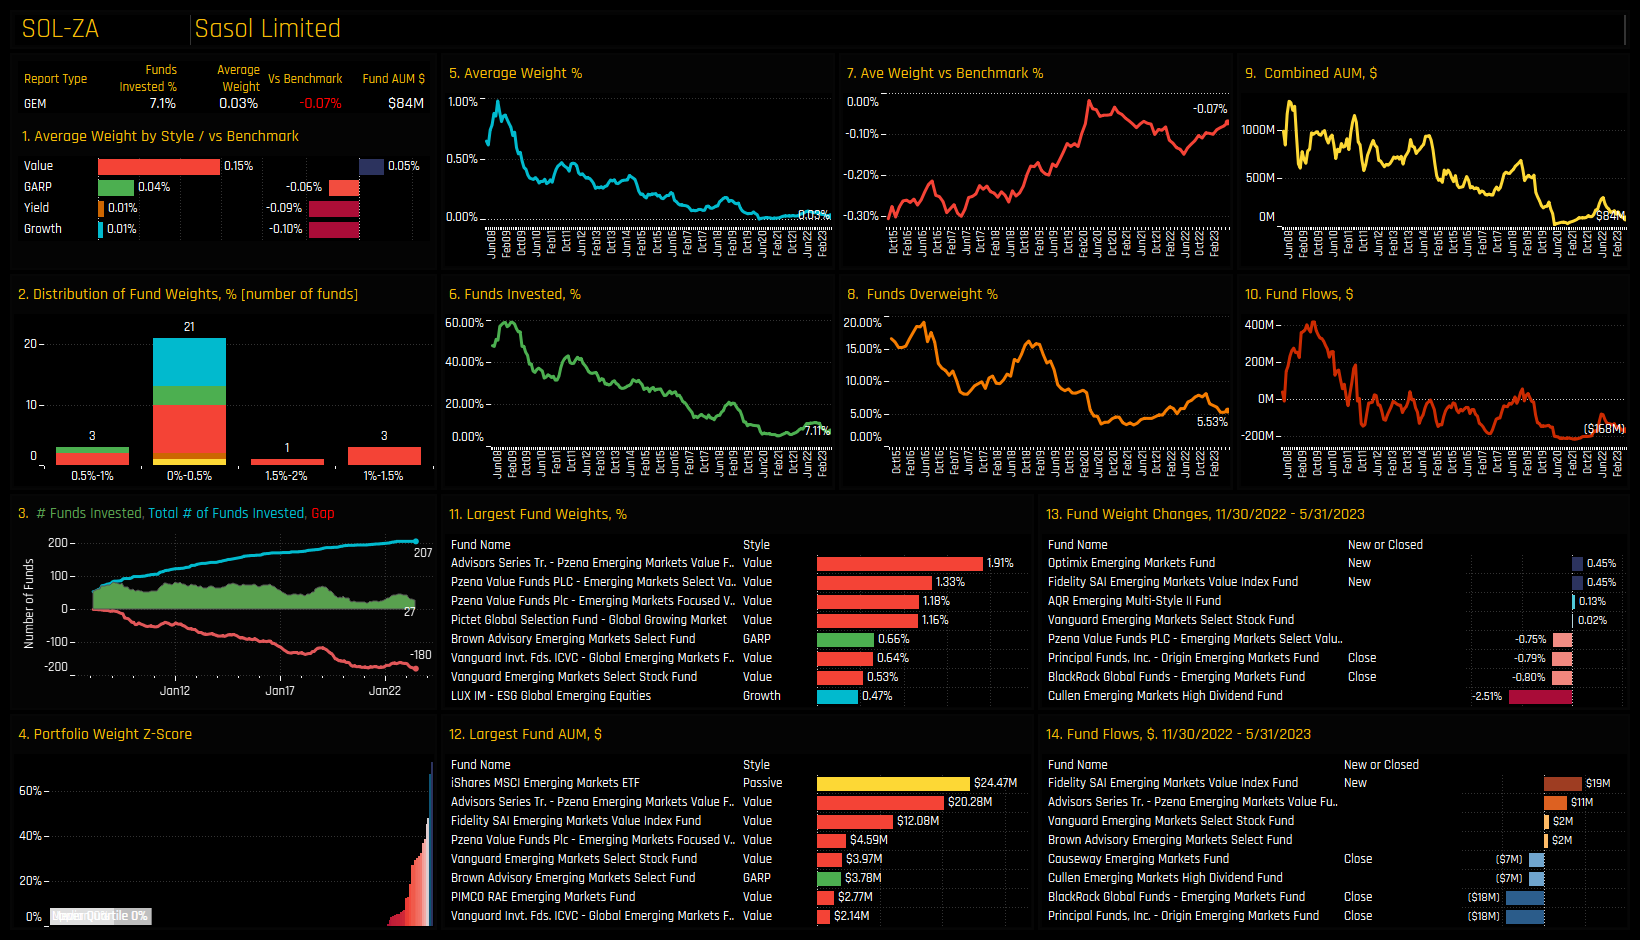
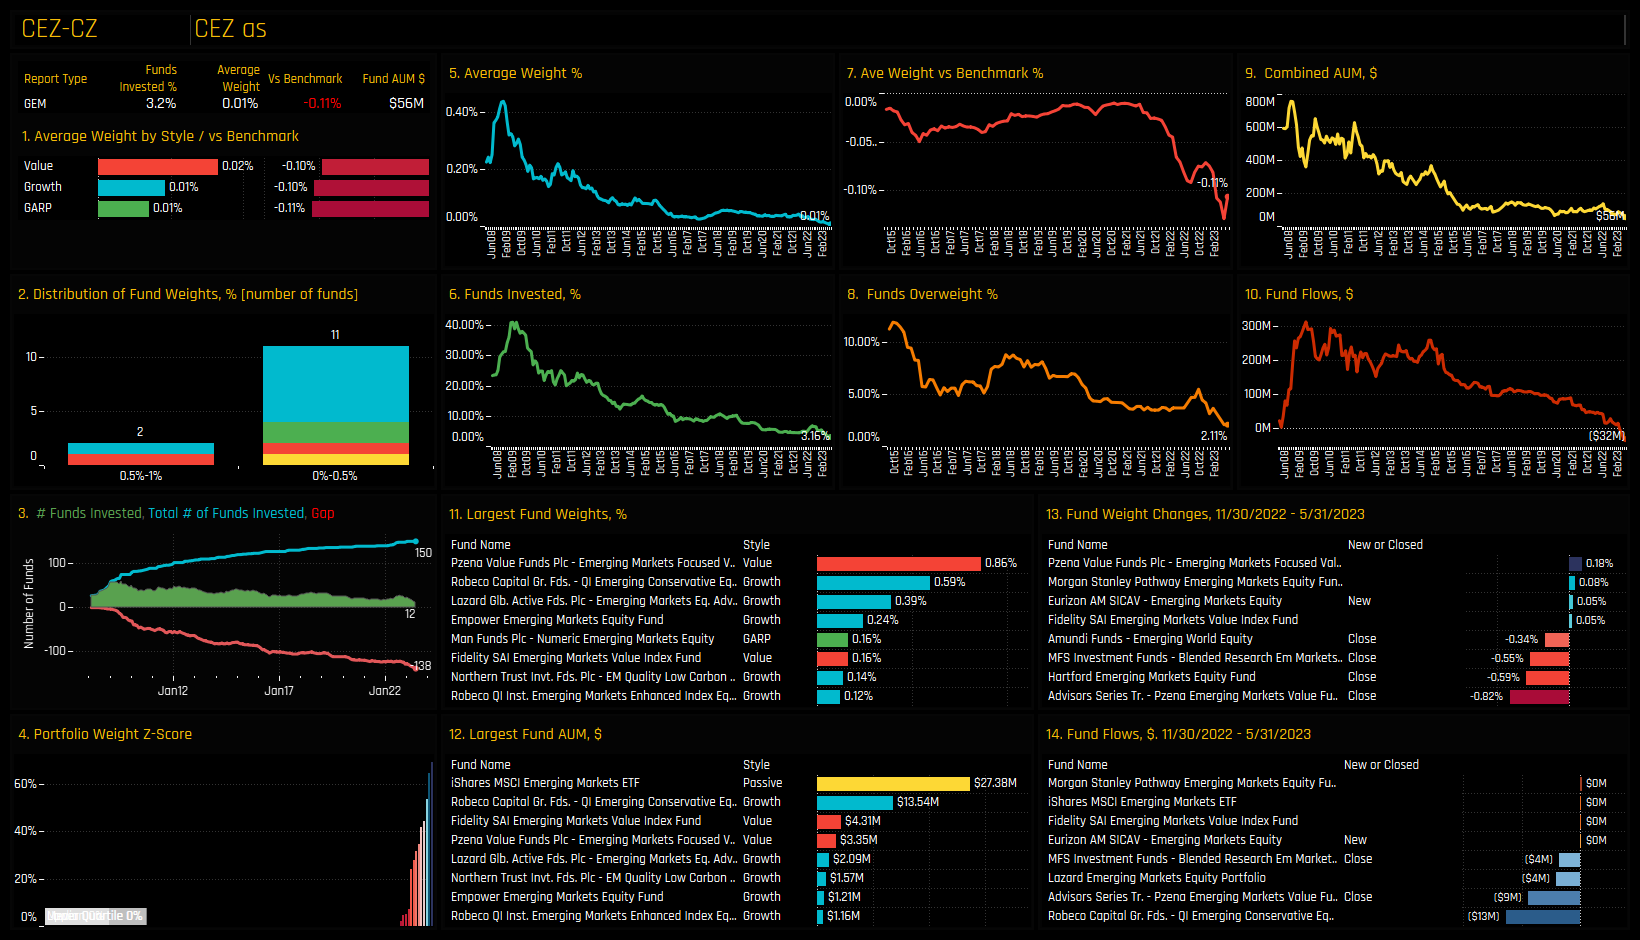
The following charts illustrate the proportion of active funds invested in the top 2 stocks within each of the 4 categories. This visualization provides an additional perspective how the Sentiment Grid works. For instance, in the chart located at the top-left, ICICI Bank Limited and Tata Consultancy Services experienced a decline in fund ownership after a prolonged period of growth. Moving to the chart in the bottom-left, both Sasol Limited and CEZ have suffered a long-term decline in ownership, with additional selling in recent months pushing exposure to its lowest levels in 15 years.
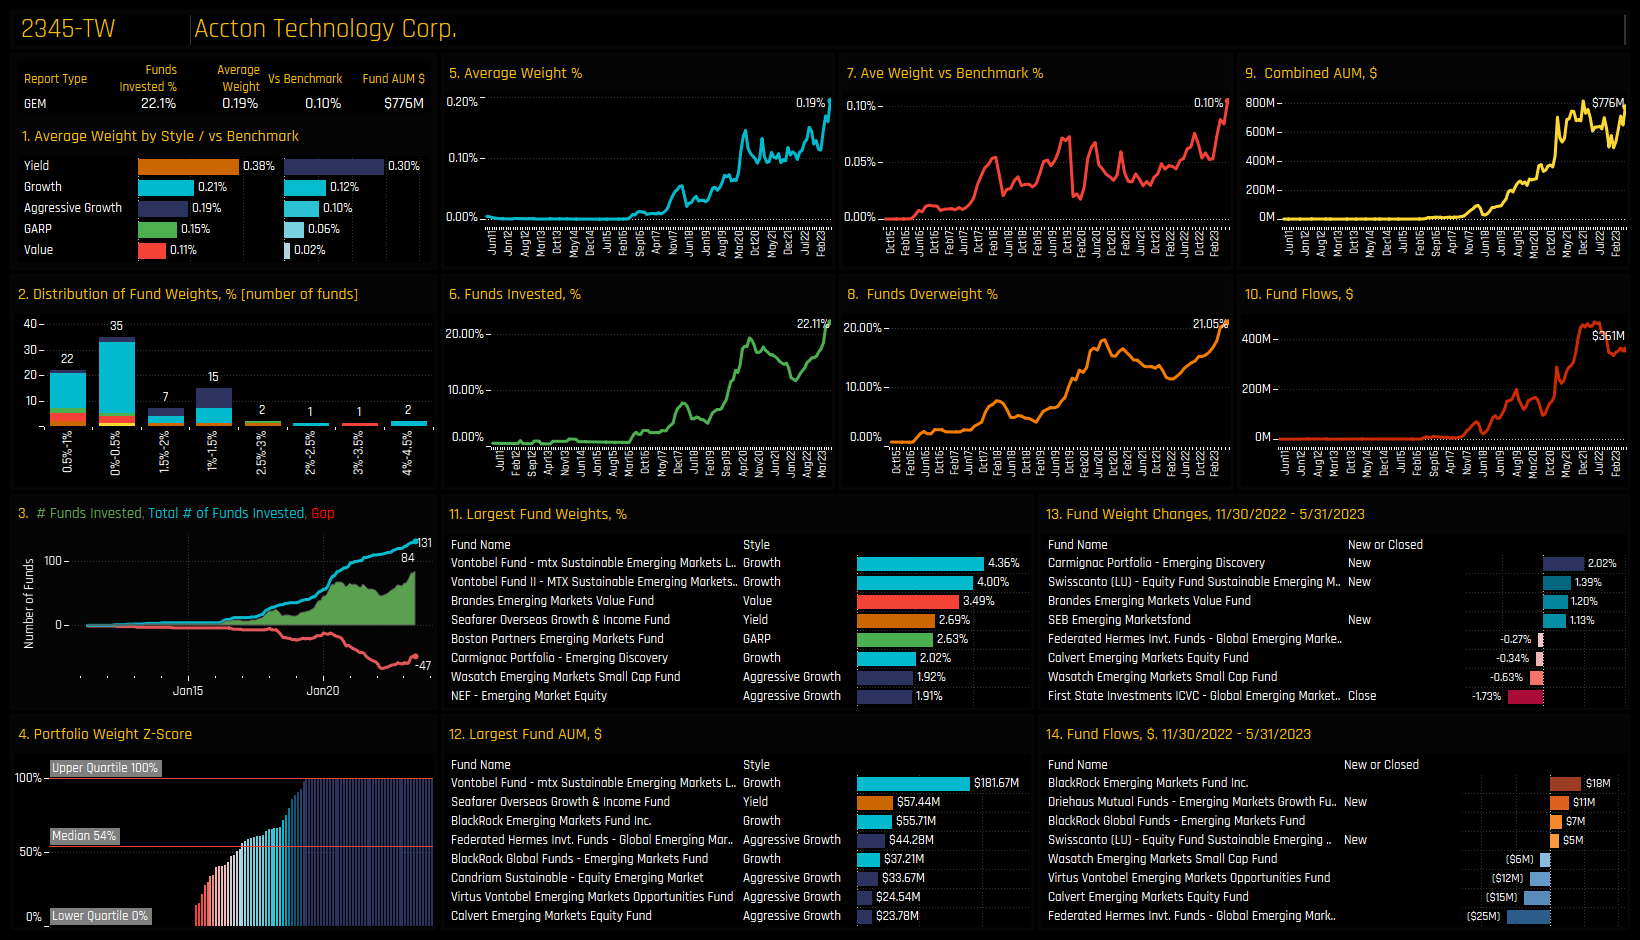
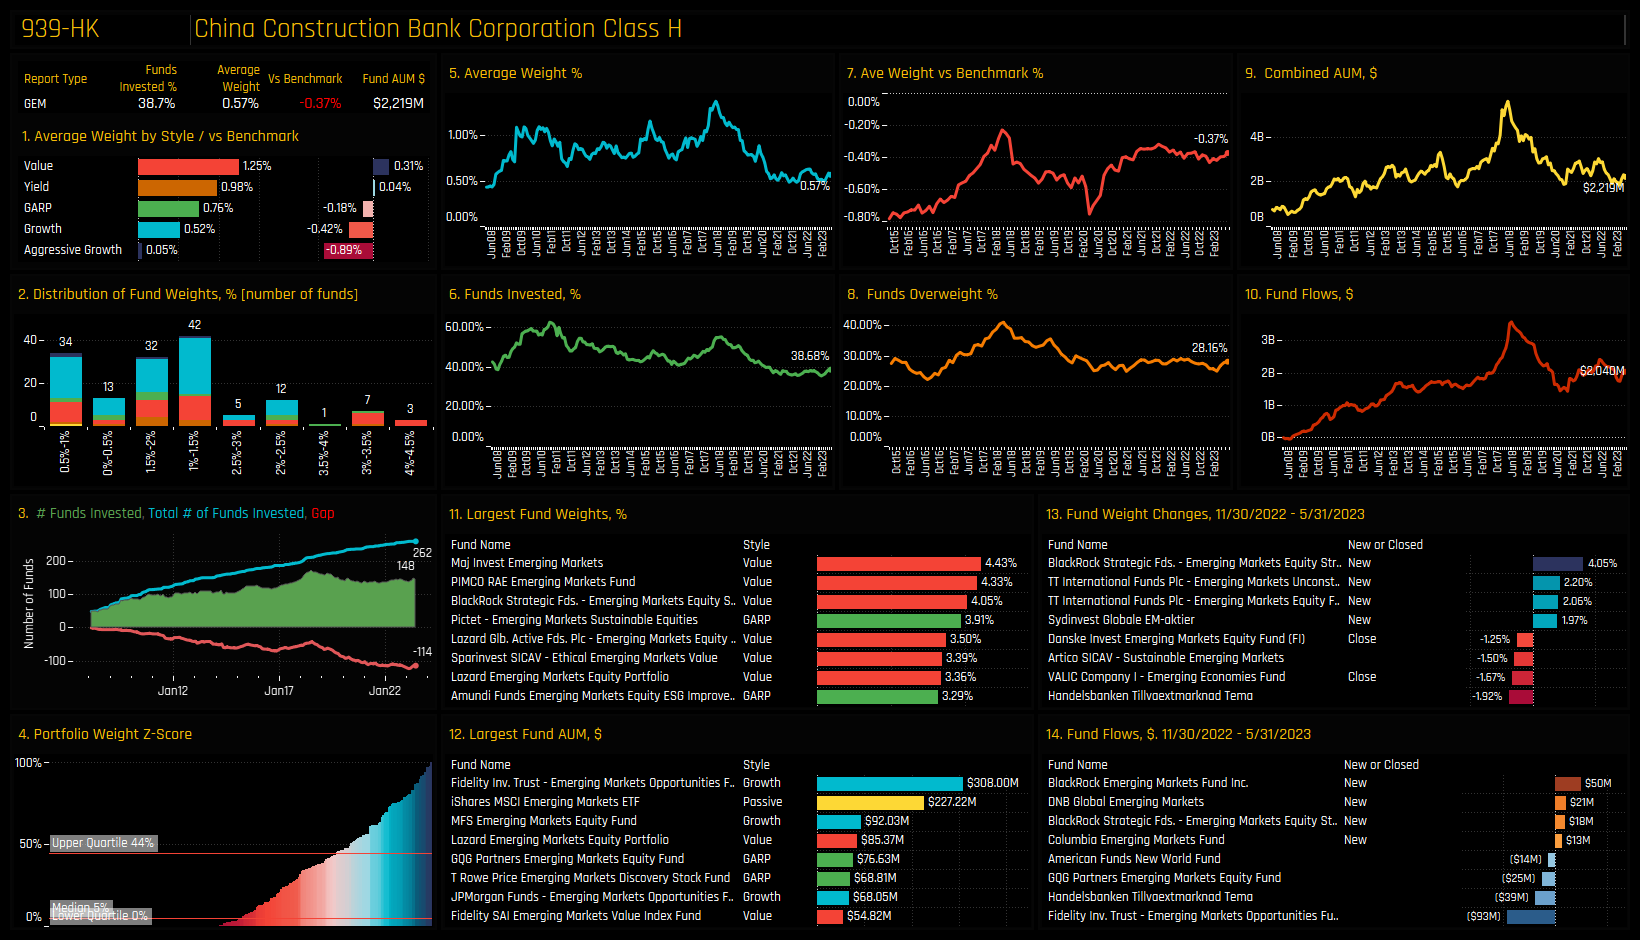
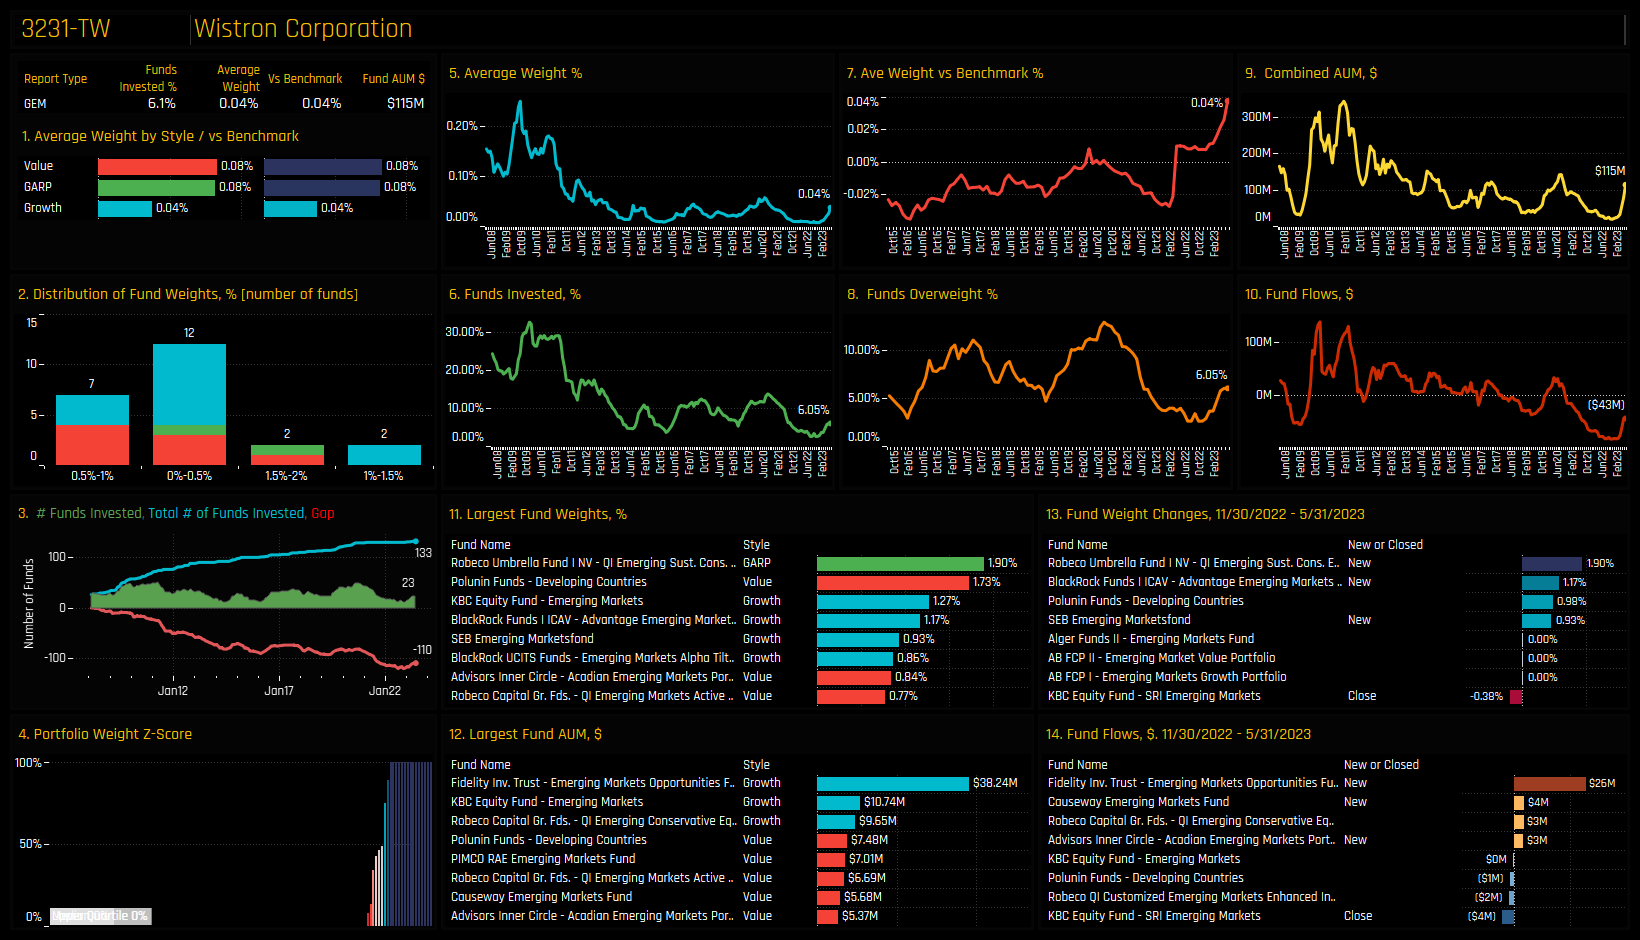
In the bottom right chart, both China Construction Bank and Wistron Corp find themselves at the lower end of their historical ownership ranges. However, both stocks have started to rebound from their lows. Finally, in the top right chart, Accton Technology Corp and Raia Drogasil are currently experiencing peak ownership levels, following consistent increases in fund exposure over the past few months. In the subsequent charts, we offer more comprehensive profiles of each of the 8 stocks located at the extreme corners of our Sentiment Grid.
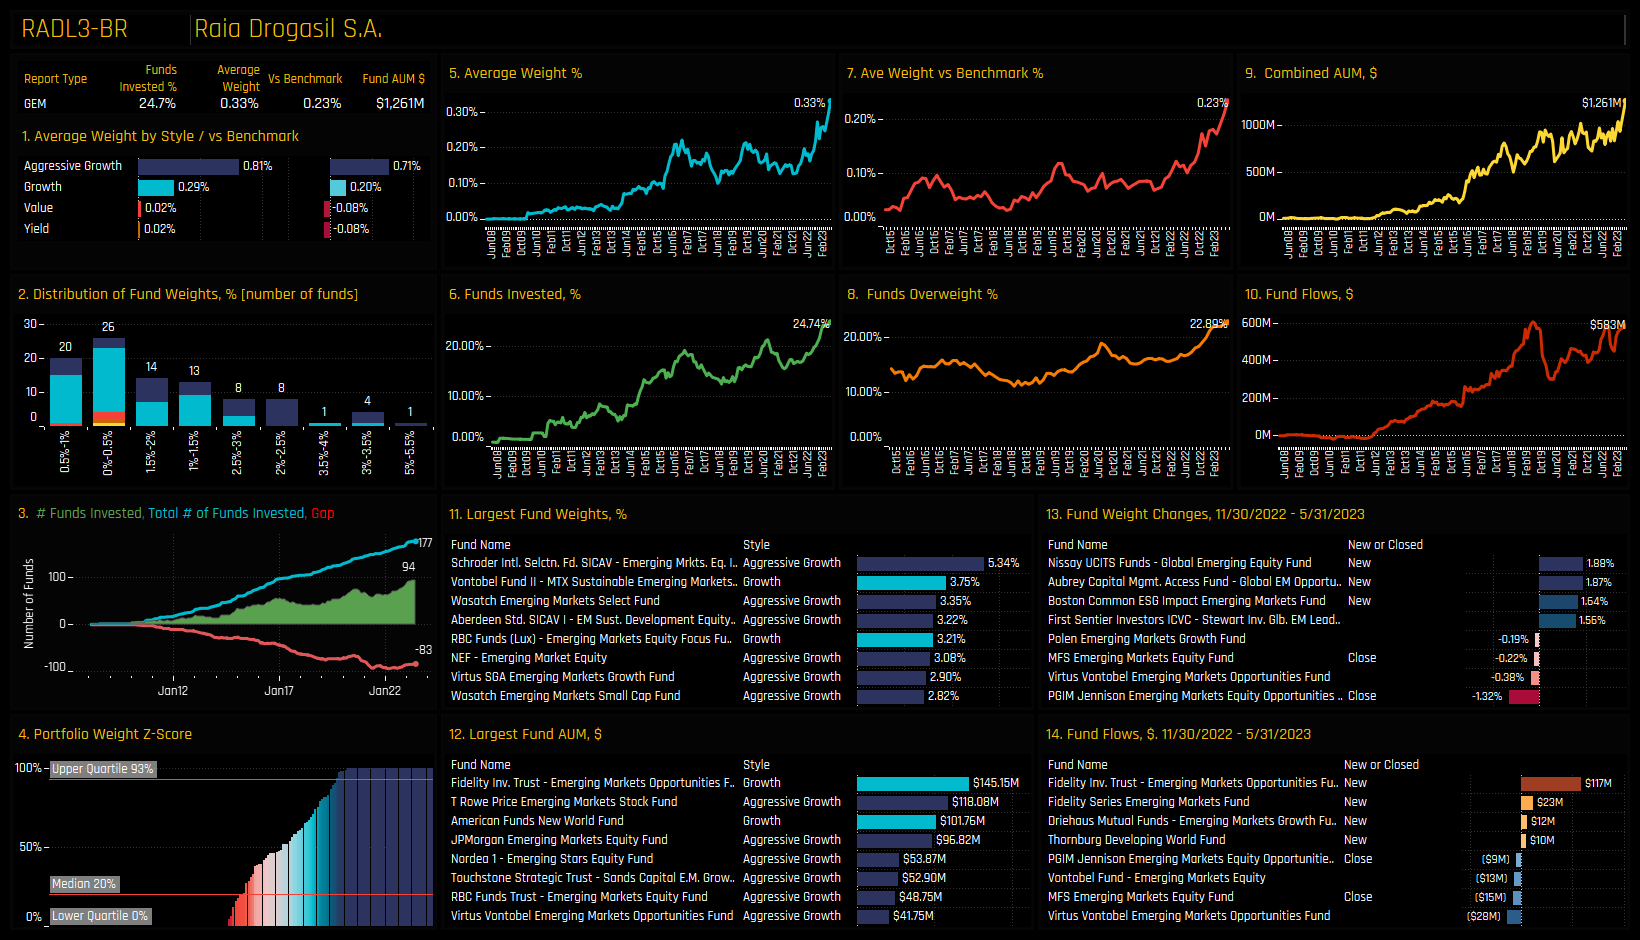
High Positioning & High Momentum: Raia Drogasil S.A
High Positioning & High Momentum: Accton Technology Corp.
High Positioning & Low Momentum: ICICI Bank Limited
High Positioning & Low Momentum: Tata Consultancy Services Limited
Low Positioning & Low Momentum: Sasol Limited
Low Positioning & Low Momentum: CEZ as
Low Positioning & High Momentum: China Construction Bank Corp
Low Positioning & High Momentum: Wistron Corporation
380 emerging market Funds, AUM $392bn
GEM Active Funds Ownership Report
Please click on the link below for the full data report on Global EM active fund positioning
For more analysis, data or information on active investor positioning in your market, please get in touch with me on steven.holden@copleyfundresearch.com
Investor Positioning Report — Copley Fund Research Ltd · Last updated: July 2026 · Registered in England and Wales
1. Who we are
Copley Fund Research Ltd provides proprietary institutional fund intelligence to listed companies and investor relations professionals. These terms govern every purchase of an Investor Positioning Report. By completing a purchase you confirm you have read, understood, and agreed to these terms in full.
2. What you are purchasing
The Investor Positioning Report is a bespoke PDF report mapping the institutional fund universe around your stock. It covers current investors, past investors, competitor investors, and white space investors. Every report is built from scratch for the specific company ordered and is not a standardised or templated product.
3. Delivery and process
Following payment or invoice issuance, Copley Fund Research will contact you within one working day to agree your competitor set. Production begins once the competitor set is confirmed in writing. The completed report will be released to you within 48 hours of production starting, provided payment has been received in full; where payment is outstanding, the report will be withheld until payment clears. If the requested company falls outside our covered fund universes, or a competitor set cannot be agreed, Copley Fund Research will issue a full refund or cancel the outstanding invoice.
4. Competitor set agreement
The competitor set is agreed with you in writing prior to production, and the report is built to that agreed specification. Requests to amend the competitor set after delivery, based on a change of preference rather than an error, may be treated as a new order.
5. Refund policy
Because each report is produced individually for your company, orders are non-refundable once production has begun, except as set out in clauses 3 and 5a below. By purchasing, you agree not to dispute the charge with your card provider on the basis that the service was not as described, provided the report has been delivered to the agreed specification or corrected under clause 5a.
5a. Quality remedy
If a delivered report contains a material error caused by Copley Fund Research — for example, an incorrect company analysed, a competitor omitted from the agreed set, or content missing from the specification in clause 2 — Copley Fund Research will correct and redeliver the report at no additional charge, within a reasonable timeframe. This is your sole remedy for such errors.
6. Data and accuracy
All fund positioning data in the report reflects holdings as disclosed at the most recently available reporting date at the time of compilation. The timing of fund holdings disclosures is determined by regulatory requirements applicable to each fund and is outside the control of Copley Fund Research Ltd. This data may not reflect current fund positions. Copley Fund Research takes reasonable care to ensure accuracy but makes no warranty, express or implied, as to the completeness or current accuracy of the underlying data — though this does not affect the quality remedy in clause 5a for errors in how that data was analysed or presented. Past fund positioning is not indicative of future fund behaviour or investment decisions.
7. Not investment advice
The Investor Positioning Report is produced for investor relations intelligence purposes only. It does not constitute investment advice, financial advice, or a recommendation to buy, hold, or sell any security. The data reflects historical fund positioning and must not be relied upon as a prediction of future fund behaviour or investment decisions. Copley Fund Research Ltd is not authorised or regulated by the Financial Conduct Authority for the provision of investment advice.
8. Permitted use and confidentiality
The report is licensed for internal use by the purchasing organisation only. You may share it with employees and directors of your organisation. You may not: reproduce, redistribute, publish, or resell the report or any part of it; share it with any third party outside your organisation without prior written consent; use the fund or portfolio manager names contained in the report to approach those individuals on behalf of Copley Fund Research or in a manner that could damage Copley Fund Research's relationships with those funds; or use the data for any purpose other than your own investor relations strategy. The data, analysis, and methodology contained in the report are the intellectual property of Copley


