The ASEAN Rotation

275 Active GEM Funds, AUM $370bn.

The ASEAN Rotation

In this piece we provide a comprehensive analysis of active EM fund positioning in the ASEAN region. We find that ASEAN has been a key beneficiary from a drop in EM Europe allocations following the Russian exodus, in addition to a stall in the major EM Asia nations. Indonesia and Thailand have captured the lion’s share of the rotation, whilst investors sell down stakes in non-benchmark Singapore exposure. Above all though, this rotation is coming at a time when allocations are near their lowest levels on record for many countries in the region.

Regional Allocation Trends

Over the last decade, the regional trends in EM fund allocations have been defined by a growing weight in the EM Asia Majors (China & HK, India, Taiwan, South Korea) and a decreasing weight in the other key regions of ASEAN, South America Majors, Sub-Sahara Africa and EM Europe. The charts below show the allocation shift occurring between 2012 and 2020, with weights in the EM Asian Majors increasing from 40% to over 65% (top chart) at the expense of declining weights in the key Sub-Regions (bottom chart). However, recent manager activity suggests the dynamics of regional exposures are beginning to change.

Since the last quarter of 2021 there has been a significant regional rebalance among active EM managers. The demise of Russia has slashed exposure to EM Europe, whilst portfolio weights in the EM Asia Majors have stalled, a mixture of falling China & HK allocations (tech crackdown) offset by increasing Tech weights in Taiwan. The winners have been clear, with rising fund weights in the South American Majors (Brazil/Mexico), ASEAN and MENA Countries, all having captured increases in ownership between 09/30/2021 – 07/31/2022. In this analysis we focus on the ASEAN region.

The ASEAN Region

Honing in the ASEAN region, the time-series charts below document the changing exposure levels since 2008. The story is one of declining fund allocations from a peak of 11.45% in early 2013 to a low of 4.78% in June 2021, but a marked reversal since then. This reversal has been an active move, with EM investors moving from underweight -1.0% to overweight 0.5% over a similar period, driven by a record percentage of funds exposed to the region (99.3%) and a rising number of funds positioned overweight the benchmark.

The Sentiment Grid below shows where current positioning in each EM Sub-Region sits versus history going back to 2008 on a scale of 0-100% (y-axis), against a measure of fund activity for each Sub-Region between 09/31/2021 and 07/31/2022 (x-axis). It highlights a definite stalling of momentum from the well-owned EM Asia Majors towards ASEAN and South America, both of whom sit towards to the middle of their long-term positioning range.

Fund Holdings and Style

The meat of the holdings distribution in the ASEAN region sits between the 3% and 8% range, with a long tail to the upside led by VP Bank Optimised EM ESG (32.16%) and Redwheel Next Gen EM Equity (31.69%). EM Value managers have the highest allocation on average (7.04%), though there isn’t an extreme Style bias towards the region.

Fund level changes since 09/31/2021 have been led by GARP and Growth investors, with average weights increasing by 1.55% and 1.25% respectively – though all Style groups saw ASEAN allocations increase over the period.

Country Allocations

Indonesia is the high conviction allocation in the ASEAN region. It has the largest absolute holding weight of 2.58%, is held by the most managers (86.9%), is the largest overweight (+0.73% above benchmark) with 62.2% of EM managers positioned overweight. Malaysia is the opposite, only held in 41.45% of EM portfolios at an average weight of 0.72%, or underweight the iShares EEM ETF by -0.75%.

The recent reversal in exposure has been driven by Indonesia and Thailand, and to a lesser extent Malaysia. Between 09/30/2021 and 07/31/2022, Indonesia saw average weights increase by +0.82% as a further +6.91% of EM managers gained exposure. Thailand saw underweights reduce by 0.27% as a further +10.55% of managers moved to overweight. The Philippines has been notably absent from the move higher, whilst Singapore allocations fell over the same period.

Sector Allocations

Financials are the key allocation in the ASEAN region, with 87.3% of managers holding some exposure at an average weight of 2.68%, or overweight +0.78% versus the benchmark. Communication Services and Consumer Staples form the 2nd tier, both owned by more than 50% of managers and both overweight the benchmark index on average. Underweights are led by Materials (-0.24%) and Utilities (-0.20%), with the latter on account of its absence from the majority of the EM active funds in our analysis.

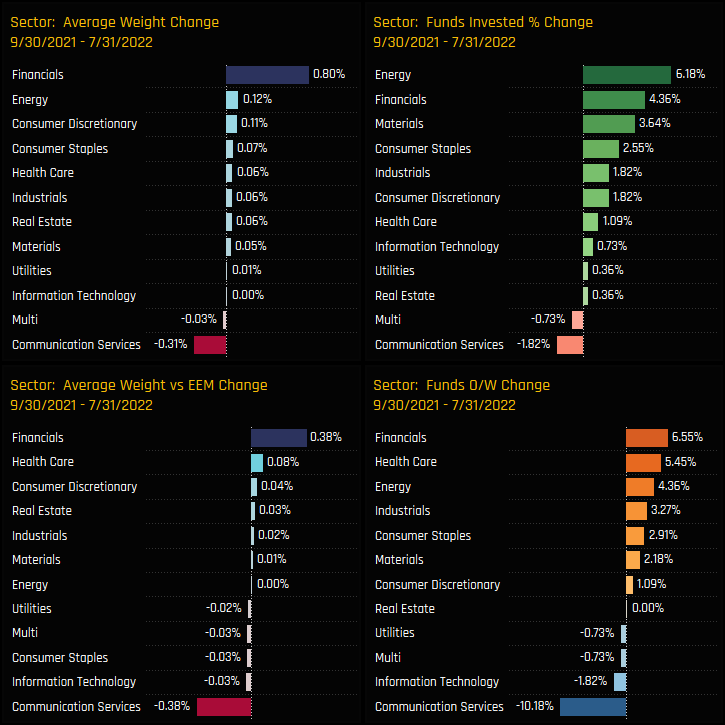
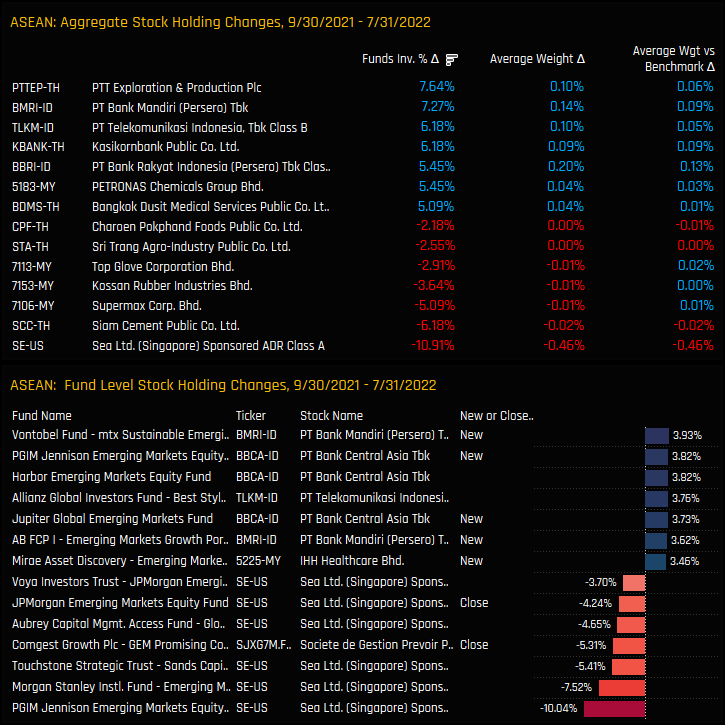
On an average weight basis, Financials have led the charge higher since September of last year, with average weights increasing by +0.8% and 6.55% of funds moving to an overweight stance. Energy and Materials stocks also saw fund participation move higher, with 6.18% and 3.64% of funds opening positions in each sector, respectively. Communication Services saw ownership levels fall over the period, whilst Technology and Utilities haven’t benefited from the ASEAN rotation.


Country Sector Allocations

Indonesia and Thailand Financials are the high conviction country/sector allocations. Both are the most widely held sectors, command the largest average weights, the largest overweights and have the most funds positioned overweight. In contrast, Malaysia Financials are the largest underweight holding, owned by just 25% of managers at an average underweight of -0.32% below benchmark.

Indonesian and Thailand Financials have been the key players in the moves higher, with all measures of active fund ownership moving higher between 09/30/2021 and 07/31/2022. Other beneficiaries include Malaysia Materials, Thailand Health Care, Thailand Energy and Malaysia Financials. Singapore Communication Services allocations fell heavily, with average weights falling by -0.43% as 9.45% of managers closed exposure.


Stock Holdings & Activity

The most widely held stock and the largest overweight in the ASEAN region is PT Bank Central Asia, owned by 44% of managers at an average weight of 0.68%, or +0.27% above the iShares EEM ETF weight. PT Bank Rakyat and PT Telekomunikasi are well owned and sit above a 3rd tier of Kasikornbank Public, PT Bank Mandiri and out-of-benchmark Sea Ltd. Underweights are led by Public Bank Bhd, Siam Cement and SM Prime Holdings.

Stock level changes between the period 09/30/2021 and 07/31/2022 are led by PTT Exploration & Production and PT Bank Mandiri, with the percentage of funds invested in each rising by +7.64% and 7.27% respectively. Sea Ltd has been a large drag on the overall ASEAN allocation, with average weights falling by -0.46% and -10.9% of managers closing exposure entirely. On an individual fund level, PT Bank Mandiri and PT Bank Central Asia occupy the larger opening positions, whilst Sea Ltd dominates the larger closures over the period.


Stock Profiles

Key Stock Holding: PT Bank Central Asia

Key Stock Holding: PT Bank Rakyat Indonesia

Key Stock Holding: PT Telekomunikasi Indonesia

Ownership Increasing: PTT Exploration & Production

Ownership Decreasing: Sea Ltd

For more analysis, data or information on active investor positioning, please get in touch with me on steven.holden@copleyfundresearch.com