In this issue:
Active GEM Fund Holdings Guide
Tobacco: Back En-Vogue?
GEM Funds Stock Radar
270 emerging market Funds, AUM $340bn
Active GEM Fund Holdings Guide
A new report that breaks down individual holding weights, AUM and activity across regions, countries and sectors.
Sub-Region Positioning
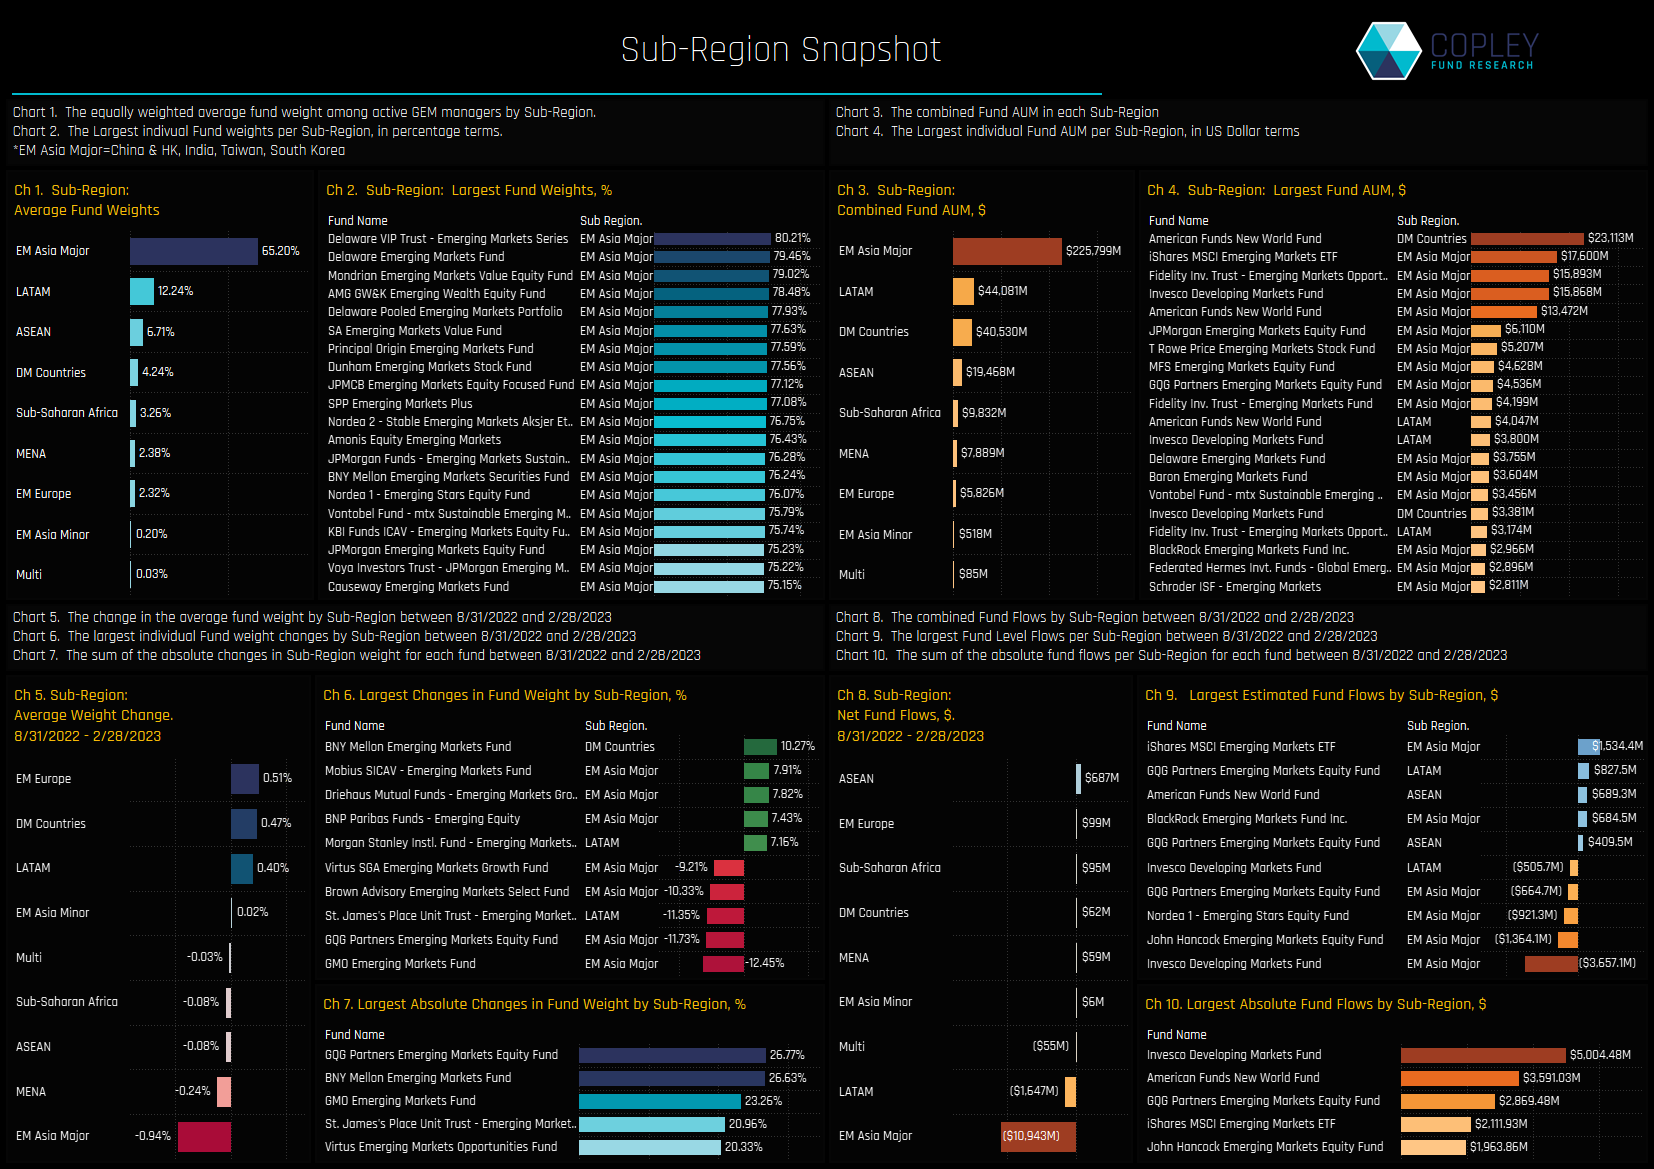
The chart set below looks at the latest snap of regional positioning among active EM managers, and the changes between 08/31/2022 – 02/28/2023. EM Asia Major (China, India, South Korea, Taiwan) is the dominant sub-region among the GEM funds in our analysis with an average weight of 65.2% (ch1), followed by LATAM (12.24%) and ASEAN (6.71%). EM Asia Major accounts for all of the larger fund level positions, led by sizeable weights from Delaware, Mondrian and AMG (ch2). Over the last 6-months, holding weights have risen in EM Europe, LATAM and Developed countries at the expense of EM Asia Major (ch5), with funds led by GMO and GQG cutting weights by over 10% (ch6). In fact, GQG were the most active fund over the period, with a cumulative 26.8% change in absolute Sub-Regional allocations.
On an AUM basis, of the $340bn in combined assets, $226bn is allocated towards China, India, South Korea and Taiwan (ch3). American Funds New World holds the largest combined AUM in DM countries of $23bn, though again EM Asia Major dominates the list in chart 4. On a fund flows basis, the GEM funds in our analysis suffered an estimated $13.5bn in fund outflows over the period 08/31/2022 – 02/28/2023, with $10.9bn of those related to the EM Asia Major countries (ch8). On a fund flow basis, GQG’s rotation out of EM Asia Major and in to LATAM was a key move, as was Invesco Developing Markets $3.6bn outflows from the Major EM Asian countries.
Fund Focus: GQG Emerging Markets
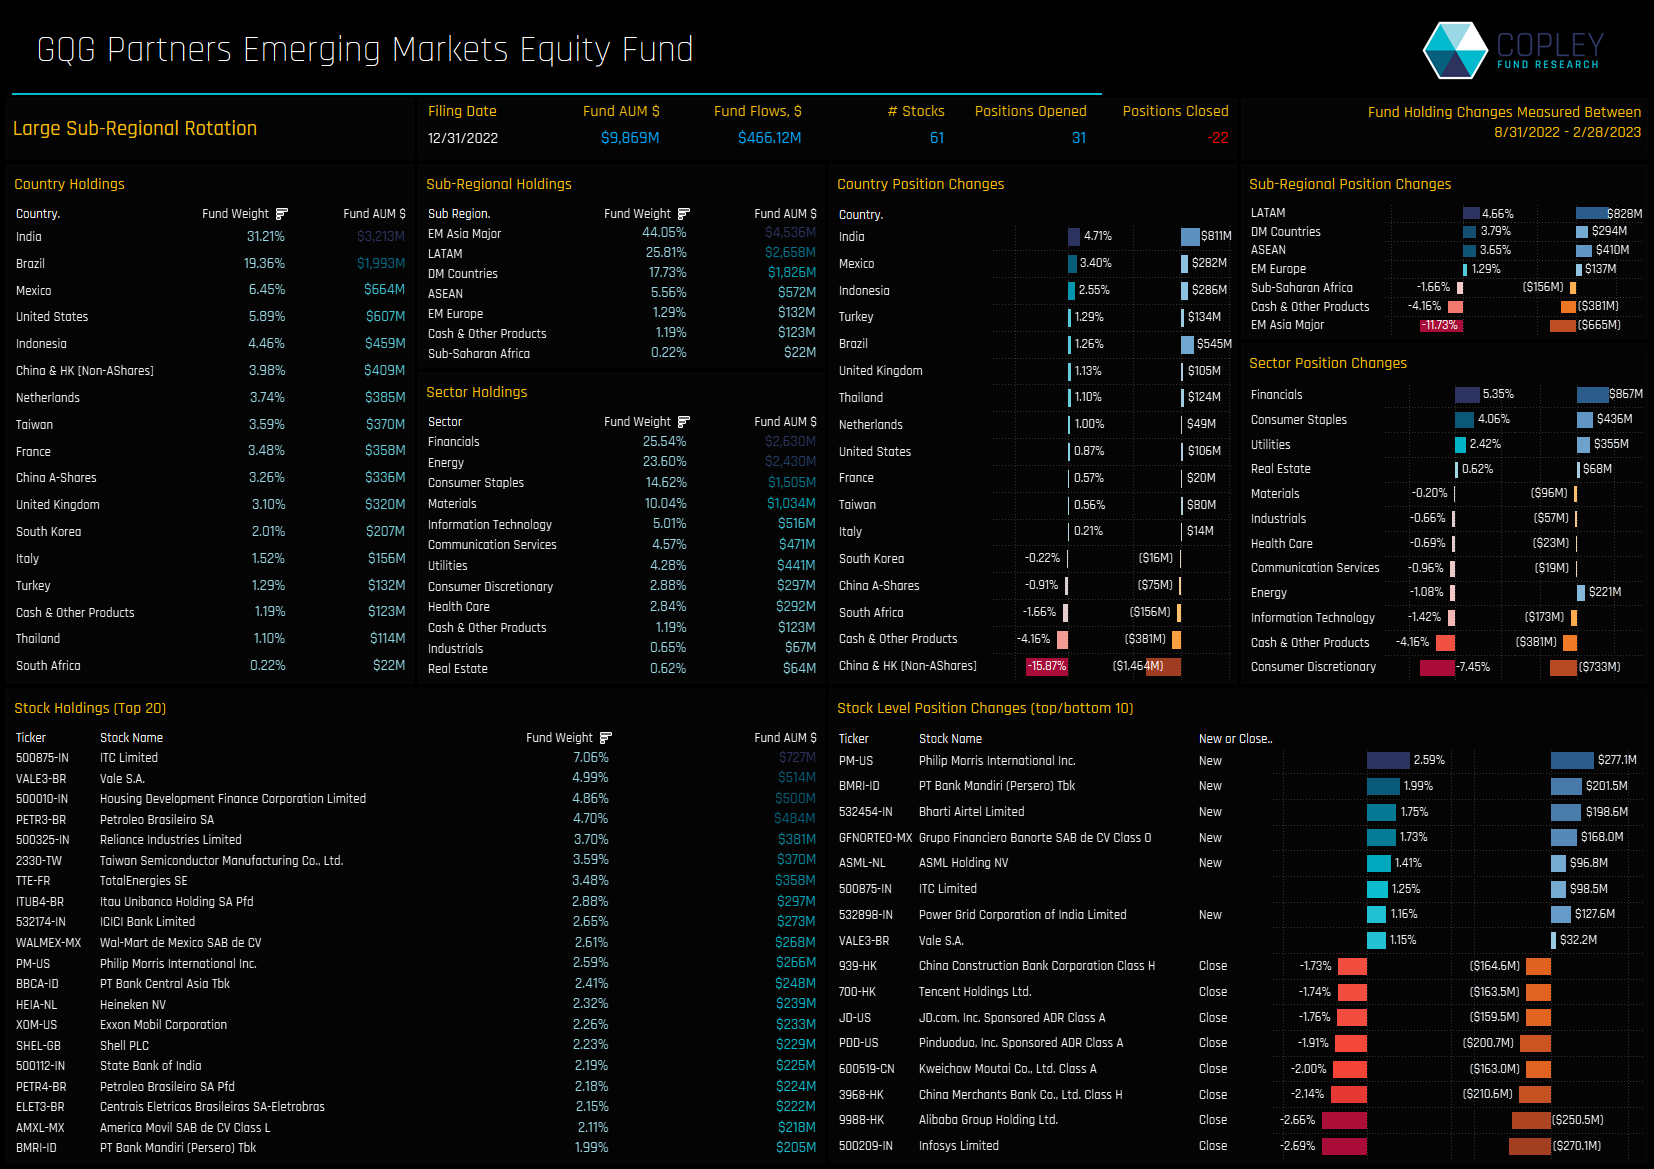
GQG’s recent rotation has changed the focus of the fund away from China and into Latin America. LATAM now accounts for 25.8% of the fund after a +4.66% weight increase over the last 6-months, whilst exposure to China was cut by more than 16%. On a sector level, Financials and Energy make up nearly a half of total allocations, with recent activity scaling back Consumer Discretionary to boost Financials and Consumer Staples weights.
The fund has always had a bias towards India, and that conviction has been given more prominence in recent months. Large holdings in ITC, Housing Development Finance and Reliance Industries has pushed India to a 31.2% weight, near the highest in the Fund’s history. New positions were headed by Philip Morris and PT Bank Mandiri, whilst closures were led by Infosys Ltd and Alibaba Group Holdings.
Country Positioning
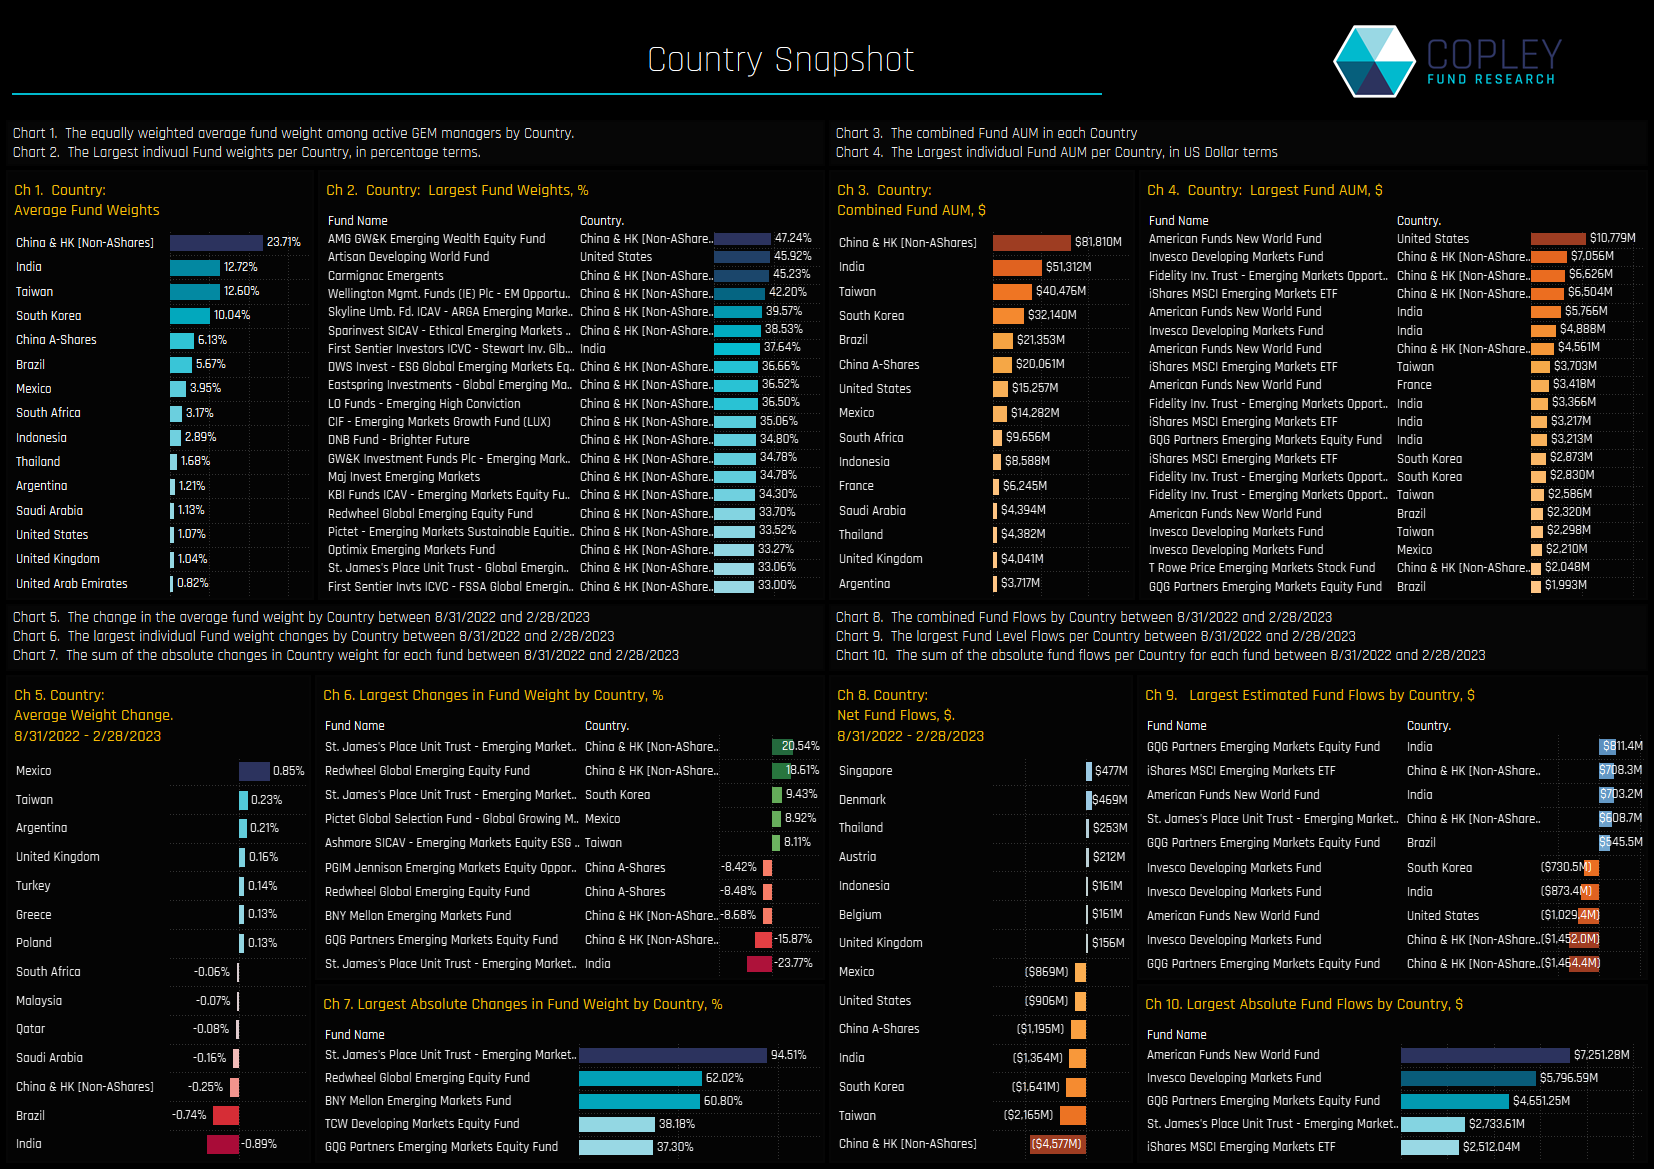
China & HK (Non-Ashares) is the dominant allocation, with a 23.7% weight nearly double that of India (12.7%) and Taiwan (12.6%). It also accounts for 18 of the top 20 country level fund allocations, with Artisan Developing World (USA) and First Sentier Global EM Sustain (India) the only non-China large positions (ch2).
St James’s Place Emerging Markets Unit Trust was the most active fund on a country level (ch7), with a significant rotation out of India and in to China & HK (ch6). On a fund flow basis, the trio of Invesco Developing Markets, American New World and GQG Emerging Markets managed a combined $17.7bn in total country level flows over the last 6-months.
Fund Focus: St James's Place Emerging Markets Equity
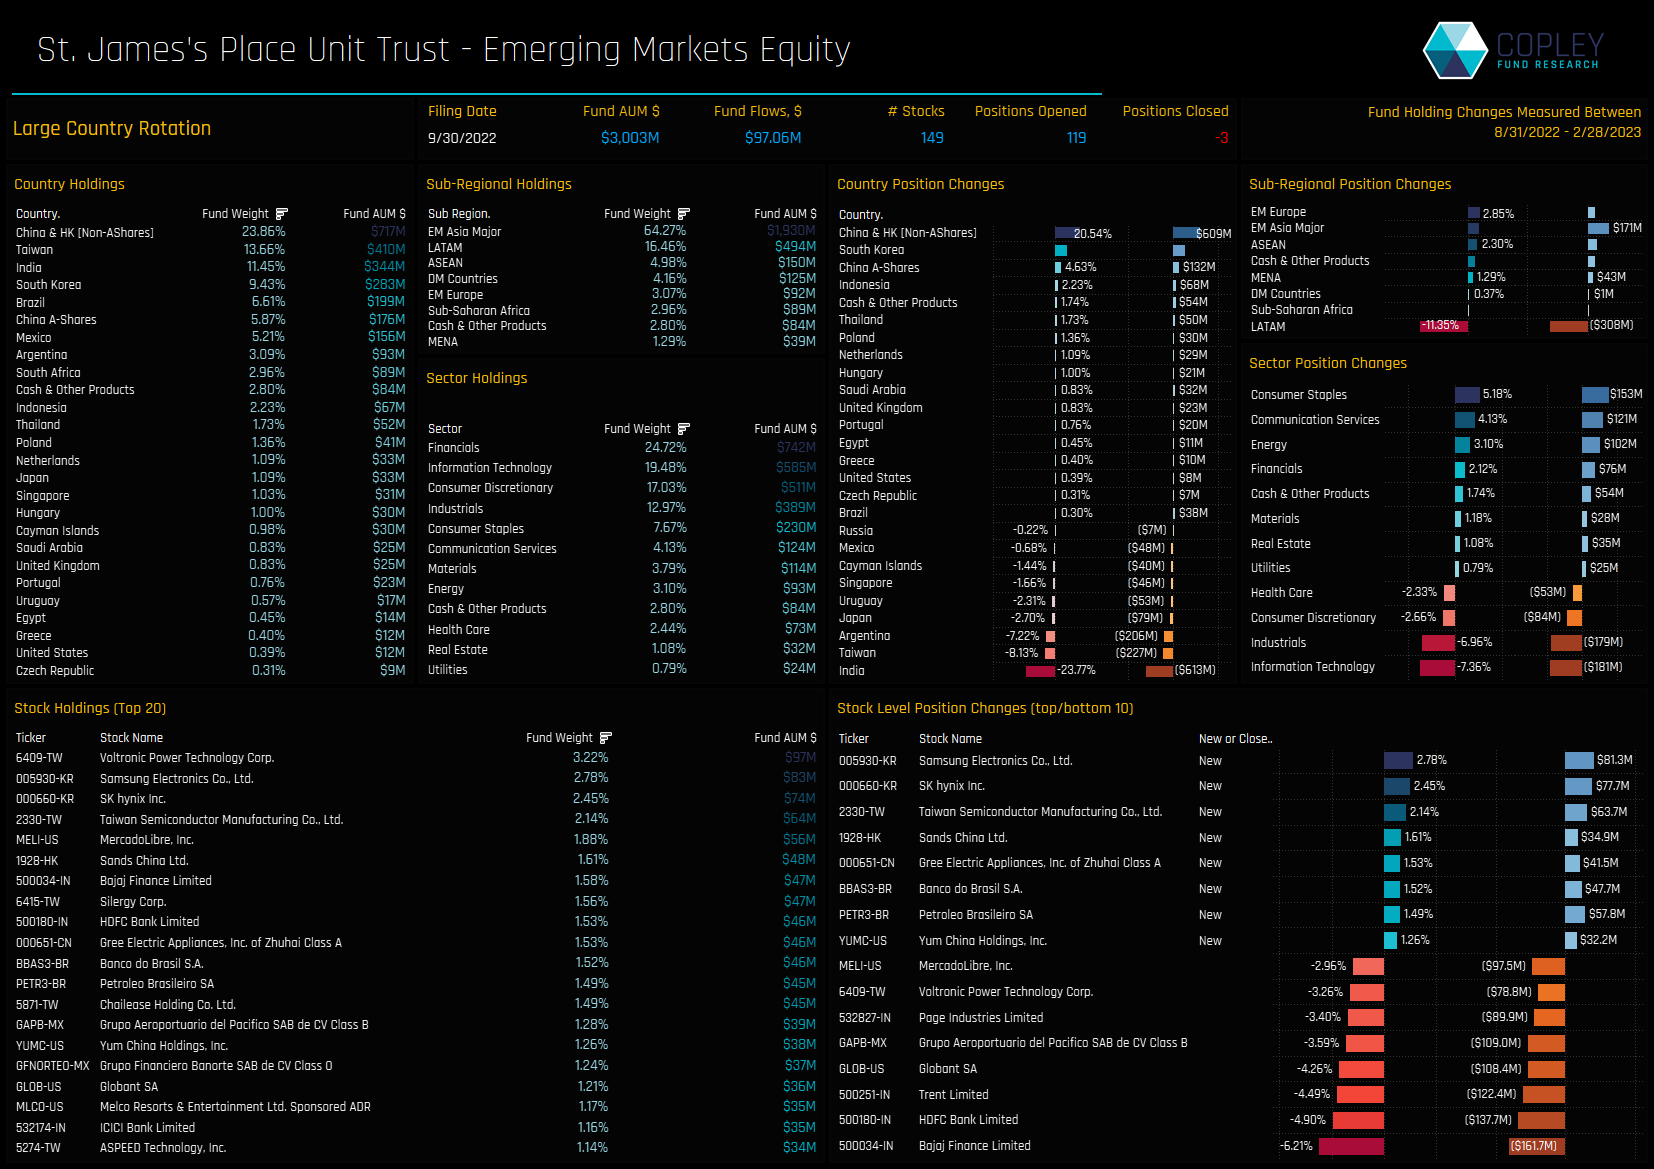
Between the filing periods of 08/31/2022 and 02/28/2023, the St James’s Emerging Markets Equity Fund carried out a significant country level rotation. Big increases in China & HK, South Korea and Indonesia were offset by decreases in India, Taiwan and Argentina. On a sector level, the fund scaled back on Technology, with Financials moving to the top sector allocation.
The fund also changed tack with respect to it’s number of holdings, reducing large positions in HDFC Bank, Bajaj Finance and Trent Limited to open 119 positions in smaller size, led by Samsung Electronics (2.78%) and SK Hynix (2.45%). The Fund’s largest stock position is its 3.2% holding in Voltronic Power Technology Corp.
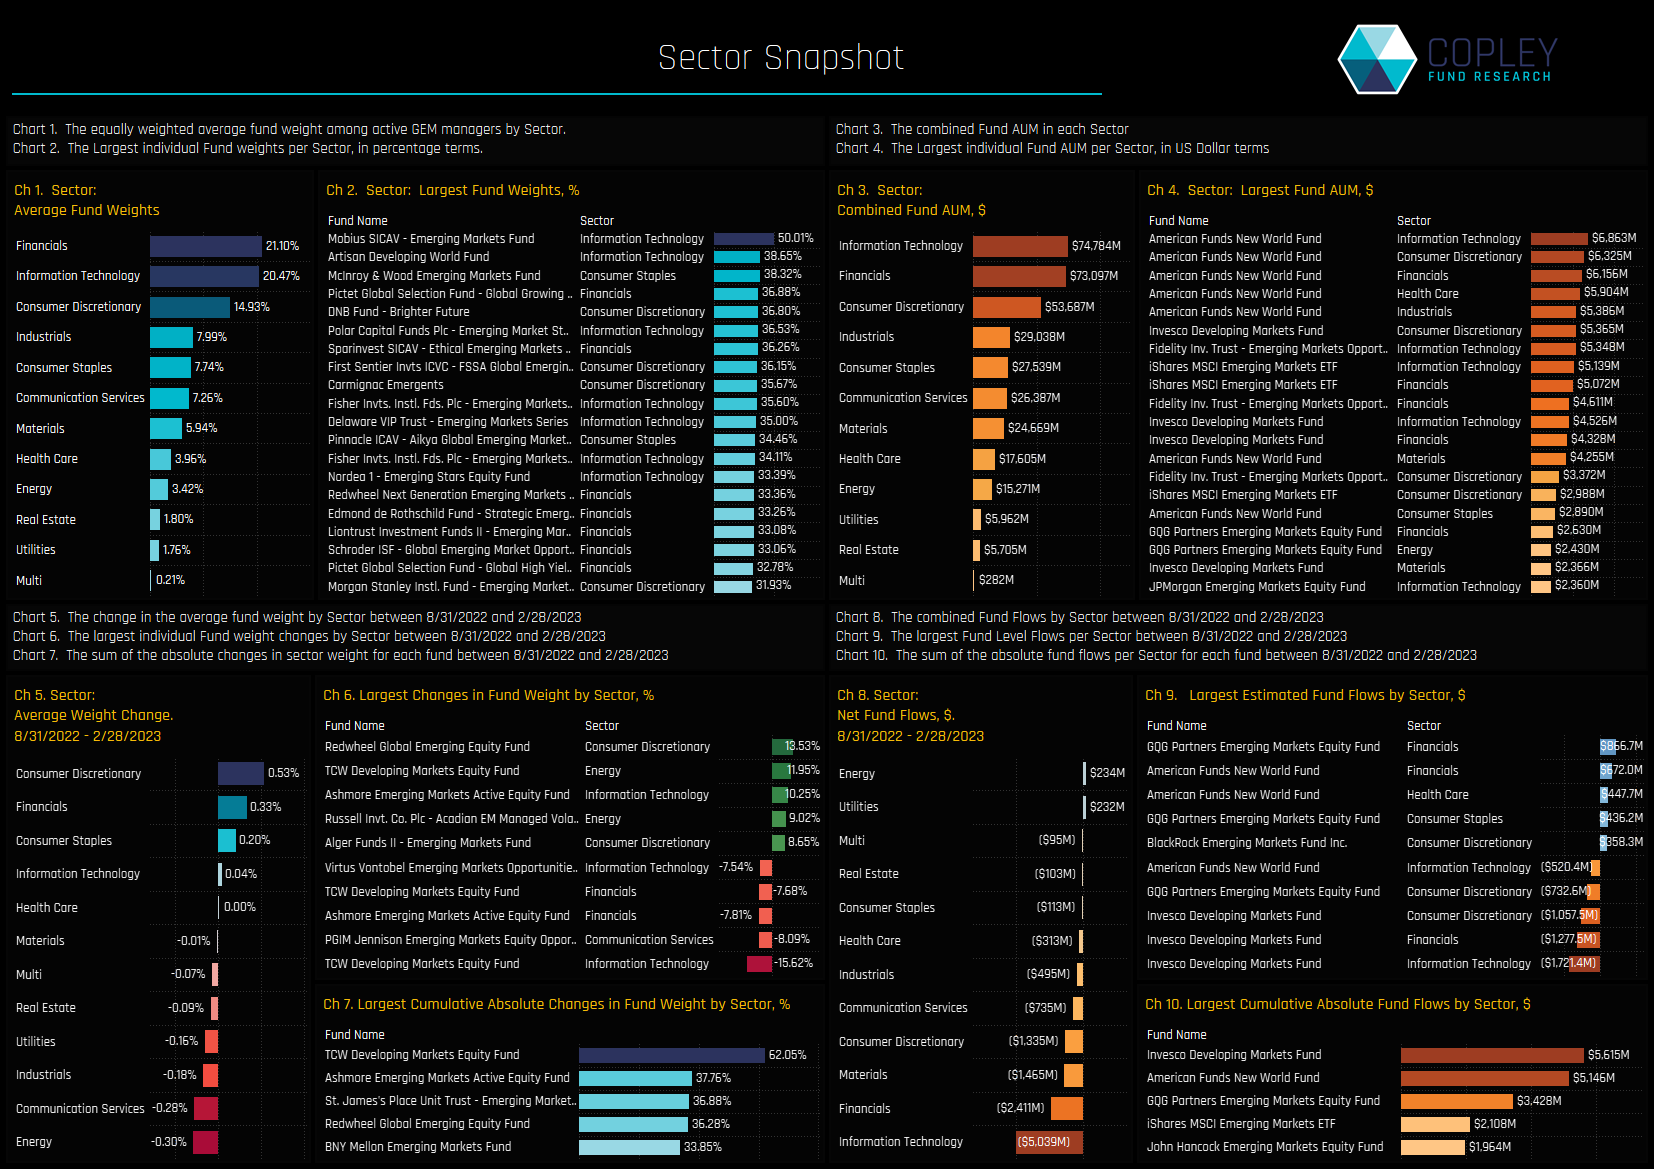
Sector Positioning
Financials and Information Technology are the dominant sector holdings, accounting for a combined 41.6% of the average EM active portfolio. The larger fund level sector positions are in Tech and led by Mobius Emerging Markets (50%) and Artisan Developing World (38.65%), though big Financials and Consumer positions are also notable.
Average holding weights increased the most in the Consumer Discretionary sector, aided by large increases from Redwheel Global EM (+13.5%) and Alger Emerging Markets (+8.65%). The most active fund on a sector level was TCW Developing Markets, with total absolute sector changes of 62% over the last 6-months.
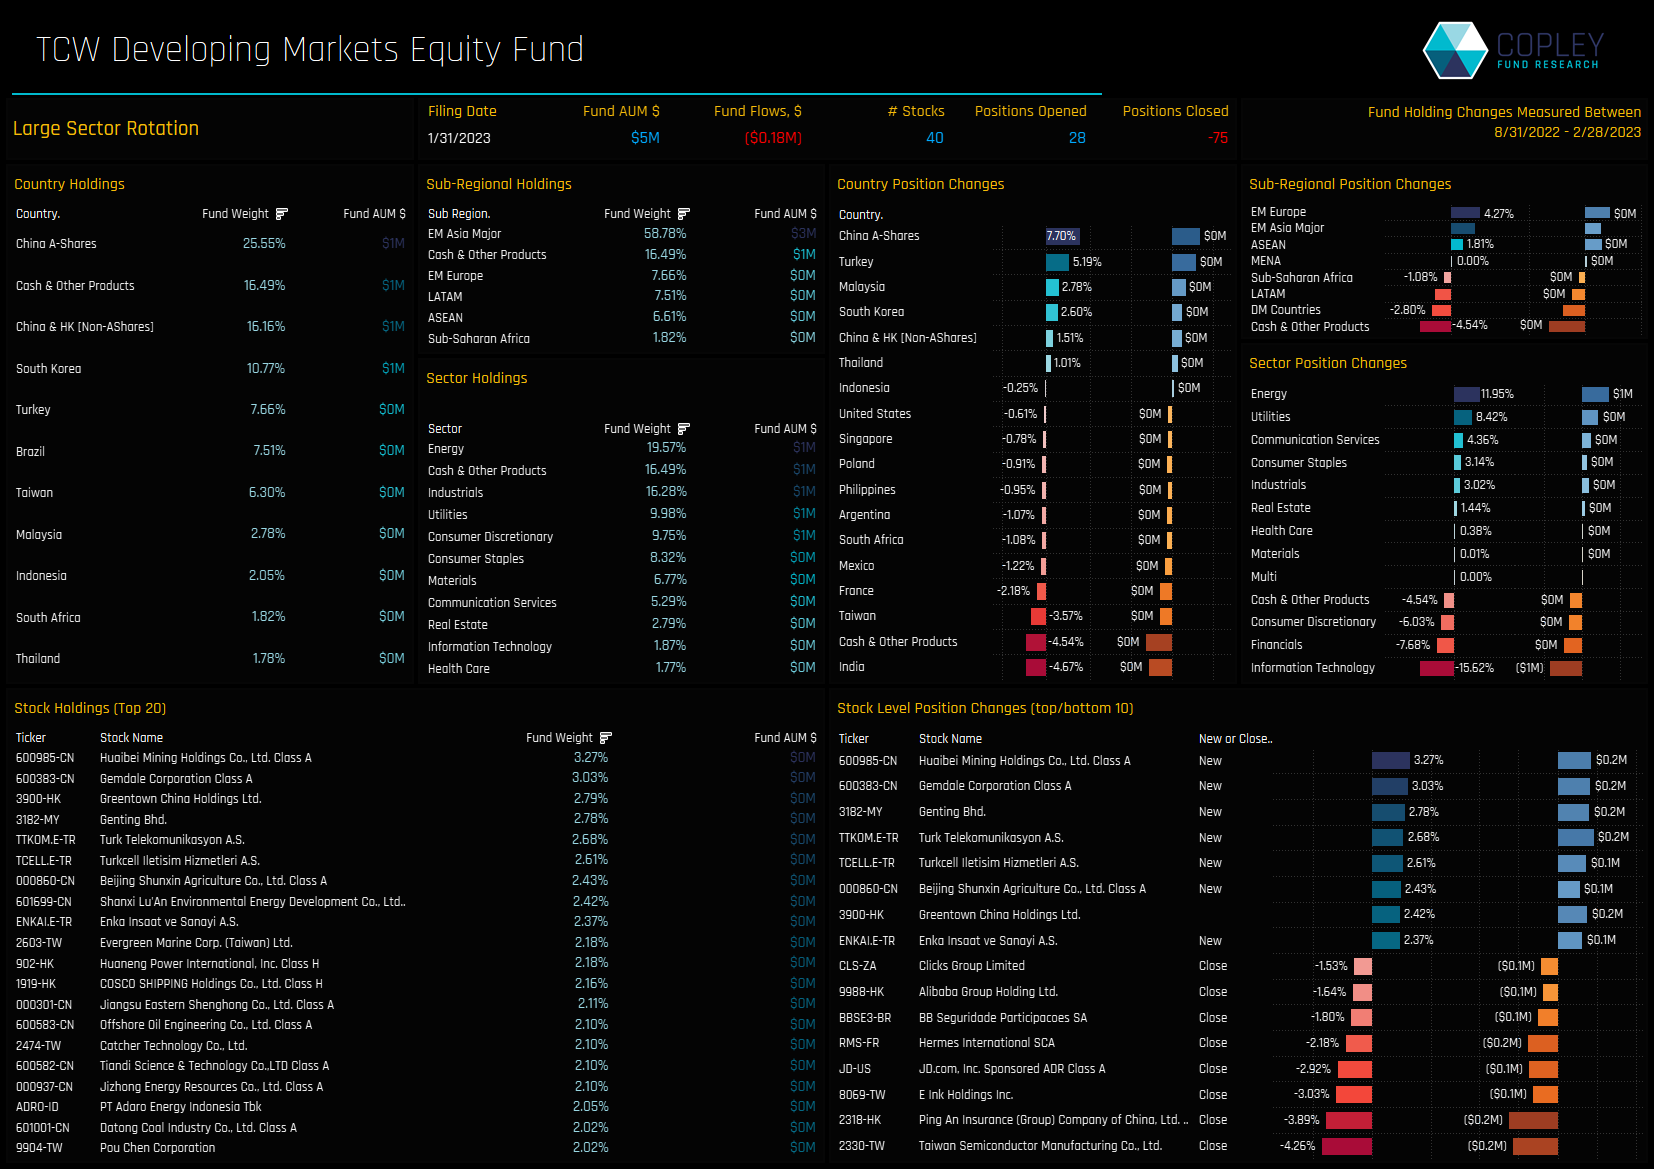
Fund Focus: TCW Developing Markets Equity Fund
A small fund in AUM terms, TCW have been aggressive in their sector rotation over the last 6-months. Buying in Energy (+11.9%) and Utilities (8.4%) was offset by selling in Tech (-15.6%) and Financials (-7.7%), leaving Energy as the largest exposure on 19.6%.
The fund increased their A-Share weight by 7.7%, opening new positions in Huaibei Mining (3.27%) and Gemdale Corporation (3.03%), with both going in as the largest holdings in the fund.
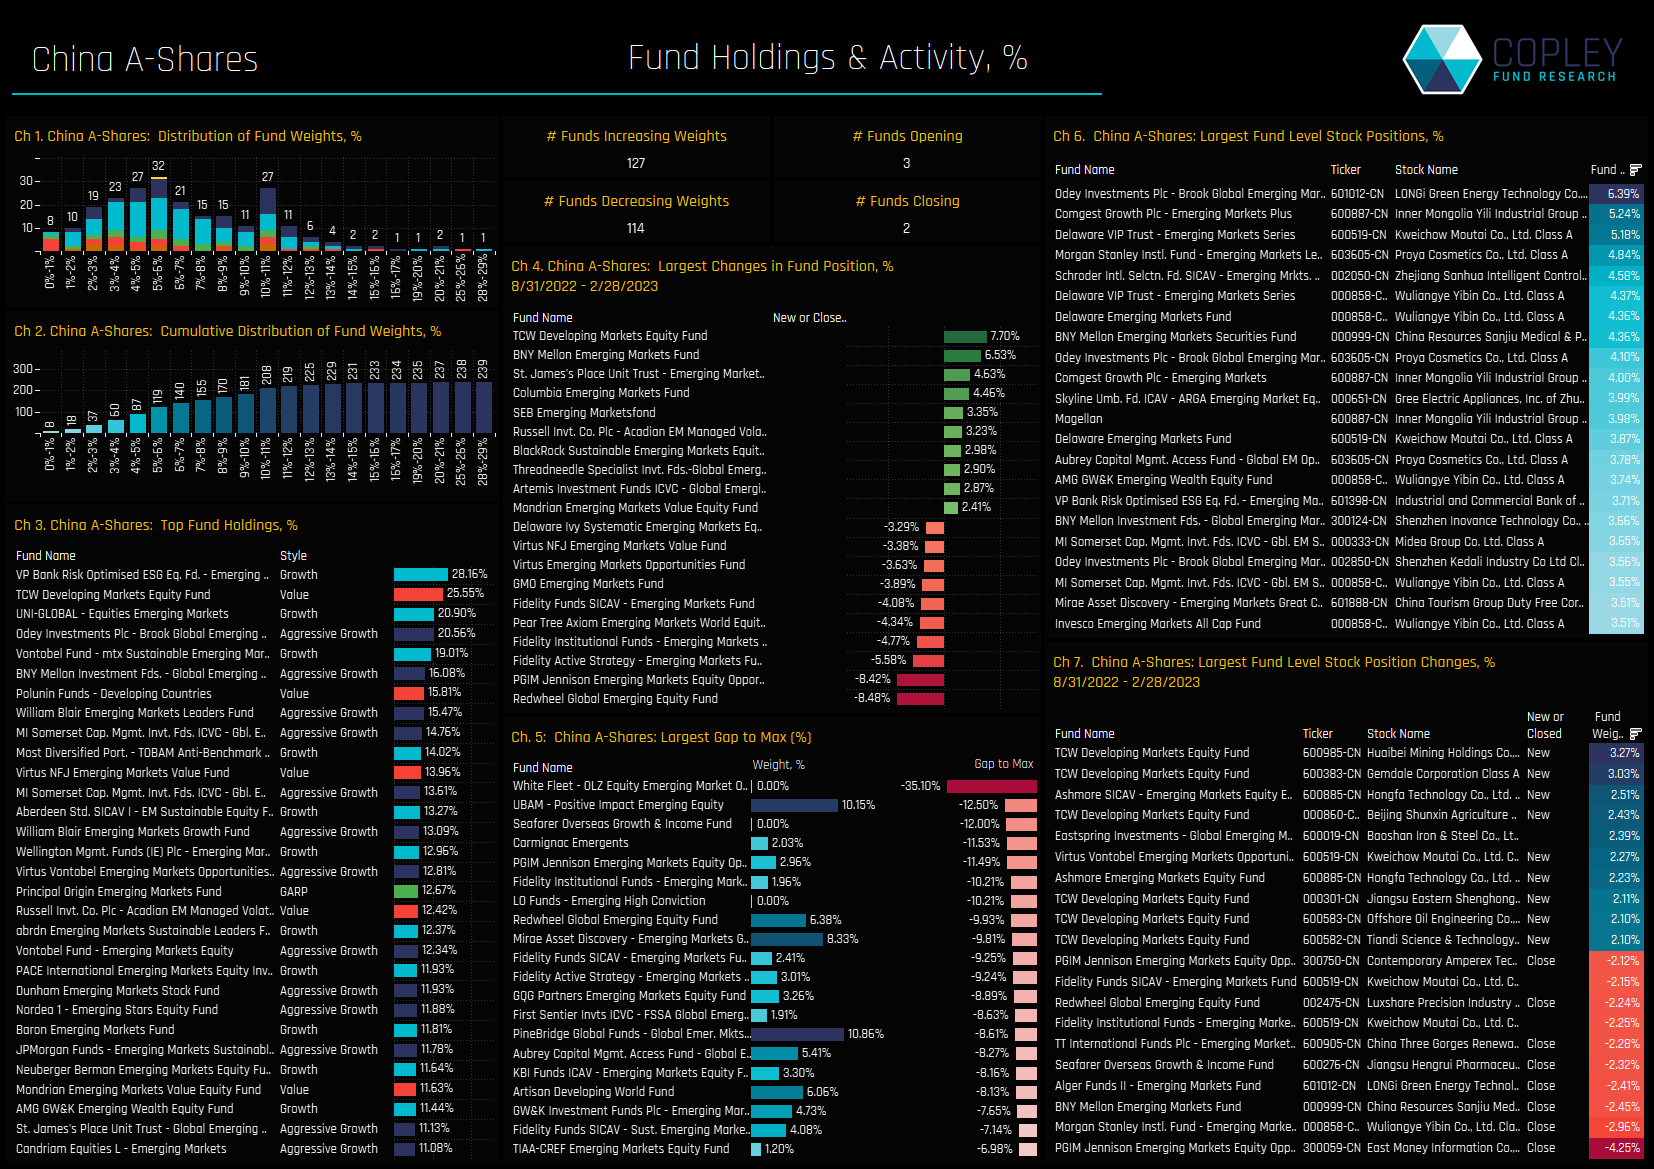
Country Focus: China A-Shares
TCW’s recent China A-Share allocation shift moves them to the 2nd largest holder among the 270 funds in our analysis. The peak of the holdings distribution in A-Shares sits at between 4% and 6% (ch1), but there are 58 funds who hold more than 10%, led by VP EM ESG, TCW Developing Markets and UNI-Global EM Equity (ch3).
Activity over the last 6-months has been fairly well balanced, with a similar number of funds increasing or decreasing A-Share weights. Of the larger high conviction positions (ch6), Inner Mongolia Yili, Kweichow Moutai and Wuliangye Yibin feature heavily.
Report Link
Please click on the link opposite to download the full report, which includes profiles for all regions, sub-regions, countries, sector classifications and sectors, in addition to profiles of selected funds based on AUM and activity.
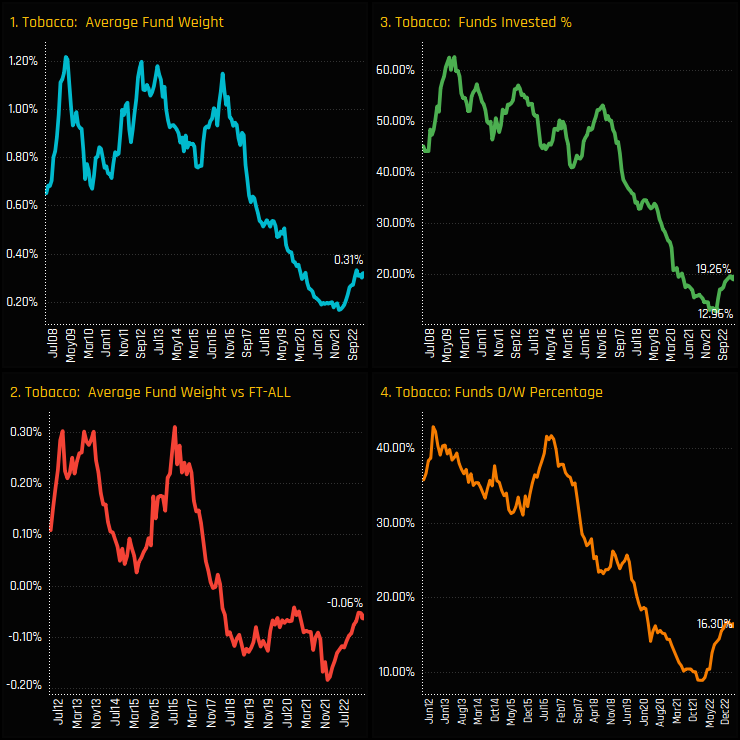
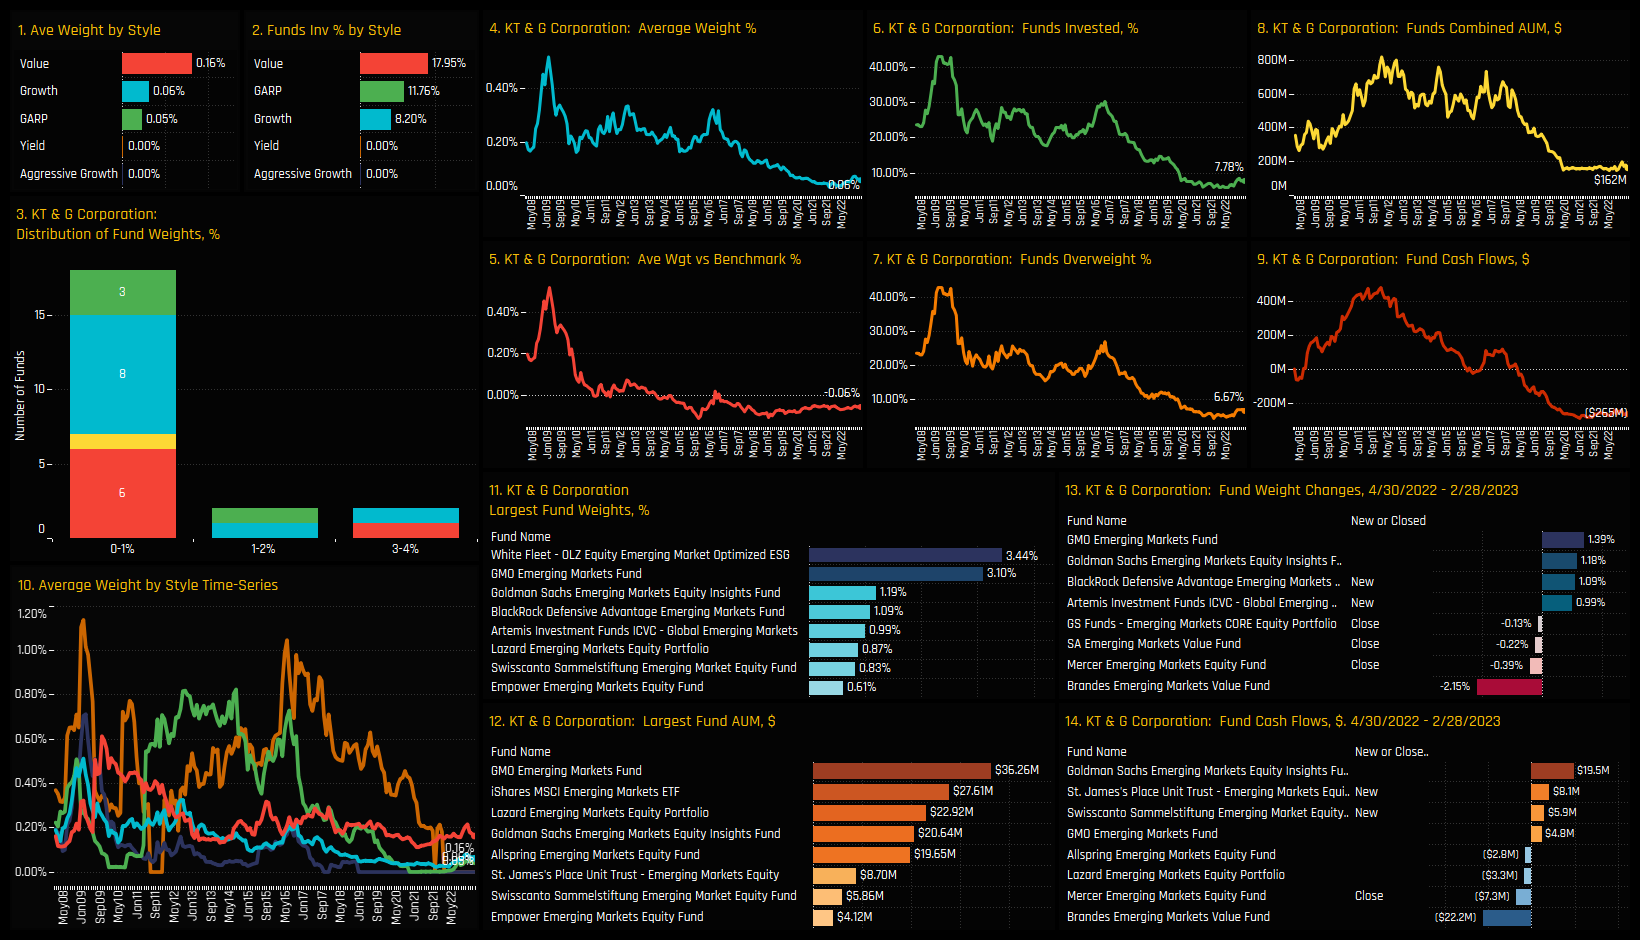
After a multi-year decline in investment, EM Tobacco stocks are turning a corner.
Time-Series & Industry Activity
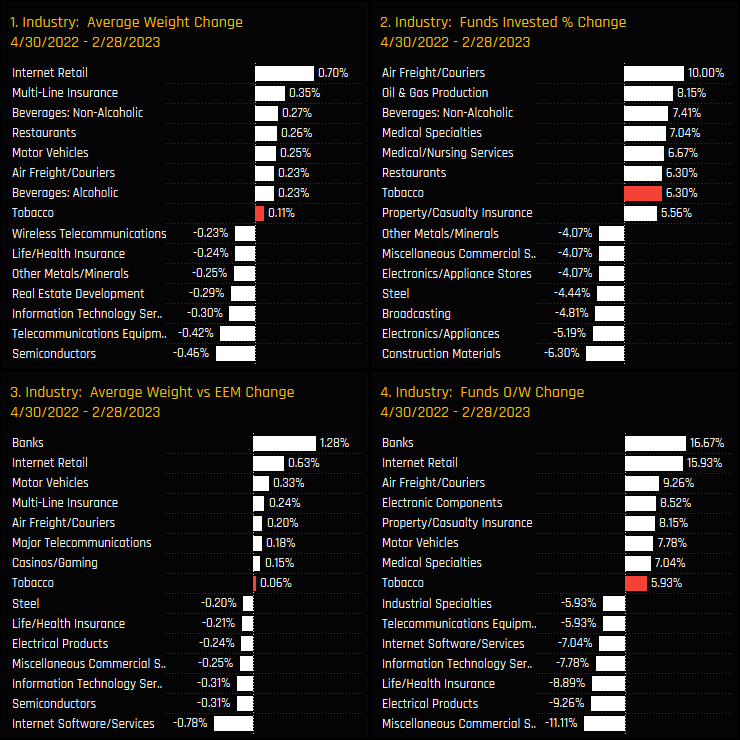
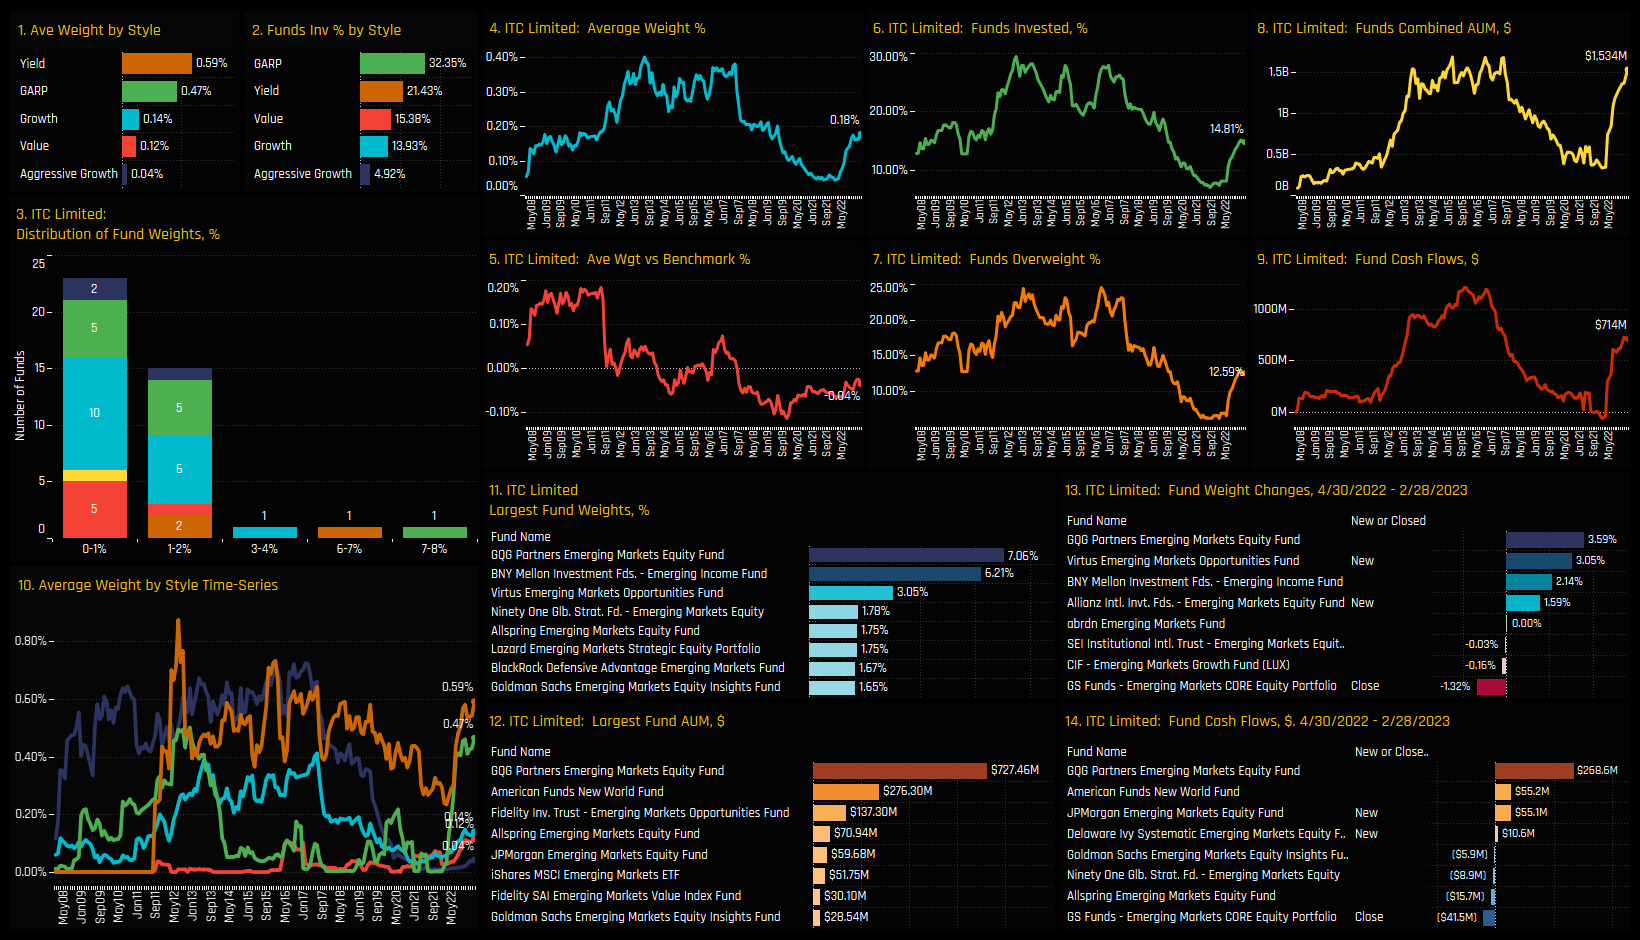
EM fund exposure in the Tobacco industry group is on the rise. After a multi-year drop in ownership, EM allocations bottomed out with just 13% of funds invested in April of last year (ch3). Since then, a growing number of active EM strategies are buying back in, with average weights moving to 0.31% (ch1) and 19.26% of funds invested. These aggregate levels still represent a marginal underweight versus the iShares MSCI EM ETF (ch2), with the vast majority of investors positioned below the index.
Since the April 2022 trough, Tobacco has faired well versus industry peers. It captured the 7th largest increase in the percentage of funds invested after restaurants (see GEM Fund Positioning Analysis, Feb 2023) and Air Freight Couriers, among others. Average weight increases were small in comparison though, perhaps reflective of the tentative nature of the rotation.
Industry Sentiment
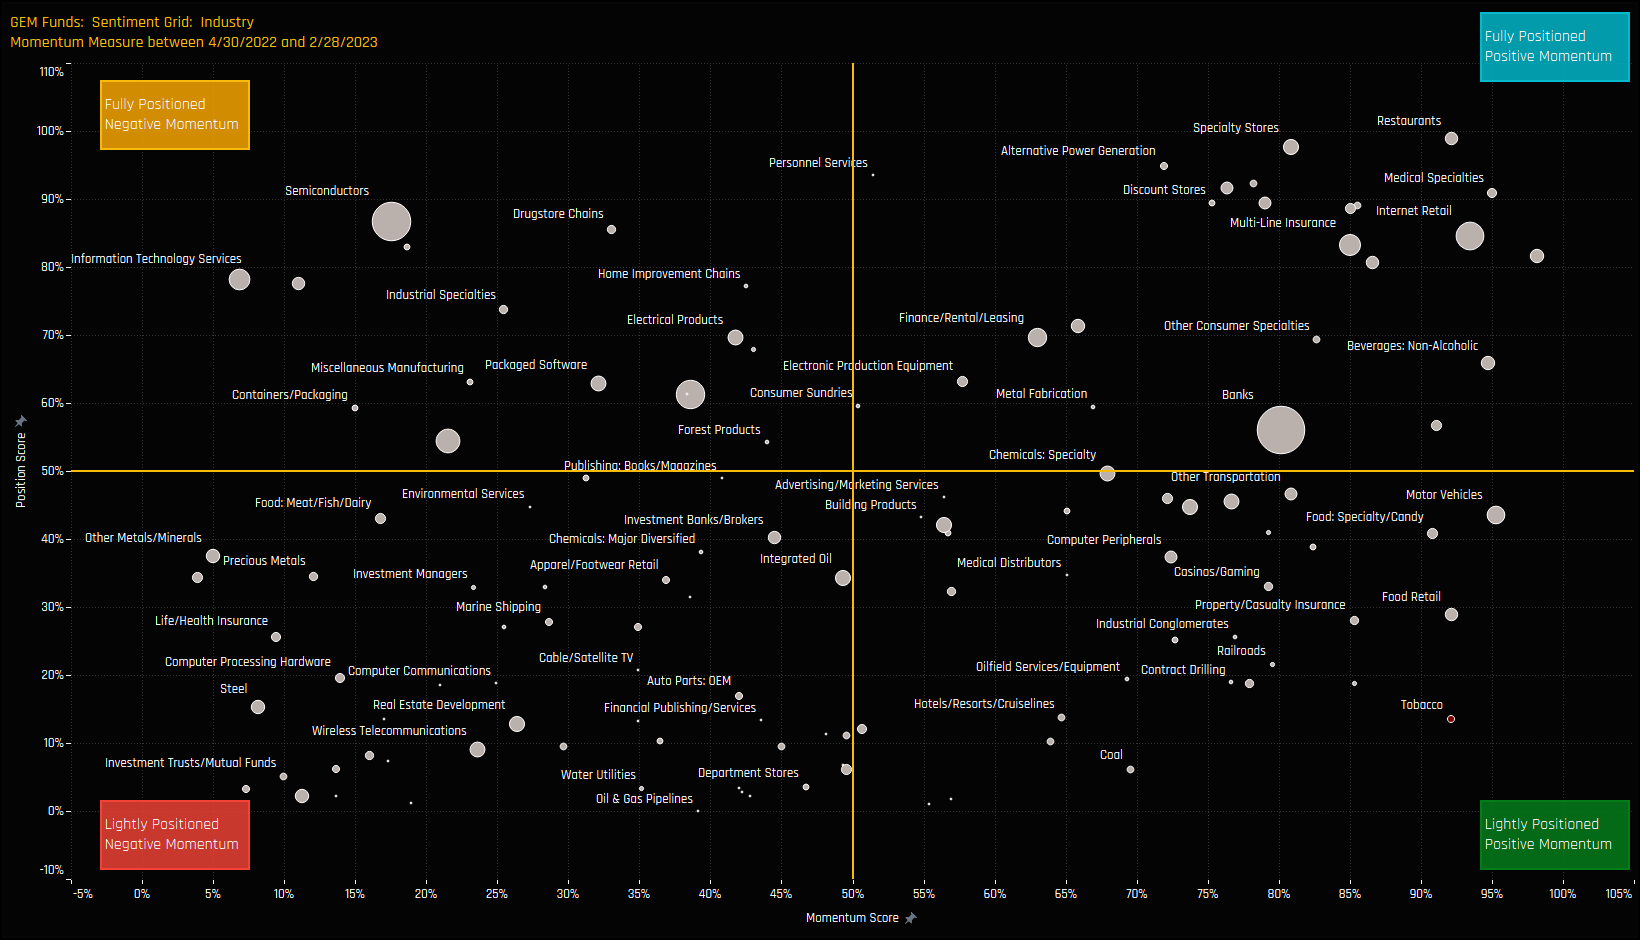
The sentiment grid below shows where current positioning in each EM Industry group sits versus its own history going back to 2008 on a scale of 0-100% (y-axis), against a measure of fund activity for each Industry between 08/31/2022 and 02/28/2023 (x-axis).
The position of Tobacco in the bottom right hand quadrant perfectly encapsulates the current ownership picture. No other industry group is so underowned compared to its own history whilst also capturing positive rotation among managers.
Fund Holdings & Activity
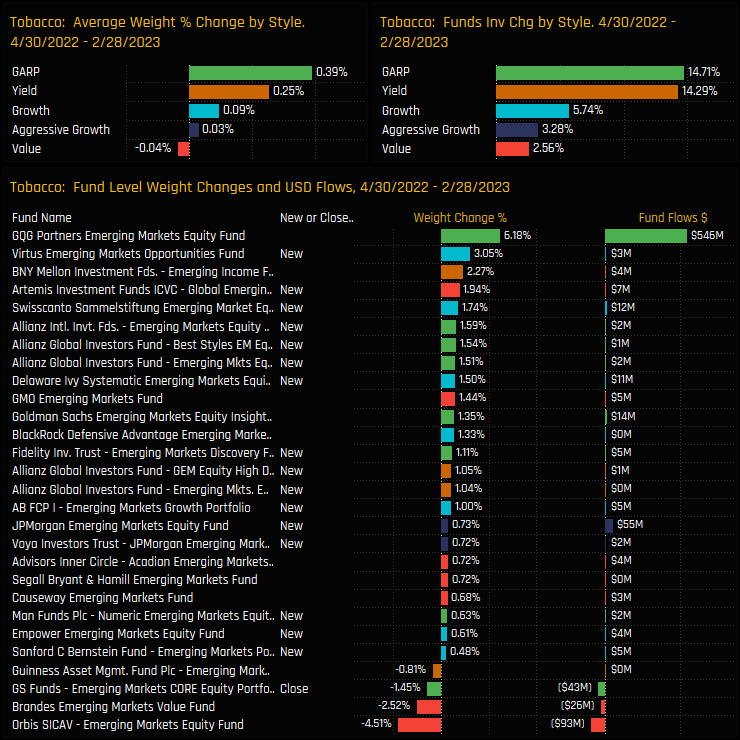
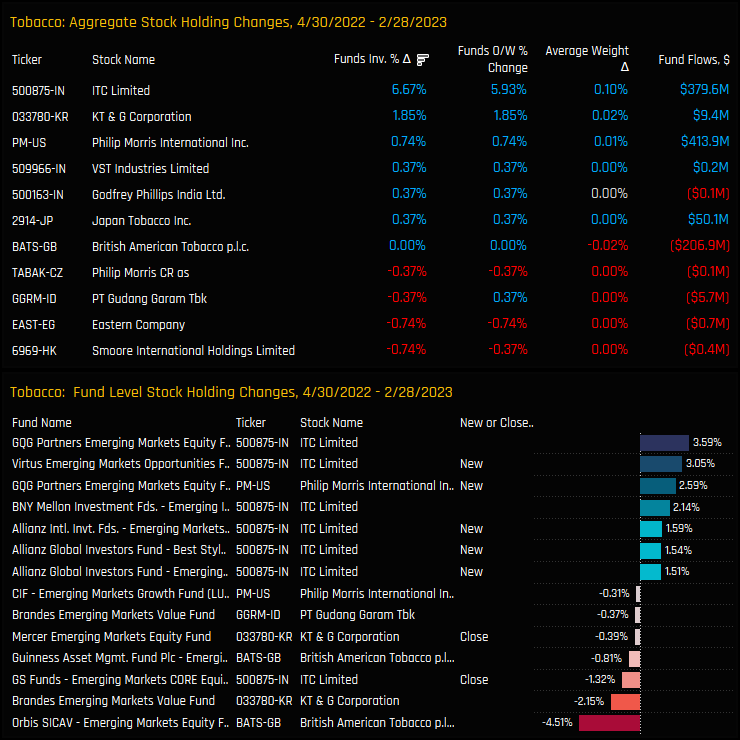
Fund level activity between 04/30/2022 and 02/28/2023 highlights the widespread nature of the allocation shift. All Style groups saw investment levels rise, with 16 funds opening exposure to Tobacco versus 1 closing over the period. GQG Partners EM Equity, Virtus EM Opportunity and BNY Mellon EM Income were among the larger buyers.
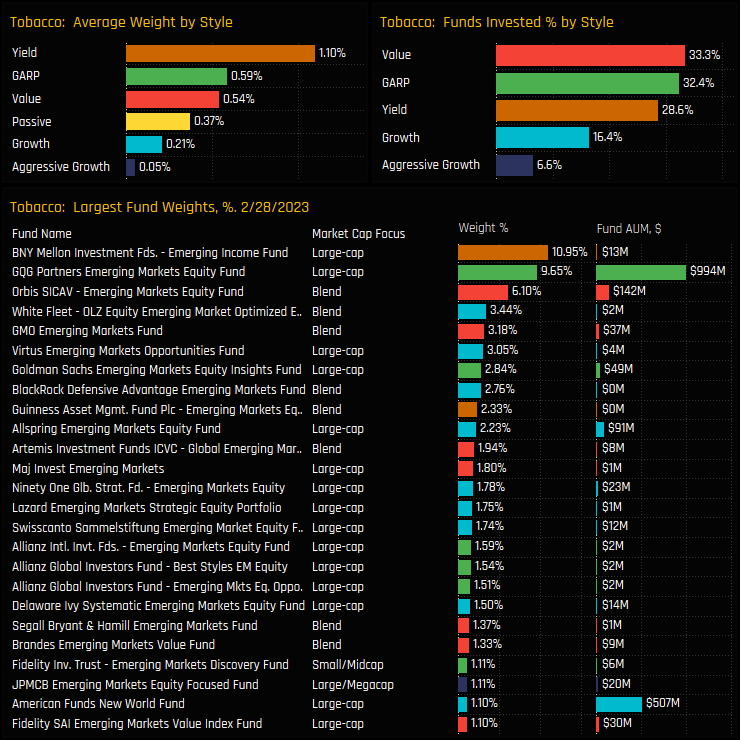
As it stands today, Value, GARP and Yield funds are the most widely allocated of the Style groups, with BNY Mellon EM Income (10.95%), GQG EM Equity (9.65%) and Orbis EM Equity (6.1%) bumping up the averages. Outside of these 3 funds, allocations are more typically below the 2% level.
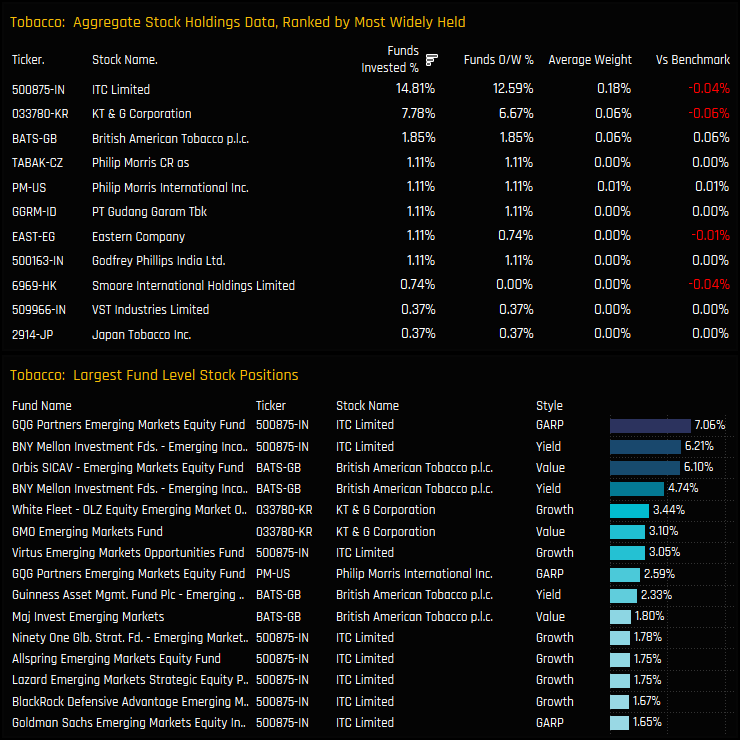
Stock Holdings & Activity
ITC Limited and KT&G Corp dominate the holdings picture on a stock level, owned by 14.8% and 7.8% of managers respectively. Both stocks are prevalent among the larger positions in the lower chart, in addition to selected holdings in British American Tobacco (Orbis, BNY Mellon) and Philip Morris (GQG).
Activity between 04/30/2022 and 02/28/2023 favoured ITC Limited, as a further 6.7% of the funds in our analysis opened positions. Weight increases from GQG Partners, alongside new positions from Virtus, Allianz, Fidelity and Artemis were the driving force behind the moves higher.
Conclusions & Data Report
In a world that is pivoting towards a more ESG centric approach, it’s perhaps surprising that Tobacco is back on the menu for EM investors. Only as far back as a year ago, investment levels in EM Tobacco stocks looked to be in terminal decline, seen largely as uninvestible due to the negative social impact of smoking.
However, over the last 10-months there has been a clear shift in sentiment, perhaps in response to a more positive approach from individual companies. ITC Limited, for example, has continuously achieved the ‘AA’ rating by MSCI-ESG – the highest amongst global tobacco companies. Altria and Philip Morris talk about ending tobacco consumption and shifting to non-tobacco alternatives.
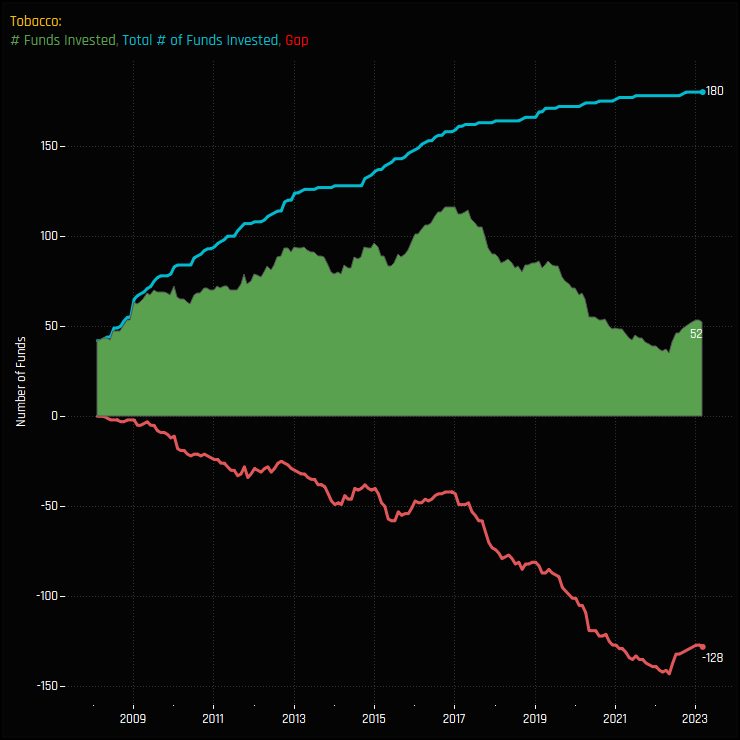
If this is the case, and Tobacco has become more palatable to investors, then the current low ownership picture should give additional impetus to revisit the sector. The chart to the right shows the total number of funds (out of 270) who have ever invested in Tobacco stocks since 2008, currently 180. The green area shows the number invested at any one point in time, currently just 52. The red line shows the difference, with 128 funds with previous investment experiences on the sidelines for now, but with an increasing number buying back in.
Click on the link below for the latest data pack on Tobacco Industry positioning among active EM funds. Scroll down for stock profiles on ITC Limited and KT&G Corp.
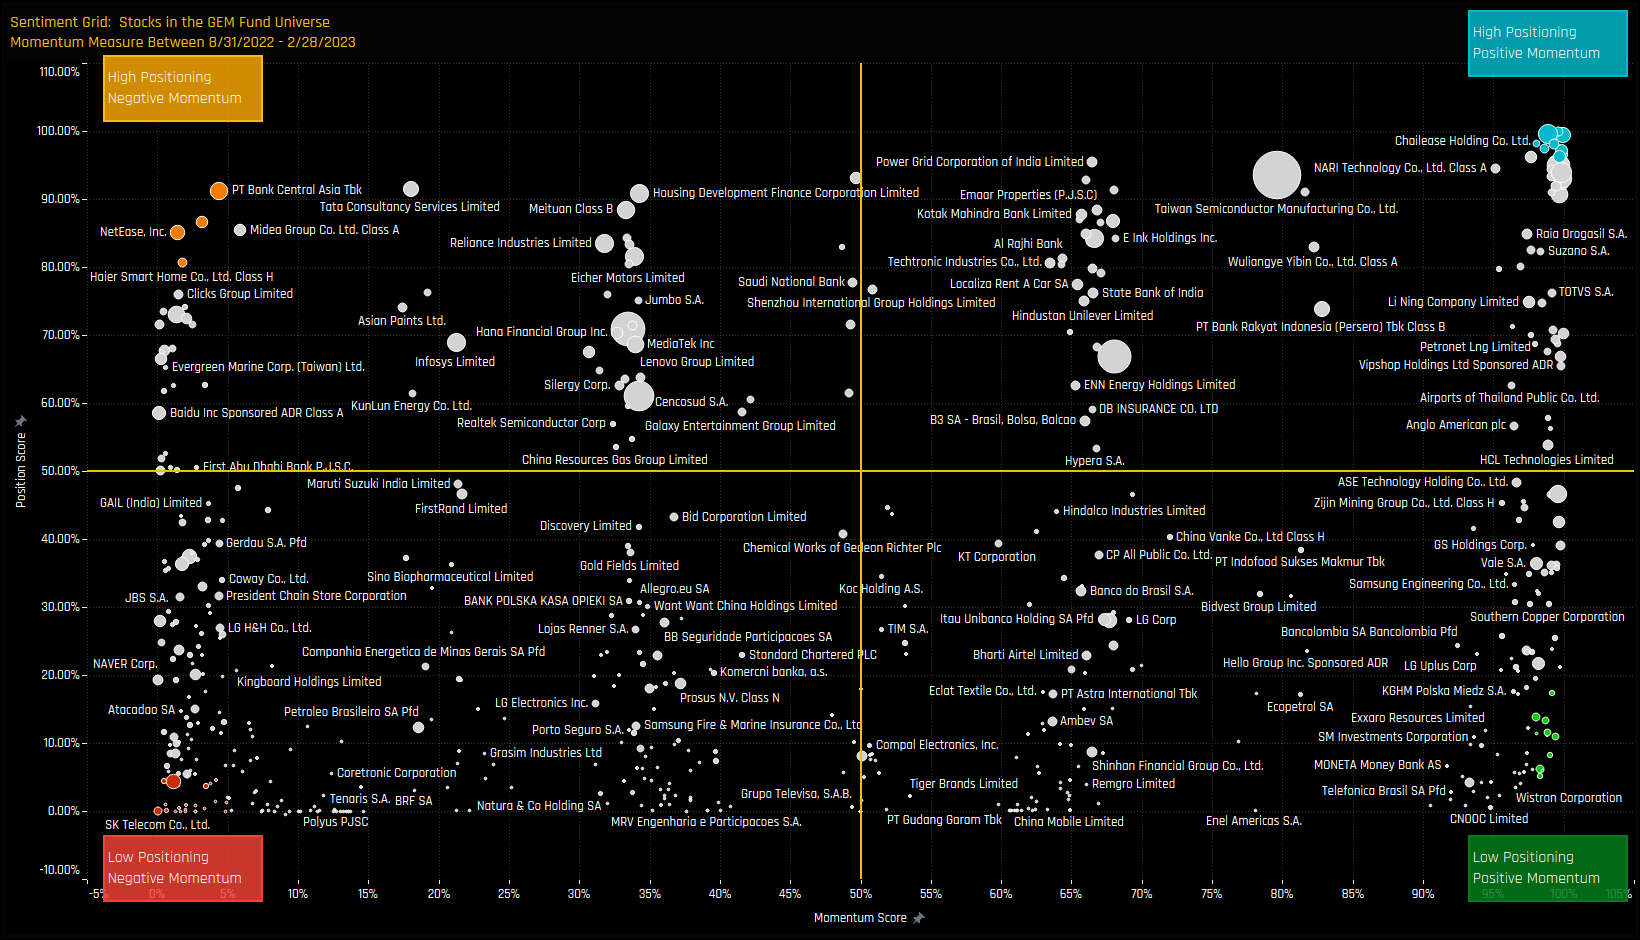
Investment levels among the thousands of stocks in the investible Emerging Markets universe differ greatly. Some stocks are widely owned, others largely avoided with ownership levels changing every month. We combine current and historical positioning against shorter-term manager activity to get a handle on where sentiment lies for every stock in our EM analysis. We highlight 8 stocks at the extreme ends of their own positioning ranges whilst also seeing significant changes in fund ownership.
Stock Sentiment
The Sentiment Grid below is designed to visualize the interplay between current fund positioning, long-term fund positioning and shorter-term fund manager activity for all stocks in the GEM fund active universe. The Y-axis shows the ‘Position Score’, a measure of current positioning in each stock compared to its own history going back to 2008 on a scale of 0-100%. It takes in to account the percentage of funds invested in each stock versus history, the average fund weight versus history and the percentage of funds overweight the benchmark versus history. The higher the number, the more heavily a stock is owned by active EM managers compared to its own history.
The X-Axis shows the ‘Momentum Score’, a measure of fund manager activity for each stock between 08/31/2022 and 02/28/2023 on a scale of 0% (maximum negative activity) to 100% (maximum positive activity). The Momentum Score takes in to account the change in the percentage of funds invested in each stock over the period, the change in average weight and the change in the percentage of funds overweight. The chart also highlights the companies at the extreme ends of each quadrant by colour, which will shall explore in more detail below.
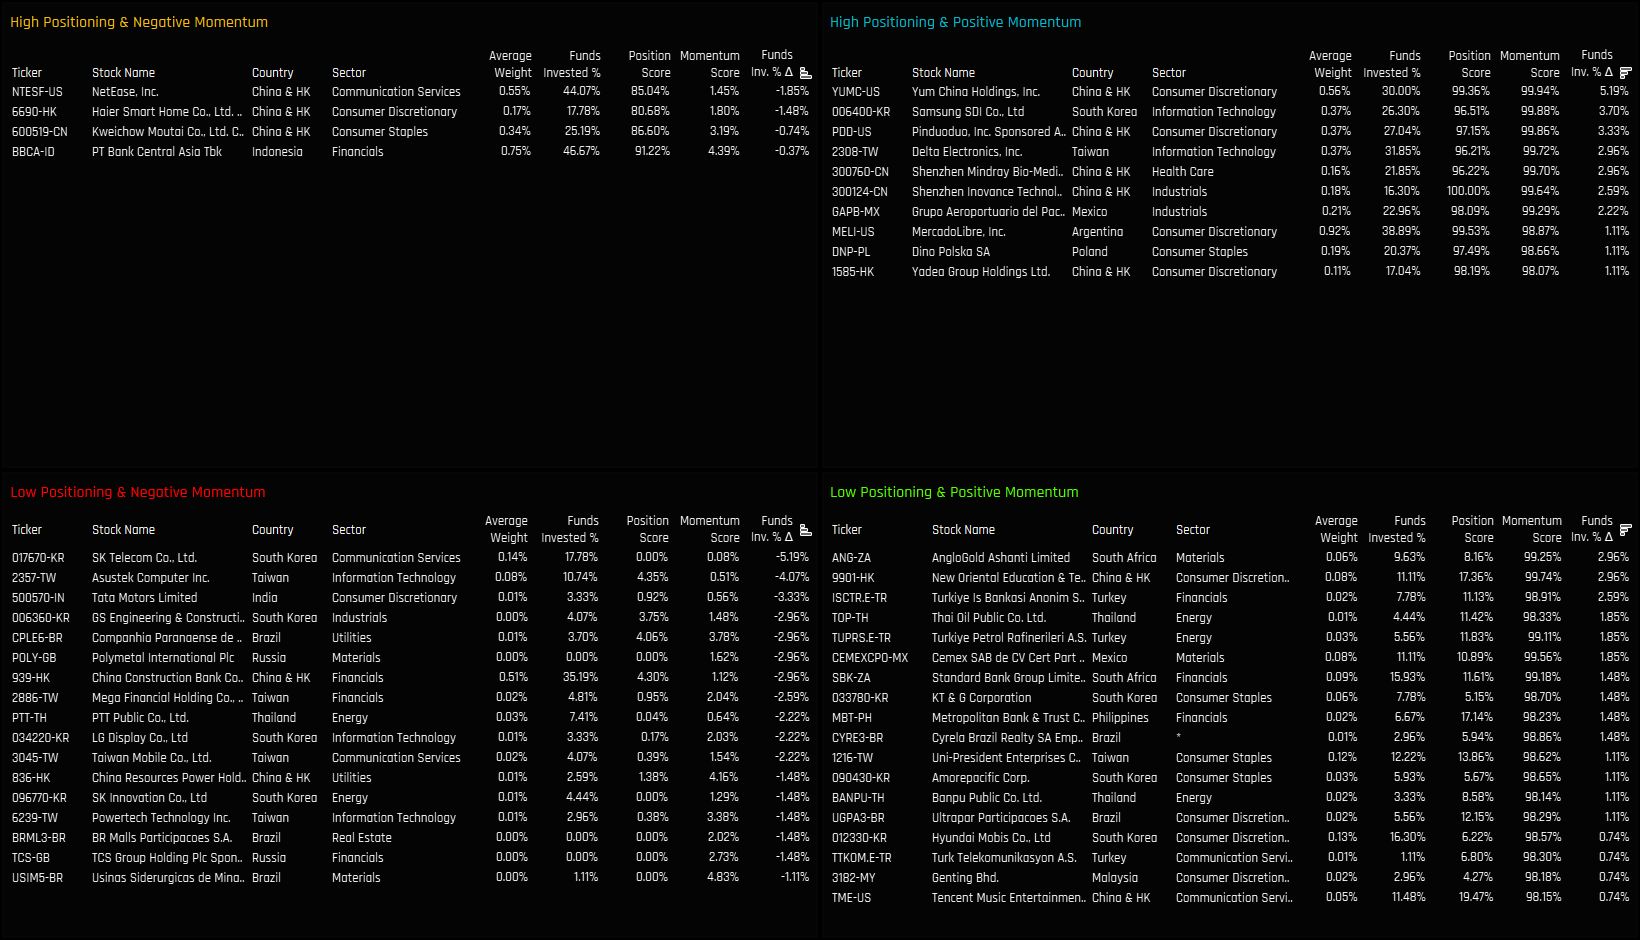
Extreme Stocks
The tables below list the stocks in the extreme corners of each quadrant. The screening methodology is as follows:
High Positioning & Negative Momentum: Position Score > 80%. Momentum Score < 5%
High Positioning & Positive Momentum: Position Score > 95%. Momentum Score > 98%
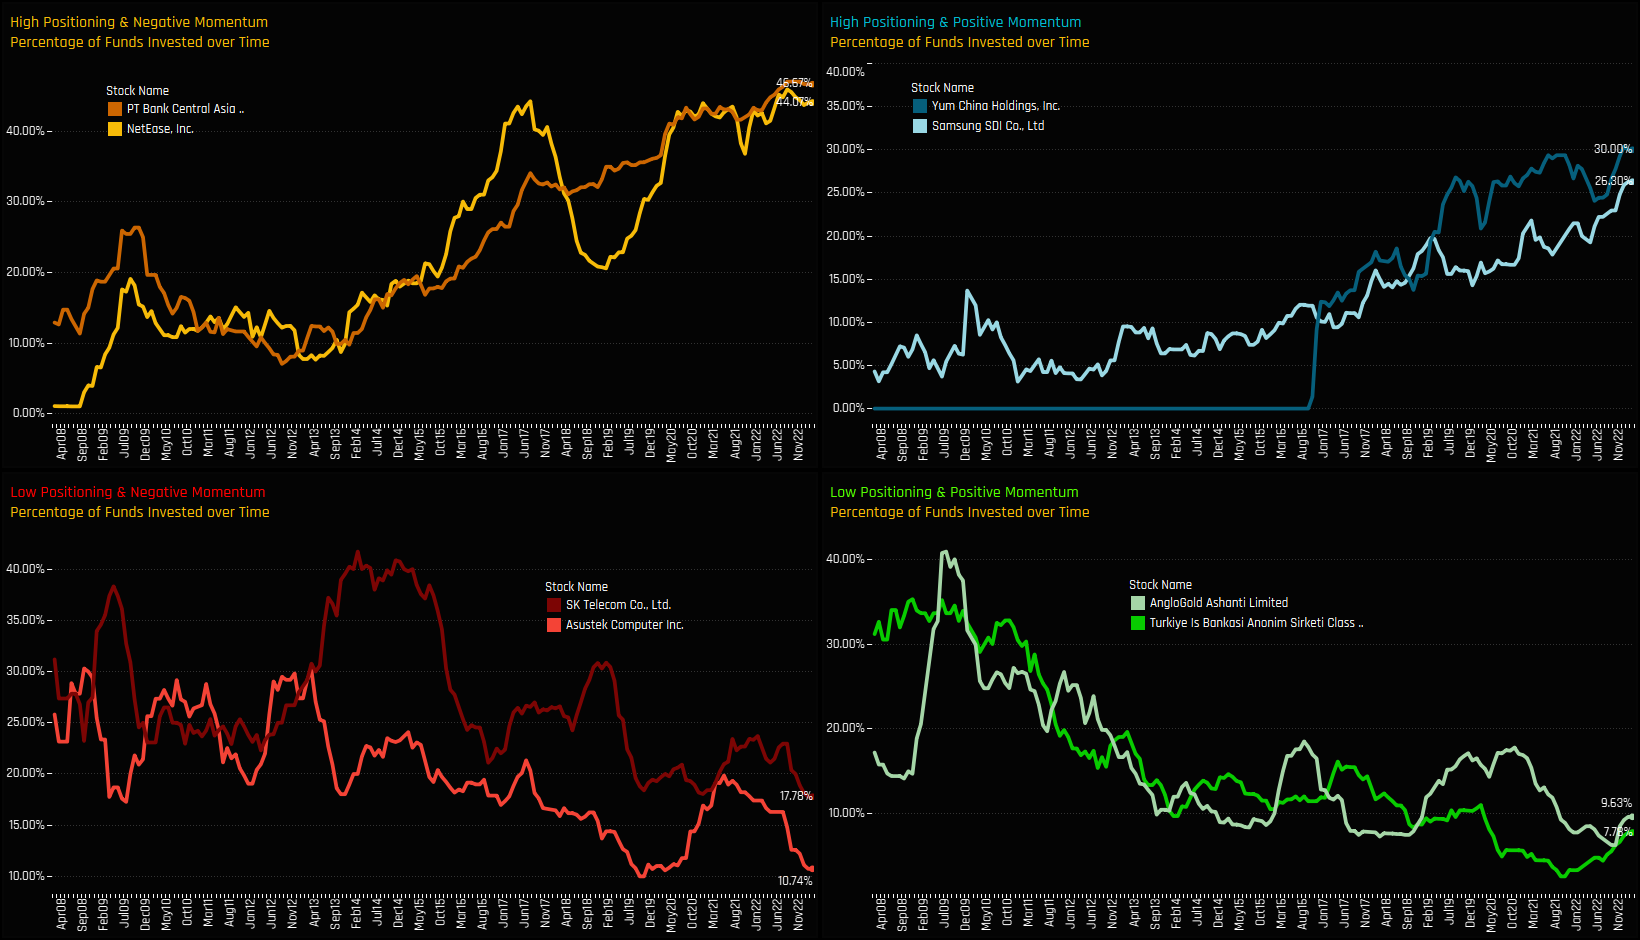
Extreme Stocks Focus
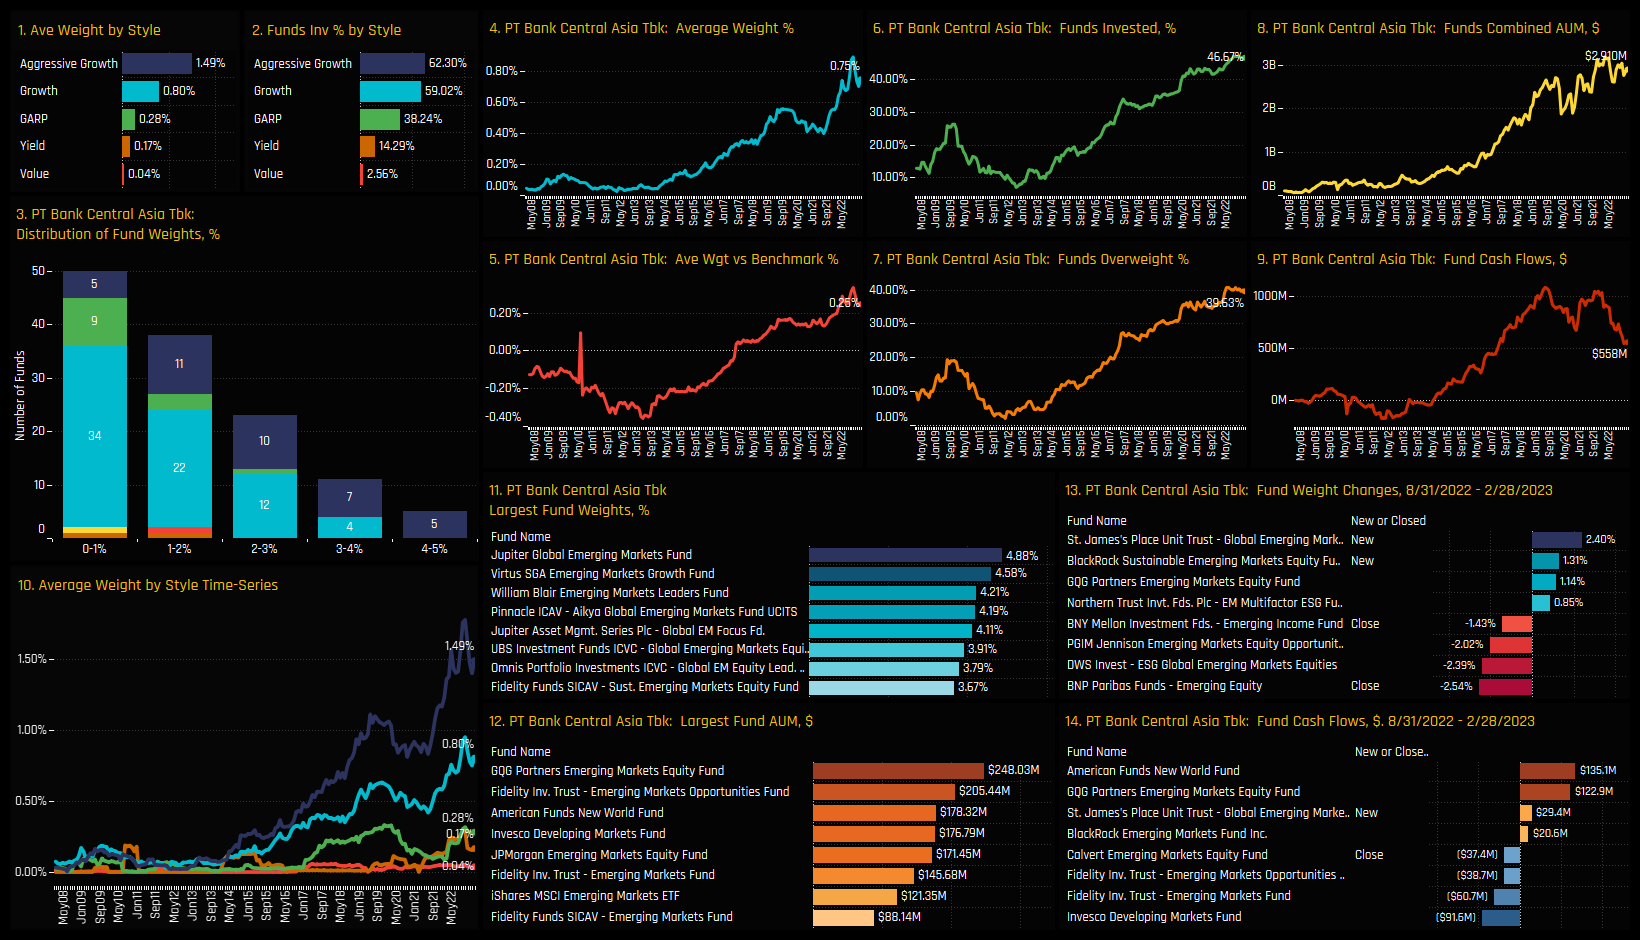
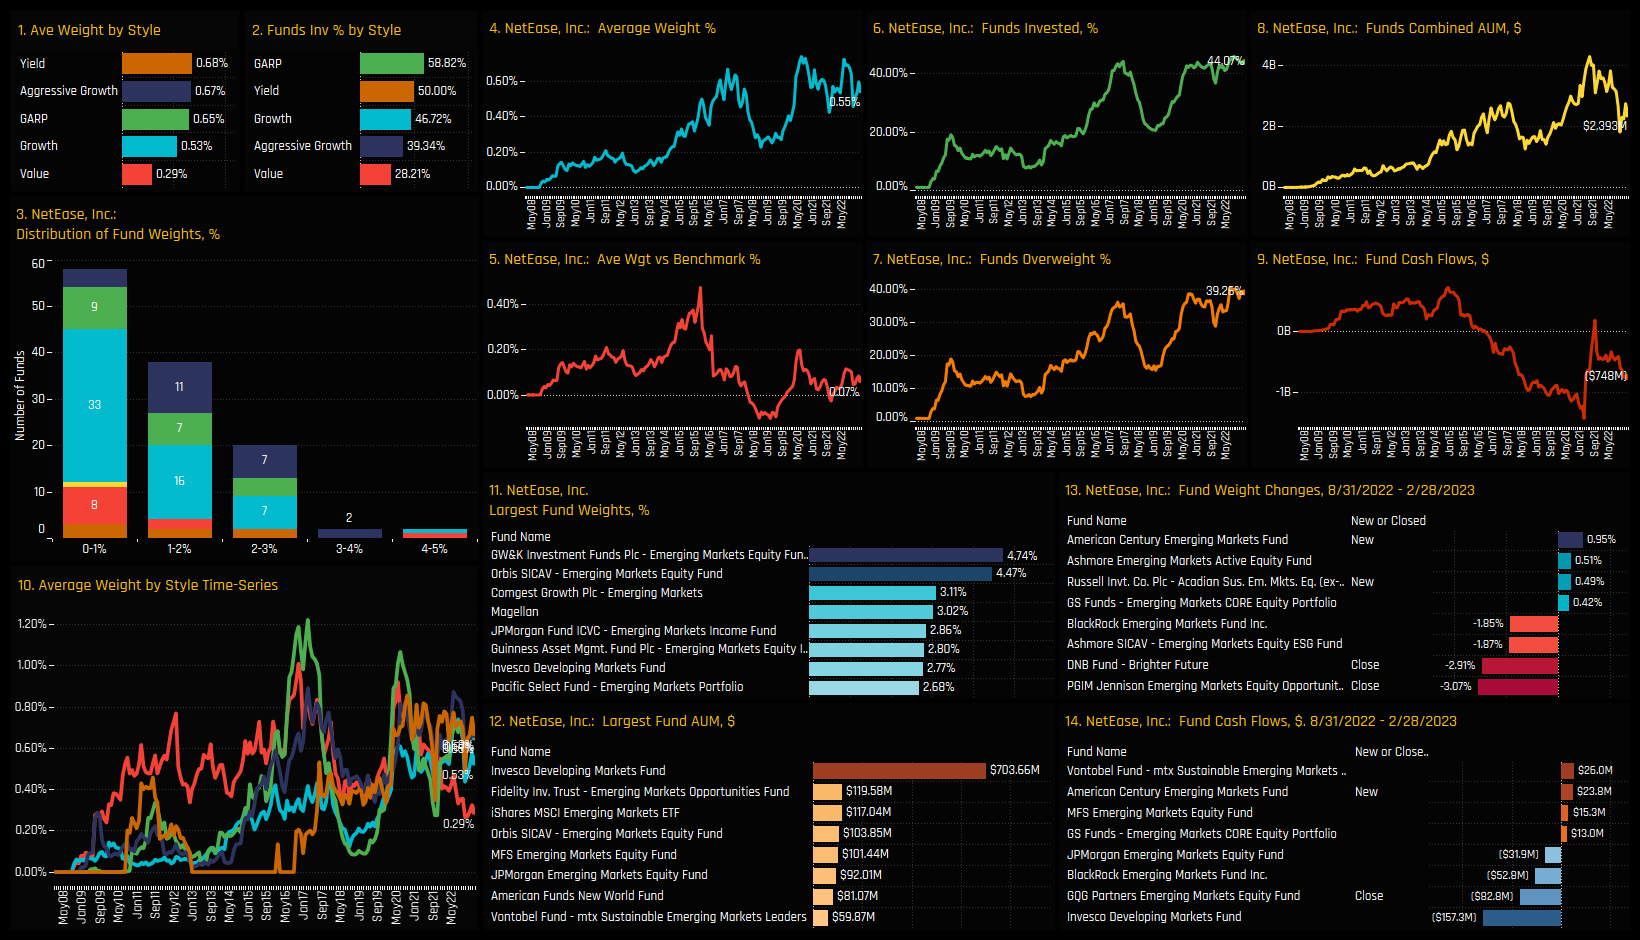
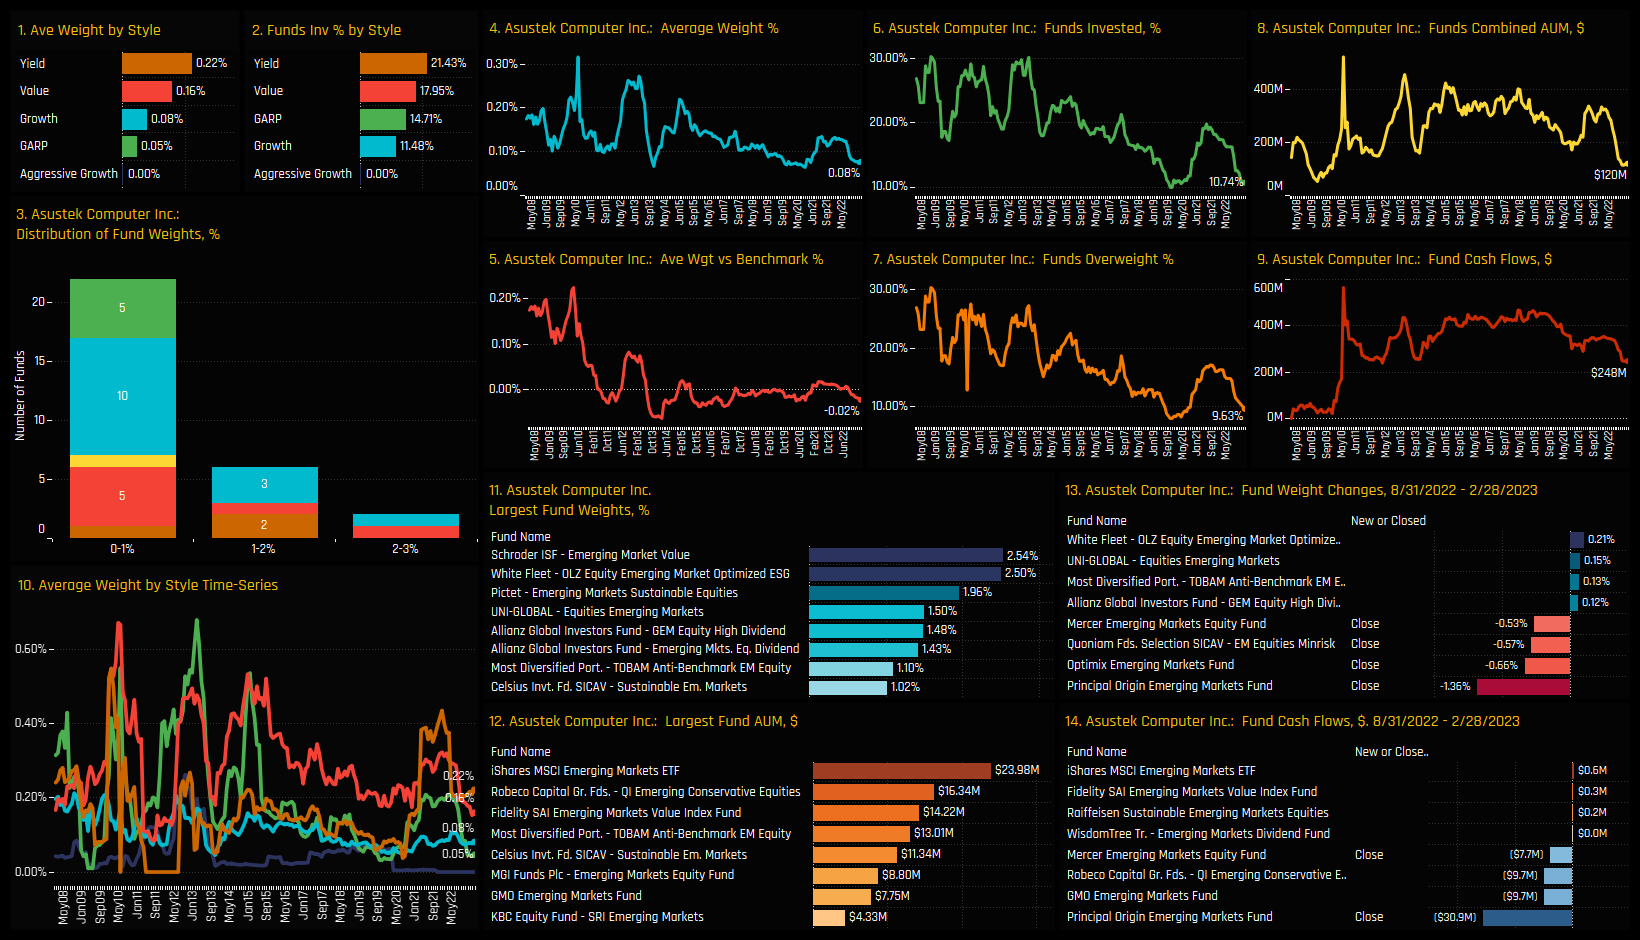
The charts below track the percentage of active funds invested in each of the top 2 stocks across the 4 categories. It’s another way to visualize how the Sentiment Grid works. For example, the top-left chart shows PT Bank Central Asia and NetEase Inc seeing fund ownership reversing from peak levels after sustained multi-year growth. In the bottom-left chart, both Asustek Computer and SK Telecom have seen ownership levels drop to their lowest levels since 2008 after recent selling from active GEM managers.
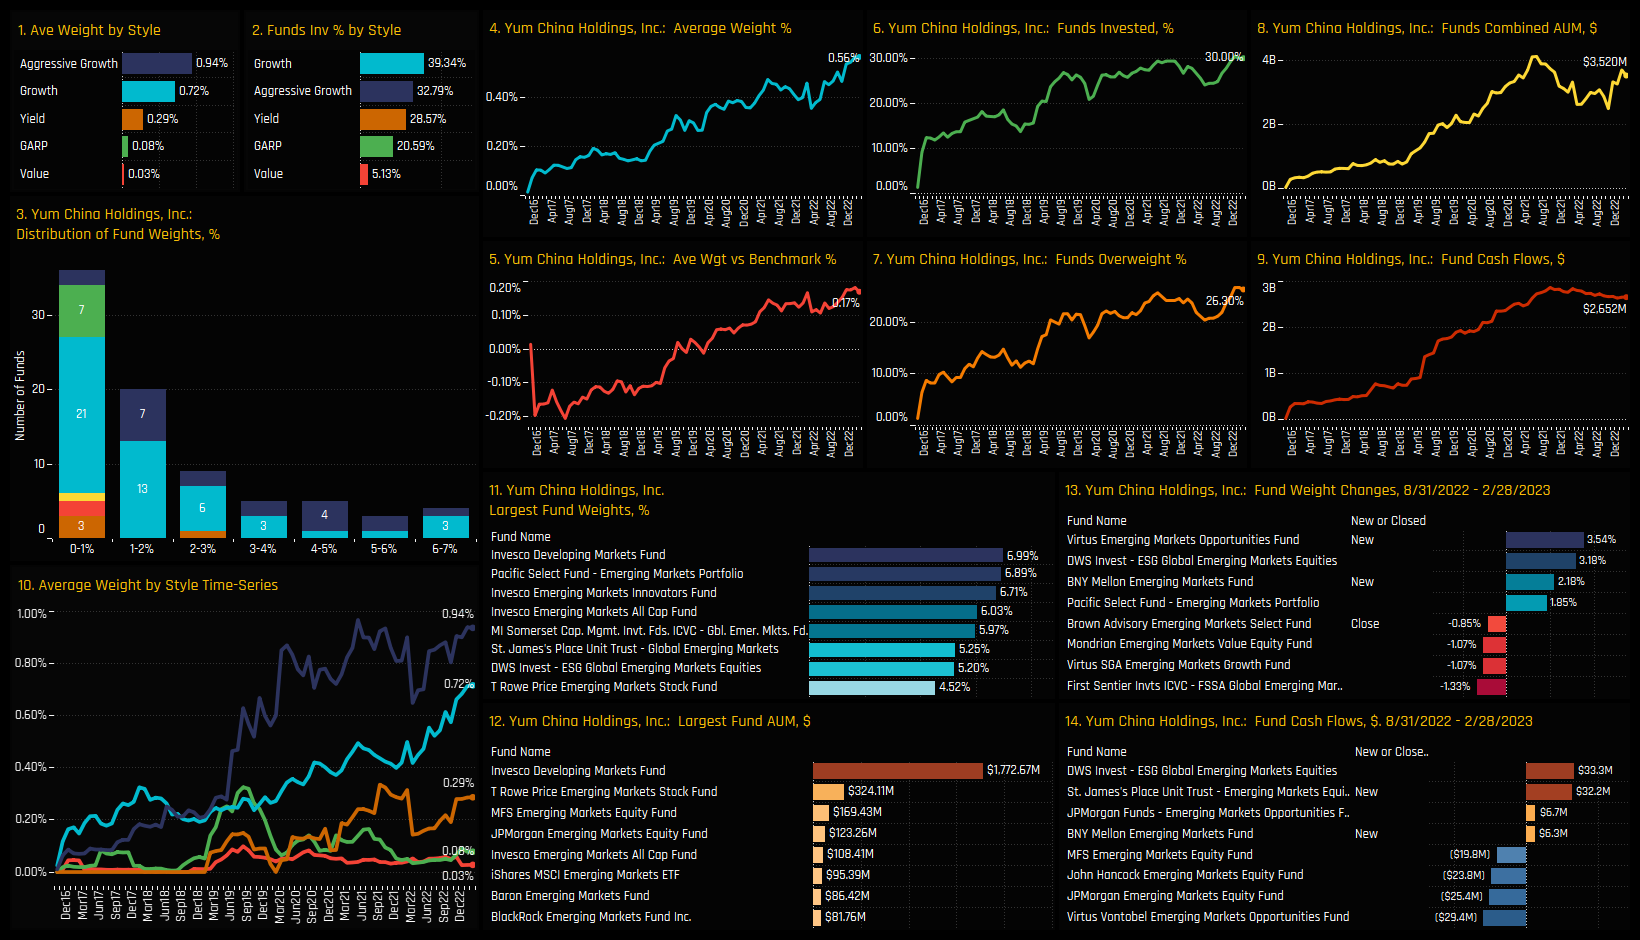
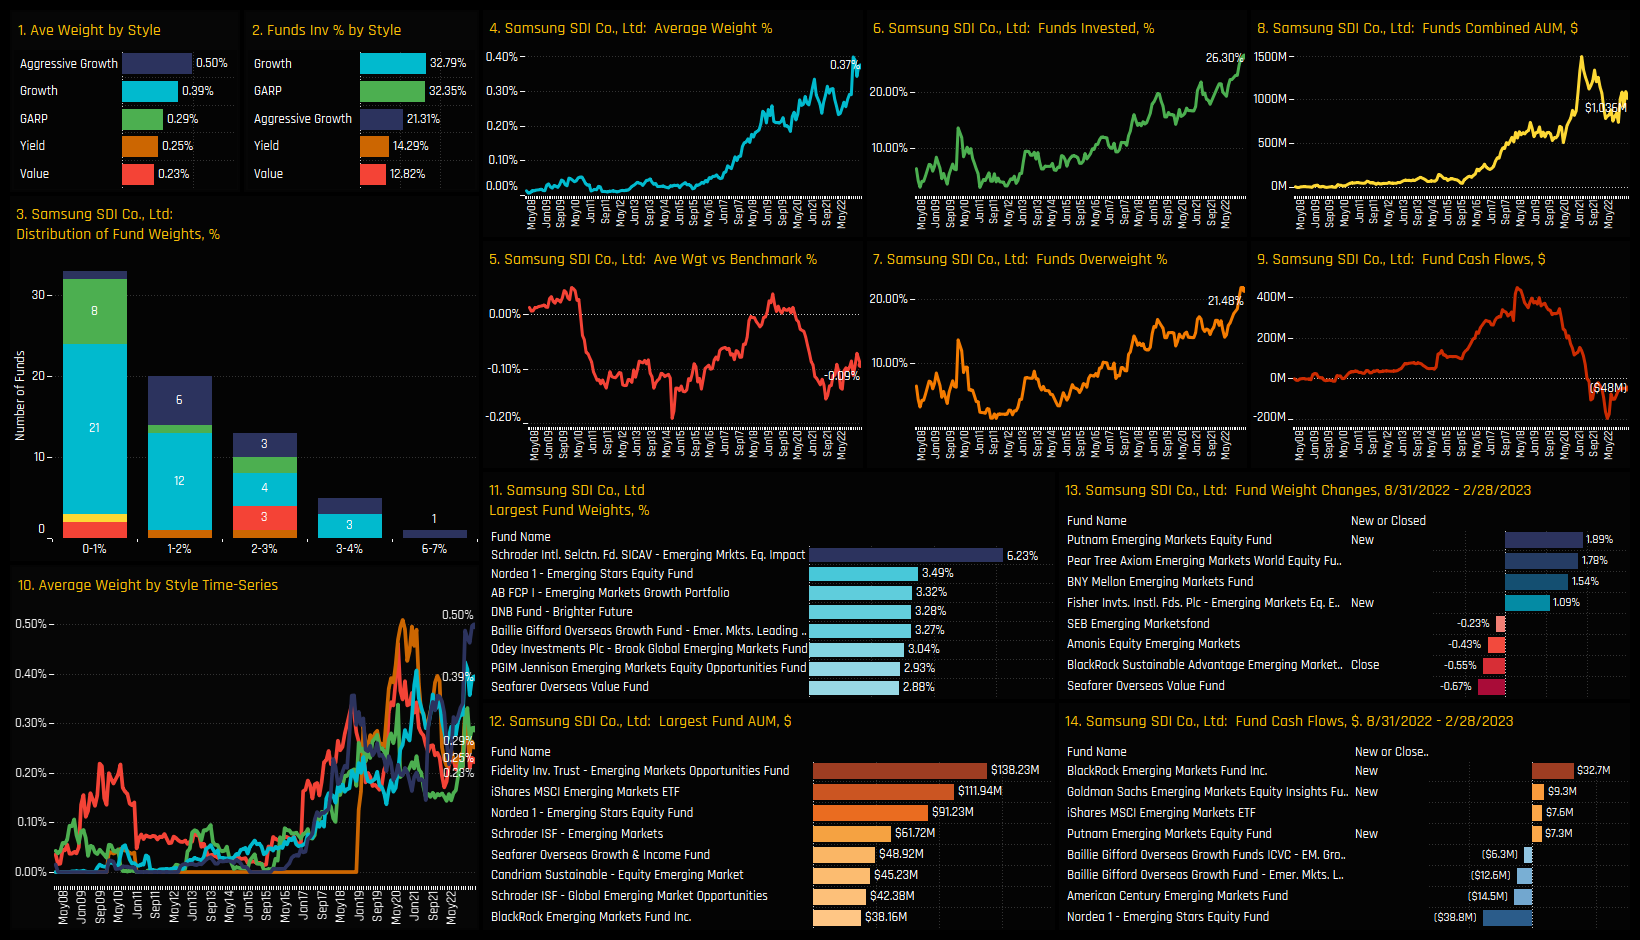
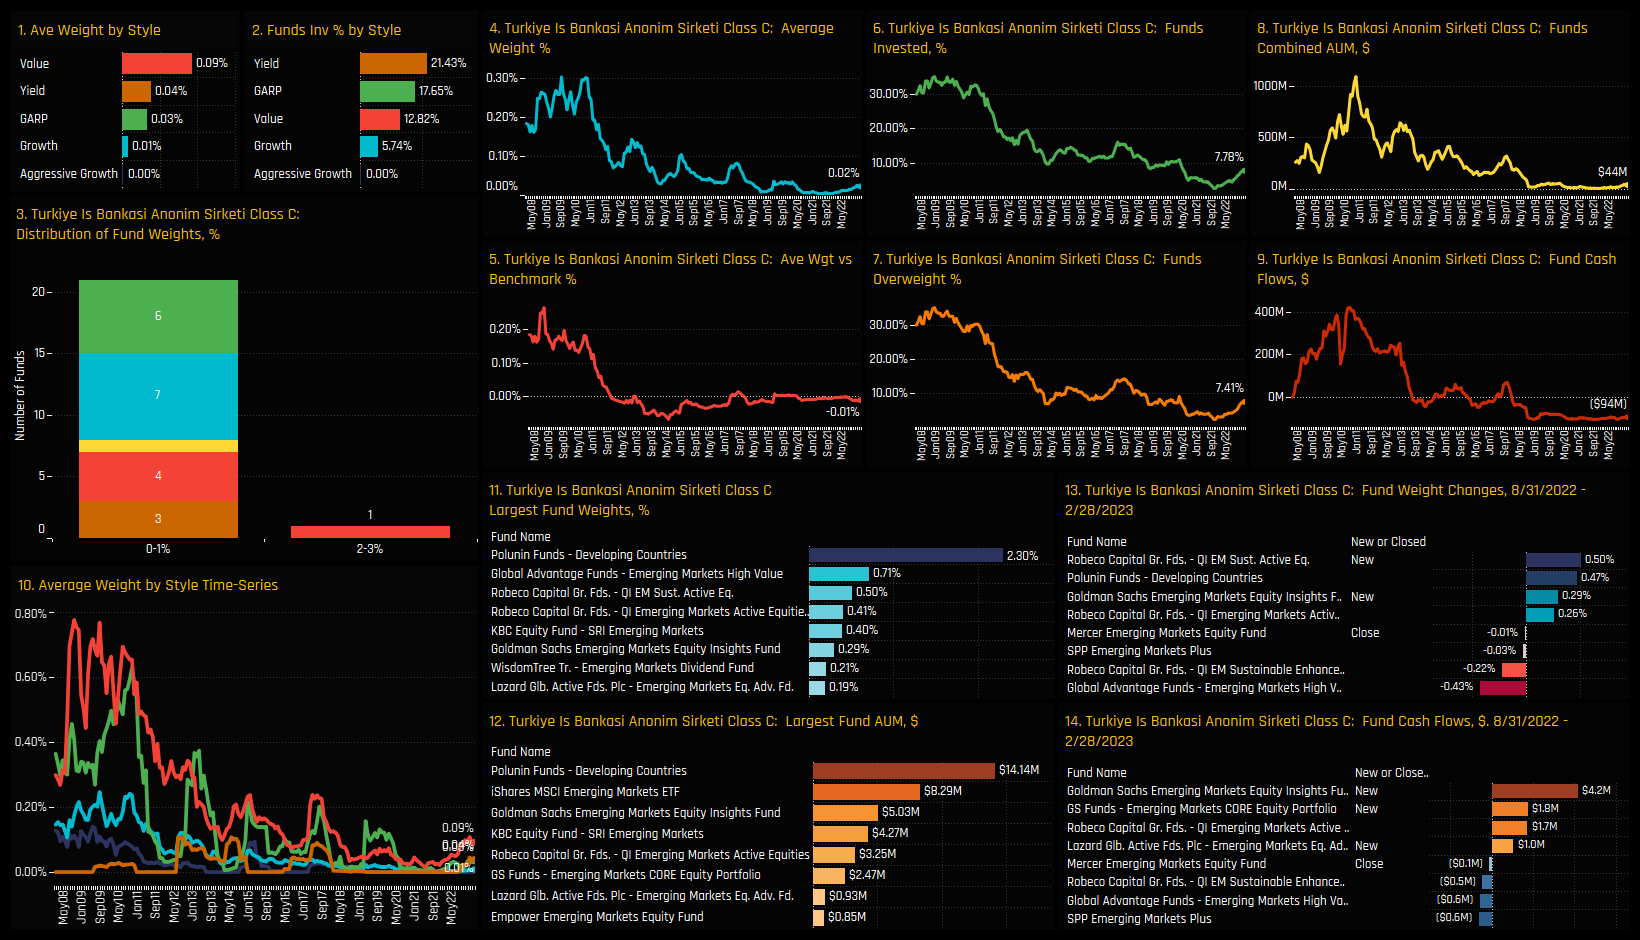
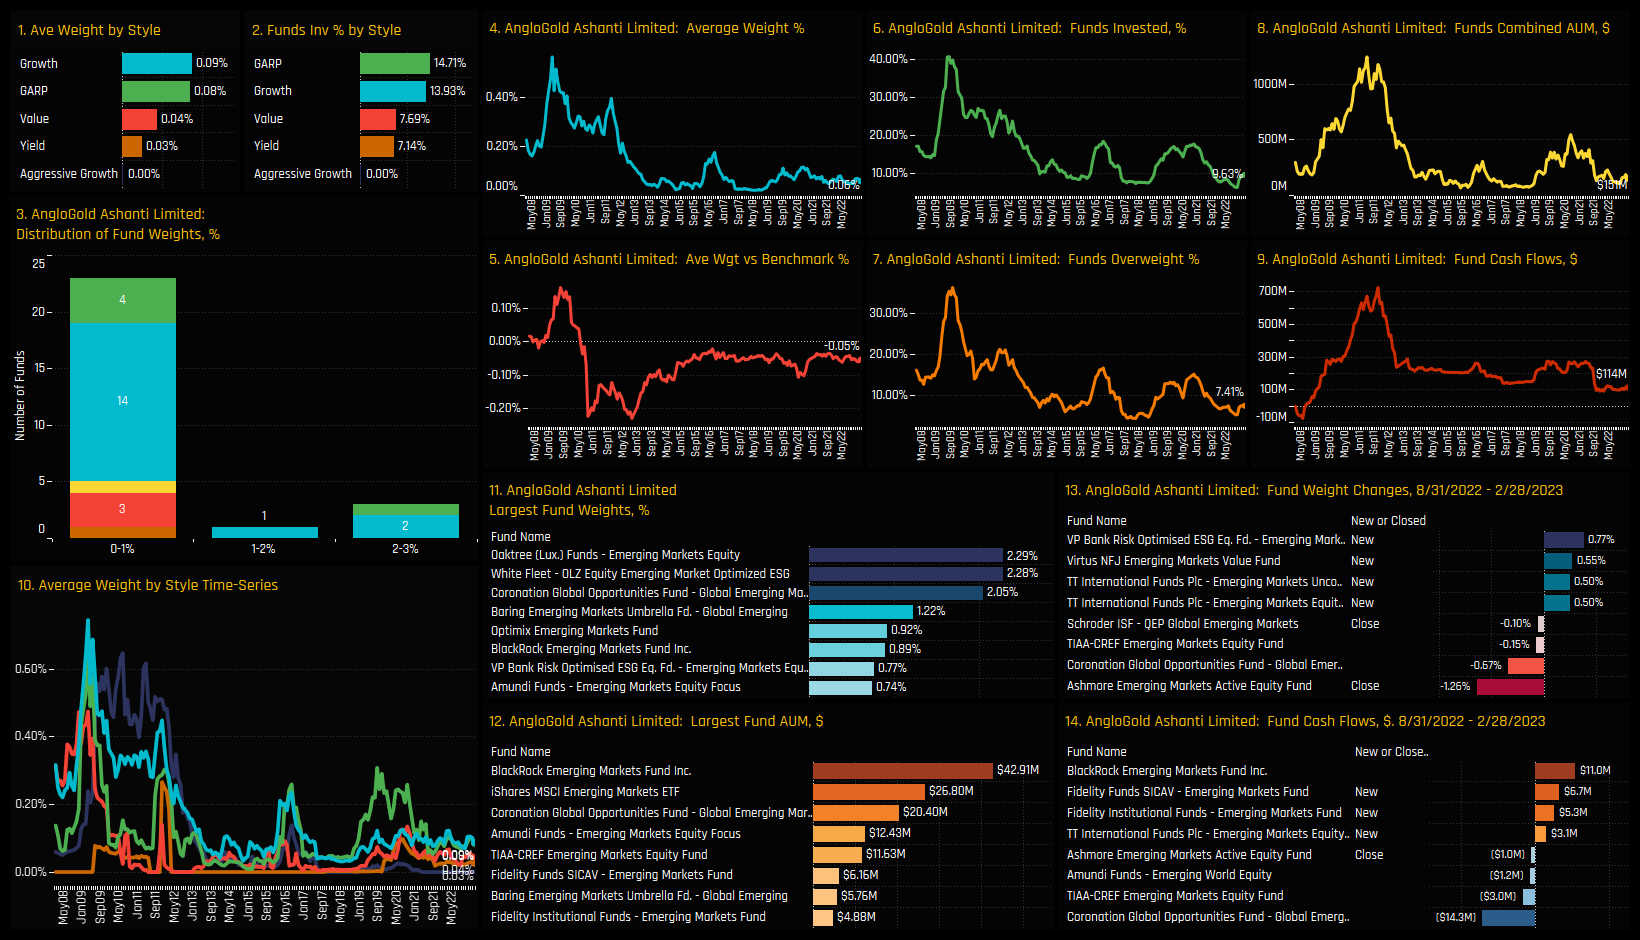
In the opposite case (bottom right), both AngloGold Ashanti and Turkiye Is Bankasi are at the bottom of their historical ownership ranges but both have started to climb from the lows. Top right shows Yum China Holdings and Samsung SDI Co at peak ownership after sustained increases in fund exposure in recent months. In the charts that follow we provide more detailed profiles of each of the 8 stocks at the extreme corners of our Sentiment Grid.
High Positioning & High Momentum: Yum China Holdings
High Positioning & High Momentum: Samsung SDI
High Positioning & Low Momentum: PT Bank Central Asia
High Positioning & Low Momentum: Netease Inc.
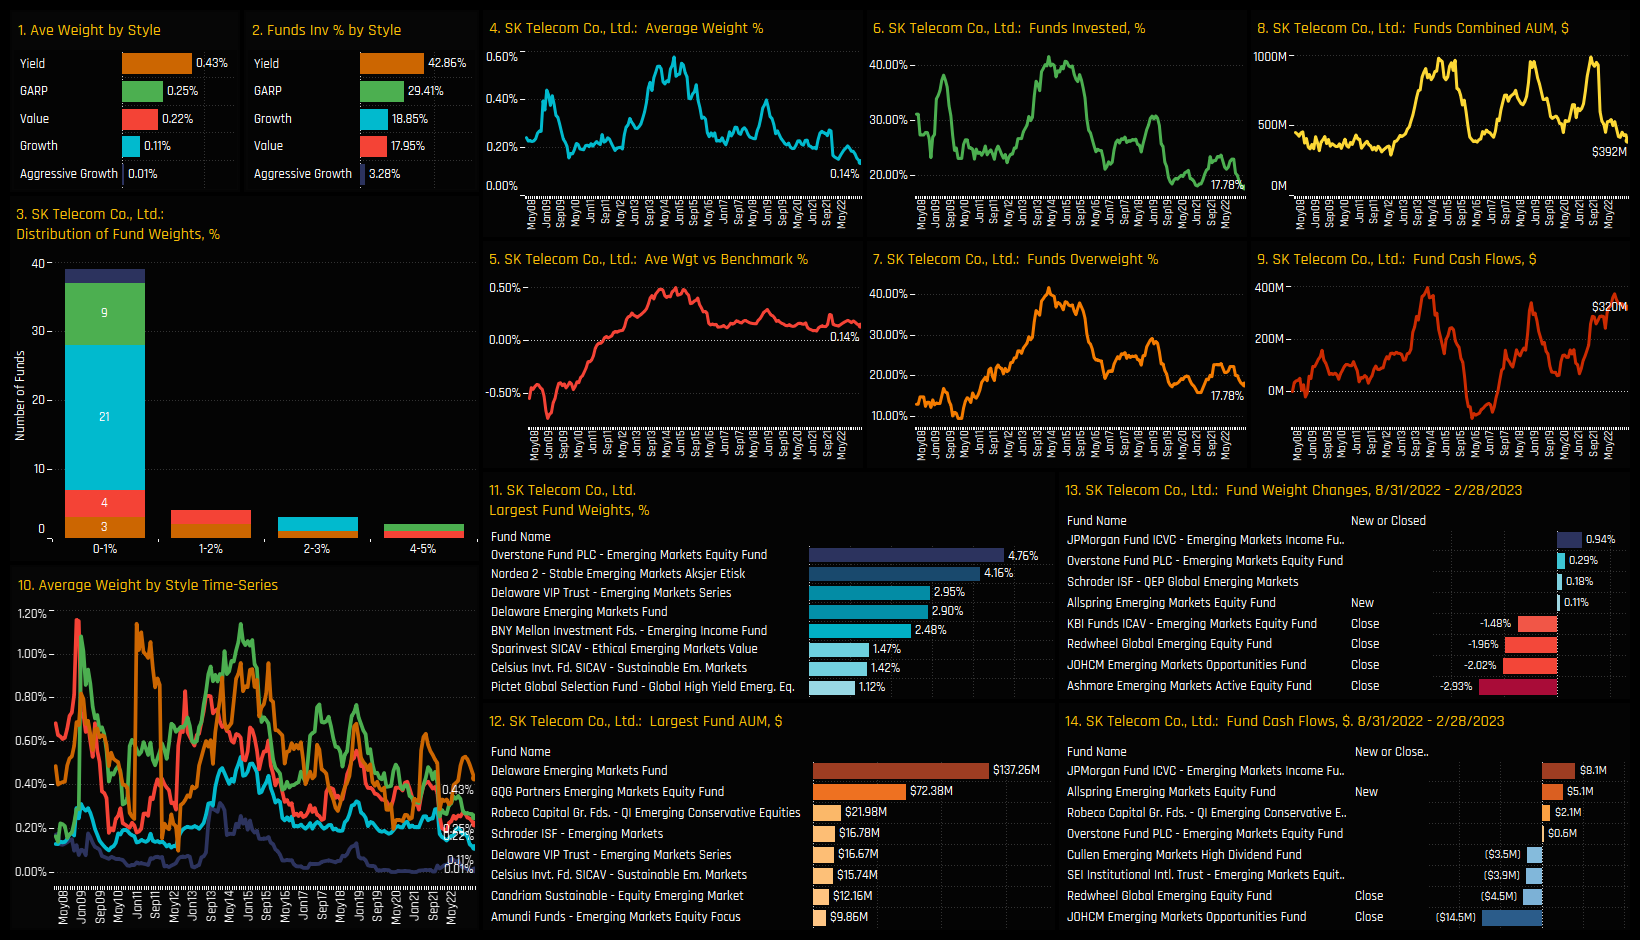
Low Positioning & Low Momentum: SK Telecom
Low Positioning & Low Momentum:
Low Positioning & High Momentum: Turkiye Is Bankasi
Low Positioning & High Momentum: AngloGold Ashanti Limited
270 emerging market Funds, AUM $340bn
GEM Active Funds Ownership Report
Please click on the link below for the full data report on Global EM active fund positioning
For more analysis, data or information on active investor positioning in your market, please get in touch with me on steven.holden@copleyfundresearch.com


