Emerging Market Funds: Q3 Performance & Attribution

279 Active GEM Funds, AUM $354bn.

Q3 Performance & Attribution

In this piece, we provide an overview of Q3 performance among the GEM active funds in our analysis. We look at quarterly performance broken down by Style and Market Cap focus, together with longer-term analysis of active versus passive. We then breakdown this quarter’s performance based on the average active GEM fund stock portfolio versus the iShares Emerging Markets ETF (EEM).

Q3 Active Returns

Amidst a backdrop of falling equity markets, active EM managers faired well compared to their benchmark in the third quarter of 2022. Absolute performance of -10.56% was enough to beat the benchmark by +1.13%, with 59.3% of active managers outperforming. All Style groups outperformed the MSCI EM index, though Value managers underperformed their Growth peers and there was a significant outperformance at the Small/Midcap end of the spectrum.


The top and bottom performers on the quarter are listed below. On top is the Fundsmith Emerging Equities Trust on +14.05%, though we believe this performance was due to a large contraction of the NAV discount in mid-September. Of the top 15 performers, 9 were Aggressive Growth in nature and the remainder were either Small/Midcap or Blend strategies.


Returns by Style & Market Cap Focus

The grid below shows the top 3 and bottom 3 performers in each Style and Market Cap bucket

Long-Term Performance

The outperformance in Q3 helped EM active managers claw back some of the losses suffered in the first half of the year. In Q1 managers underperformed the index by -1.73% and in Q2 by -0.83%, with February and April of this year particularly challenging. September’s blockbuster outperformance of +1.41% has given active managers the chance to level the playing field before the year is out.

Over the longer-term, EM active managers have generally had more periods of outperformance than underperformance, beating the benchmark in 14 of the last 21 years.


Fund Positioning

We now analyse the drivers behind this quarter’s absolute and relative performance. We start by looking at the average stock portfolio generated from the holdings of the 279 funds in our EM analysis. This is the portfolio we use for our monthly positioning analysis. The major exposures are highlighted in the middle Grid, with most sectors in China & HK and India standing out, as well as Financials across the board and South Korea and Taiwan Tech. On a stock level, Taiwan Semiconductor tops the list, with average holding weights of 5.68%, followed by average Cash Holdings of 3.76%. The top 40 stocks listed in the right-hand table account for 38.1% of the total portfolio.

Fund Performance

The performance of the active GEM portfolio comes in at -9.43% on the quarter. This differs slightly from the ‘average fund performance’ of -10.56% due to a combination of fees, delays in fund reporting and the fact that we take monthly snaps of each portfolio. The charts below show the performance of each country, sector, country sector and stock in the portfolio. The underperformance of China & HK is a standout, with all sectors except Energy losing more than 20% on the quarter. The outperformers were spread across the major South American nations alongside India, Indonesia and Turkey.

Portfolio Contribution

Marrying the performance of each portfolio component with the weight in the active portfolio provides the contribution of each country, sector and stock to the overall quarterly performance of -9.43%. China & HK alone accounts for -6.93% of total return over the quarter, with particular negatives coming from Communication Services (Tencent), Consumer Discretionary (Alibaba, JD.Com) and Financials (AIA Group, Ping An Insurance). South Korean Tech (Samsung Electronics, SK Hynix) and Taiwan Tech (TSMC, MediaTek) also dragged on overall returns. There were few positives over the period, though Brazil (Energy/Financials), India (Financials/Discretionary) and Indonesia (Financials) were the standouts.

Relative Fund Positioning

To understand the drivers of the outperformance over the quarter, we first need to look at the positioning of the active portfolio in relation to the benchmark. We use the iShares MSCI Emerging Markets ETF (EEM) as our benchmark proxy. On a country level, active managers are underweight Saudi Arabia, China & HK, Taiwan and South Korea against overweight in Argentina, Mexico, Brazil and Indonesia (and cash). On a sector level, underweights in Energy, Communication Services and Materials are offset by overweight in Consumer Discretionary, Consumer Staples and to a lesser extent Technology and of course cash holdings.

Portfolio Attribution

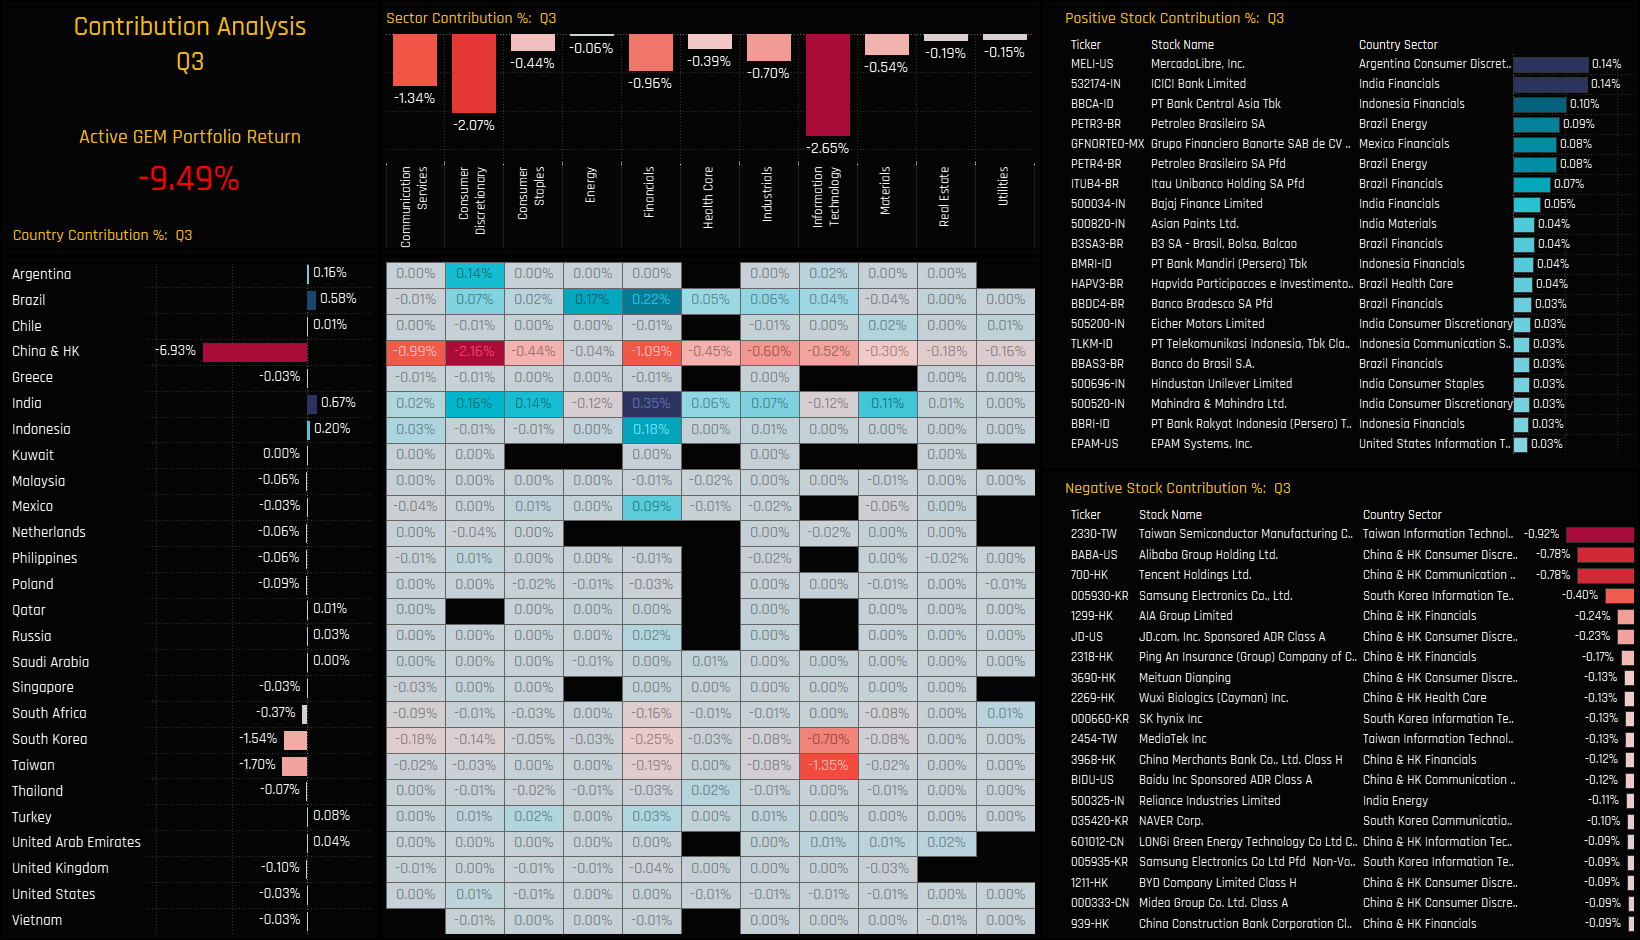
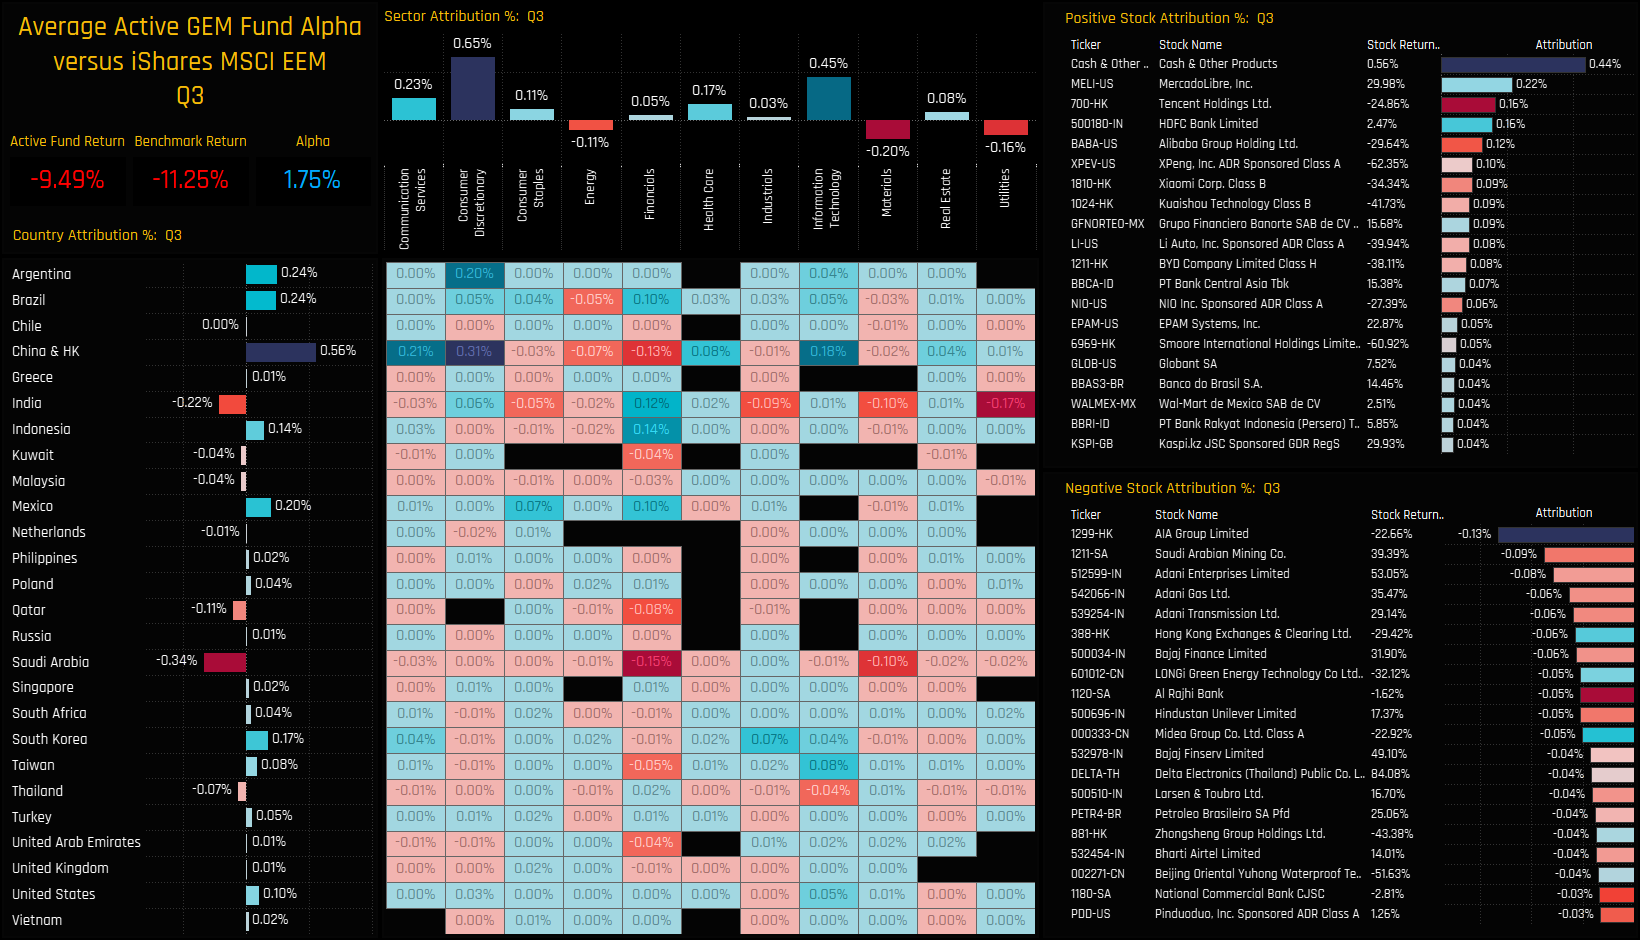
Marrying the performance of each portfolio component with the relative overweights and underweights in the active portfolio provides the attribution of each country, sector and stock towards the overall outperformance of +1.75% on the quarter. Again, this differs slightly from the outperformance of +1.13% derived from the fund performance for the reasons stated above, and the fact that we are using the ETF and not the MSCI Index. Nevertheless, the drivers of the outperformance are clear, with the underweight in China & HK generating +0.56% of relative outperformance on the month, together with overweights in Brazil, Argentina and Mexico. Active managers lost out to underweights in Saudi Arabia (Financials, Materials), India (Utilities, Energy) and Energy (Brazil, China). On a stock level, Cash was king in a falling market, generating +0.44% of relative outperformance, together with overweights in MercadoLibre and underweights in Tencent Holdings. Relative underperformance was down in part to overweights in AIA Group, underweights in Saudi Arabian Mining Co and the 3 high performing Indian Utility stocks.

For more analysis, data or information on active investor positioning, please get in touch with me on steven.holden@copleyfundresearch.com