In this issue:
Taiwan Semiconductors: Value Funds Drive Underweight
Brazil Consumer Staples: Growing Conviction
Emaar Properties: Record Holdings
EM Stock Positioning Update
267 Active GEM Funds, AUM $337bn
Taiwan Semiconductors: Value Funds Drive Underweight
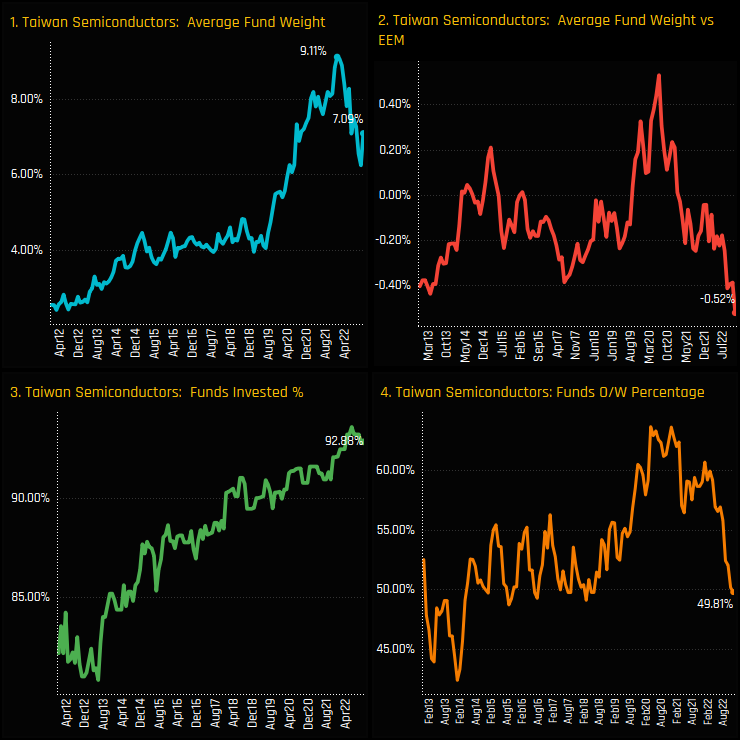
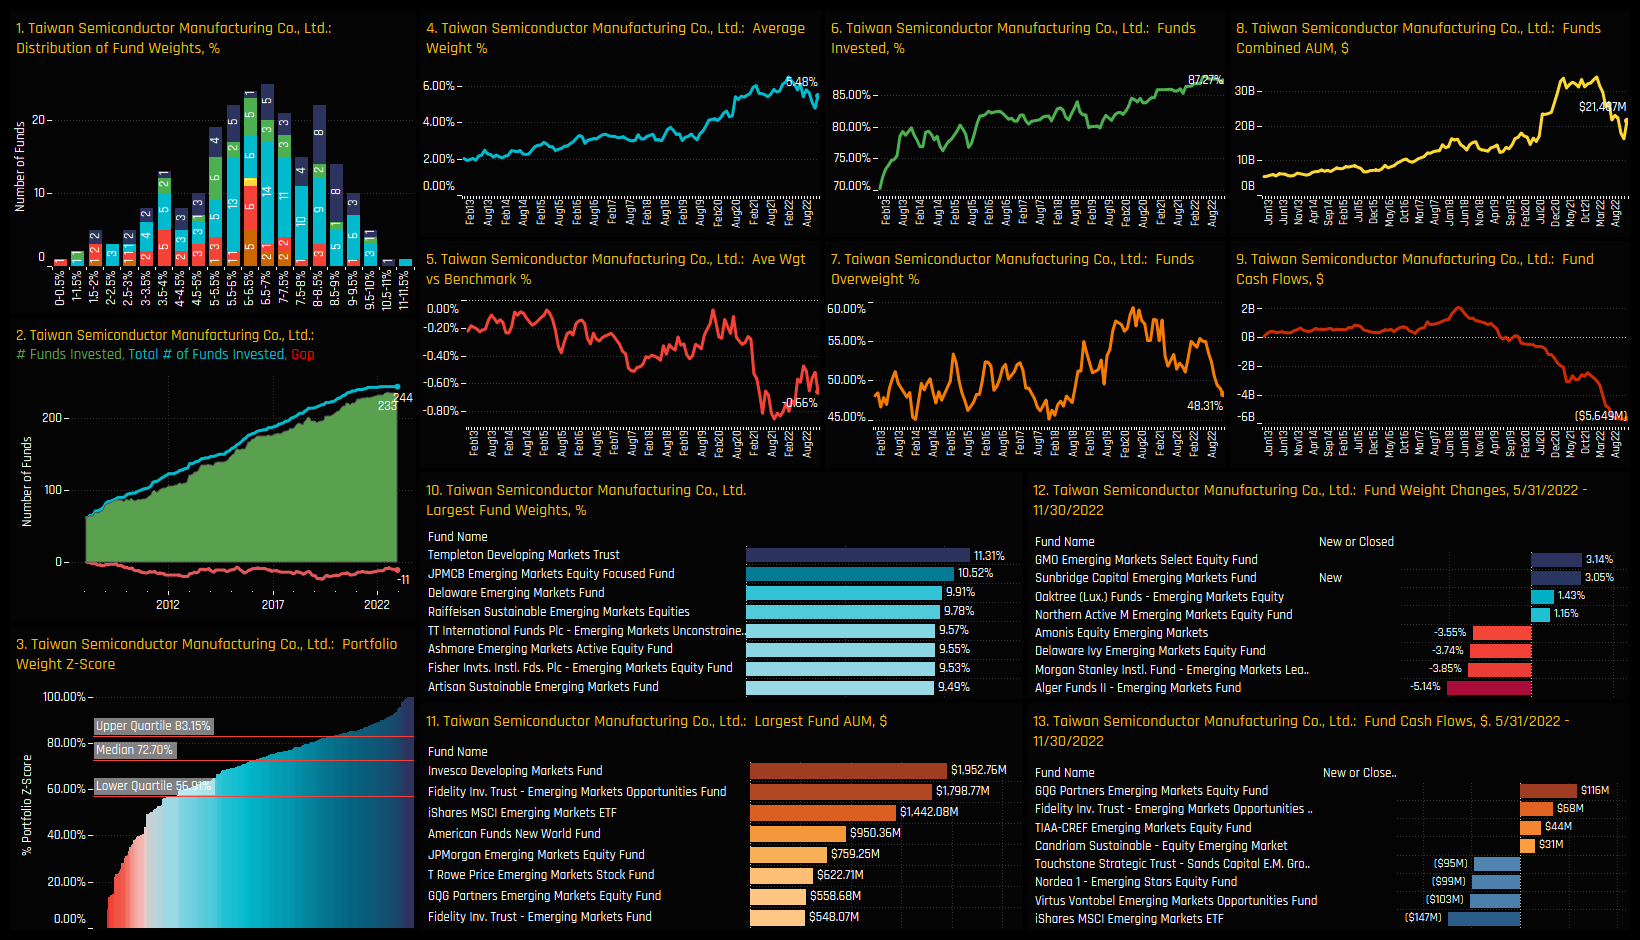
Sentiment in the Taiwan Semiconductor sector remains fragile. After a surge in exposure among GEM managers following the COVID-19 pandemic of 2020, average holding weights peaked at 9.1% in December 2021 but then aggressively reversed course. The current average weight of 7.09% sits towards the higher of the decade long range, but relative to benchmark represents an ever growing underweight.
Versus Industry peers, Taiwan Semiconductors are the largest and most widely held country level industry group among GEM managers, representing more than the combined allocations of China’s Internet Software/Services and Internet Retail sectors. Relative to benchmark the underweight is moderate compared to peers, with Saudi Banks and the major China Industry groups the larger underweights among EM active funds.
Industry Activity and Sentiment
The charts below show the change in our Industry ownership metrics between 05/31/2022 and 11/30/2022. Over this shorter period, Taiwan Semiconductors have suffered versus Industry peers, with average fund weights falling by -1.18% (ch1), relative to benchmark weights falling by -0.3% (ch3), -6.74% of active funds moving from overweight to underweight (ch4) and a large excess of sellers over buyers (ch2).
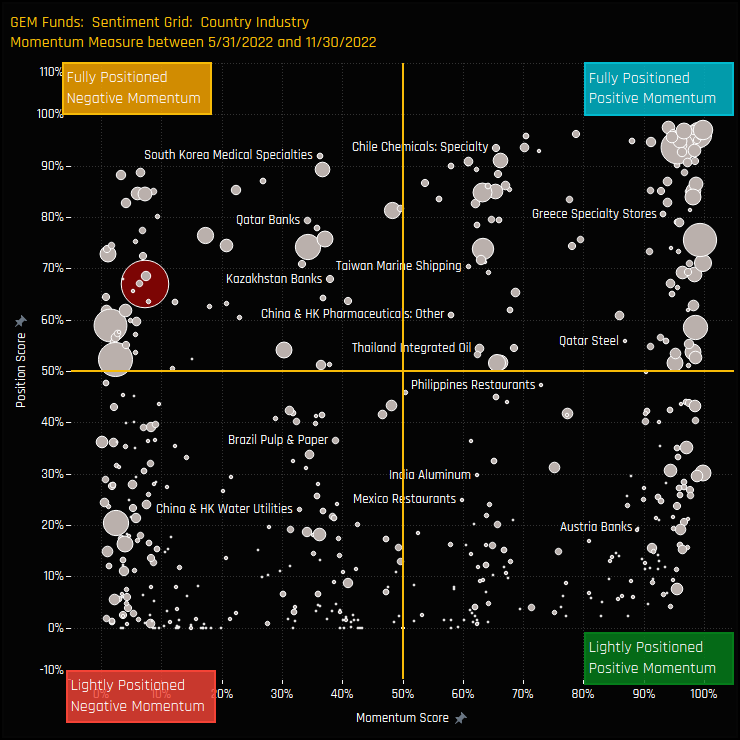
The sentiment grid below shows where current positioning in each Country/Industry sits versus its own history going back to 2012 on a scale of 0-100% (y-axis), against a measure of fund activity for each Country/Industry between 05/31/2022 and 11/30/2022 (x-axis). Taiwan Semiconductors sit in the top-left quadrants, indicative of active rotation out yet still relatively high positioning.
Fund Holdings & Activity
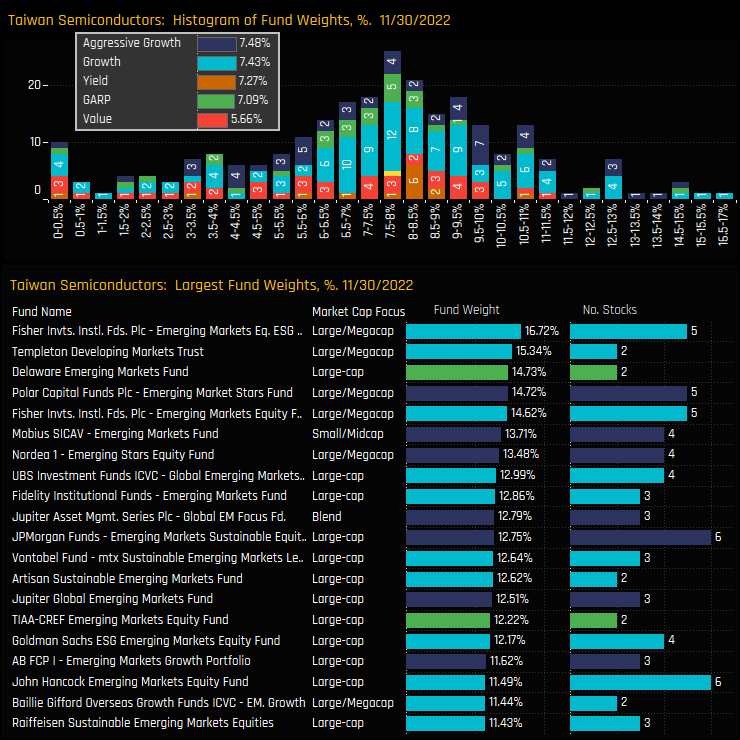
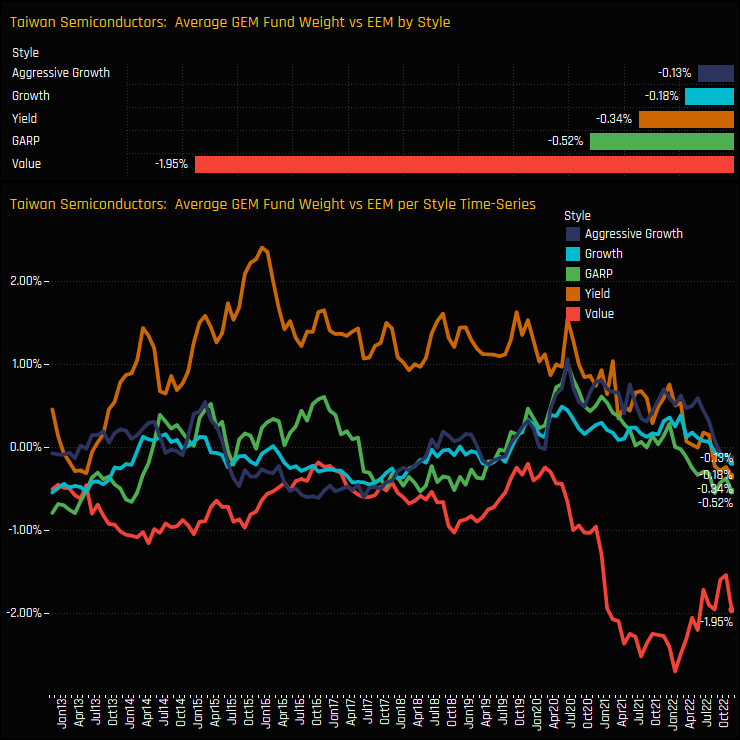
The top chart below shows the distribution of fund weights and the average weights by fund style. The bulk of the distribution in Taiwanese Semiconductors sits between 5% and 10%, with Growth managers allocating significantly more than their Value counterparts. Top allocators are from the Growth category and led by Fisher Emerging Markets ESG (16.7%) and Templeton Developing Markets Trust (15.3%).
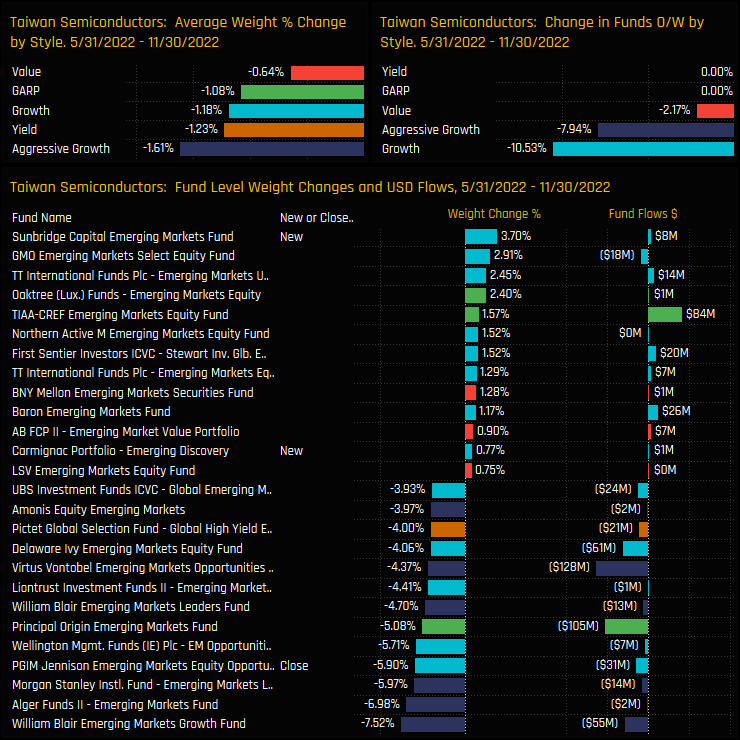
Style level changes over the last 6-months show average weights falling for all categories, though Aggressive Growth and Yield funds led the way. Though there was buying over the period, the larger of the weight changes were on the sell side, led by William Blair EM Growth (-7.5%) and Alger Emerging Markets (-6.98%).
Stock Holdings & Activity
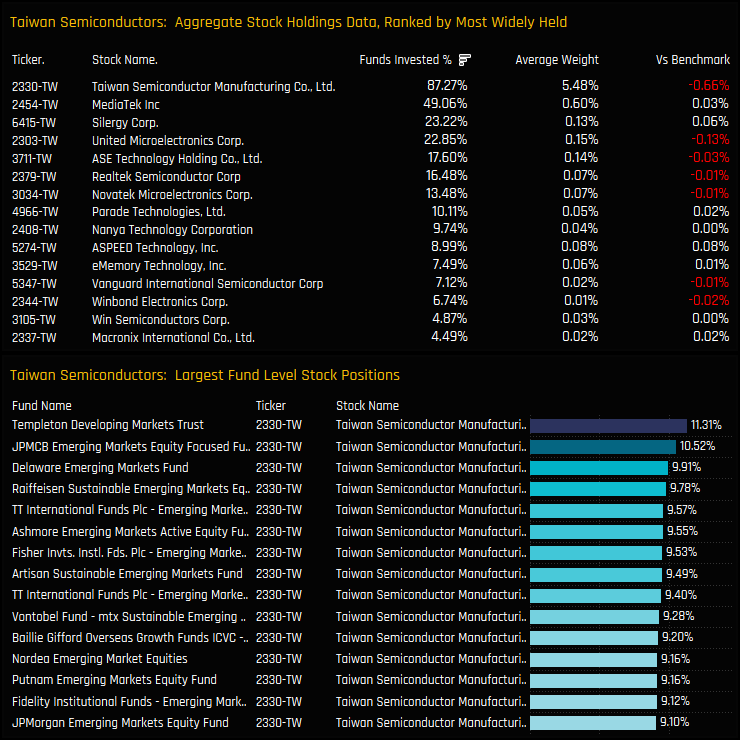
The most widely held stock the Taiwanese Semiconductor Industry group is TSMC, owned by 87.3% of EM managers at an average weight of 5.48%. It also accounts for all of the largest high conviction positions in the sector, led by Templeton Developing Market Trust on 11.3%. Three other stocks are held by more than a fifth of managers, with MediaTek Inc far more widely held than Silergy Corp and United Microelectronics.
Changes in stock ownership over the last 6-months reflect the overall reduction in exposure among EM managers. Closures dominate new positions, with -4.49% of managers closing exposure to Silergy Corp and 3.75% to ChipMOS Technologies. On the positive side, ASE Technology Holding Co. saw ownership levels rise, aided by SEB Emerging Marketsfond new position of 1.26%
Conclusions & Data Report
Taiwanese Semiconductors remain a core holding among active EM equity funds. Average weights sit towards the higher-end of the 10-year range at 7.1%, with the majority of funds (92.9%) holding some exposure to the industry group.
However, it’s hard to ignore the obvious signs of a turn in sentiment. Allocations are well off the highs of 2021 as more funds scale back holdings and many move to an underweight stance. The chart to the right shows the time-series of average fund weights relative to benchmark for all Style groups. It highlights that the initial decline was led by Value investors, who have moved from near equal weight in early 2020 to -1.95% underweight today. Other Style groups have since followed suit, with all now positioned underweight the iShares MSCI Emerging Markets ETF on average.
There is a lot at stake here, with Taiwanese Semiconductors the largest country/industry allocation for 61% of the managers in our analysis and a top 3 allocation for 78%. Managers are banking on strong returns, but are becoming less confident on outperformance.
Please click on the link below for an extended data report on the Taiwan Semiconductor Industry Group among EM active equity funds. Scroll down for ownership profiles on TSMC and Silergy Corp and for more analysis on GEM fund positioning.
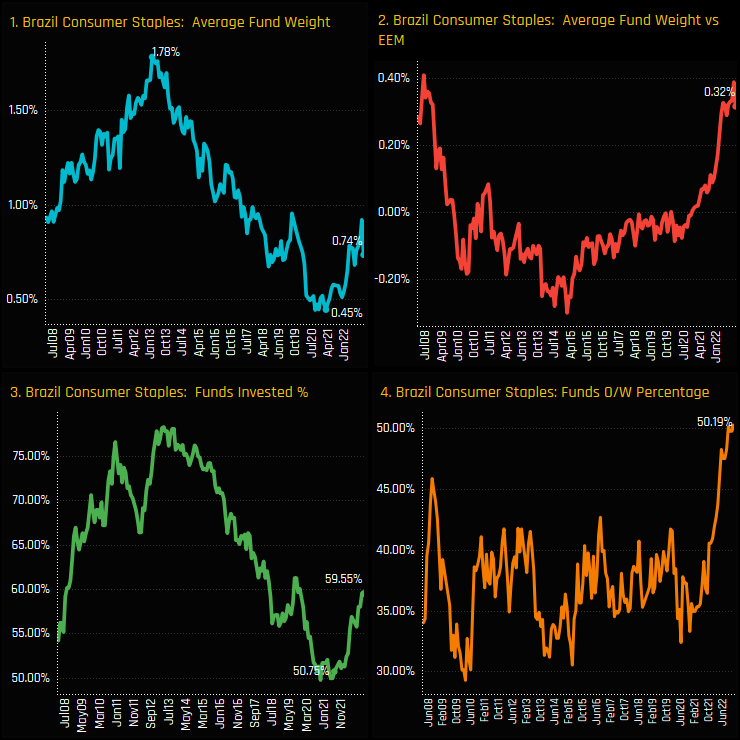
Fund positioning in Brazilian Consumer Staples continues its grind higher. After falling from a high of 1.79% in January 2013 to a low of 0.45% in February 2021, active EM managers have started to re-engage with the sector. Average weights have moved higher to 0.74%, the percentage of funds invested has risen from a low of 50.7% to 59.5%. Versus the iShares MSCI EM ETF benchmark, the percentage of funds positioned overweight has surged higher to a record 50.2%, pushing the net overweight to 0.32%.
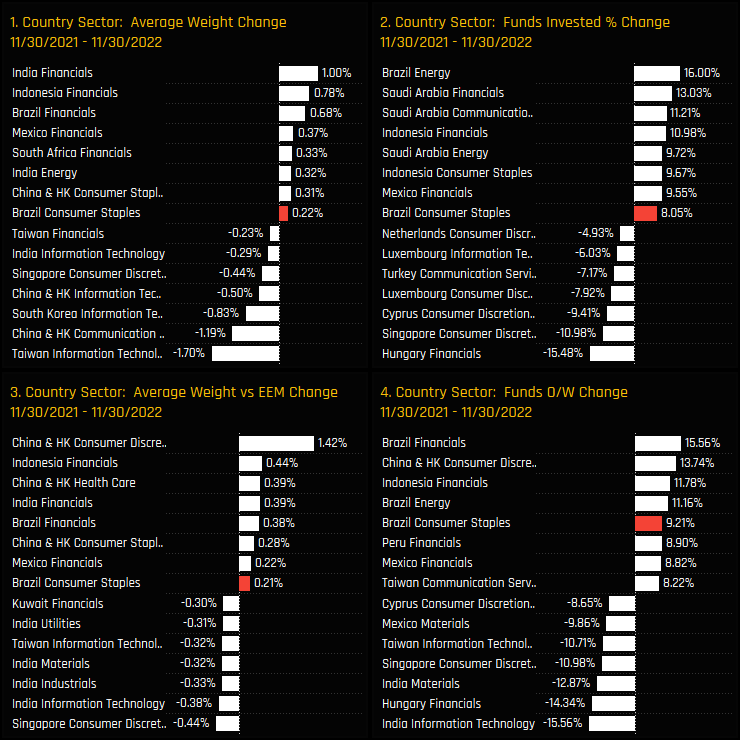
The charts below show the change in Country/Sector ownership over the last 12 months. Brazilian Consumer Staples are part of a selected group of sectors that have benefitted from a rotation away from key markets in China and the Technology sector. All our measures of fund ownership have moved higher over the period, with average weights increasing by +0.22%, overweights by 0.21%, funds invested by 8.05% and funds overweight by 9.2%. EM active managers are purposefully increasing exposure.
Fund Activity, Style & Positioning
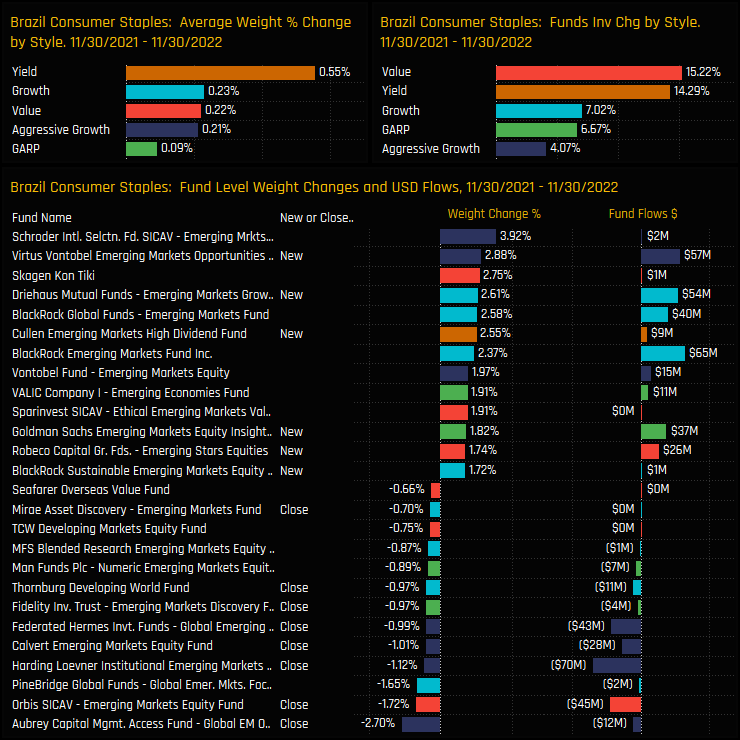
On a Fund Style basis, these increases were led by Value and Yield managers, with the percentage of funds invested rising by 15.2% and 14.3% respectively over the last year. However, all Style groups increased exposure, with the largest increases seen in the Aggressive Growth space, led by a +3.92% weight increase by Schroders EM Impact and a new position of +2.88% by Virtus Vontobel EM Opportunities. It wasn’t all 1-way traffic, but positive activity dominated, with 35 funds opening new positions versus 14 closing.
Of the 59% of managers who are exposed to the Brazilian Consumer Staples sector, most hold less than a 2% weight, however the long right-sided tail to the distribution speaks of higher conviction among selected managers. The largest holders are the Value strategies of Skagen Kon Tiki (5.9%) and Sparinvest Ethical Emerging Markets Value (4.15%). On average, Yield and Value managers are better allocated than then their Growth/GARP peers.
Stock Holdings & Activity
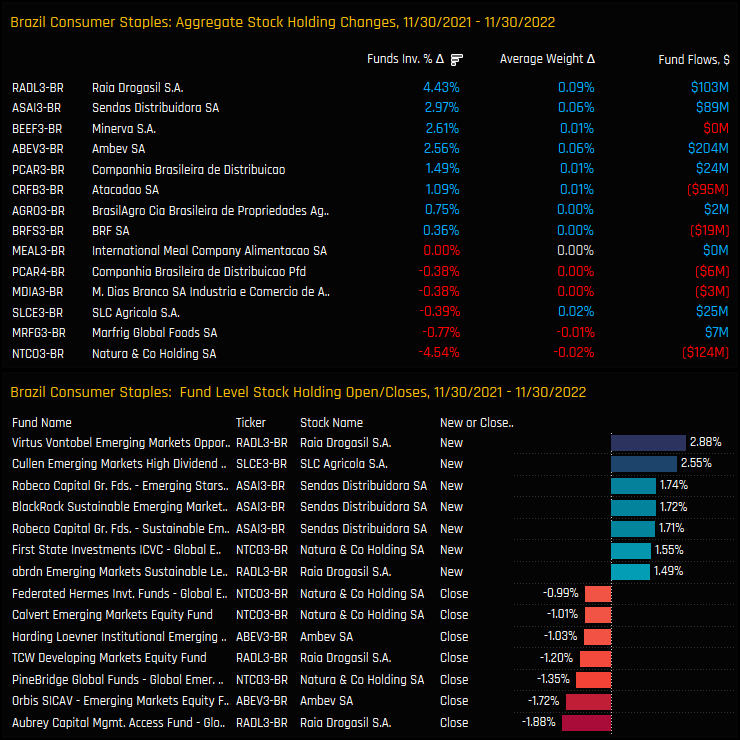
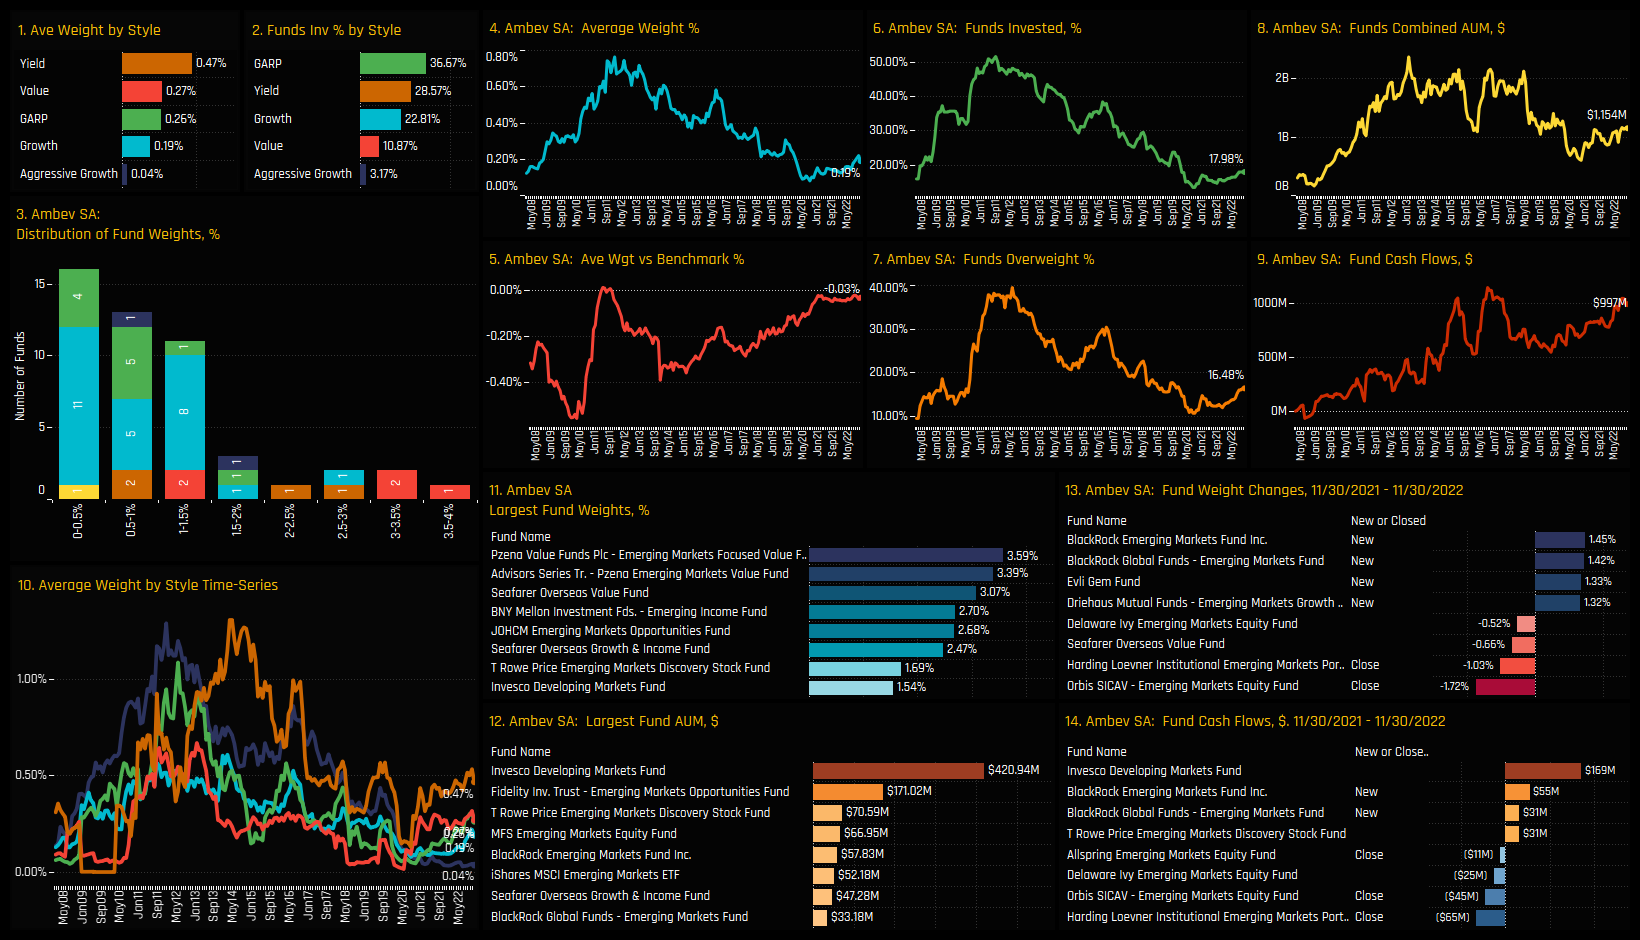
On a stock level, Raia Drogasil and Ambev SA are the most widely held stocks, owned by 21% and 18% of managers, with the former a key overweight in the sector. Both stocks occupy the majority of the high conviction holdings in the bottom chart, though Sendos Distribuidora positions from Skagen Kon Tiki and Sparinvest Ethical Emerging Markets Value stand out.
Over the last 12-months, Raia Drogasil captured the largest increase in exposure, with the percentage of funds increasing by 4.4% following $103m of fund inflows. Sendos Distribuidora, Minervo SA and Ambev SA also saw ownership levels increase, whilst Natura & Co Holding SA was the only stock to see a meaningful drop over the period.
Stock Holdings by Style
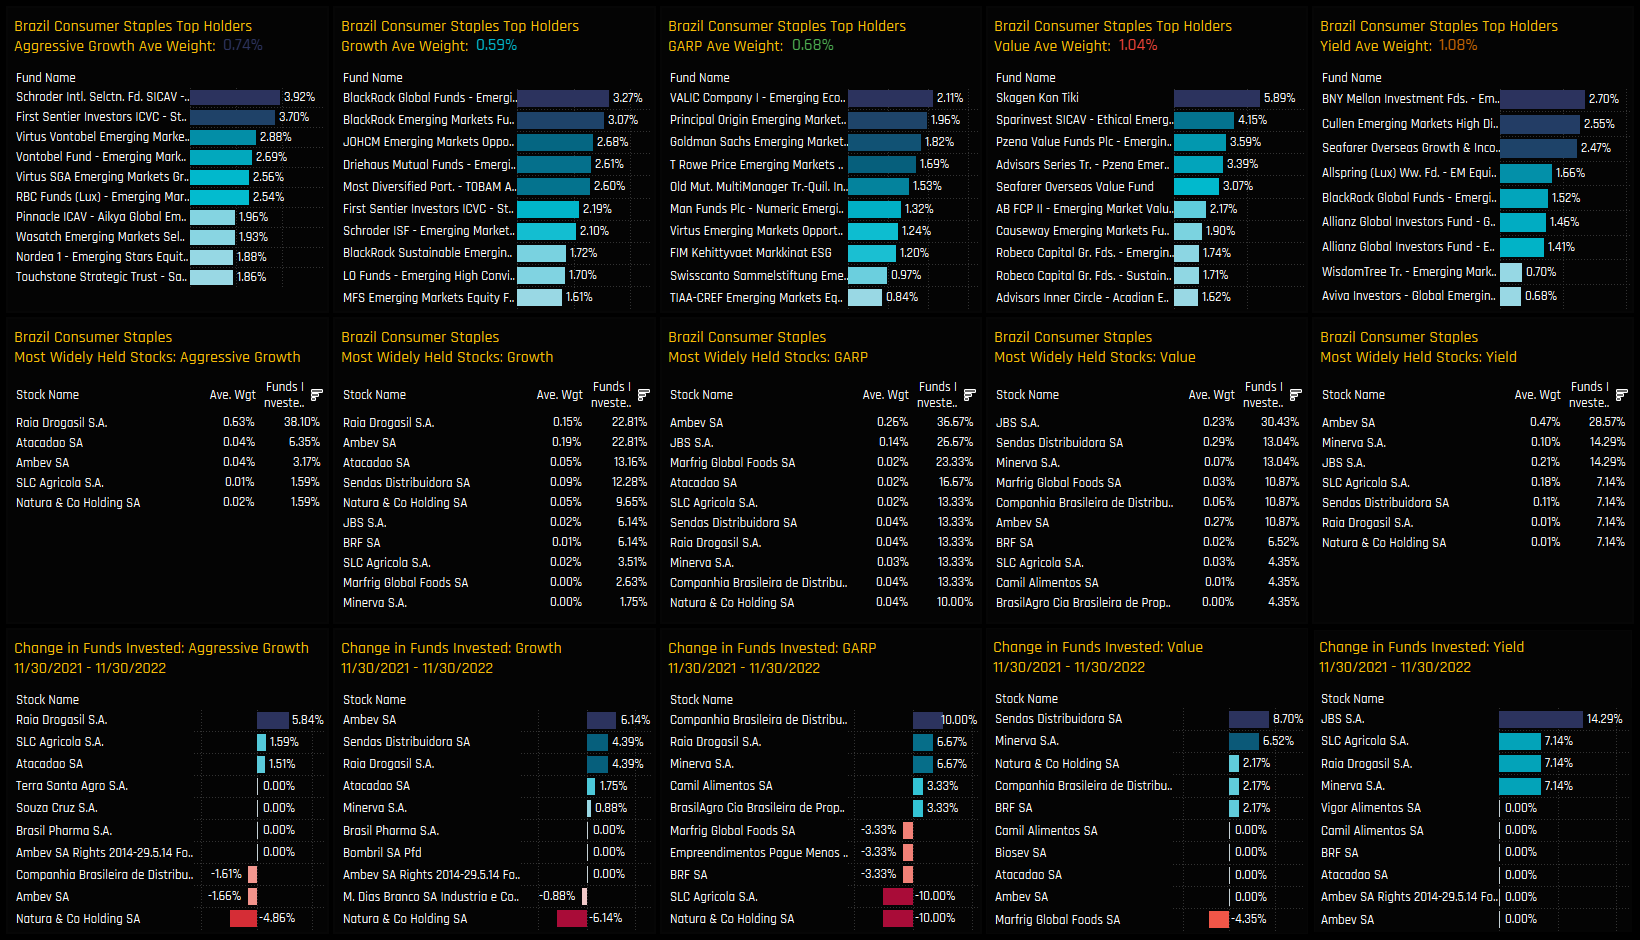
The fact that both Aggressive Growth and Value/Yield managers have increases holdings can be explained in their different approach to stock exposure. Aggressive Growth managers are almost exclusively invested in Raia Drogasil, with 38% of funds invested, whilst Value managers prefer JBS SA and Yield managers Ambev SA.
Conclusions & Data Report
The bear market in Brazilian Consumer Staples positioning is over. Spanning a lengthy 8 years, managers finally reversed course in early 2021 and have been raising allocations ever since.
Just over half the managers in our analysis are now positioned overweight the sector, with a net 8% opening positions over the last 12-months. Its positive stuff, but in reality allocations are still low compared to other sectors, with most opting for a sub-2% weight and 40% of funds not invested at all.
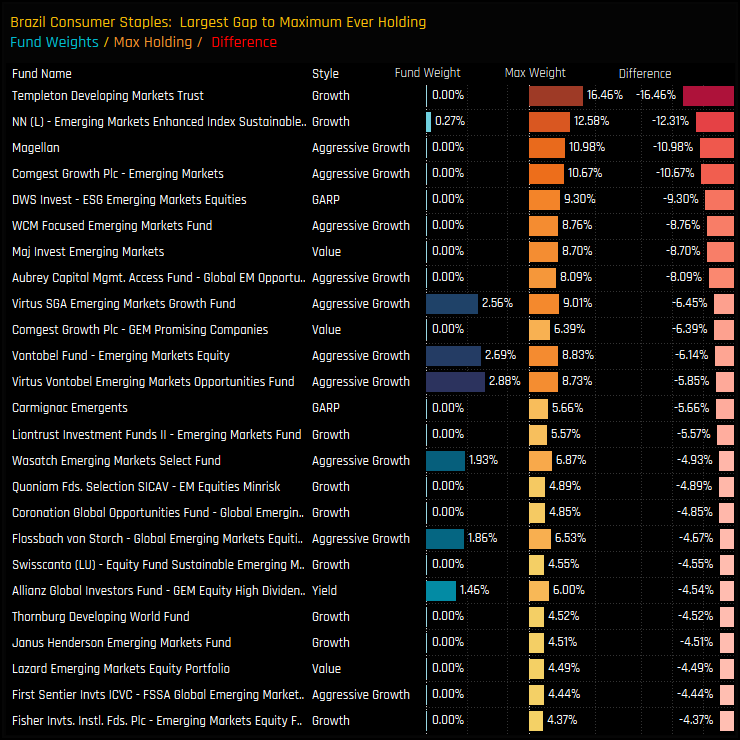
There is of course a precedent for Brazilian Consumer Staples allocations to be much higher than they are now. Funds such as Templeton and Magellen have previously allocated over 10% to the sector but hold almost nothing today. But this was in a different era, one where Asia wasn’t the dominant force in EM portfolios that it is now. Whilst we might not expect a return to the highs of 2013, current positioning levels leave plenty of room for the rotation to continue.
Please click on the link below for an extended data report on the Brazlian Consumer Staples sector among active EM equity funds. Scroll down for ownership profiles on Raia Drogasil and Ambev SA, and for more analysis on EM fund positioning.
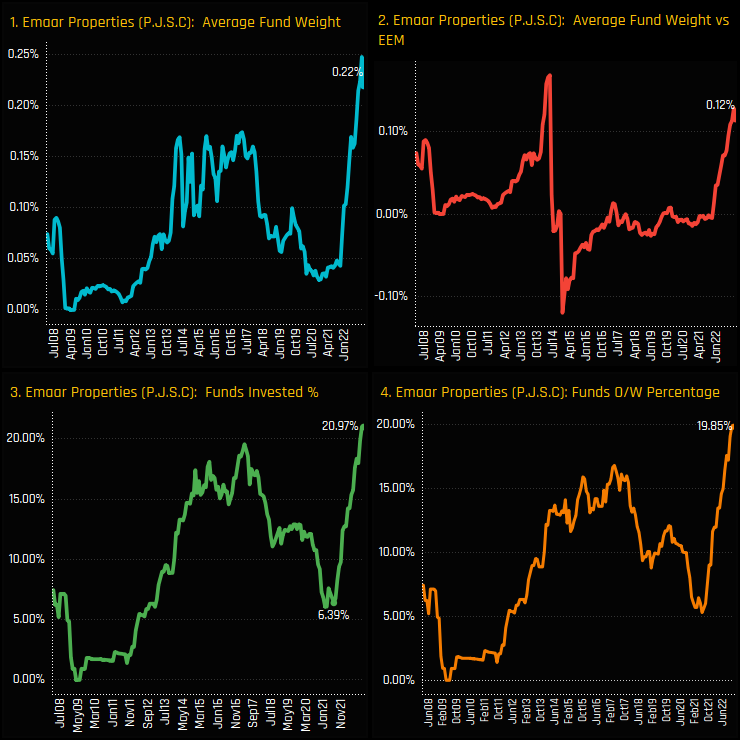
Emaar Properties has seen a big surge in ownership among EM active managers. The percentage of EM funds invested in Emaar Properties has risen from 6.4% in June 2021 to a record 21% today with average fund weights screaming higher to 0.22%. Versus the benchmark, a record 19.9% of managers are overweight the benchmark iShares MSCI EM ETF, with today’s average weight representing an overweight of +0.12%.
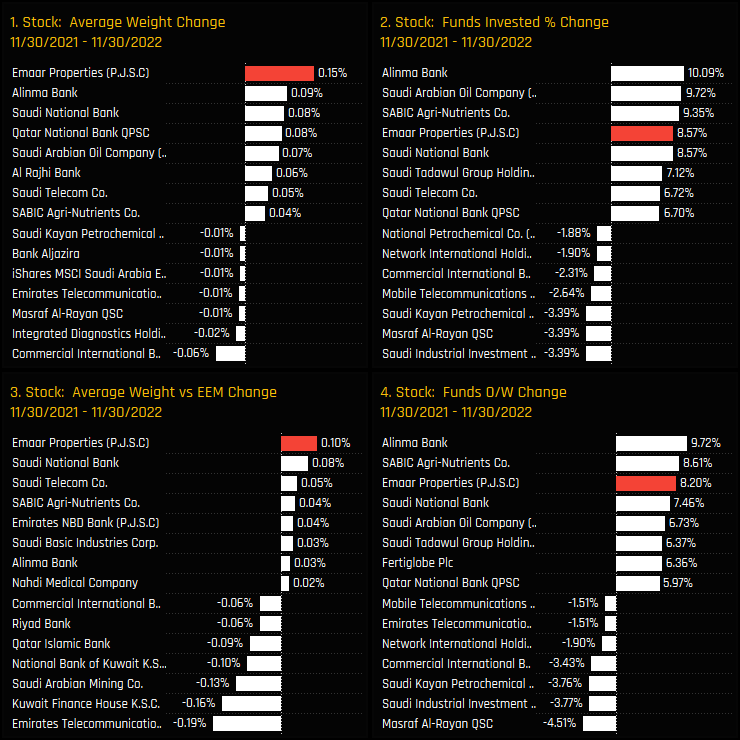
Emaar Properties has been one of the major drivers behind the increased exposure to the MENA region over the last 12-months. The below charts show 12 month ownership changes for MENA stocks across our 4 metrics, with Emaar Properties seeing the largest increase in average fund weight and the 4th largest increase in the percentage of funds invested. Sentiment has changed.
Fund Holdings & Activity
Over the last 12-months, ownership levels increased across the Style spectrum, with 10.8% of Value managers and 10.5% of Growth managers buying in to the name. Seafarer and TT International opened the largest new positions across each of their EM active strategies.
The majority of managers hold less than a 1% position in Emaar Properties, though the tail extends to 4.14% for the Redwheel Next Generation EM Equity Fund. Value managers are the larger allocators, with Aggressive Growth funds largely absent from the register.
Peer Group and Gap Analysis
This surge in positioning has pushed Emaar Properties to the top of the MENA stock ownership lists. Only Saudi National Bank is owned by more funds (21.35% vs 20.97%), with Emaar Properties the largest overweight (+0.12%) the largest average weight (0.22%) and with the most funds positioned overweight (19.85%). It is the poster child for a region in which we are seeing significant ownership growth.
Yet despite this record fund positioning, there are still plenty of funds with a previous history of ownership that are deciding to stay away. These include Templeton, Carmignac and William Blair who used to hold significant positions in Emaar. Their omission from the holdings picture maybe a marker that the investment case doesn’t quite stack up, but it also represents significant potential for ownership to move even higher from here.
Please click on the link below for an extended data report on Emaar Properties among active GEM equity funds. Scroll down for our final piece on GEM Fund positioning,
Our latest data on stock positioning and activity among active GEM Equity managers.
Most Widely Held Stocks
The 30 most widely held stocks among EM Active Funds
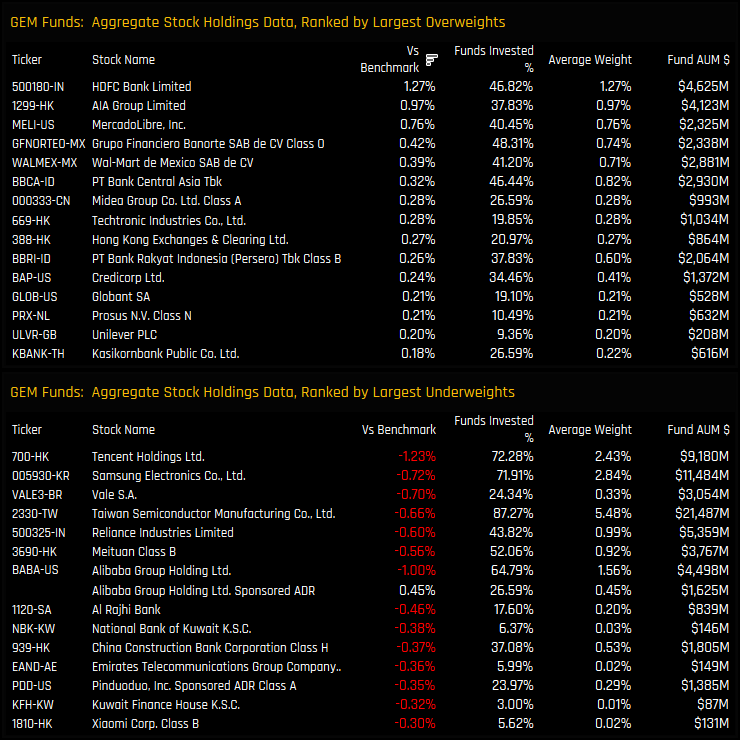
Top Over/Underweights
The top 15 aggregate overweight and underweight stock holdings
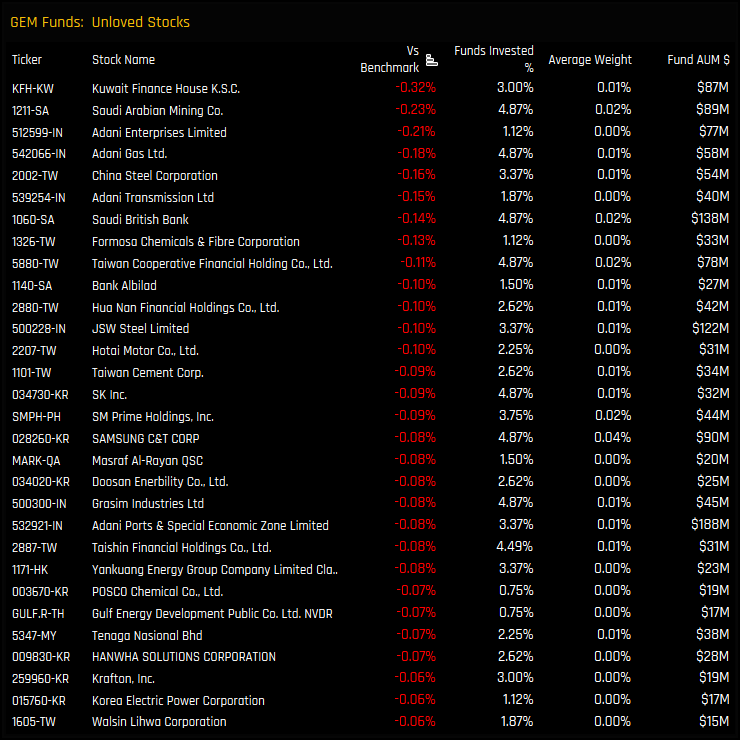
Unloved Stocks
Stocks held by less than 5% of the EM managers in our analysis, and net underweight vs the iShares MSCI EM ETF (EEM)
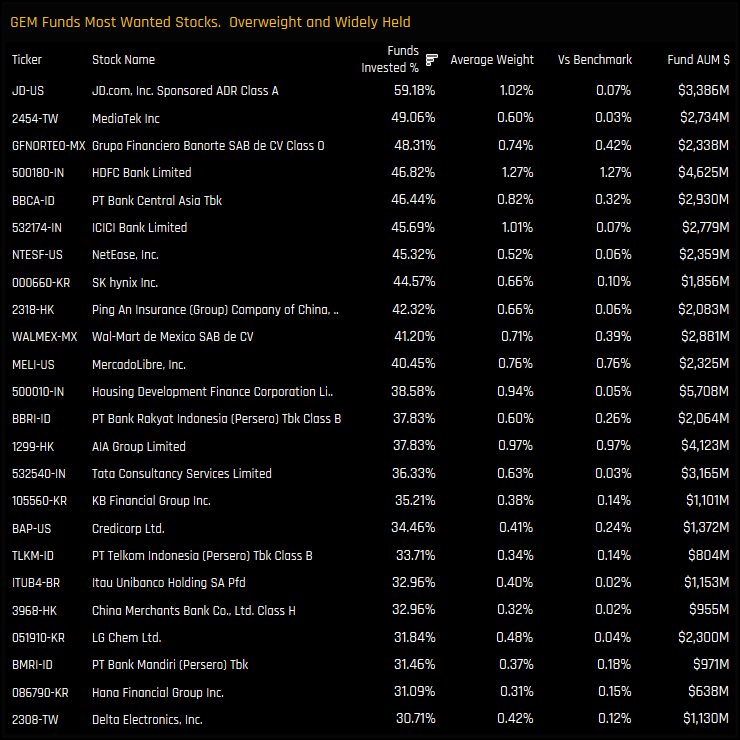
Most Wanted Stocks
Stocks held by more than 30% of the EM managers in our analysis, and net overweight vs the iShares MSCI EM ETF (EEM)
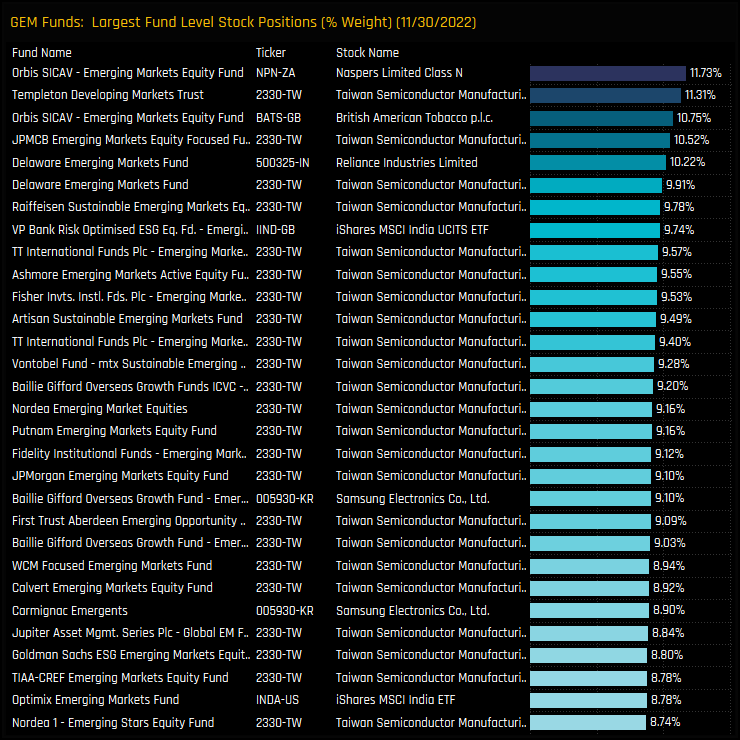
Largest Fund Level Stock Positions, %
The top 30 largest individual fund level stocks positions on a portfolio weight basis.
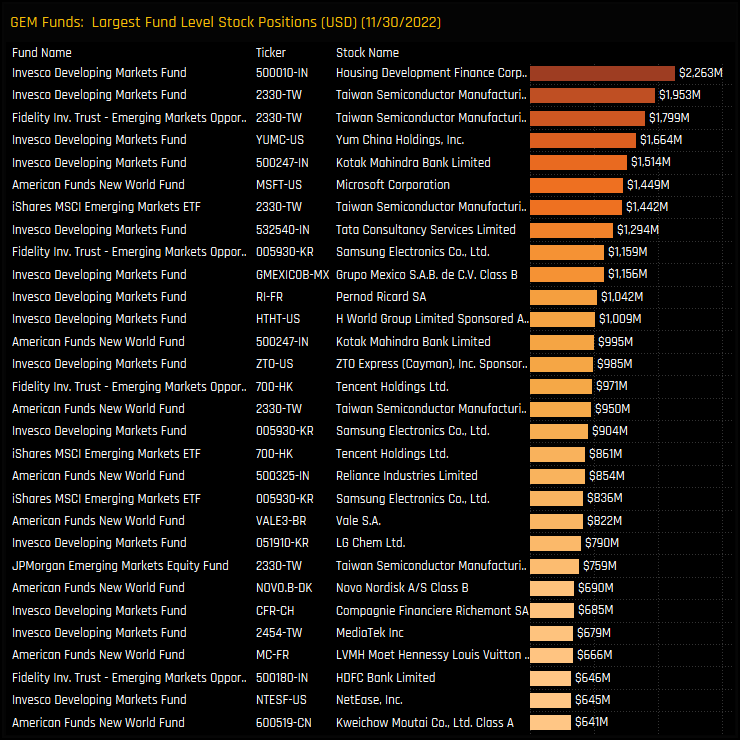
Largest Fund Level Stock Positions, $
The top 30 largest individual fund level stocks positions on a fund AUM basis.
Largest Ownership Increases
The stocks with the largest net increase in the percentage of funds invested between 05/31/2022 and 11/30/2022
Largest Ownership Decreases
The stocks with the largest net decrease in the percentage of funds invested between 05/31/2022 and 11/30/2022
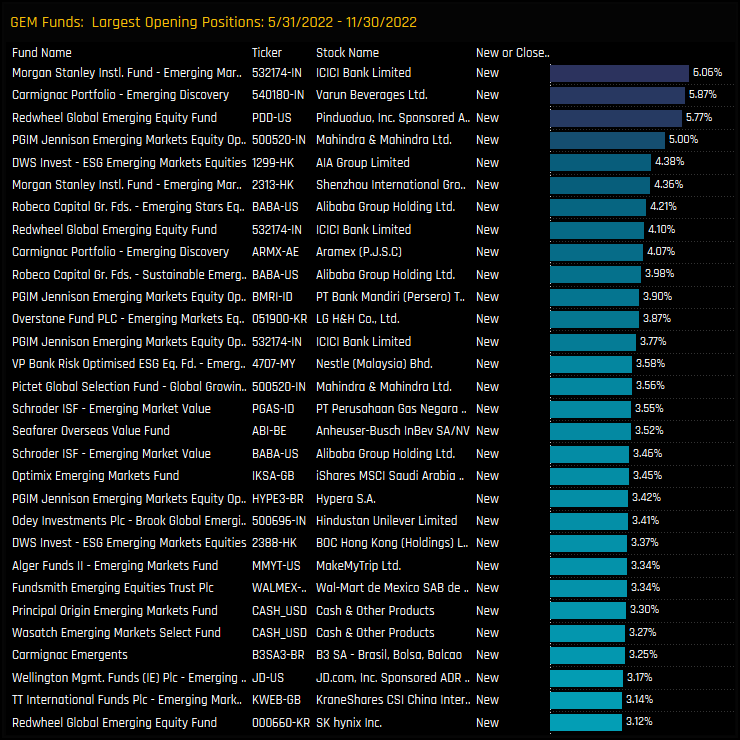
Largest Opening Positions
The largest opening stock positions between 05/31/2022 and 11/30/2022
Largest Closing Positions
The largest closing stock positions between 05/31/2022 and 11/30/2022
Largest Fund Level $ Stock Inflows
The largest fund level stock inflows between 05/31/2022 and 11/30/2022.
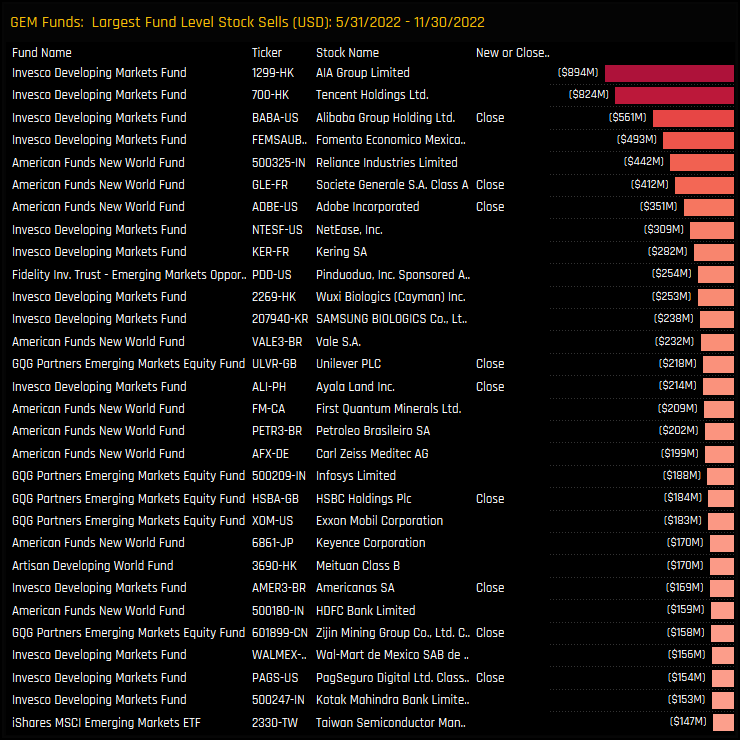
Largest Fund Level $ Stock Outflows
The largest fund level stock outflows between 05/31/2022 and 11/30/2022.
267 Active GEM Funds, AUM $337bn
GEM Active Fund Ownership Report
Please click on the link below for the full data report on EM active fund positioning
For more analysis, data or information on active investor positioning in your market, please get in touch with me on steven.holden@copleyfundresearch.com


