In this issue:
2023 Emerging Markets Positioning Update
Replacing Russia: EMEA Stock Screening
Alibaba Group Holdings: Staying the Course
270 emerging market Funds, AUM $330bn
2023 Emerging Markets Positioning Update
In this report, we look at the latest allocations among the 270 active funds in our analysis across regions, countries, sectors and country sectors. We look at average holdings, weights relative to benchmark and the key changes that occurred through 2022.
Regional Allocations
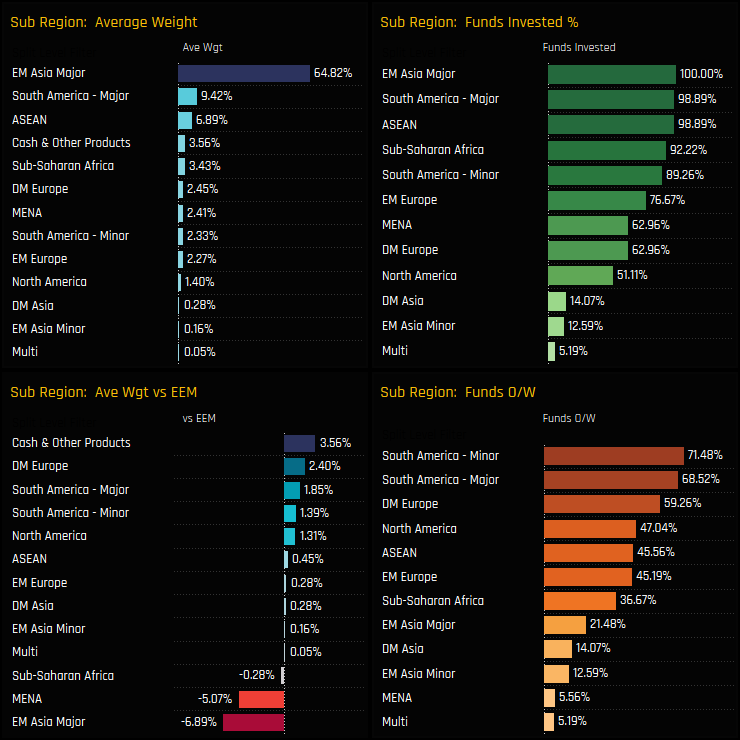
The major regional allocation splits are shown below. EM Asia Major, comprising the big four of China & HK, India, South Korea, and Taiwan, make up 64.8% of the average active GEM fund. The 2nd tier belongs to South America Majors (Brazil & Mexico) and then the ASEAN region. Versus the iShares MSCI Emerging Market ETF Benchmark (EEM), active EM managers are running 2 key underweights as we start the year. Firstly in the combined ‘Big 4’, with net positioning -6.7% lower than the benchmark and secondly in MENA at -5.07% lower. These are offset by Cash holdings, overweights in non-Benchmark DM Europe and across the South American regions.
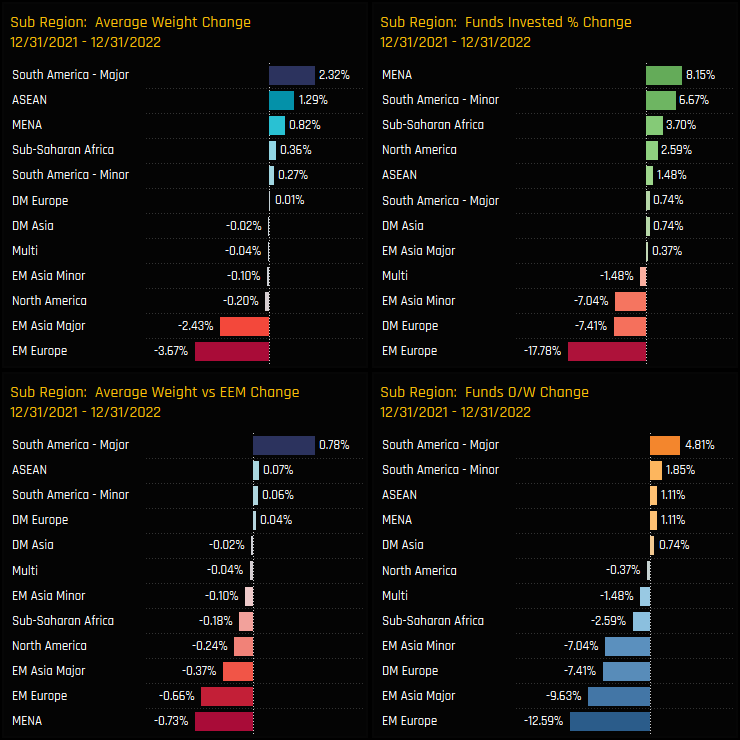
Over the course of 2022, the demise of Russia played a key part in a significant re-allocation of regional exposures. All Russian holdings have now been marked to zero in our analysis, though we accept that there may be exposure lying dormant. On this basis, Russia was the driver behind a massive drop in EM European exposure, with 17.8% of funds cutting exposure entirely and a further 12.6% moving to underweight – Russia was a key holding and key overweight before the Ukraine invasion. The beneficiaries of this exodus were the MENA region, ASEAN and South America. EM Asia Major saw allocations fall, mainly driven by Taiwan and South Korea (more below).
MENA Focus
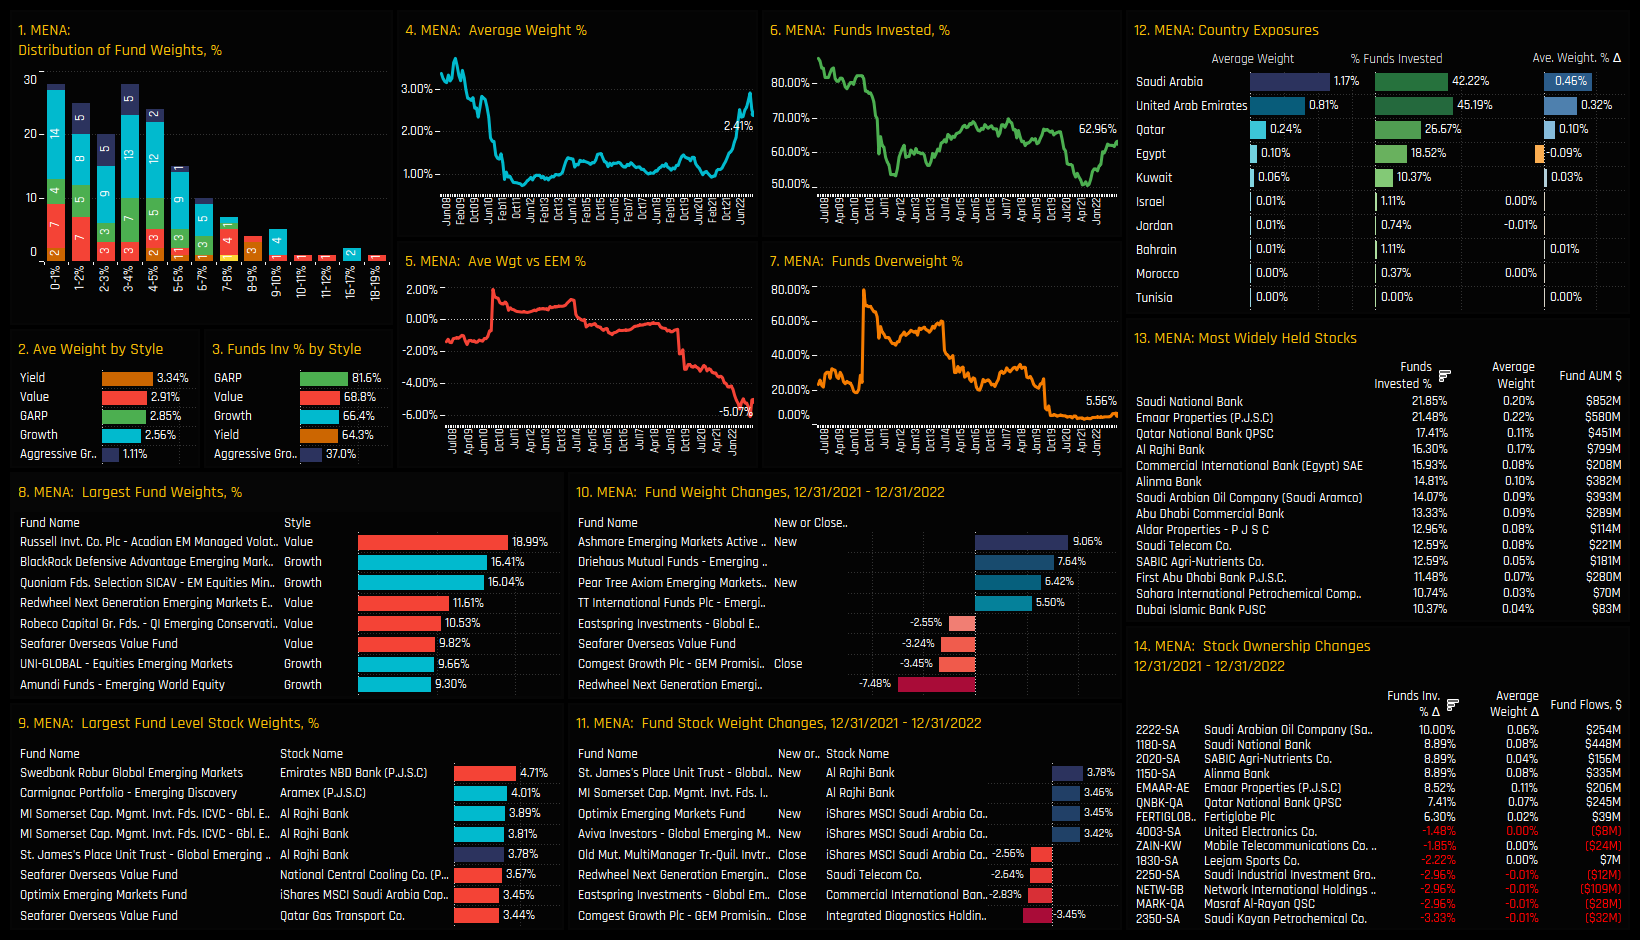
The increase in MENA exposure was from a place of severe underinvestment among active EM managers, specifically in Saudi Arabia where still less than 50% of managers have exposure. Increases in ownership throughout 2022 failed to keep pace with benchmark increases, leaving 95% of managers underweight the region as we start the year. Those that have exposure are grouped around the 0% – 5% level, with a tail to the upside topped by Acadian EM Managed Volatility on 18.99%.
Saudi Arabia and the United Arab Emirates were the key beneficiaries of flows in 2022, with average weights rising by 0.46% and 0.32% respectively. Winners on the stock side include Saudi Aramco and Saudi National Bank, attracting investment from a further 10% and 8.9% of EM funds respectively. This places Saudi National Bank as the most widely held name in the region, followed by Emaar Properties and Qatar National Bank.
South America Major Focus
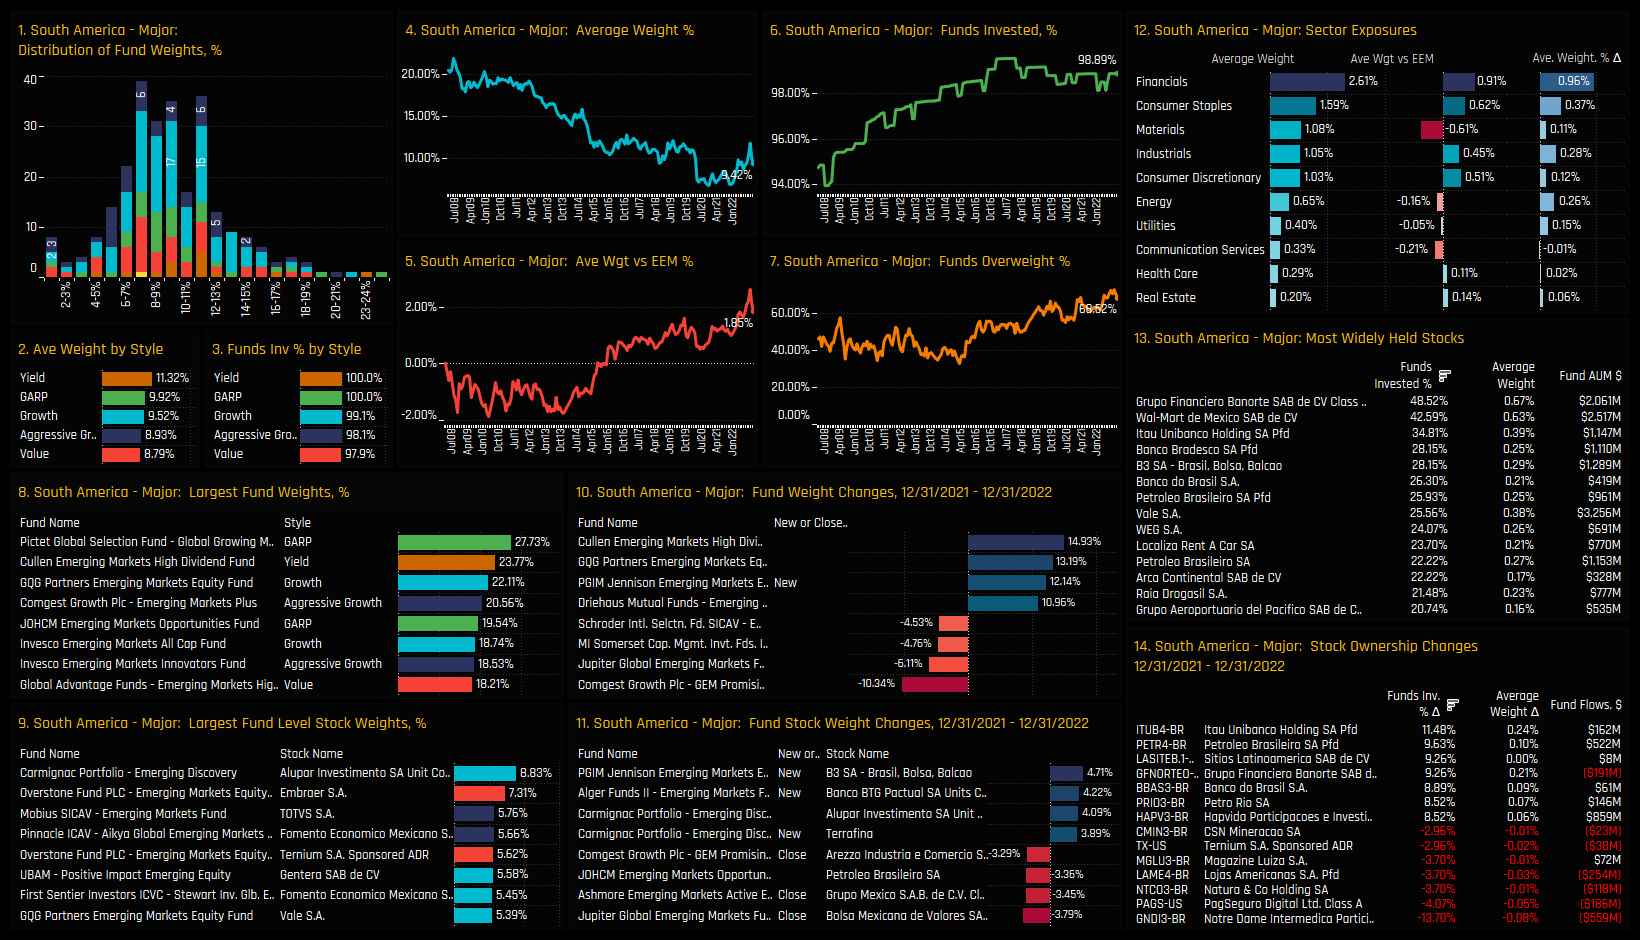
EM managers have increasing confidence that Brazil and Mexico will make an impact in 2023. Almost 70% of managers are now positioned overweight the 2 countries at a net +1.85% above benchmark. On an absolute basis weights are still down from the highs of 2008-2012 but they appear to be on an upward trajectory. The bulk of the fund holdings distribution sits at between 6% and 12%, with quite a narrow spread between the 5 Style groups, that is headed by Yield funds at 11.32%, on average.
On a sector basis, Financials and Consumer Staples are the key holdings and the largest overweights on average, and both were the drivers behind the moves higher in 2022. Managers remain underweight Materials, Communication Services and Energy. On a stock level, Grupo Financiero Banorte and Wal-Mart de Mexico are the most widely held names, followed by Itau Unibanco which saw large increases in ownership over the last 12-months.
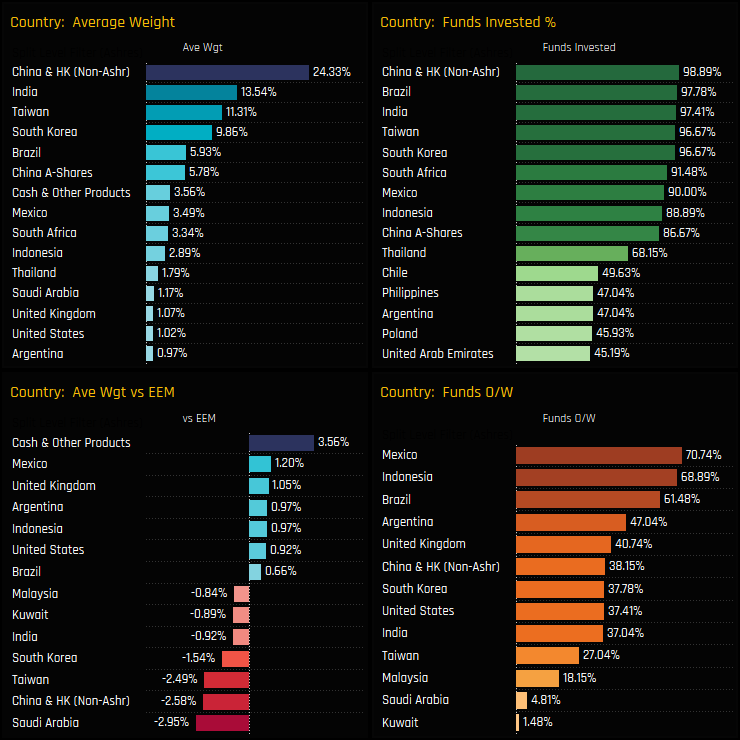
Country Positioning
On a country level, China & HK remains the dominant exposure by a decent margin. The combined weight of A-Shares and Non A-Shares comes in a just over 30%, with Non A-Shares a significant underweight for active EM managers at -2.58% below benchmark. Saudi Arabia, Taiwan and South Korea join the list of key underweight positions, which now includes India for the first time in over a decade. Both Mexico and Indonesia are the consensus overweights, held above benchmark by 70.7% and 68.9% of funds respectively.
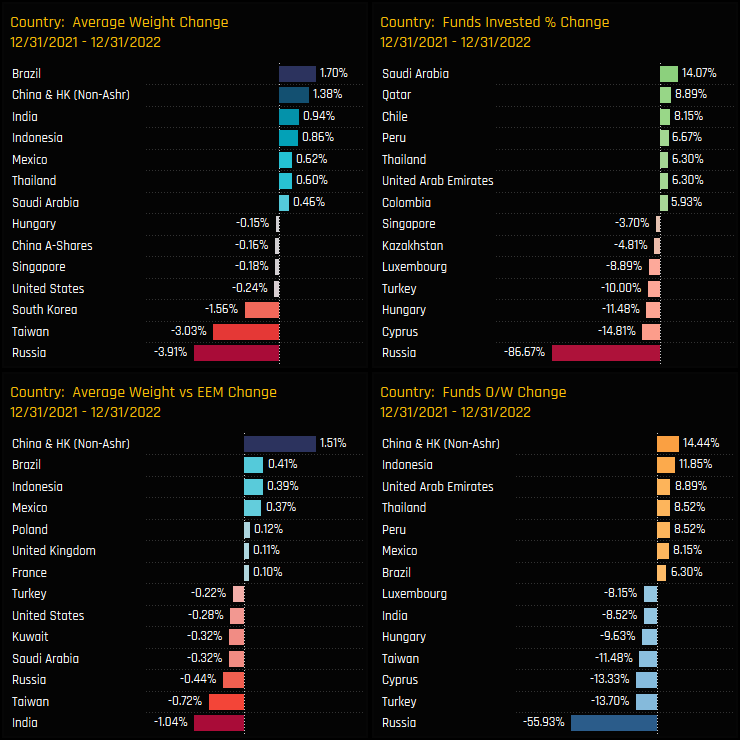
Country activity over the course of 2022 reflects Russia’s deletion from portfolios, with ownership growing in South America and selected MENA countries in its place. Non A-Share China & HK saw an ownership recovery as sentiment improved, with average weights increasing by +1.38% and 14.4% of managers switching to overweight. India weights moved higher on the year though managers sold in to strength, increasing underweights by -1.04%. Taiwan and South Korea lost ground, with managers actively decreasing exposure throughout the year.
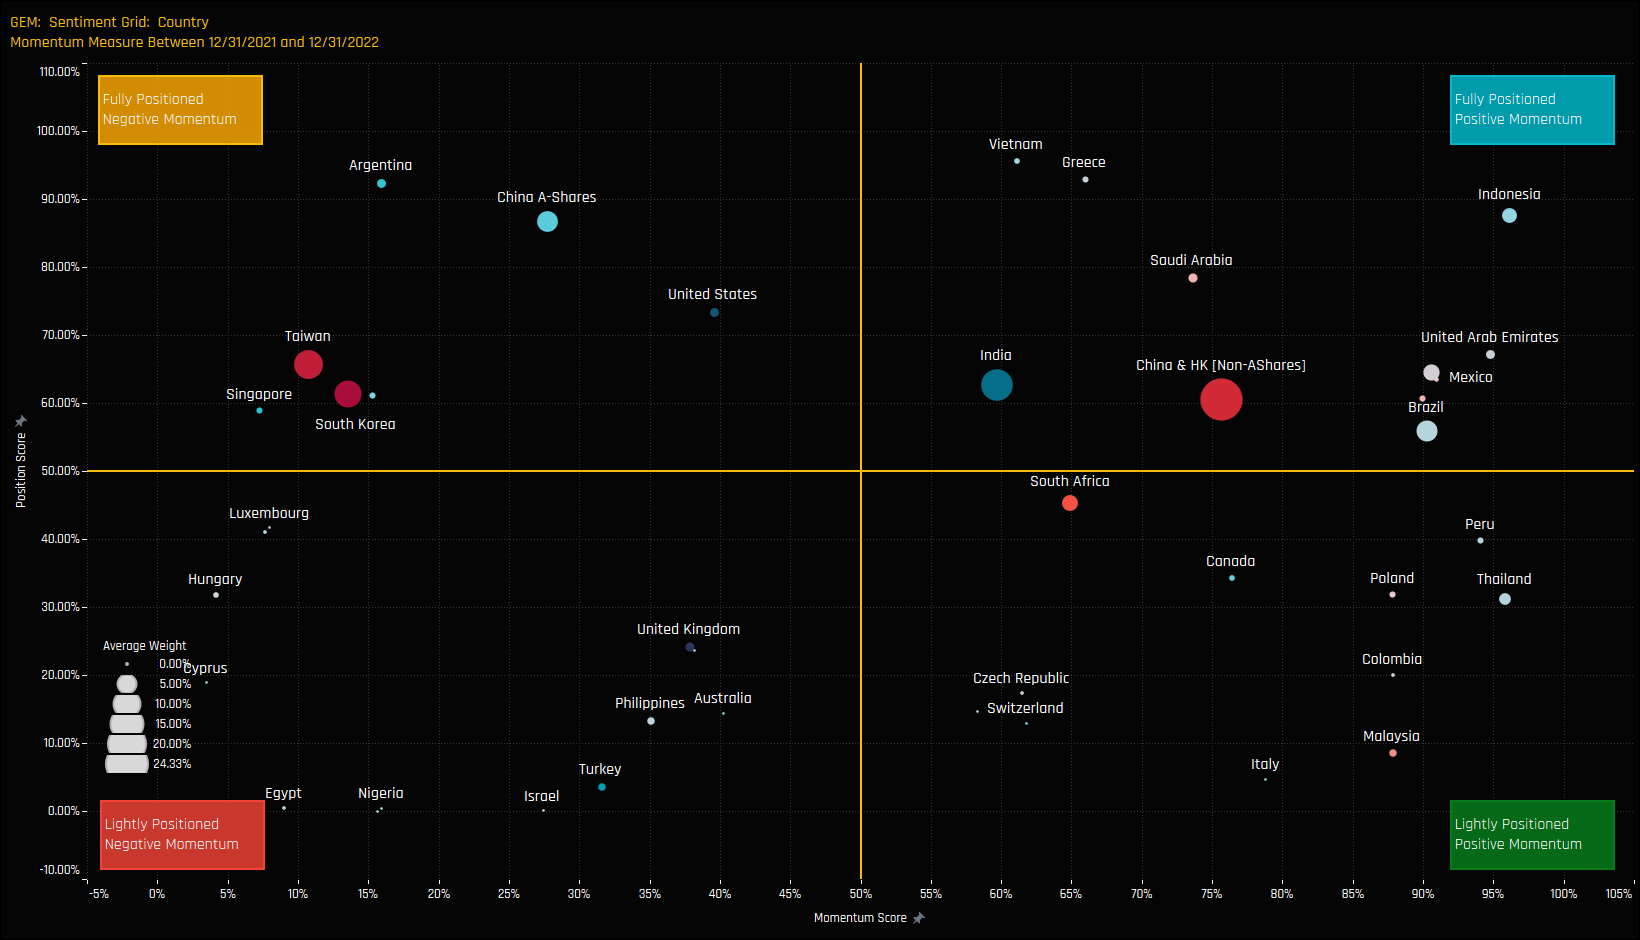
Country Sentiment
The sentiment grid below shows where current positioning in each country sits versus its own history going back to 2008 on a scale of 0-100% (y-axis), against a measure of fund activity for each country between 12/31/2021 and 12/31/2022 (x-axis).
The Grid shows Indonesia, Mexico and Brazil as key beneficiaries of the rotation last year, pushing ownership towards the higher end of their respective ranges. Taiwan and South Korean allocations continue to fall, though positioning sits just above the middle of the historical range. Ownership in some of the smaller ASEAN nations, together with Poland, Peru and Colombia benefited from inflows yet allocations sit at historically low levels.
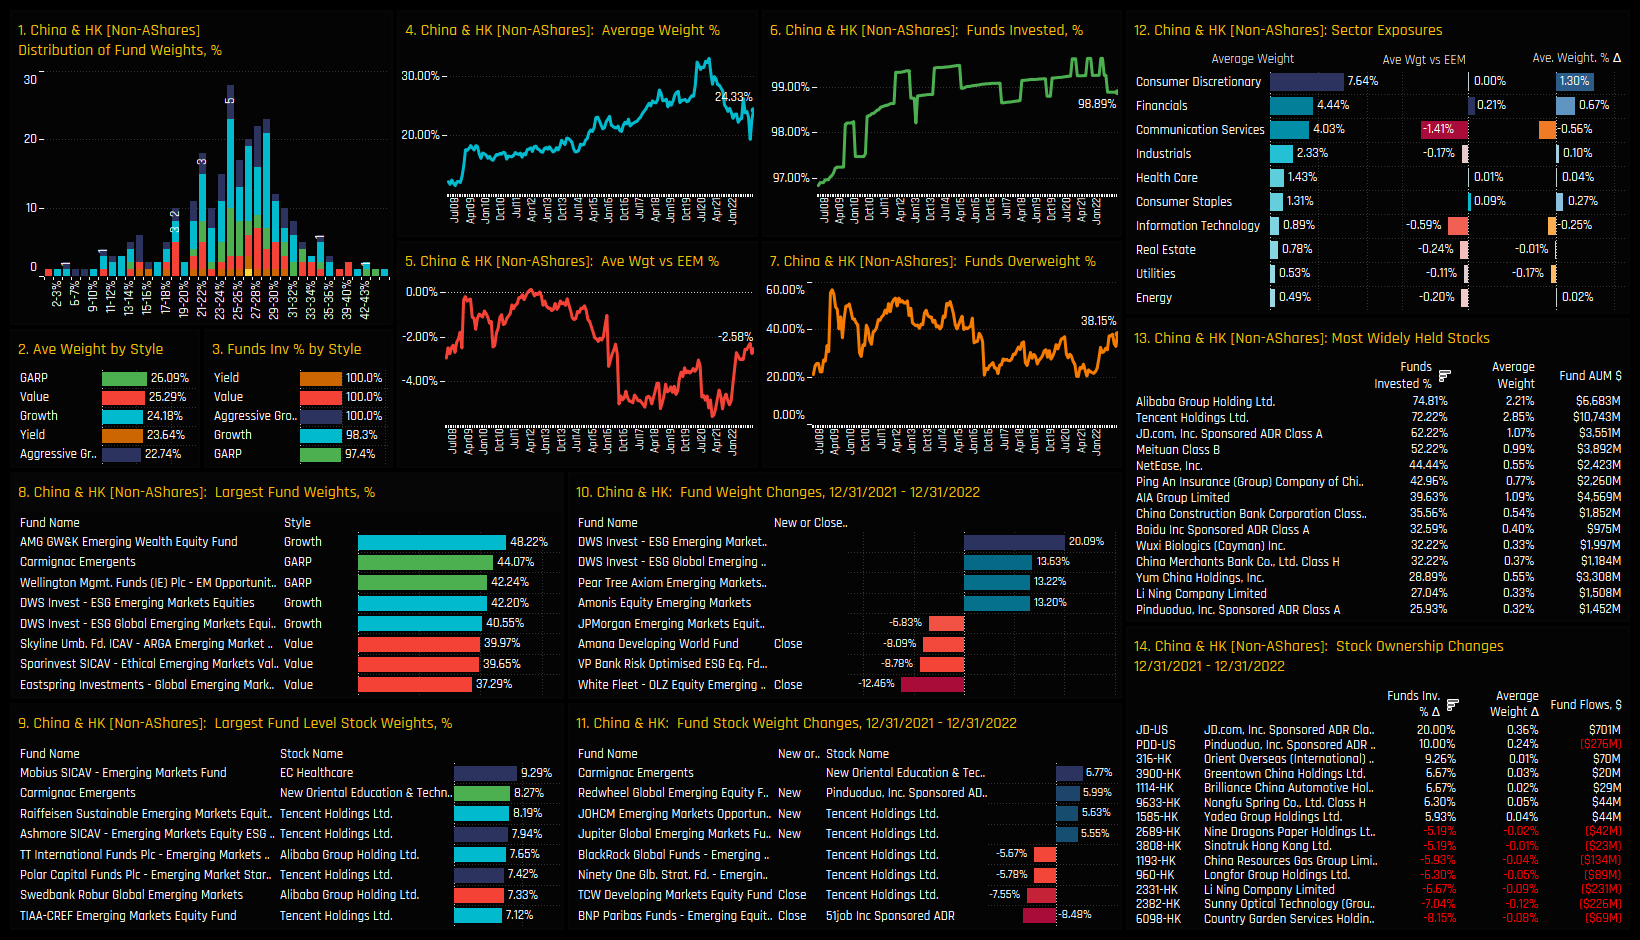
China & HK (non-A-Share) Focus
Non-domestic China & HK is where the volatility has been over the past 3-years, with A-Shares relatively benign in comparison. The ownership peak occurred in October 2020 with average weights at 33% and finally found a bottom towards the end of 2022 at 19.4%. Valuations are such that GARP and Value managers are running larger exposures than Growth and Aggressive Growth, with the holdings distribution centered between 20% – 30%.
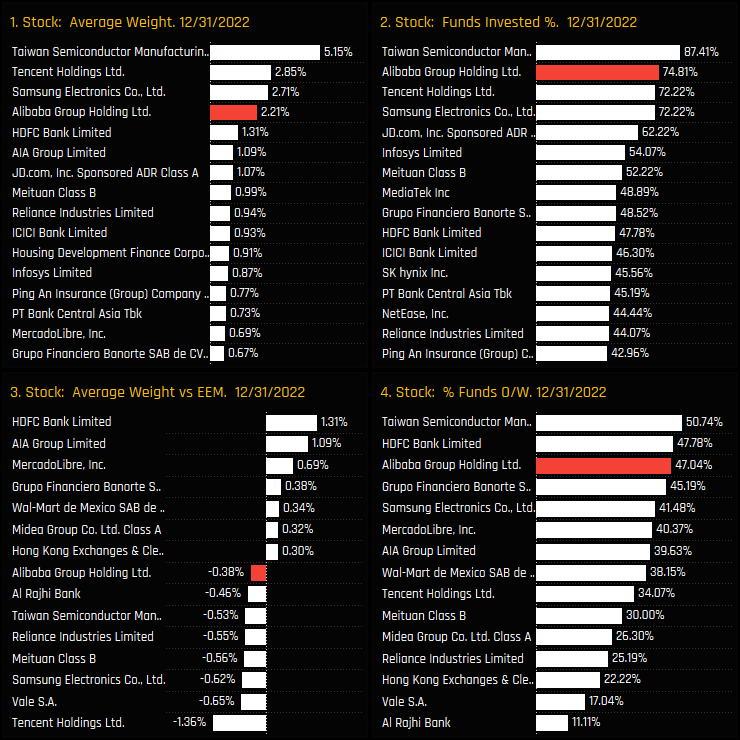
Consumer Discretionary, Financials and Communication Services are the key exposures, with the latter a key underweight vs the Benchmark. Alibaba Group and Tencent Holdings are the most widely held stocks, though both are being chased down by JD.Com which captured investment from a further 20% of the funds in our analysis over the course of 2022.
Sector Positioning
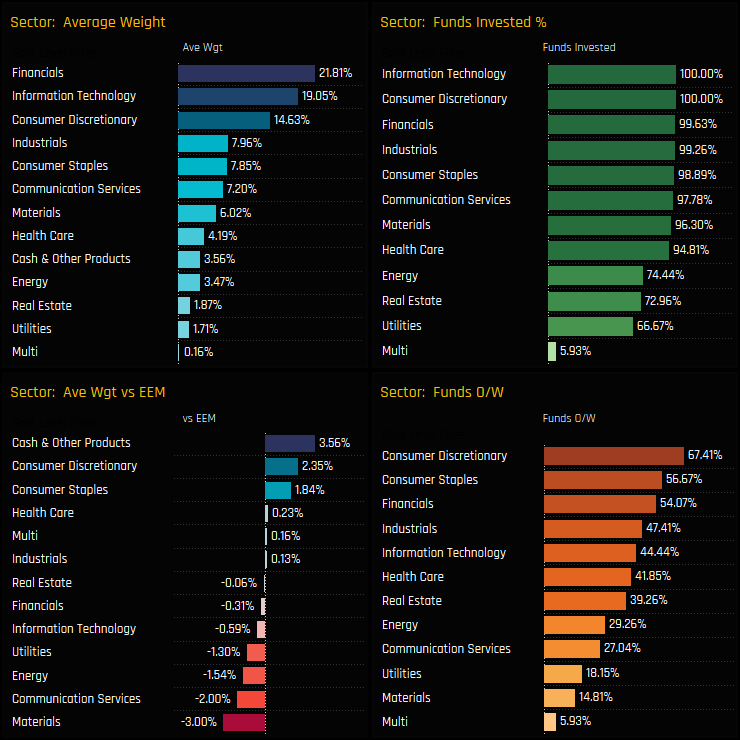
Financials overtook Technology as the largest sector allocation at the mid-point of 2022, regaining the top spot that it lost in early 2020. Consumer Staples and Discretionary are the only overweight sector positions, though a majority of funds are also overweight Financials. EM managers are running big underweights in Materials (-3%), Communication Services (-2%) and Energy (-1.54%).
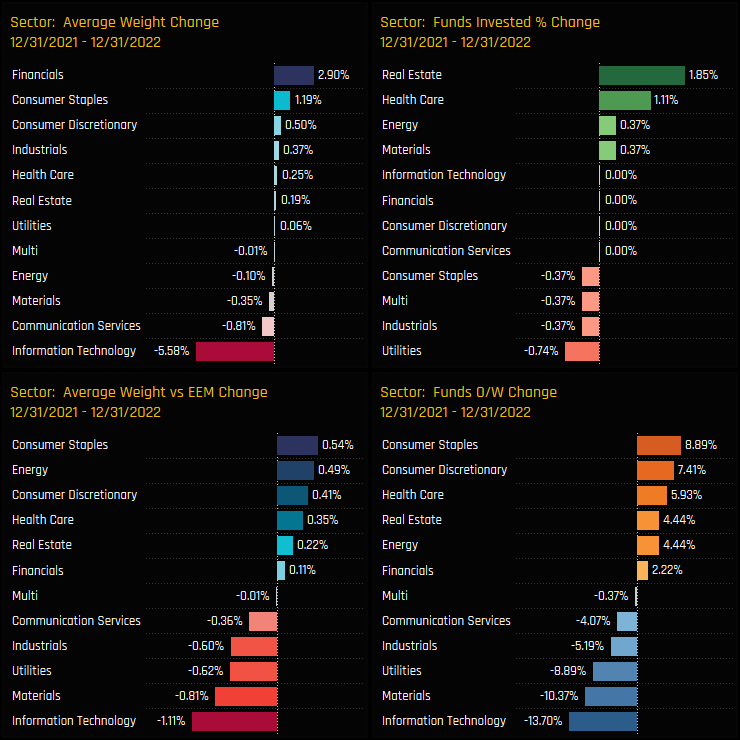
Activity over the last 12-months highlights the strong rotation out of Tech and in to Financials, with the Consumer sectors and Health Care benefitting to a smaller degree. This has been an active rotation, with 8.9% of managers switching to overweight in Consumer Staples, +7.4% in Discretionary, whilst 17.6% of funds moved to underweight in Tech. As a result, Technology weights fell by -5.6% on the year, with underweights increasing by -1.1%.
Sector Sentiment
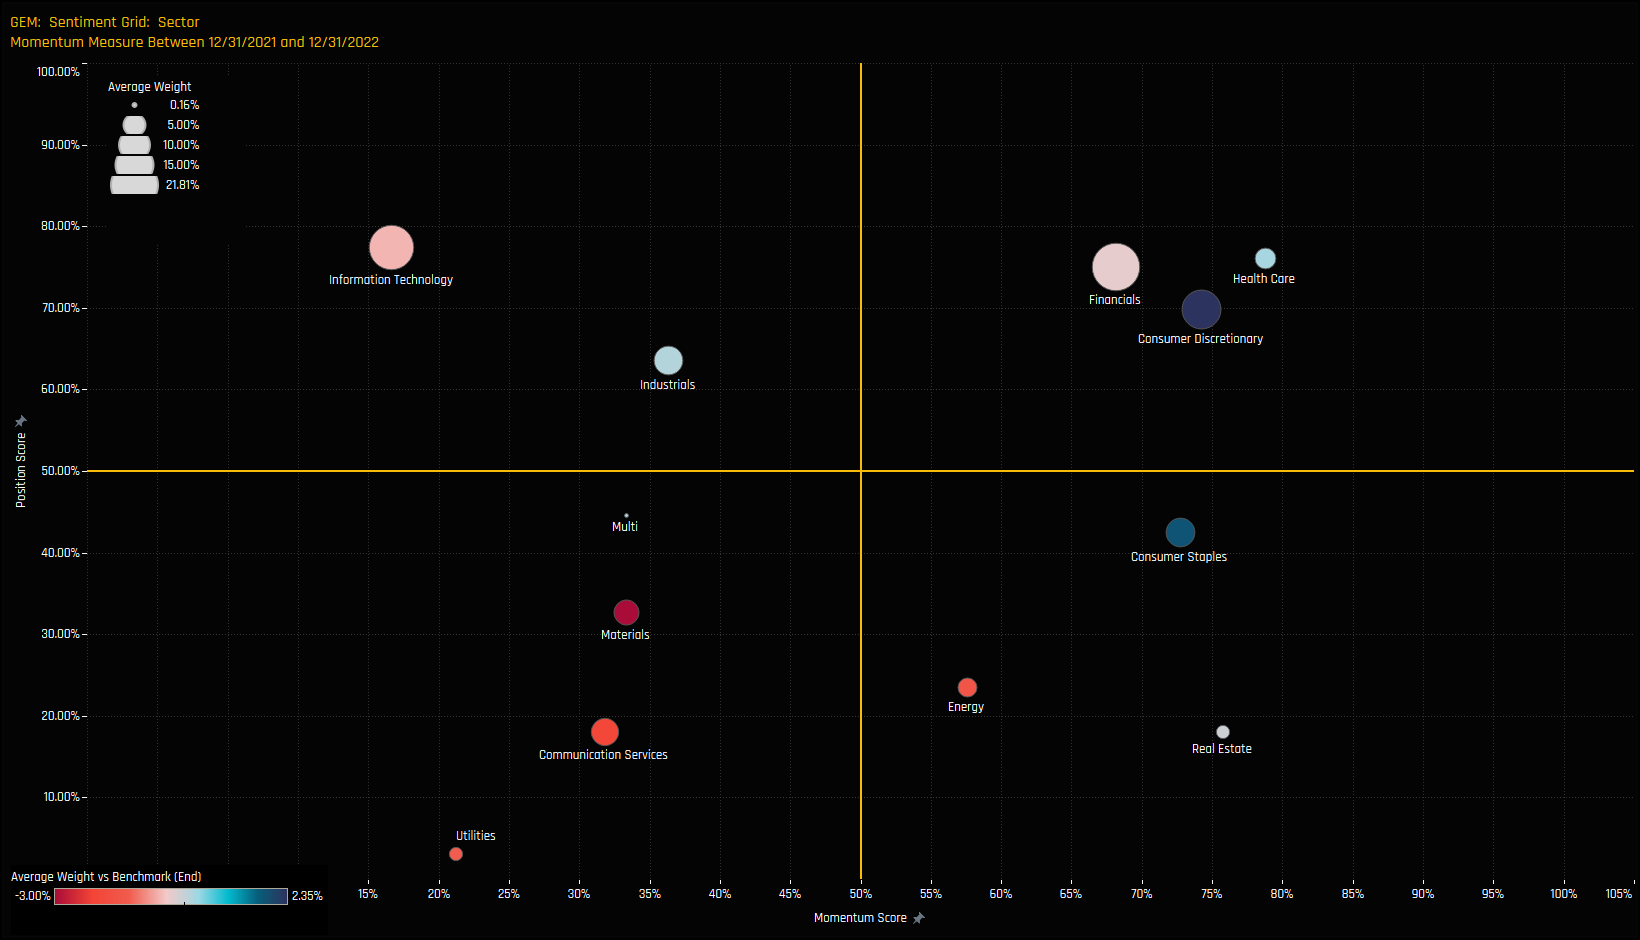
The sentiment grid below shows where current positioning in each sector sits versus its own history going back to 2008 on a scale of 0-100% (y-axis), against a measure of fund activity for each sector between 12/31/2021 and 12/31/2022 (x-axis).
The cluster of Financials, Discretionary and Health Care in the top-right quadrant reflects a confidence among managers to maintain high levels of positioning whilst continuing to raise investment. The opposite is true of Communication Services and Materials with positioning close to the lows, whilst Tech positioning remains high in the face of outward rotation.
Consumer Staples Focus
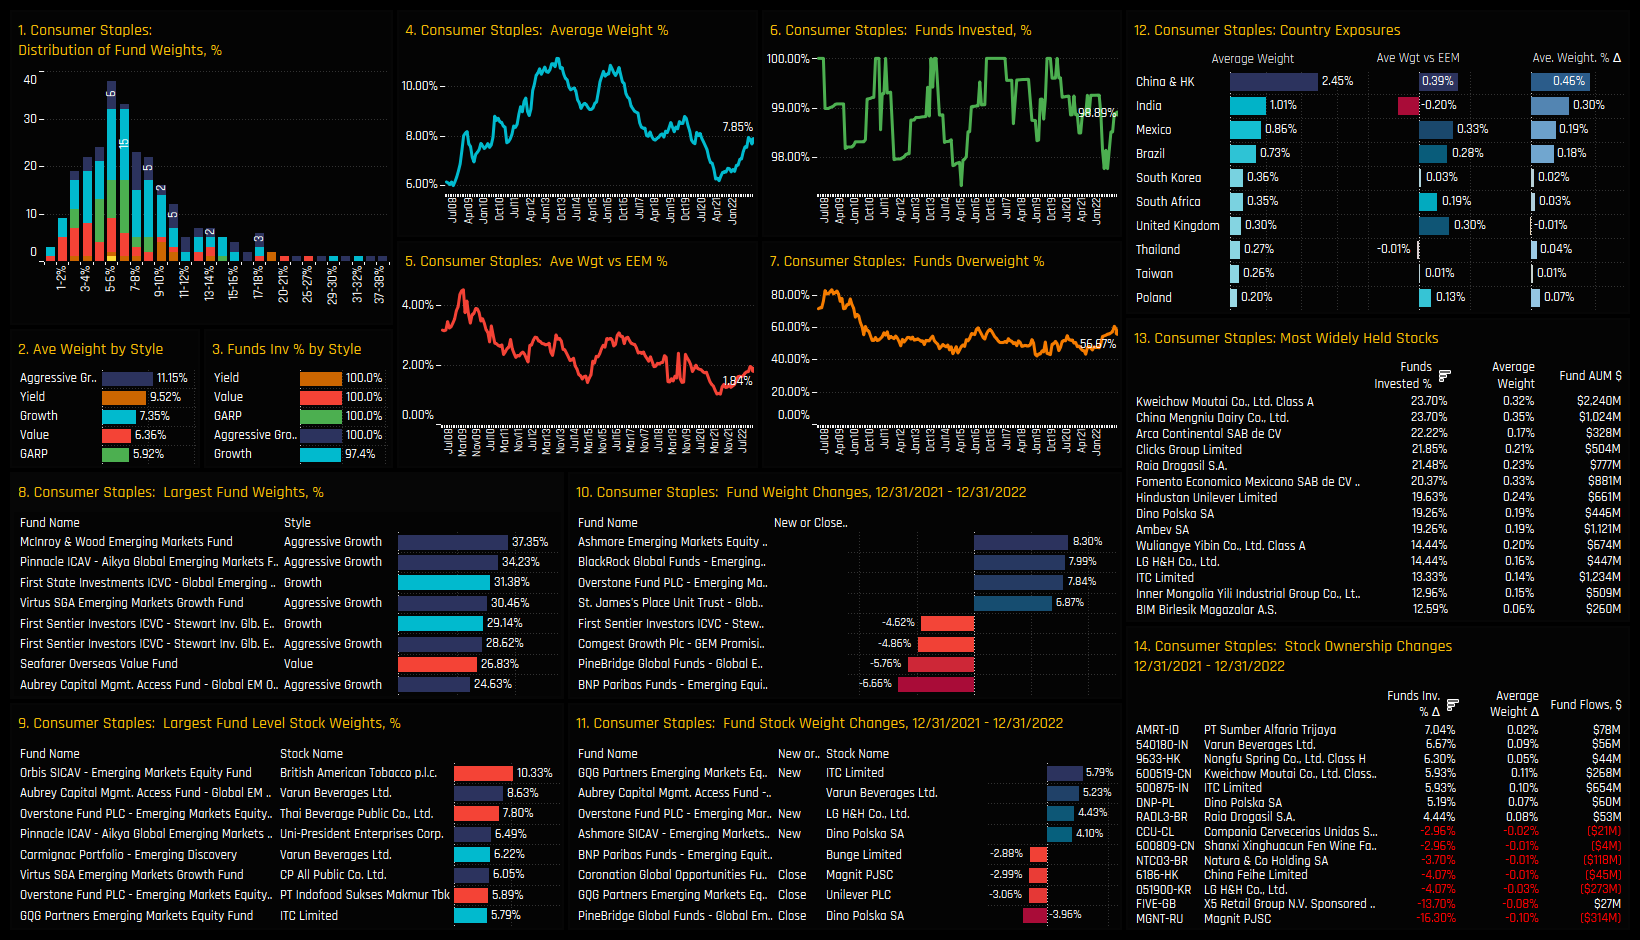
Despite being a persistent overweight among active EM managers, average fund weights in the Consumer Staples sector had been in decline for the best part of a decade. However, after bottoming out at 6% in late 2021 allocations are now on the rise. Average weights stand at 7.85%, still towards the lower end of the 15-year range but near the top of the 5-year. In truth, the average weight is skewed higher by a long tail that includes +30% allocations from McInray & Wood EM (37.4%) and Aikya Global EM (34.2%). The bulk of the holdings distribution is centered much lower at between 3% and 10%.
China & HK, India, Mexico and Brazil account for 64% of the total Consumer Staples allocation, with all but India held overweight versus the iShares MSCI EM ETF. Other overweights include South Africa and out-of-benchmark UK. No single stock is dominant, with a raft of companies held by around a 5th of managers, led by Kweichow Moutai and China Mengniu Dairy. Whilst the sector did suffer from the closing of Magnit and X5 exposures, these were compensated by increased positioning in PT Sumber Alfaria Trijaya, Varun Beverages and Nonfu Spring Co, among others.
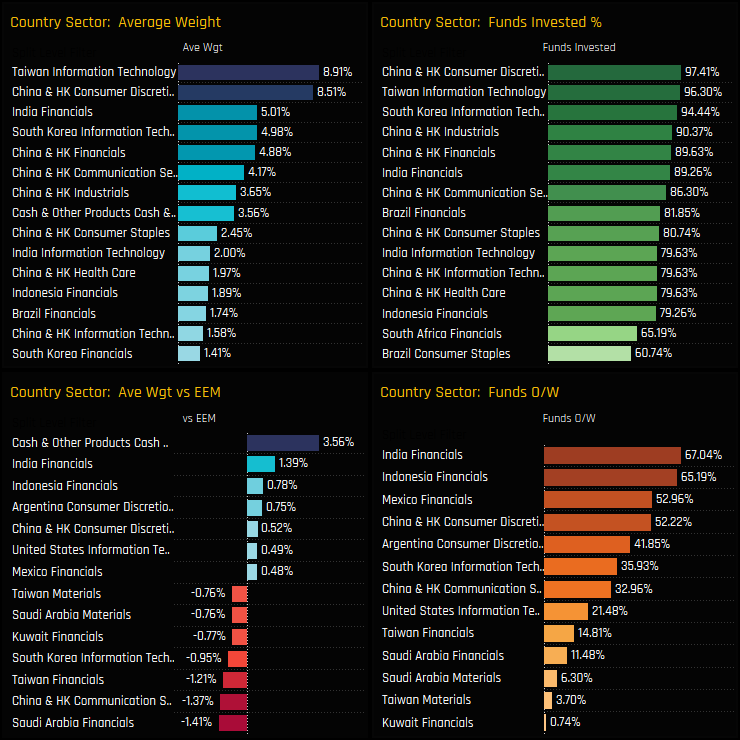
Country Sector Positioning
On a country/sector level, China & HK Consumer Discretionary and Taiwan Tech are the most widely held and largest allocations, accounting for a combined 17.4% of total GEM fund portfolio weights, on average. Relative to benchmark, they key differences are in the Financials country sectors. Active managers prefer to run overweights in India, Mexico and Indonesia Financials against underweights in Saudi Arabia, Kuwait and Taiwan Financials.
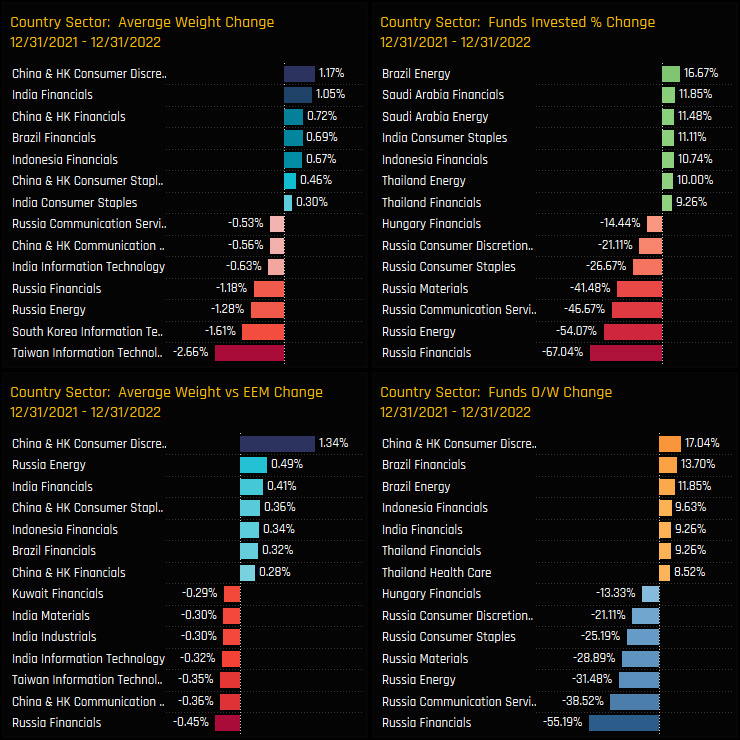
Activity over the last 12-months shows the extent of the Russian exodus, with managers instead opening exposures in Brazil Energy, Saudi Financials/Energy and India Consumer Staples. China & HK Consumer Discretionary stands out, with average weights, relative weights and the percentage of funds overweight rising by more than any other country/sector in EM.
Country Sector Sentiment
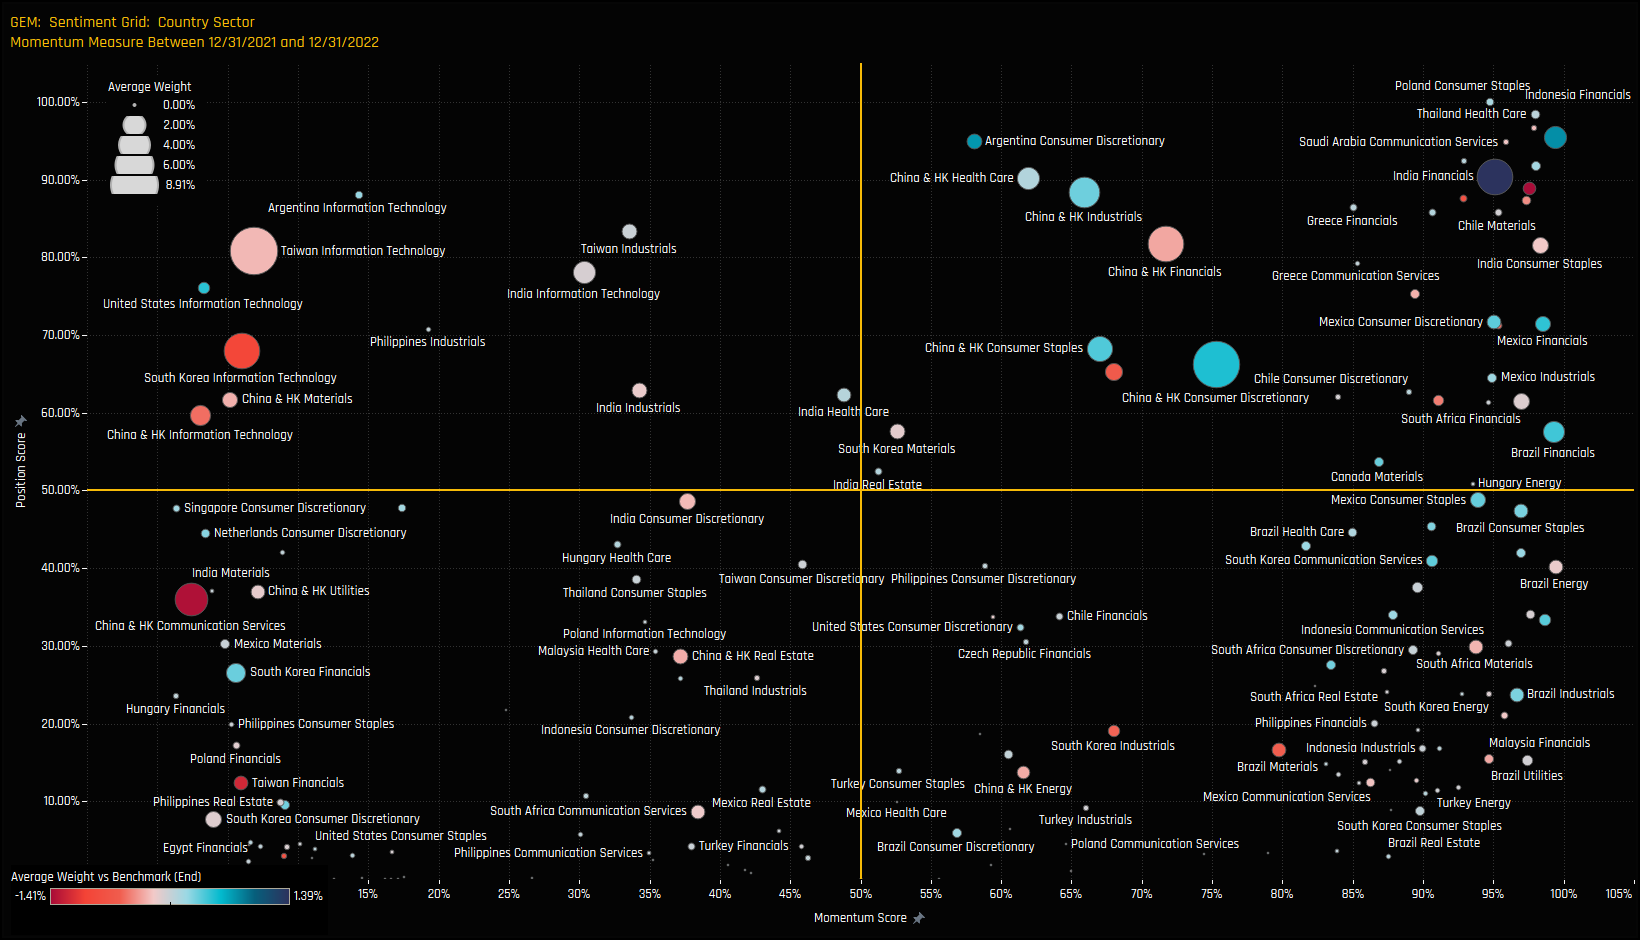
The sentiment grid below shows where current positioning in each country/sector sits versus its own history going back to 2008 on a scale of 0-100% (y-axis), against a measure of fund activity for each country/sector between 12/31/2021 and 12/31/2022 (x-axis).
Both India and Indonesia Financials appear at the top-right of the grid, having captured strong inflows last year that has taken positioning towards all-time highs. Momentum in the key Technology exposures in South Korea, Taiwan and China & HK remains soft, though positioning is still above mid-range. Selected Energy markets are climbing up the ranks, whilst positioning in most Turkish sectors is at rock bottom.
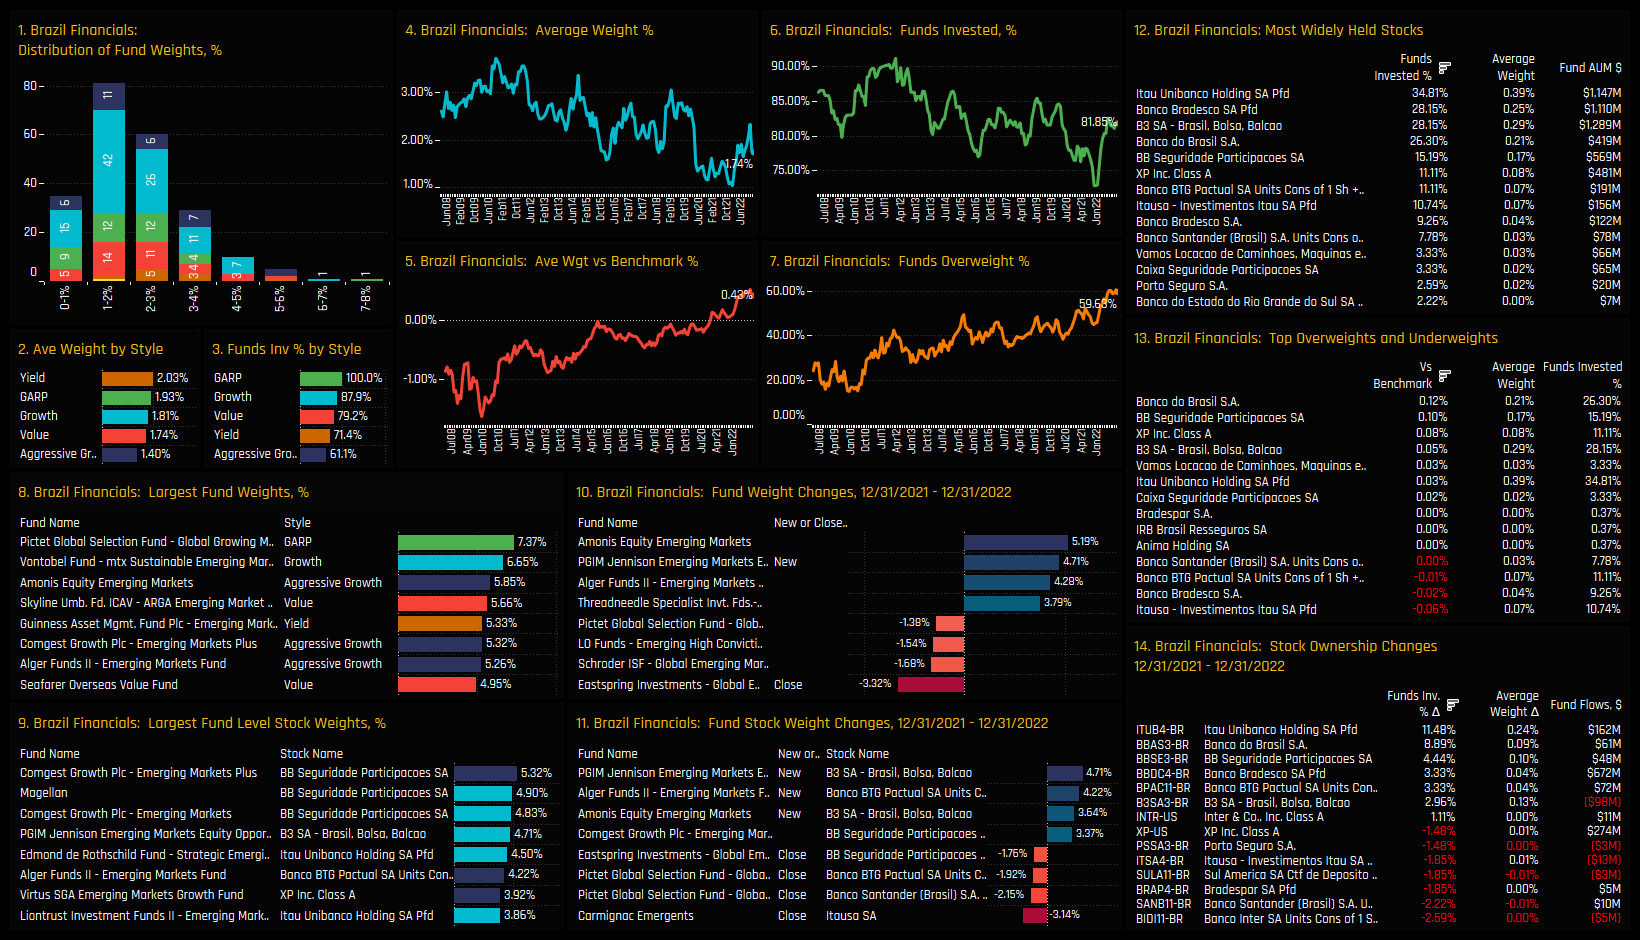
Brazil Financials Focus
Fund positioning in Brazilian Financials took a big leap forward last year. The percentage of funds invested got as low as 72% at the end of 2022, but has since increased to 81.8% with net positioning moving from underweight to overweight in the process. The majority (60%) of EM managers are now overweight the Brazil Financials sector. Absolute exposure is small, with most funds opting for a sub-3% weight and the maximum at 7.4% for Pictet’s Global Growing Markets Fund.
The most widely held stocks in the sector are Itau Unibanco and Banco Bradesco, held by 34.8% and 28.2% of funds respectively and both seeing strong increases in ownership over the course of the year. On a stock level, among the larger opening positions were PGIM EM Equity and Amonis EM Equity in B3 SA.
Conclusion and Links
This concludes our analysis of top-down positioning among EM active investors. Scroll down for further analysis on Russia’s replacements in EMEA and a deep dive on Alibaba positioning among active EM investors.
Russia has left a big hole in EM portfolios after it's exclusion from financial markets last year. With EMEA already losing ground to Asia over the last decade, and LATAM gaining traction in 2022, what are the stocks in the EMEA region that investors are turning to in order to keep some regional balance.
EMEA Stock Activity, 2022
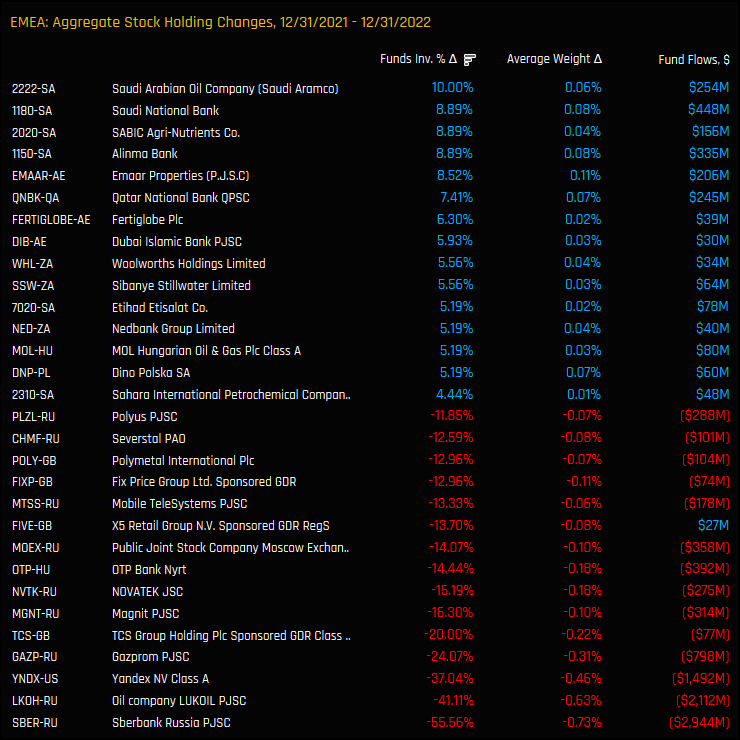
We start by looking at the largest ownership changes in 2022 for stocks in the EMEA region. On the negative side are the list of Russian stocks that were once widely owned by EM managers. For example, 56% of the EM funds in our analysis saw their Sberbank positions close in 2022. The positive side is less extreme, but dominated by stocks in the MENA region. Saudi Aramco for example, gained investment from 10% of the funds in our analysis following $254m of fund inflows. Outside of MENA, Woolworths in South Africa, MOL Oil & Gas in Hungary and Dino Polska in Poland all saw ownership levels increase.
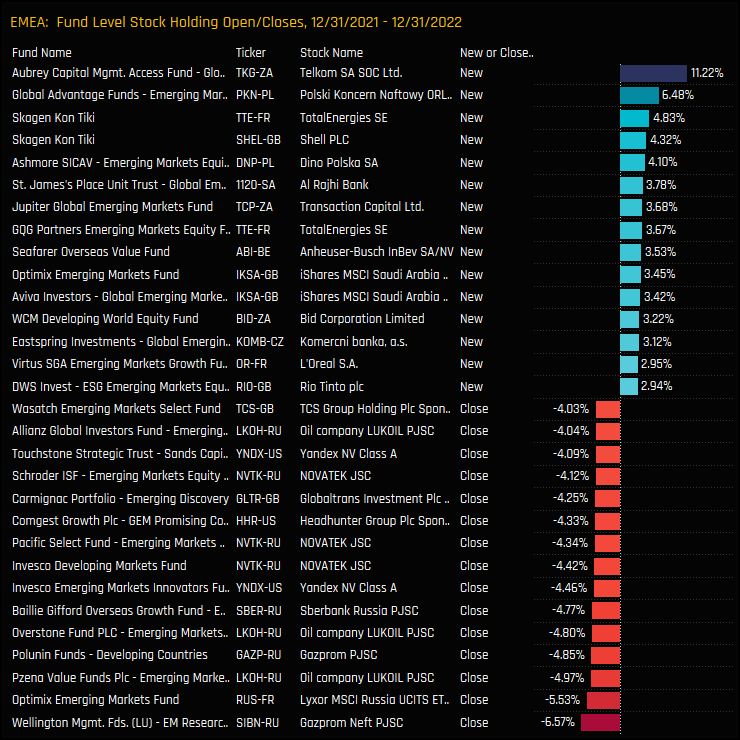
On an individual fund level, the largest opening and closing positions over the period are highlighted below. Offsetting the mass closure of Russian positions were large opening positions in Telkom SA, Polski Koncern and Dino Polska, in addition to a number of developed market positions in Total Energies, Shell and Anheuser-Busch.
Latest EMEA Positioning
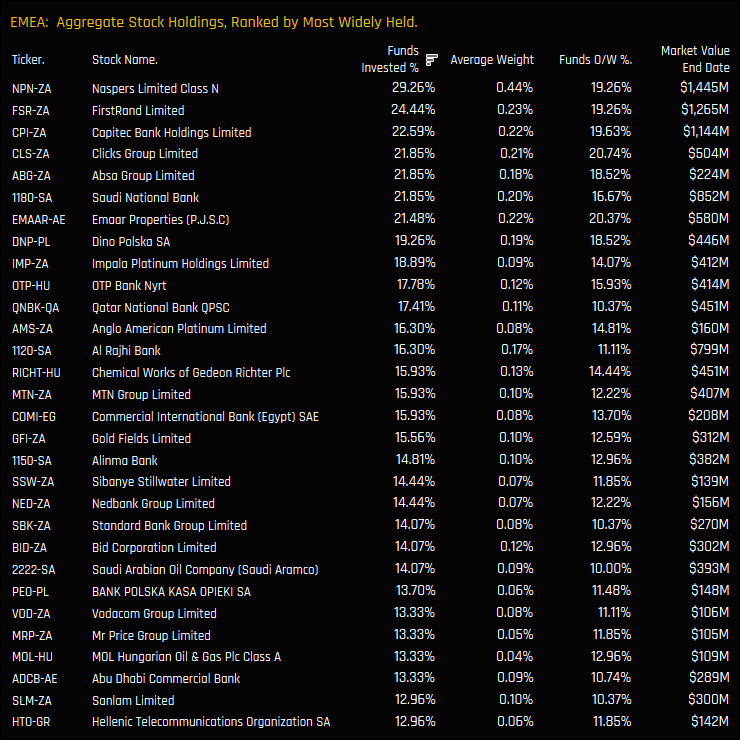
Despite the increases in MENA stock ownership, South African names dominate the list of most widely held EMEA companies. There are 7 stocks held by more than a 5th of the EM funds in our analysis, led by Naspers Limited, FirstRand Limited and Capitec Bank Holdings Limited.
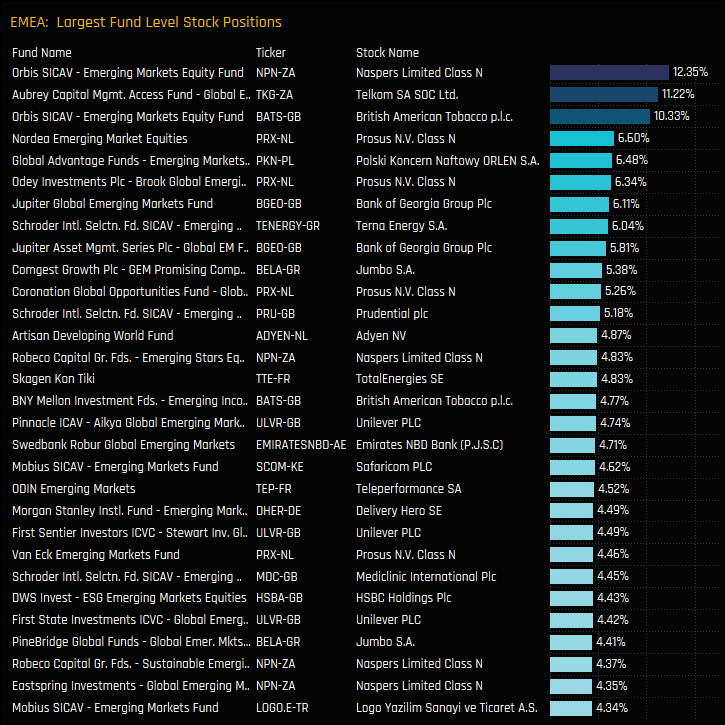
The largest individual fund holdings are shown in the table below. They are led by positions in Naspers and BATS from the highly concentrated Orbis EM Equity fund, whilst Prosus N.V features prominently as a high conviction position among a number of managers, despite being held by just 11.5% of funds.
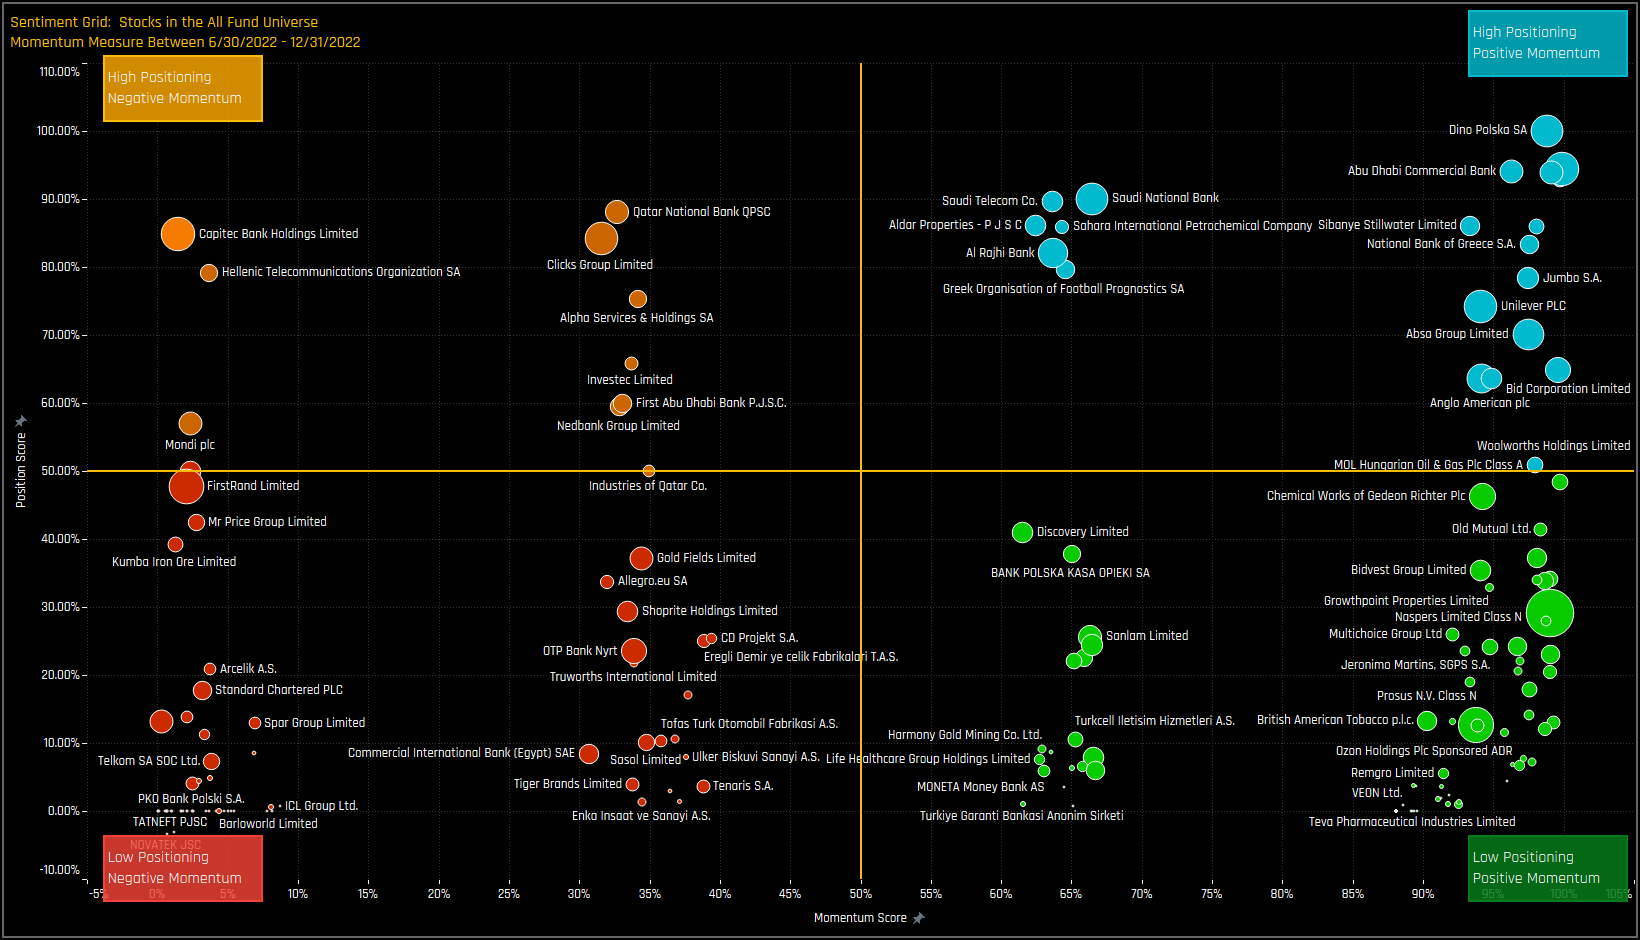
EMEA Stock Sentiment
The sentiment grid below shows where current positioning in each EMEA stock sits versus its own history going back to 2008 on a scale of 0-100% (y-axis), against a measure of fund activity for each stock between 06/30/2021 and 12/31/2022 (x-axis).
The largest cluster of companies appears in the far-right of the grid, indicative of strong rotation over the last 6-months. Stocks such as Dino Polska and Abu Dhabi Commercial Bank are now close to record levels of ownership, whilst exposure is growing in names such as Woolworths and Bid Corporation, among others.
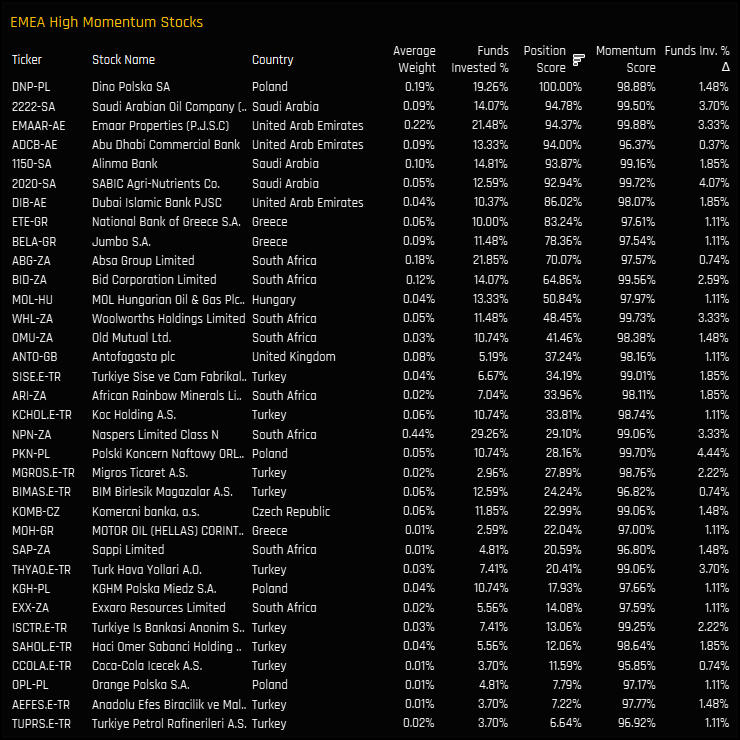
EMEA Stock Screen
The below chart takes the stocks in the chart above that have a momentum score of over 95%. They are ranked by their position score to help understand how well owned each stock is compared to its own history. In light of Russia’s demise, these are the stocks that EM managers are turning to to broaden their EMEA exposure.
Stock profiles for 8 of the key names in the list can be accessed by using the links below. If you would like any of the remaining names, just get in touch.
In this report, we look at the long-term ownership trends in Alibaba Group Holdings.
Time-Series & Peer Group Activity
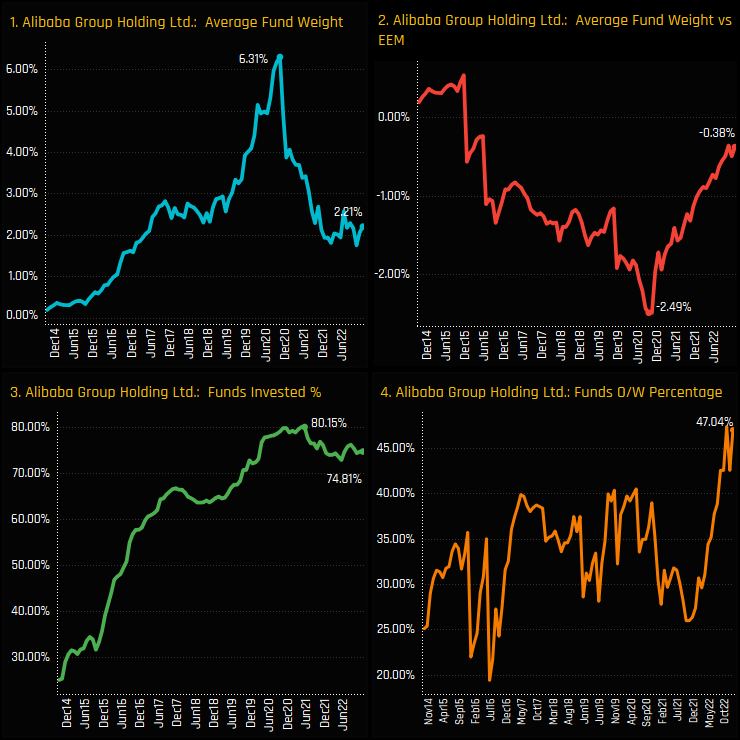
Alibaba’s fall from grace has been well documented. In our analysis, average fund weights fell from a peak of 6.3% in October 2020 down to a range of between 1.7% and 2.5% over the last 18 months. It’s perhaps surprising that active EM investors, on the most part at least, stayed the course during this period of heavy price declines. Chart 3 below shows the percentage of funds invested in Alibaba over time. Despite the stock price falling by a third, over 70% of EM funds remained invested in the name throughout. In fact, since late 2021, EM investors have been increasing allocations, with Chart 4 showing a big increase in the percentage of funds positioned overweight the iShares EEM ETF.
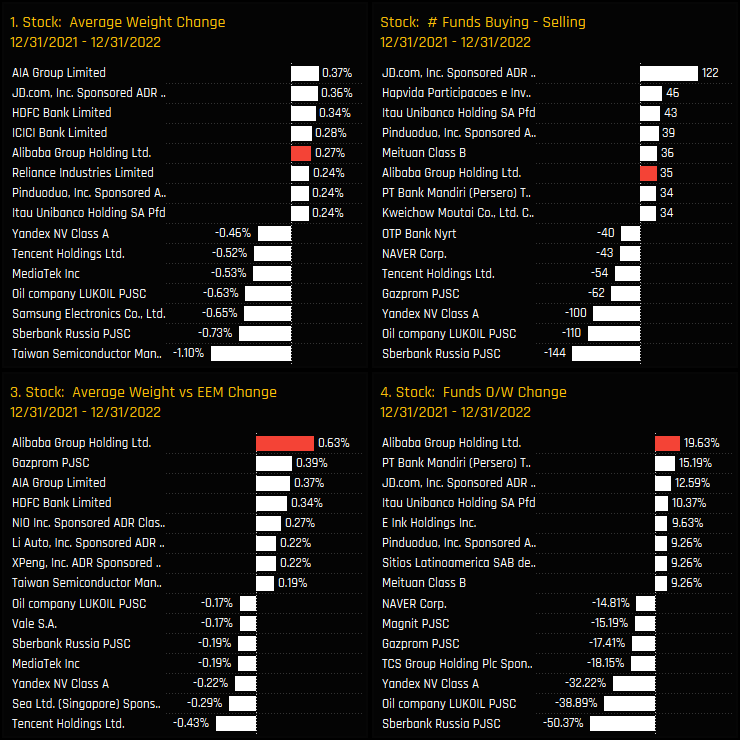
We can see evidence of this rotation in the charts below, which measure the changes in our ownership metrics for all stocks in the EM universe over the previous 12-months. Relative to benchmark, Alibaba’s moves were the highest of any stock, with 19.6% of funds moving to overweight and the underweight reducing by +0.63%. This was an active rotation, with an excess of 35 funds buying versus selling, the 6th largest across the EM universe.
Fund Activity & Style Trends
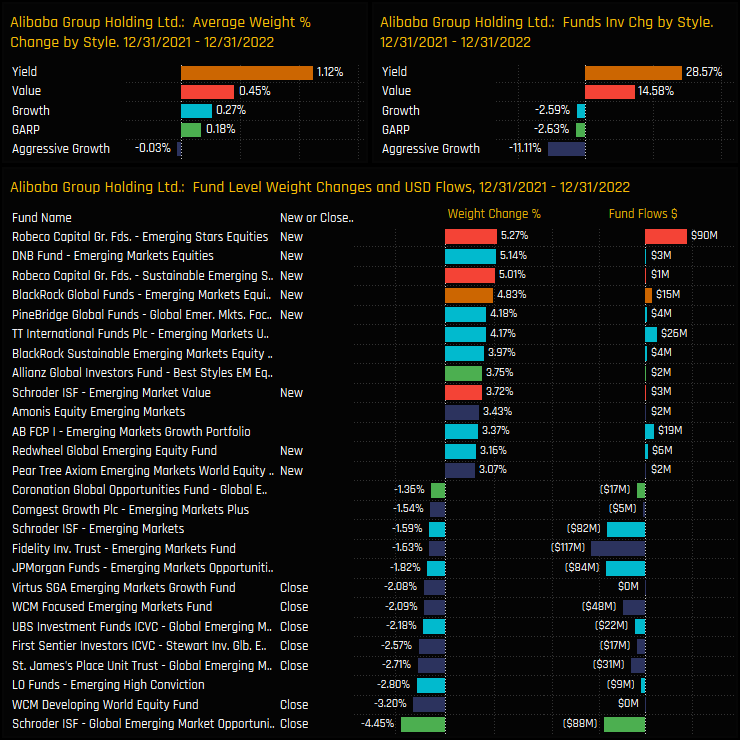
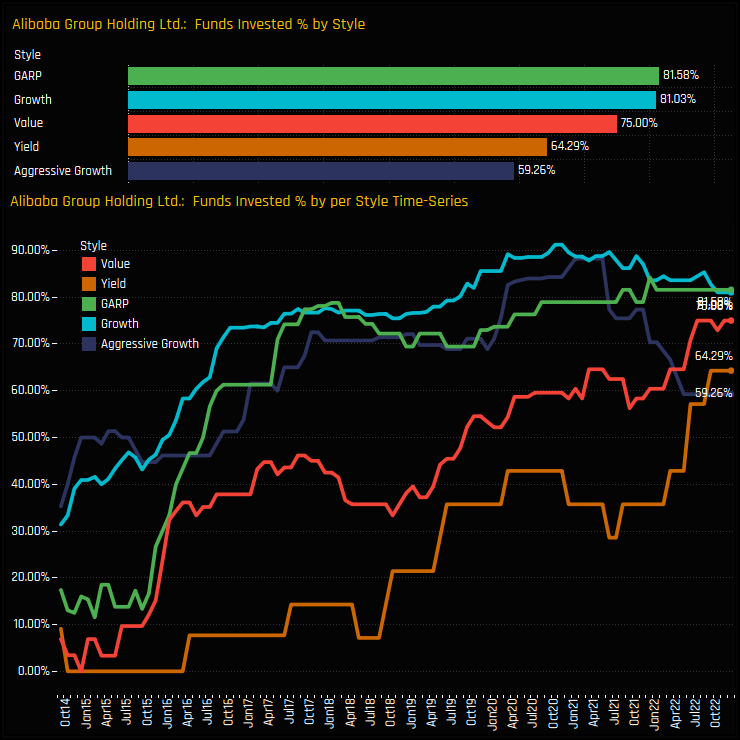
However, this wasn’t a universal move among EM investors. The top 2 charts below show the change in average weight and funds invested in Alibaba, split by Style. The percentage of Yield and Value funds invested in Alibaba increased by +28.6% and +14.6% respectively, yet a net 11% of Aggressive Growth funds closed exposure. The bottom chart shows the fund level detail, with opens and closures abound.
Last year’s moves leave 75% of Value funds and 64% of Yield funds now invested in Alibaba. The long-term funds invested trends in the bottom chart shows consistent ownership growth among Yield/Value funds, a plateauing picture among Growth and GARP and a big reversal in Aggressive Growth.
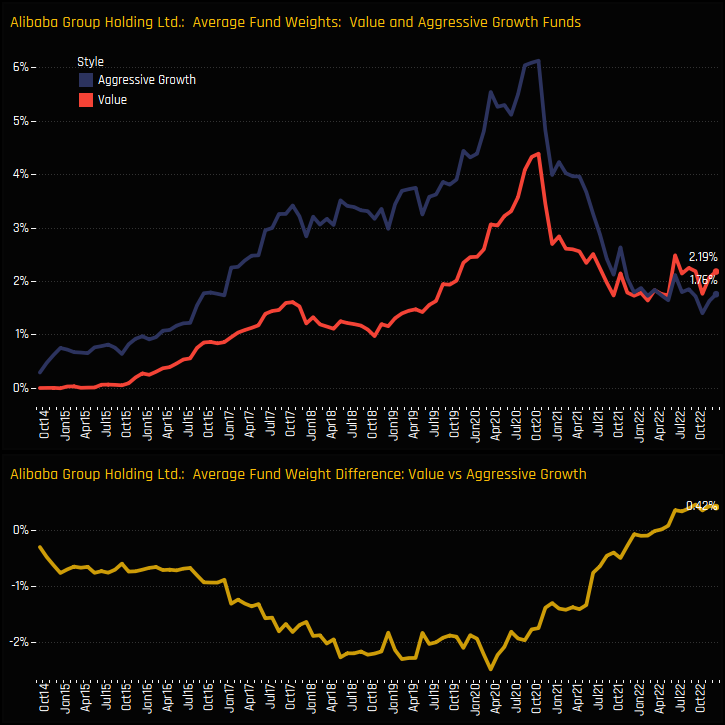
Growth vs Value and Fund Holdings
The top chart below shows the average fund weight over time for Value and Aggressive Growth funds, and the bottom chart the difference between the two. The spread between the two is at its maximum wide and the first time since listing that Value managers are above Aggressive Growth.
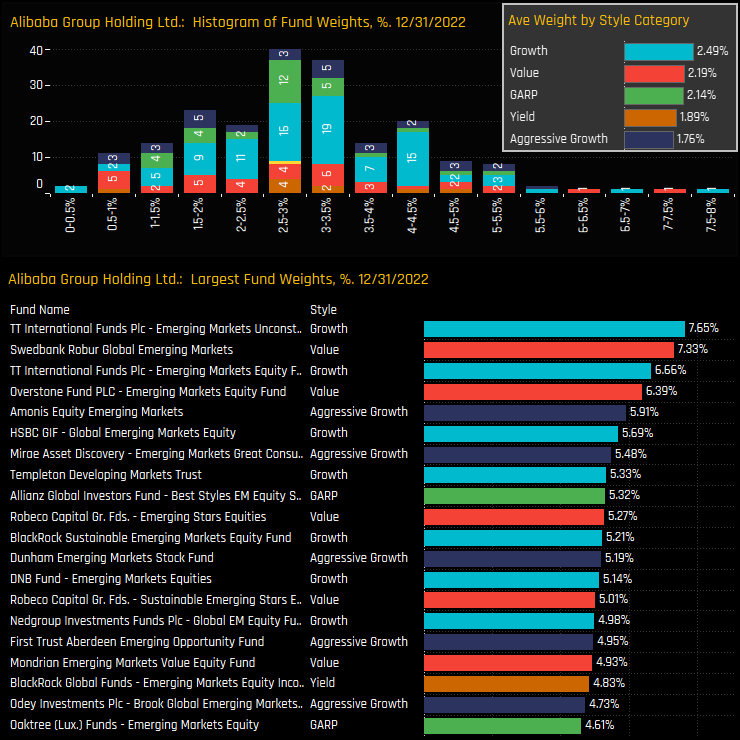
The distribution of fund holding weights in Alibaba is shown in the top chart below, and highlights a normal distribution peaking around 2.5%-3% with a right-sided skew. Those with high conviction include TT International, Swedbank and Overstone, who all hold more than a 6% portfolio weight.
Conclusions & Data Report
Fund ownership in Alibaba Group Holdings has remained resilient through the recent period of market turbulence. Far from a mass exodus, the majority of EM funds stayed the course, albeit with a high degree of rotation among the Global EM managers in our analysis. Alibaba is still the 2nd most widely held stock in global EM (see chart right), so a key name for active EM funds.
Today’s price levels in Alibaba clearly make a compelling argument for Value funds, who have ramped up allocations in recent months. Aggressive Growth funds, with their reliance on strong forward earnings visibility are having a harder time justifying holdings.
Overall though, the trend is definitively positive from an ownership perspective. The period of decline is over, and a growing number of managers are making the move to overweight whilst index weights and prices remain at these levels.
For more analysis, data or information on active investor positioning in your market, please get in touch with me on steven.holden@copleyfundresearch.com


