Asia Ex-Japan Fund Positioning Analysis, January 2023
In this issue:
2023 Asia Ex-Japan Positioning Update
Asia Ex-Japan Stock Radar
NAVER Corp: Back to the Lows
91 Active Asia Ex-Japan Funds, AUM $55bn
2023 Asia Ex-Japan Positioning Update
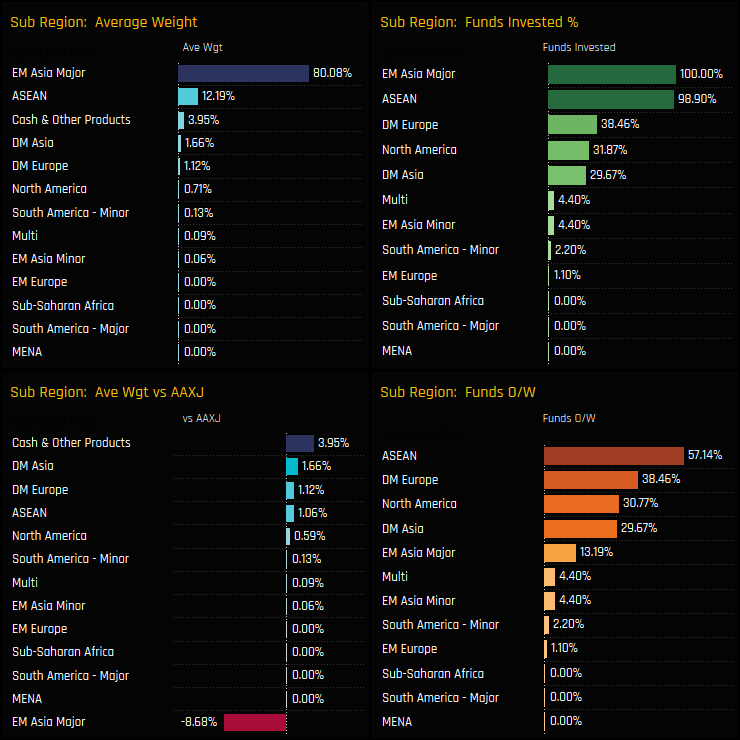
We start with the major regional splits. EM Asia Major, which includes the top 4 country weights of China & HK, India, South Korea and Taiwan, accounts for 80.1% of the average active Asia Ex-Japan fund. Versus the iShares AAXJ ETF benchmark, this represents an underweight of -8.68% on average, with just 13.2% of managers positioned above in the benchmark. Overweights are led by Cash holdings, developed Asia and European holdings and ASEAN exposure.
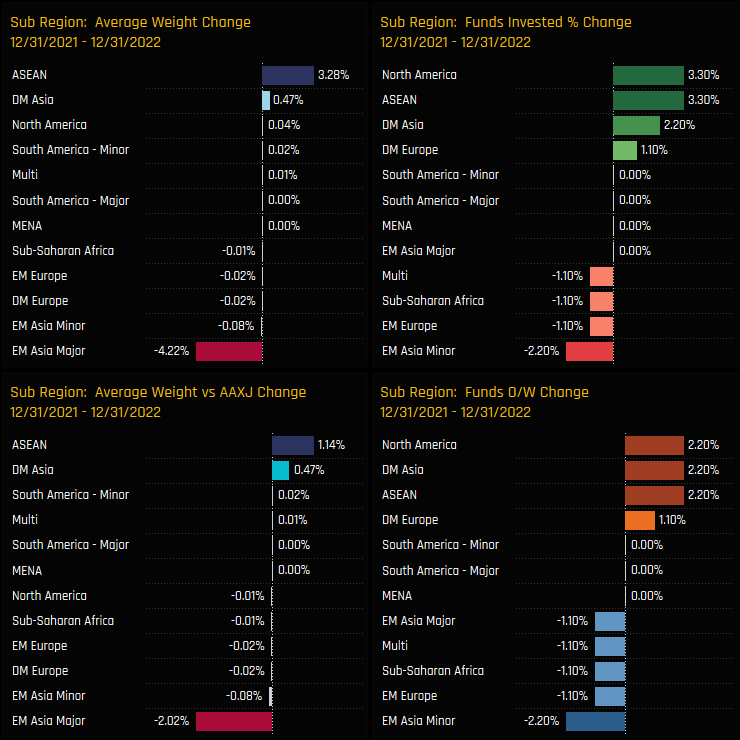
Over the course of 2022, there was a clear rotation in to the ASEAN region and out of the Major EM Asia countries. Average holdings weights in ASEAN increased by +3.28%, with +3.3% of funds opening exposure and weights relative to benchmark increasing by +1.14%. EM Asia Major saw weights drop by -4.22% and underweights increase by -2.02%.
ASEAN Focus
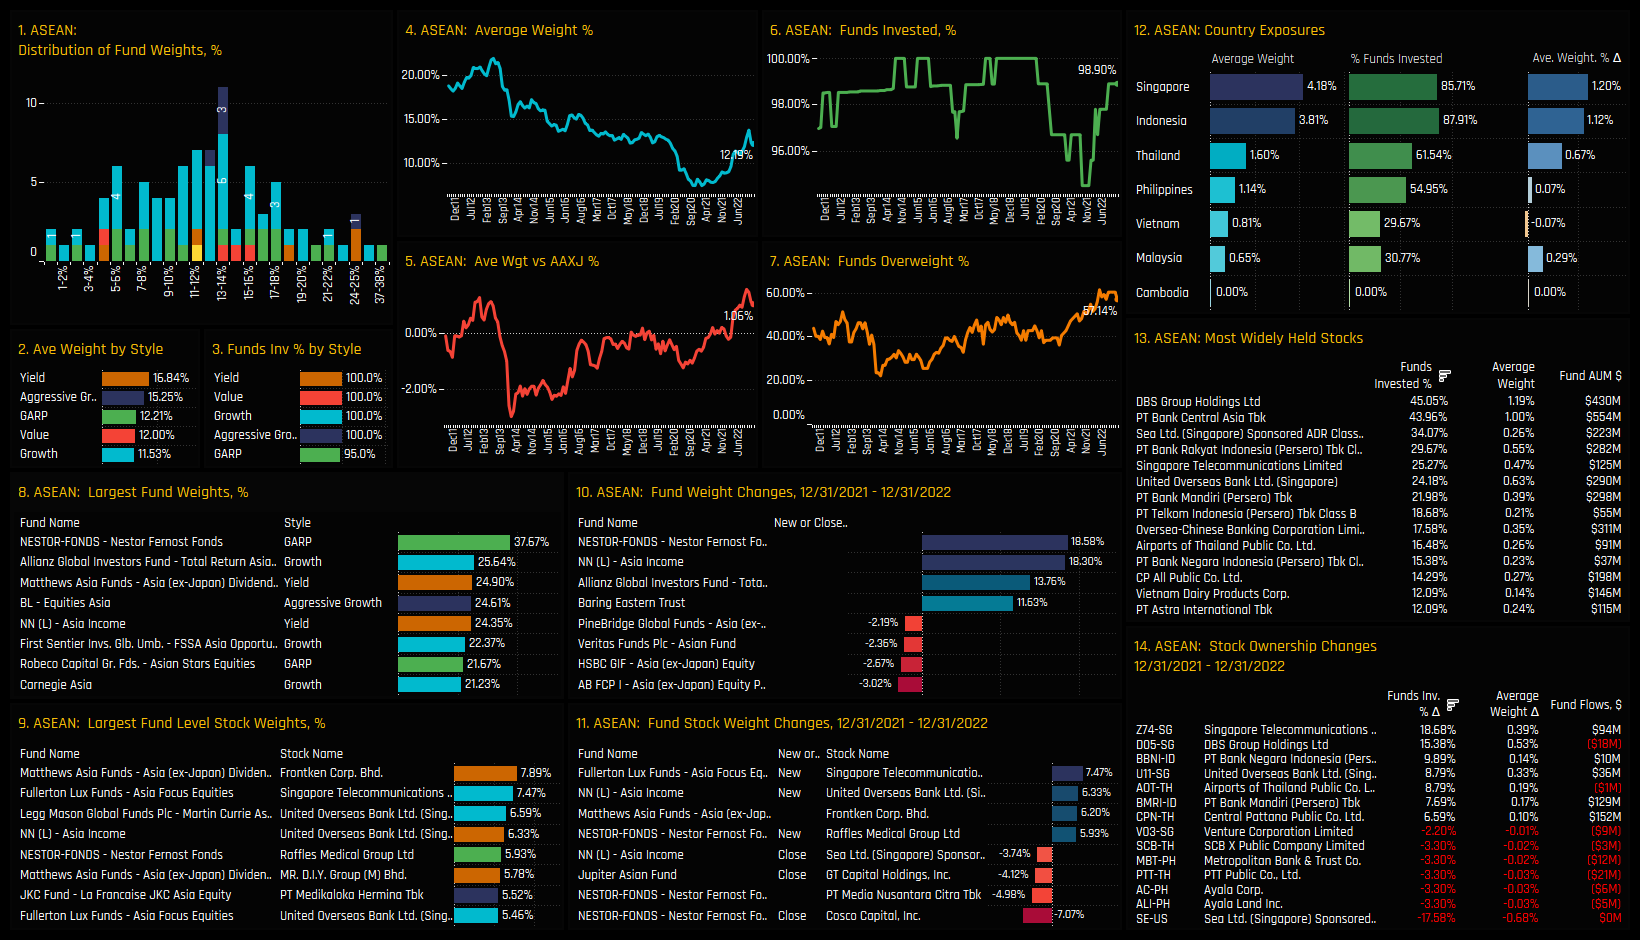
The increase in ASEAN exposure should be viewed as a strong recovery from the lows that occurred through the COVID era. Average holding weights finally bottomed out in late 2021 at <8% but have since rallied to today’s levels of 12.19%. During that period, active managers moved from a net underweight to overweight, with now a near record 57.1% of managers positioned ahead the benchmark. Top holders have over 20% exposure, led by Nestor Fernost (37.7%), Allianz Total Return Asia (25.6%) and Matthews Asia Ex-Japan Divided (24.9%).
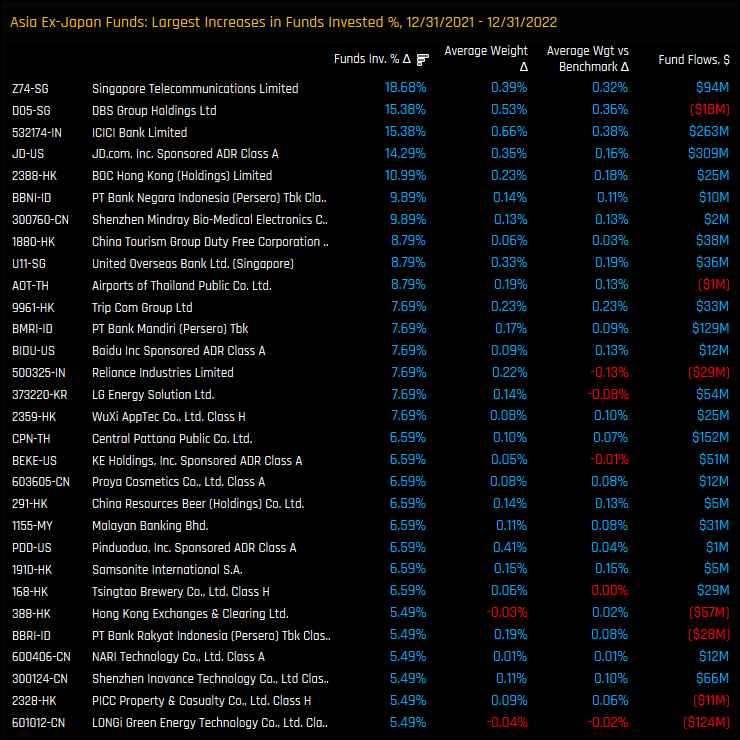
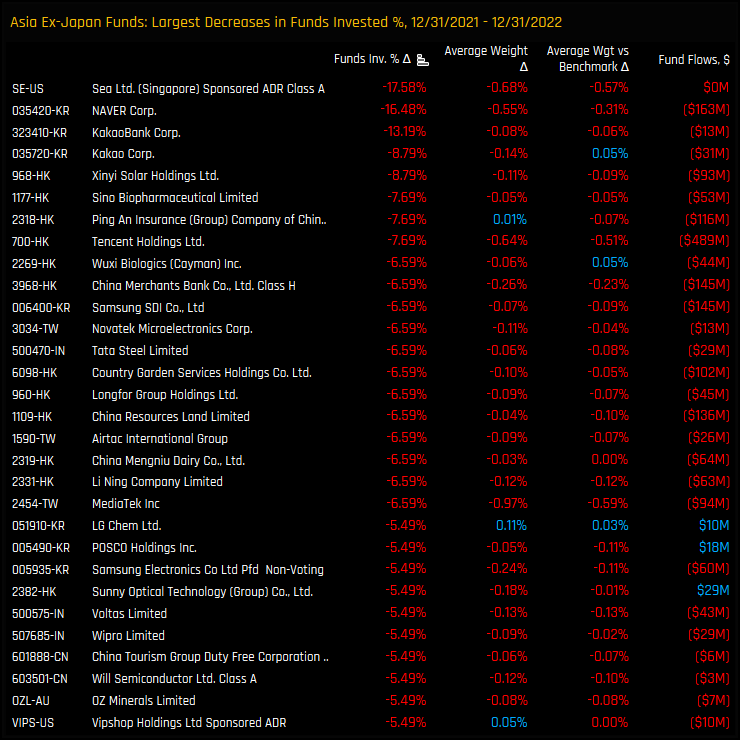
Singapore and Indonesia are the key holding weights within the region and have been the drivers behind the rotation over the last 12 months. Top stock holdings are split between the 2 nations, led by DBS Group, PT Bank Central Asia and Sea Ltd. Stock activity through 2022 was heavily skewed to the buyside and favoured SingTel and DBS Group, who saw the percentage of funds invested climb by +18.68% and +15.38% respectively. On the sell side, Sea Ltd bore the brunt, with -17.6% of the managers in our analysis closing out exposure.
EM Asia Major Focus
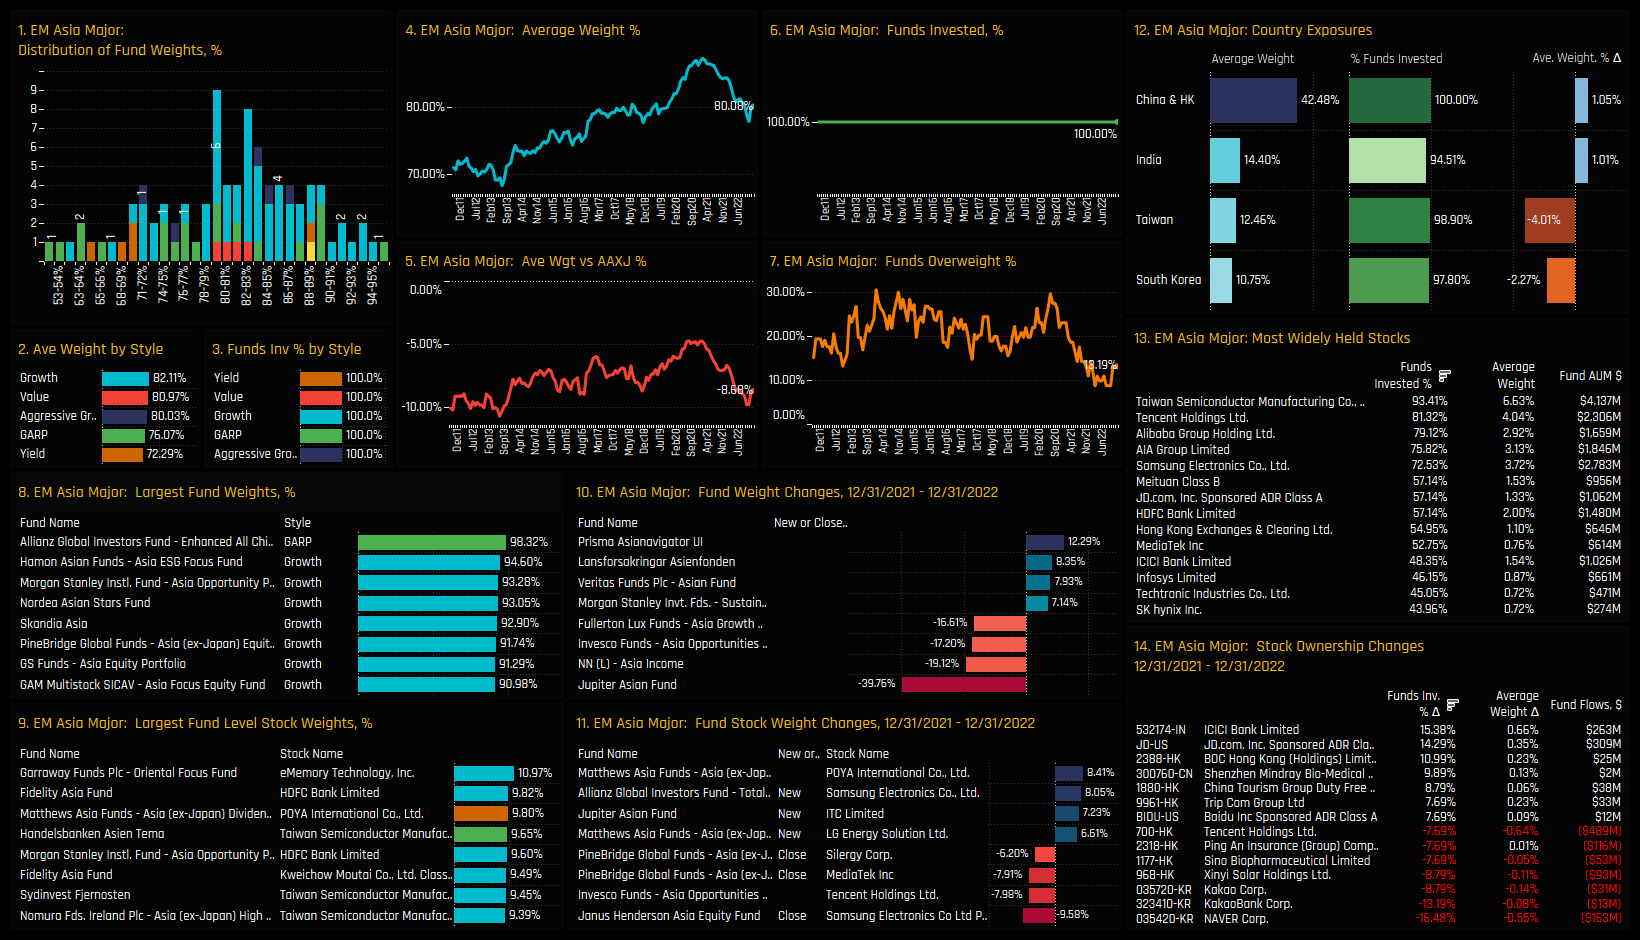
For the EM Asia Major region, the ownership picture is almost a mirror image. Allocations soared during the COVID era, with average fund weights peaking at 87% towards the back-end of 2021. The reversal on the back of the global COVID recovery has been equally as aggressive, pushing active Asia Ex-Japan managers towards their highest ever underweight of -8.68%. Rotation out of the region was led by the Jupiter Asian Fund, who cut weights by -39.8% over the course of 2022, together with NN Asia Income (-19.1%) and Invesco Asia Opportunities (-17.2%).
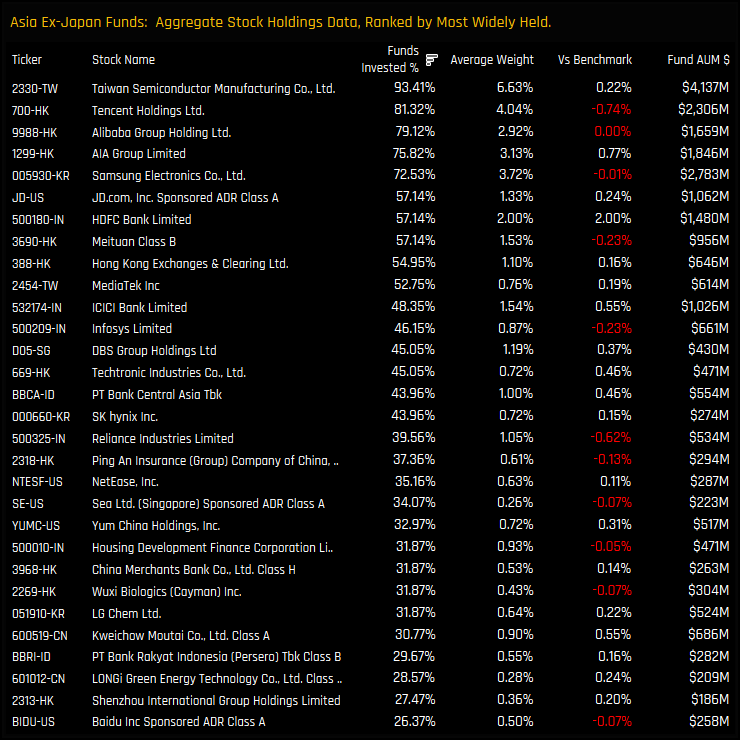
On a country level, the rotation was driven by Taiwan and South Korea, where average weights fell by -4.01% and -2.27% over the last 12 months respectively. Stock level rotation within the region saw investors close exposure to NAVER Corp, KakaoBank Corp and Kakao Corp, with buying in to ICICI Bank, JD.Com and BOC Hong Kong Holdings. This leaves TSMC, Tencent, Alibaba, AIA Group and Samsung Electronics in a clear top tier of stock holdings, all held by over 70% of funds and at weights well above regional peers.
Country Positioning
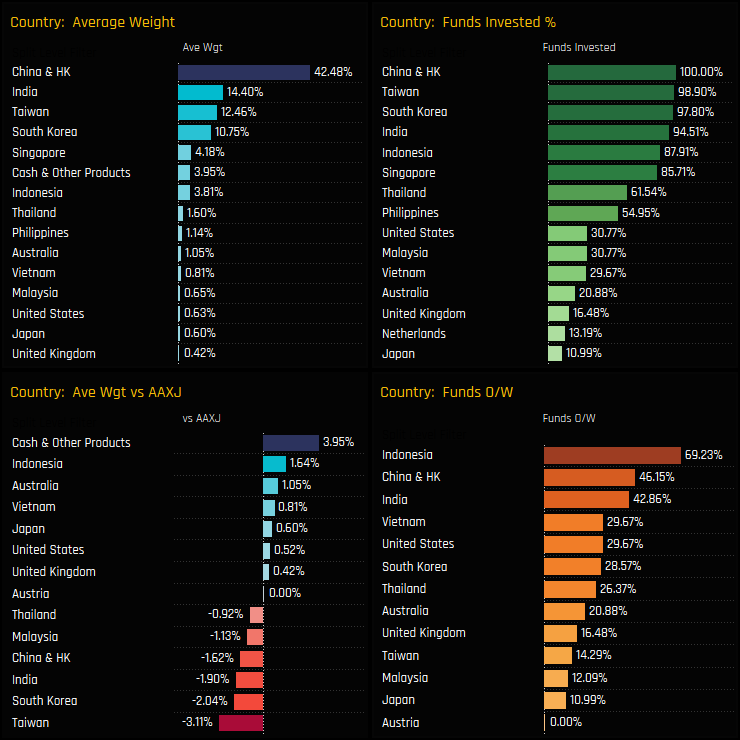
On a country level, China & HK remains the dominant exposure by a margin, held at almost 3x the weight of India. Versus the benchmark, Asia Ex-Japan investors are running big underweights in the major EM countries, led by South Korea (-3.1%) and Taiwan (-2.04%), whilst overweights consist mainly of Cash (+3.95%), Indonesia (+1.64%) and out-of-benchmark exposure in Australia (+1.05%), Vietnam (+0.81%) and Japan (+0.60%). Indonesia is the consensus overweight here, held above benchmark by 69.2% of funds.
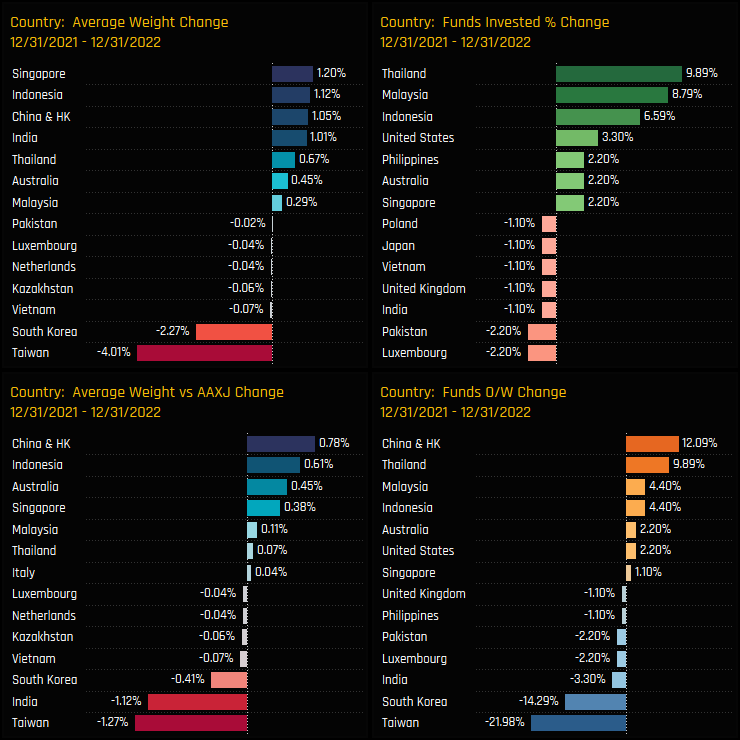
Country activity over the course of 2022 broadly reflects to EM Asia Major to ASEAN rotation, though with some nuances. China & HK saw an ownership recovery, with average weights increasing by +1.05% and 12% of managers switching to overweight. India weights moved higher on the year though managers sold in to strength, increasing underweights by -1.12%. All of the major ASEAN countries with the exception of Vietnam saw ownership levels recover over the year.
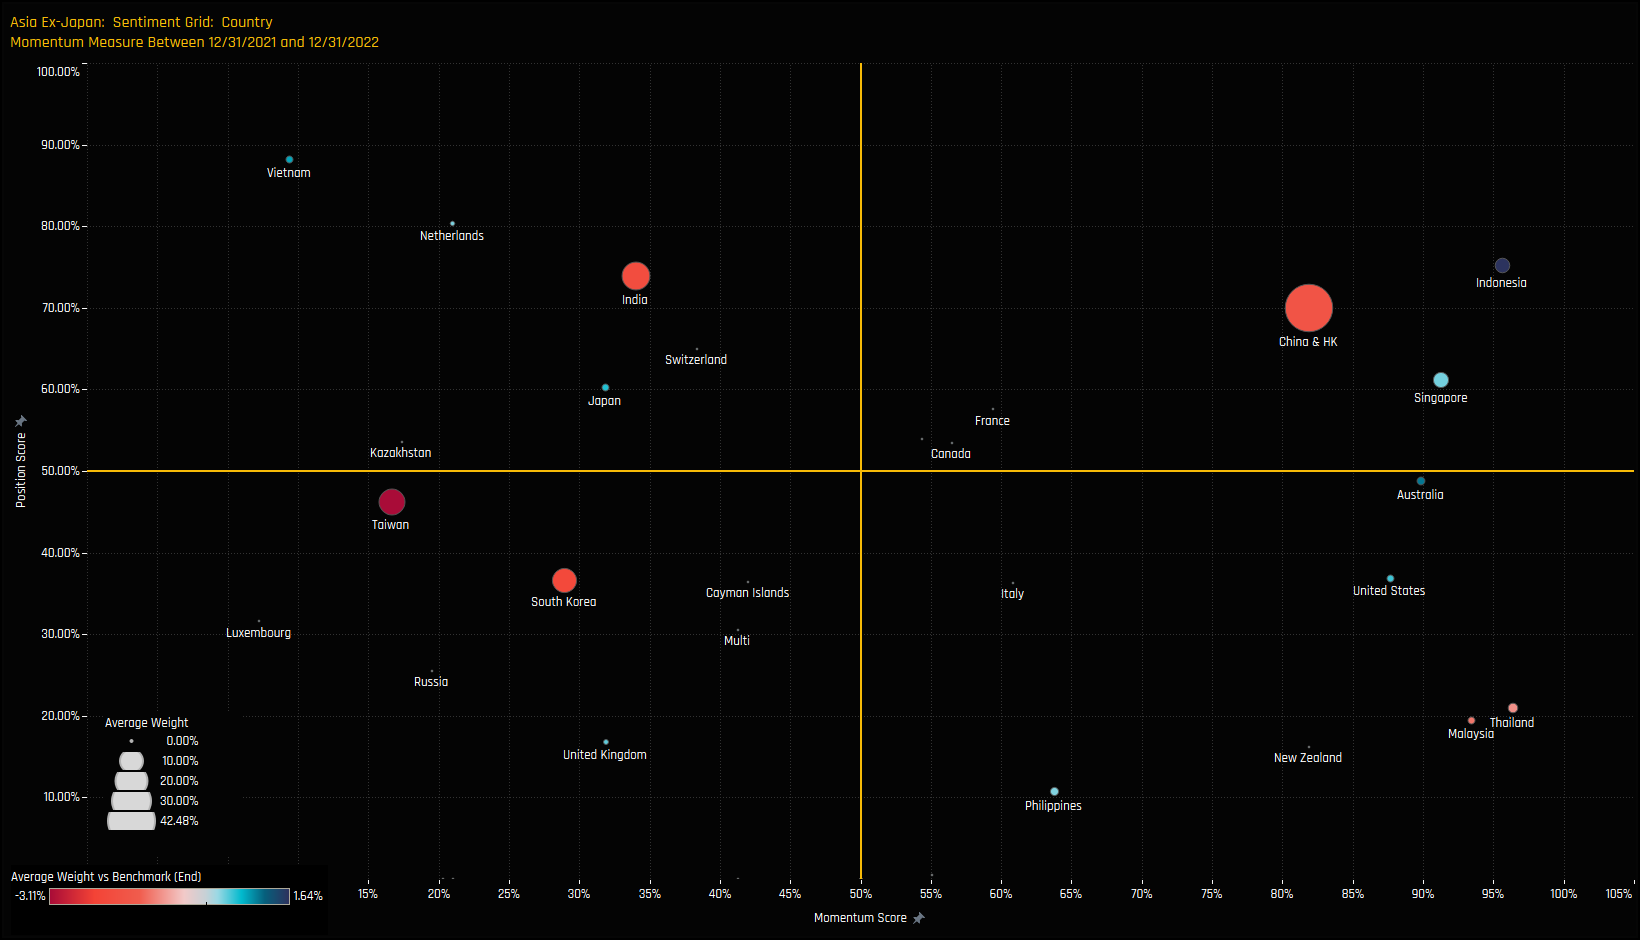
Country Sentiment
The sentiment grid below shows where current positioning in each country sits versus its own history going back to 2011 on a scale of 0-100% (y-axis), against a measure of fund activity for each country between 12/31/2021 and 12/31/2022 (x-axis).
It shows Indonesia, Singapore and China & HK as key beneficiaries of the rotation last year, pushing ownership towards the higher end of their respective ranges. Taiwan and South Korean allocations continue to fall with exposure below 50% of historical levels, whilst the smaller ASEAN nations benefited from inflows yet allocations sit near their lowest levels on record.
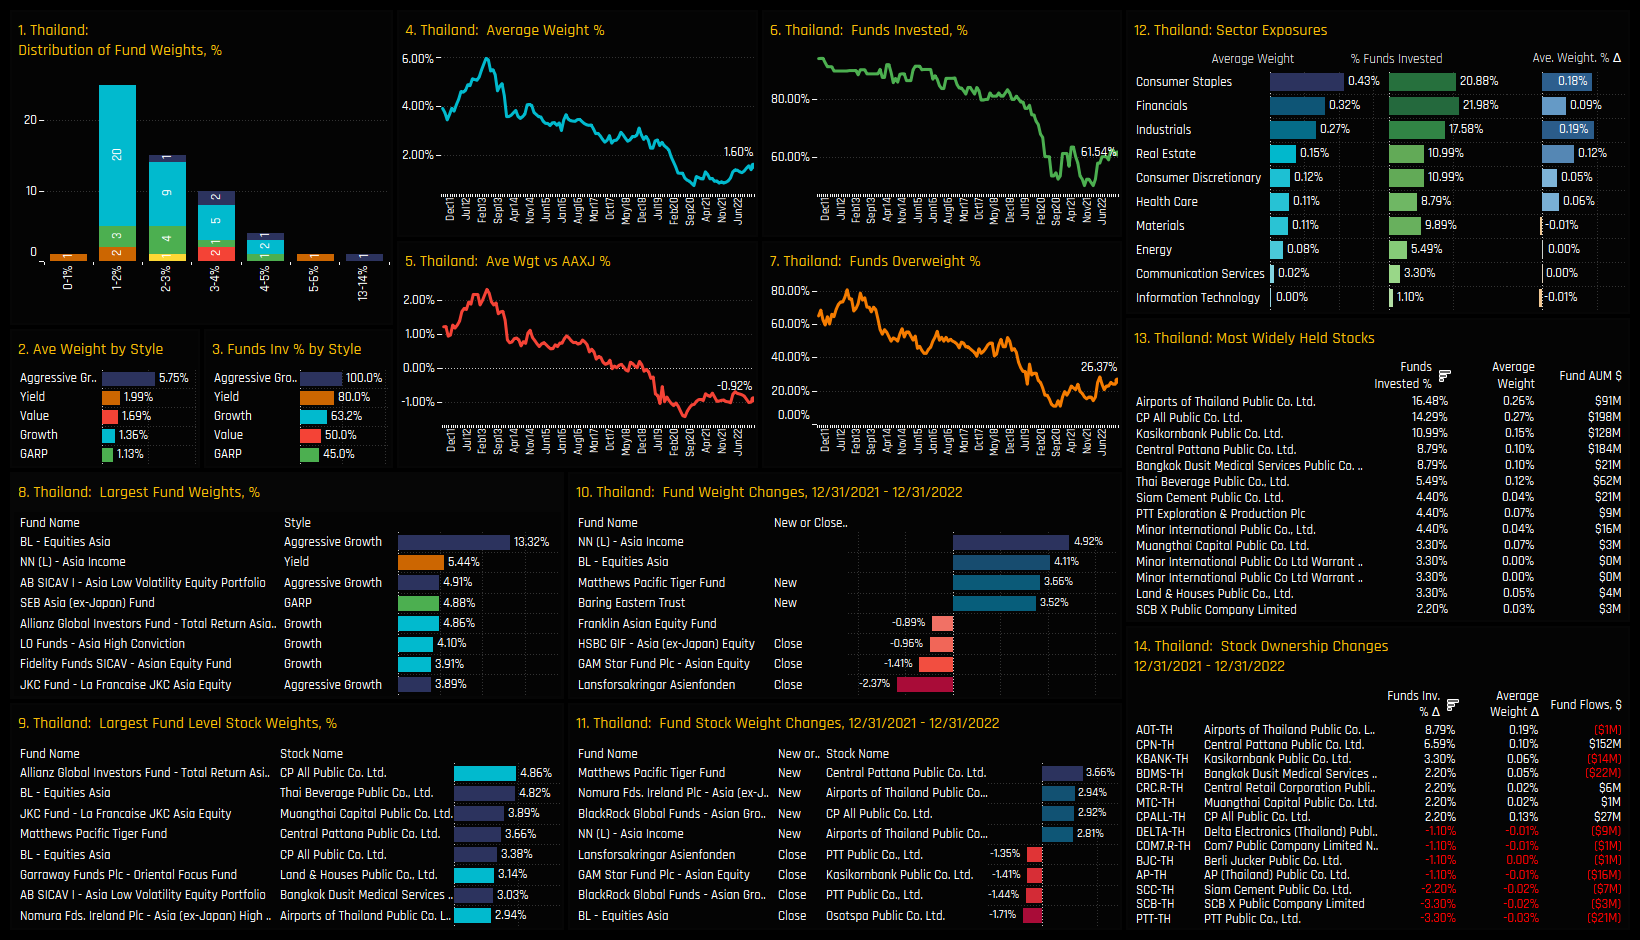
Thailand Focus
Thailand is a key example of a country in the bottom right-hand corner of the sentiment grid. Short term positive fund rotation coupled with low positioning versus the longer-term range. Average weights have risen to 1.6% but remain well below the highs of 6% in 2013, and still only 61.5% of managers have exposure to Thailand, up from the lows of 50.2% earlier this year but lower than than the +90% of 2011. Most funds hold less than a 5% allocation.
Consumer Staples, Financials and Industrials form the bulk exposure in Thailand, but these are by no means widely held sectors, owned by ~1/5th of investors in each. Airports of Thailand is the most widely held name and a key driver of the uptick in ownership, held by 16.5% of funds after attracting a further 8.8% of investors in 2022. CP All Public and Kasikornbank Public are the only other stocks that are held by more than 10% of the Asia Ex-Japan investors in our analysis.
Sector Positioning
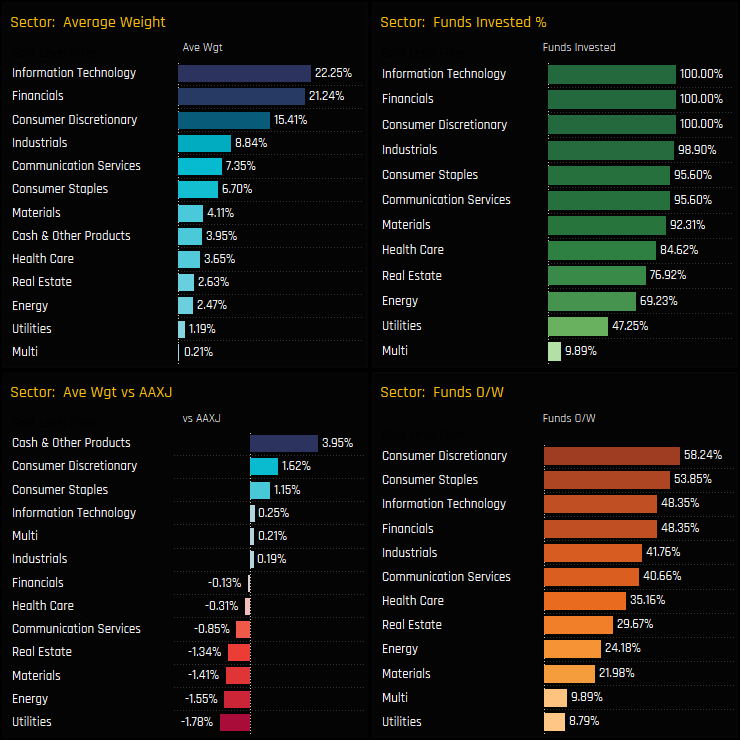
Information Technology is still the largest allocation among Asia Ex-Japan investors, but Financials have caught up over the last year. Both of the Consumer sectors represent the key overweight exposures, with over half the managers in our analysis positioned ahead of the benchmark in each. Underweights are led by the Utilities and Energy sectors on account of their low absolute ownership, with 47.2% and 69.2% of funds exposed respectively.
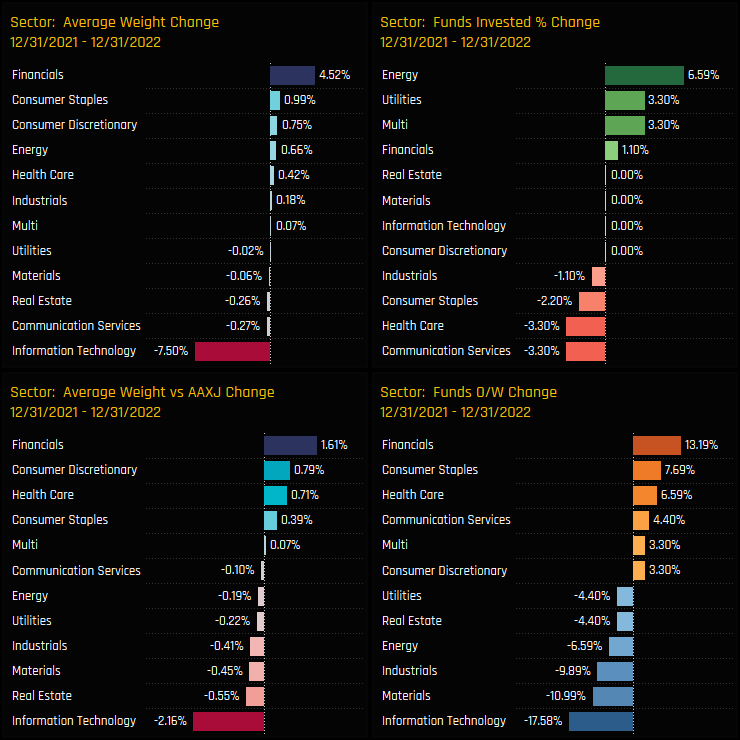
Activity over the last 12-months highlights the strong rotation out of Tech and in to Financials, with the Consumer sectors benefitting to a smaller degree. This has been an active rotation, with 13.2% of managers switching to overweight in Financials and 17.6% to underweight in Tech. The result has been a narrowing of both absolute and relative positioning between the 2 sectors.
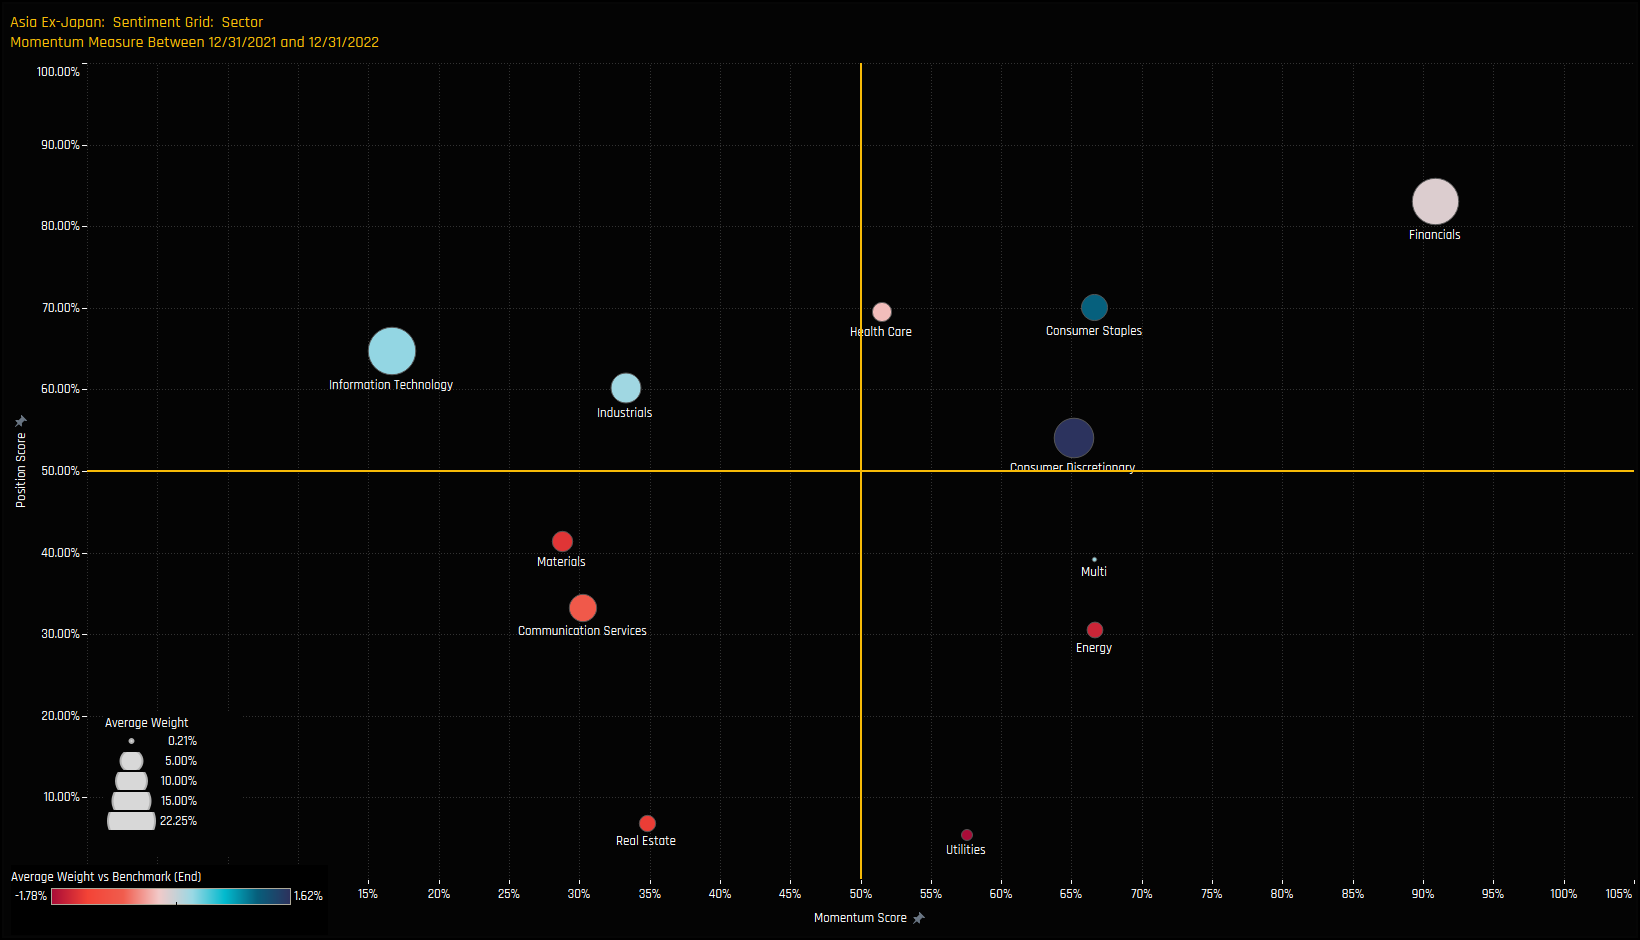
Sector Sentiment
The sentiment grid below shows where current positioning in each sector sits versus its own history going back to 2011 on a scale of 0-100% (y-axis), against a measure of fund activity for each sector between 12/31/2021 and 12/31/2022 (x-axis).
Despite the recent reversal, Technology allocations are still towards the higher end of their 10-year range, whilst the rotation into Financials moves positioning closer to record levels. Consumer Staples and Discretionary appear in favour with managers, whilst Materials and Communication Services are still in a consolidation phase.
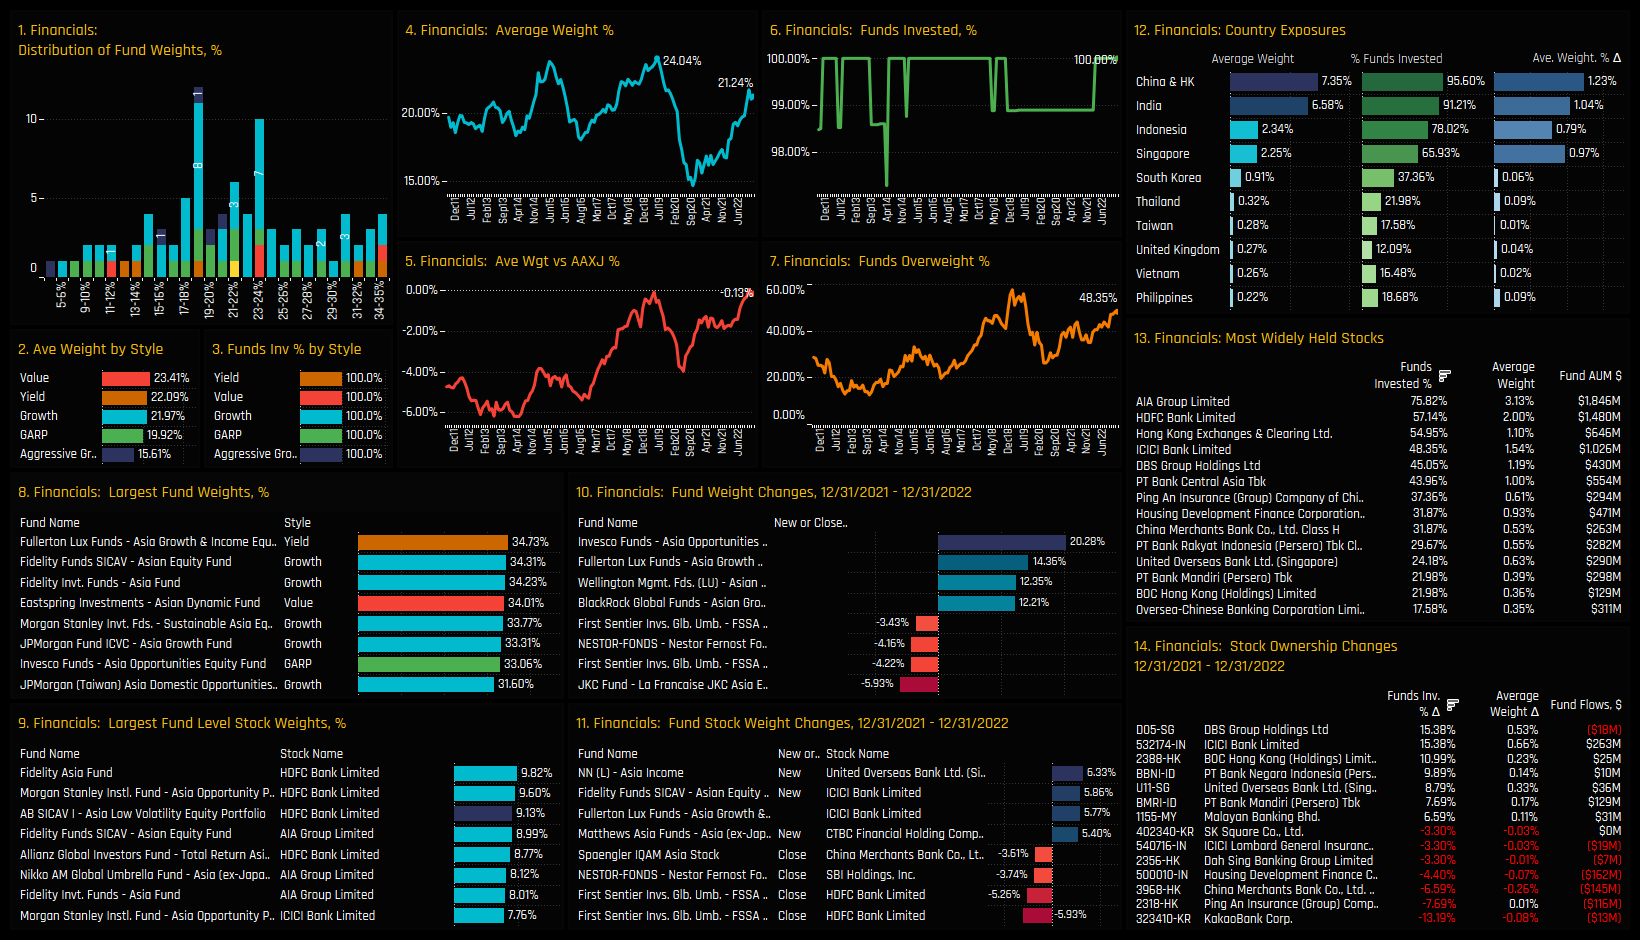
Financials Focus
Financials positioning has whipsawed aggressively over the last 3-years. The reversal from the peak in September 2020 at 24% was driven first by China & HK, but than by India and ASEAN as the COVID pandemic progressed. The trough in Sep20 and subsequent reversal has been equally as aggressive, with average weights closing in on the highs and the net underweight collapsing to zero. The holdings distribution is now centered at between 17% and 25%, with a tail to the upside led by Fullerton Asia Growth & Income (34.7%) and Fidelity Asian Equity (34.3%). Conviction has returned.
Whilst China & HK and India form the bulk of Financials allocations, exposure levels have been driven higher in almost equal measure by Singapore and Indonesia. Activity in 2022 favoured DBS Group, ICICI and BOC Hong Kong, whilst investors scaled back holdings in KakaoBank Corp, Ping An Insurance and China Merchants Bank Co. Asia Ex-Japan investors start the year light on China banks, instead placing their faith in AIA Group, HK Exchanges & Clearing and Ping An Insurance. HDFC Bank, ICICI Bank, DBS Group and PT Bank Central Asia are all widely owned and held in good size.
Country Sector Positioning
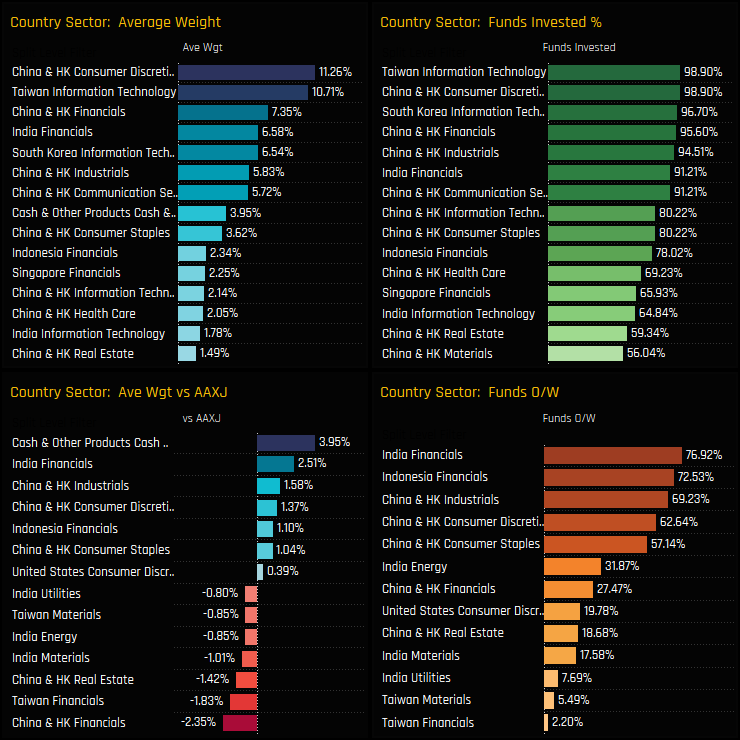
On a country/sector level, China & HK Consumer Discretionary and Taiwan Tech are the most widely held and largest allocations, accounting for more than a fifth of total Asia Ex-Japan portfolio weights, on average. Relative to benchmark, active managers prefer to run overweights in India and Indonesia Financials against underweights in China & HK and Taiwan Financials. Indeed, outside of Tech, Taiwanese sectors find little love among the funds in our analysis, with just 2.2% of funds overweight Taiwan Financials and 5.5% Taiwan Materials.
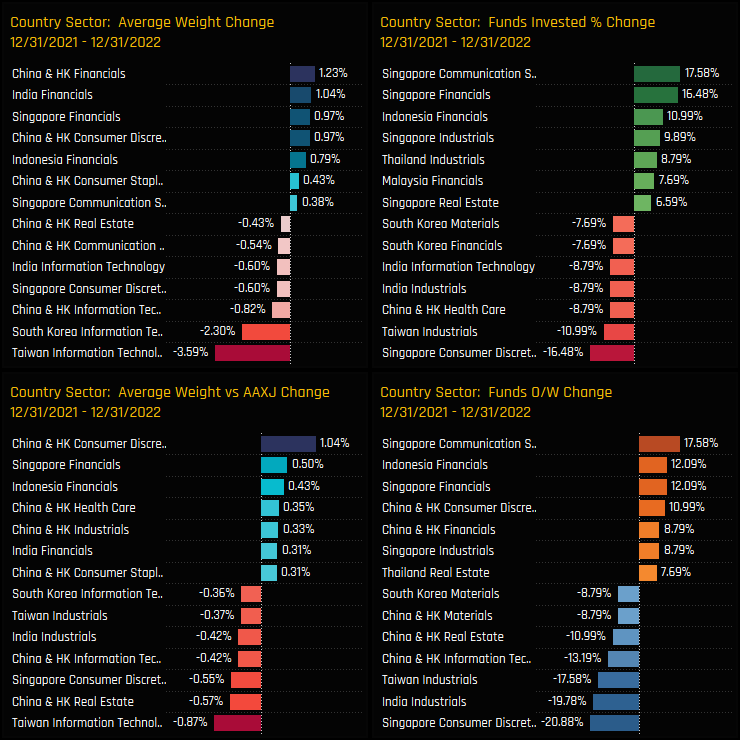
Activity over the last 12-months shows active managers rebalancing between key Singapore sectors, with Asia Ex-Japan funds adding to exposure in Singapore Communication Services and Financials whilst scaling back in Consumer Discretionary. Elsewhere there is clear evidence of rotation out of the key Technology markets, with Taiwan, China & HK, India and South Korea all suffering a degree of investor flight. On the positive side, ASEAN Financials benefited from inflows, whilst China & HK Financials appear well supported.
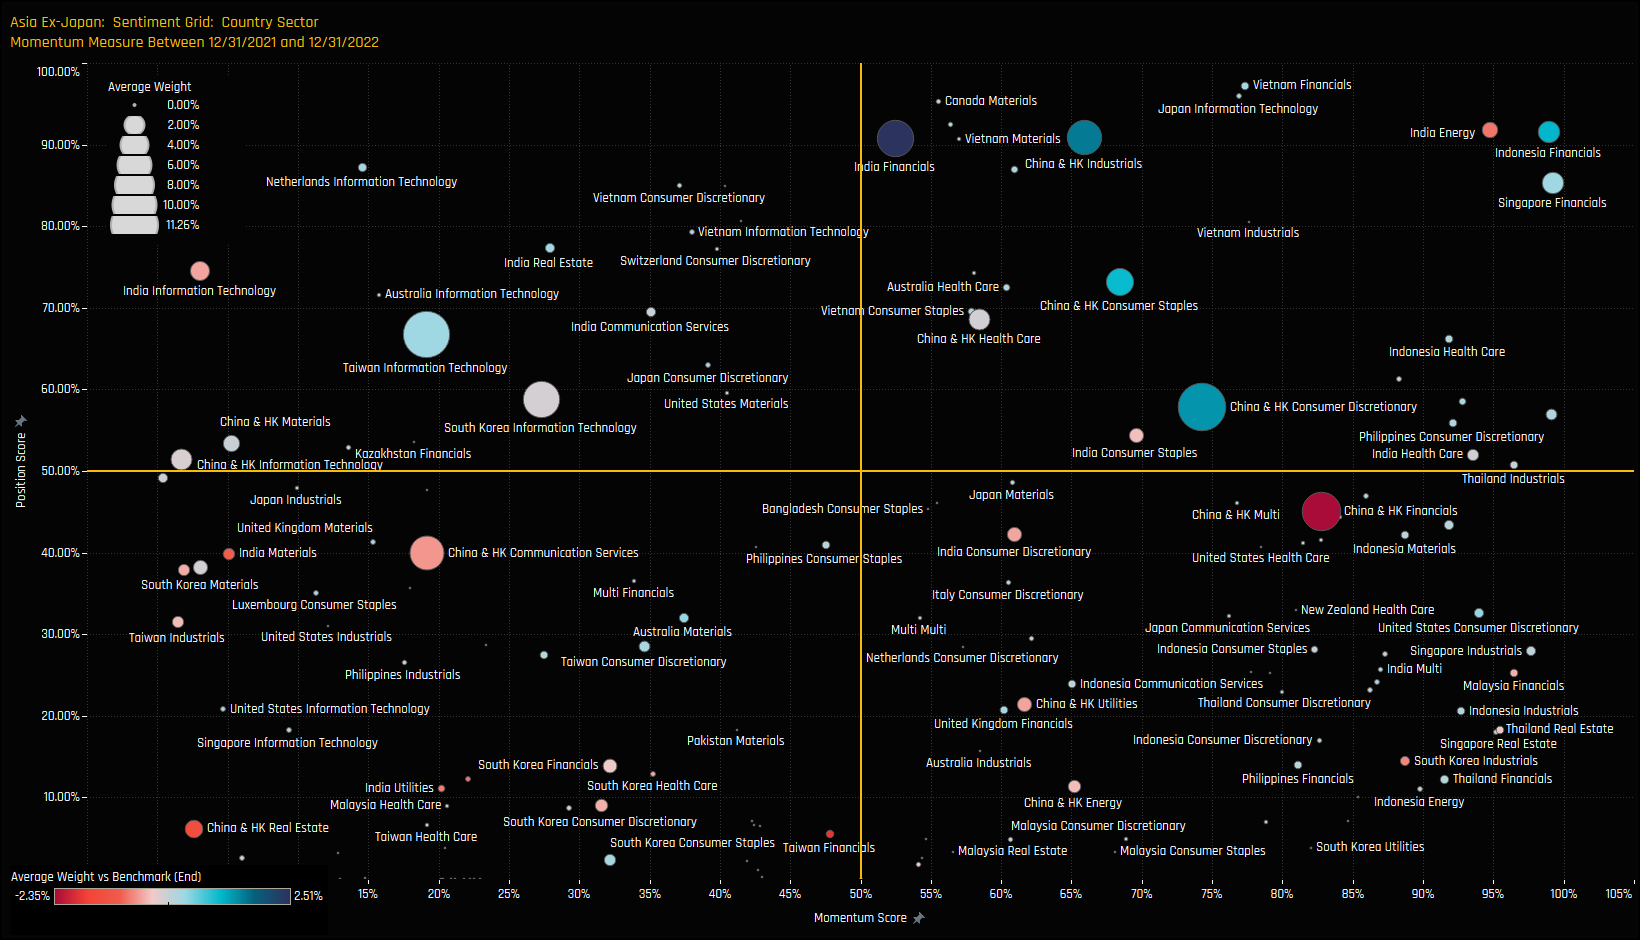
Country Sector Sentiment
The sentiment grid below shows where current positioning in each country/sector sits versus its own history going back to 2011 on a scale of 0-100% (y-axis), against a measure of fund activity for each country/sector between 12/31/2021 and 12/31/2022 (x-axis).
Both India Energy, Indonesia Financials and Singapore Financials appear at the top-right of the grid, having captured strong inflows last year that has taken positioning towards all-time highs. Momentum in the key Technology exposures is soft though positioning is still above mid-range. China & HK Real Estate is as bad as it gets, whilst greenshoots are emerging for key exposures across the ASEAN region.
China Real Estate Focus
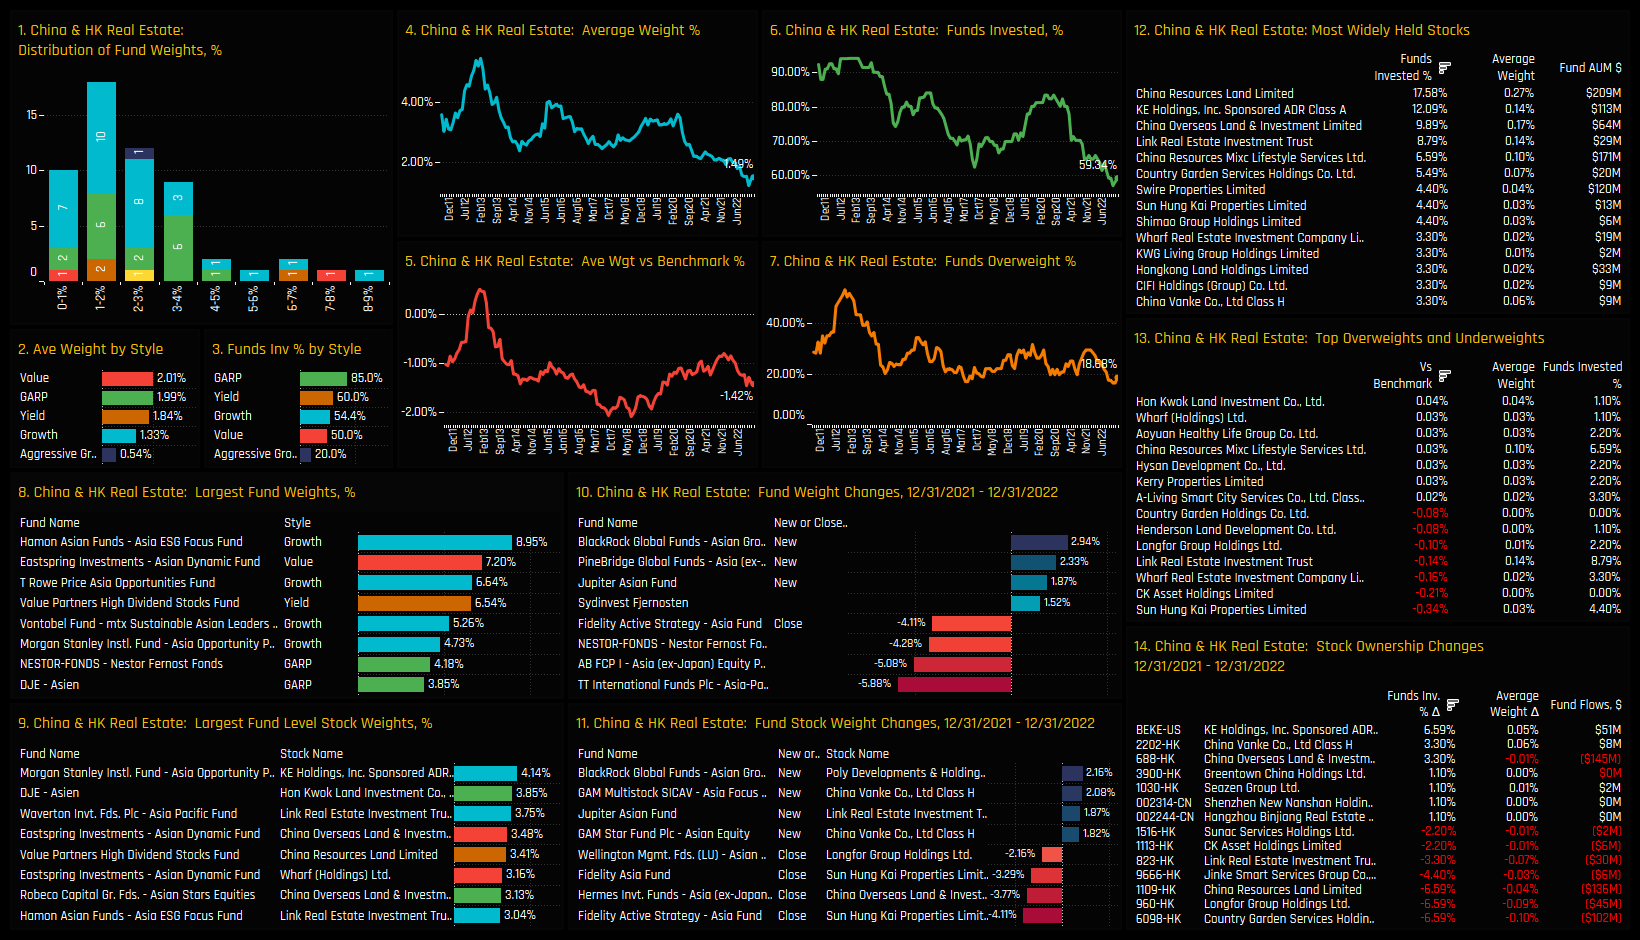
If you’re looking for a non-consensus position for 2023, then look no further than China & HK Real Estate. Positioning has been on a largely downward trend since 2011, with the recent down move since 2020 the most aggressive on record. Positioning is at all-time lows, with average weights of 1.49% and just 59.3% of funds invested, contributing to a net underweight of -1.42%, on average. Asia Ex-Japan investors are mostly anticipating underperformance in the year ahead.
Stock holdings within the sector are extremely light. The most widely held name is China Resources Land Limited, owned by 17.6% of managers at an average weight of 0.27%. Underweights are driven by a number of stocks that appear almost totally uninvestible to active managers, led by Sun Hung Kai Properties and CK Asset Holdings Limited. Stock activity through 2022 was skewed to the sell-side, with heavy closures seen in Country Garden Services and Longfor Group Holdings, among others.
Conclusion and Links
This concludes our analysis of top-down positioning among Asia Ex-Japan investors. For data on stock positioning, continue reading below for the latest Stock Radar and an analysis on NAVER positioning among Asia Ex-Japan investors. Finally, click on the link opposite for the latest data report on Asia Ex-Japan active fund positioning
Our latest data on stock positioning and activity among active Asia Ex-Japan Equity managers.
Most Widely Held Stocks
The 30 most widely held stocks among Asia Ex-Japan Active Funds
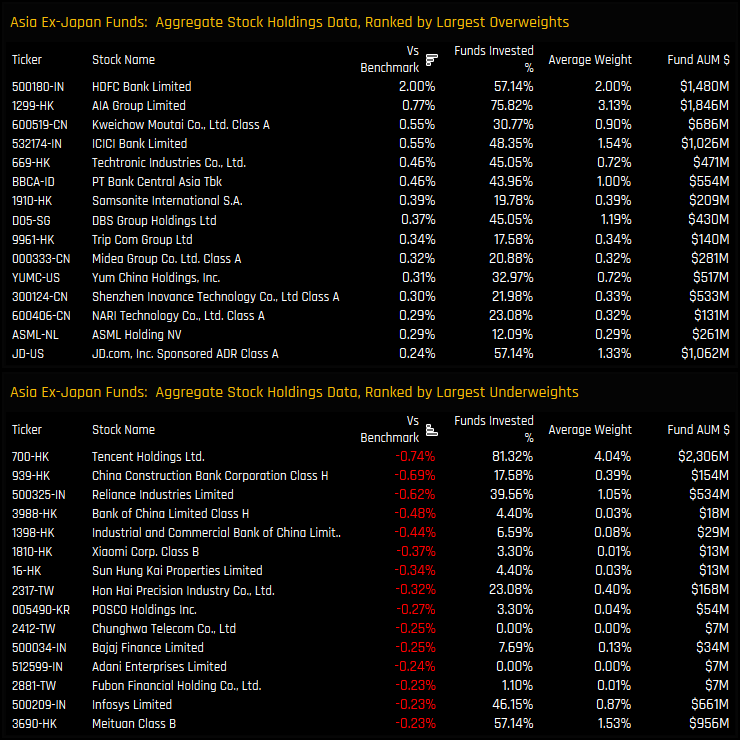
Top Over/Underweights
The top 15 aggregate overweight and underweight stock holdings
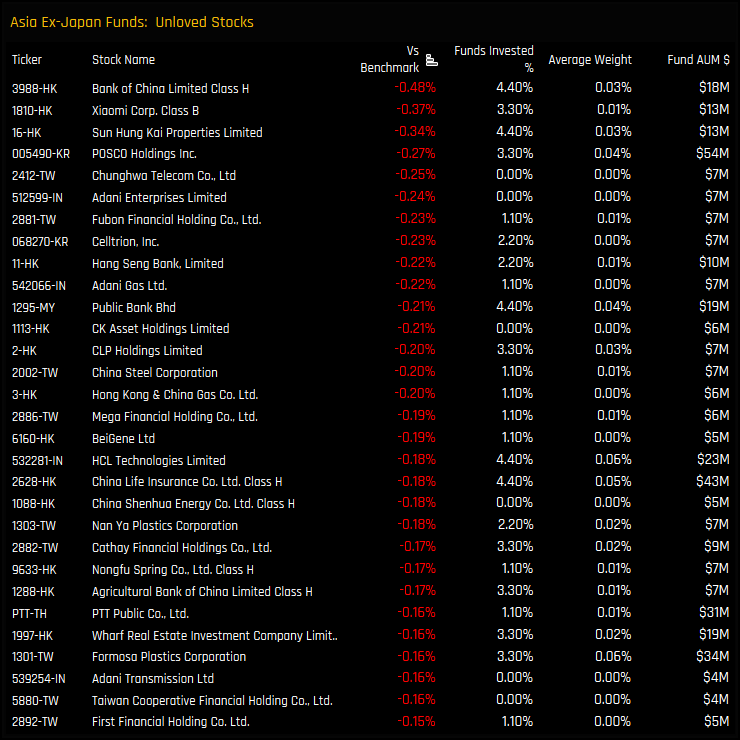
Unloved Stocks
Stocks held by less than 5% of the Asia Ex-Japan managers in our analysis, and net underweight vs the iShares MSCI Asia Ex-Japan ETF (AAXJ)
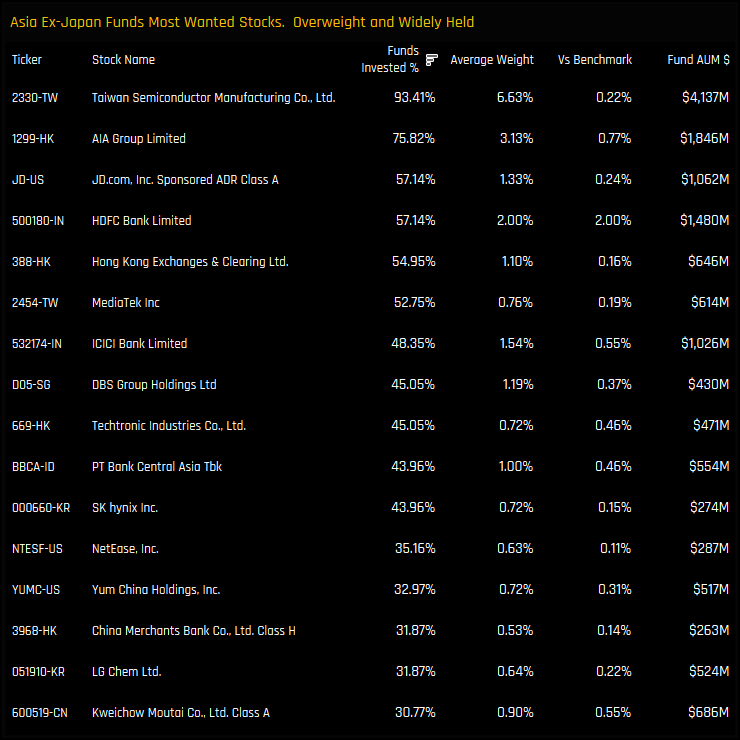
Most Wanted Stocks
Stocks held by more than 30% of the Asia Ex-Japan managers in our analysis, and net overweight vs the iShares MSCI Asia Ex-Japan ETF (AAXJ)
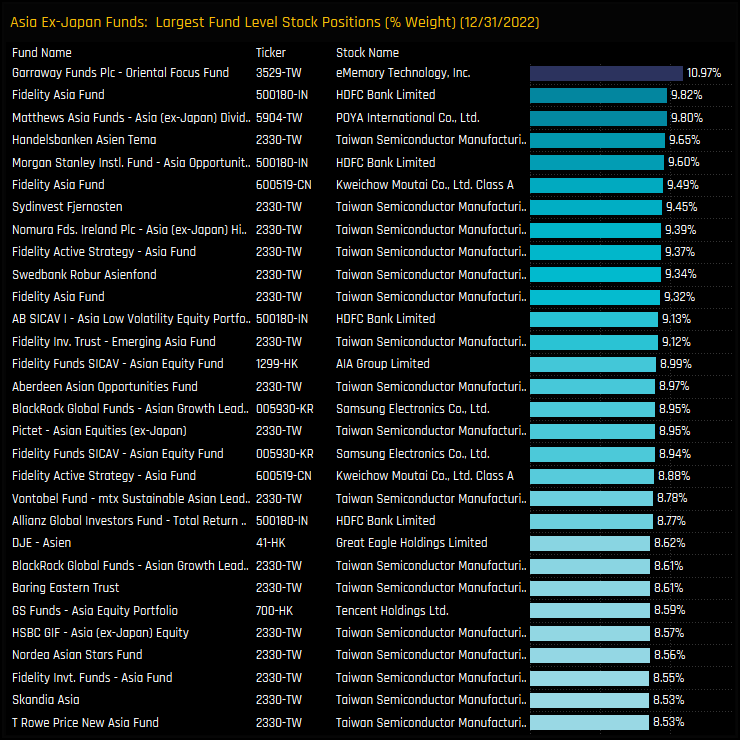
Largest Fund Level Stock Positions, %
The top 30 largest individual fund level stocks positions on a portfolio weight basis.
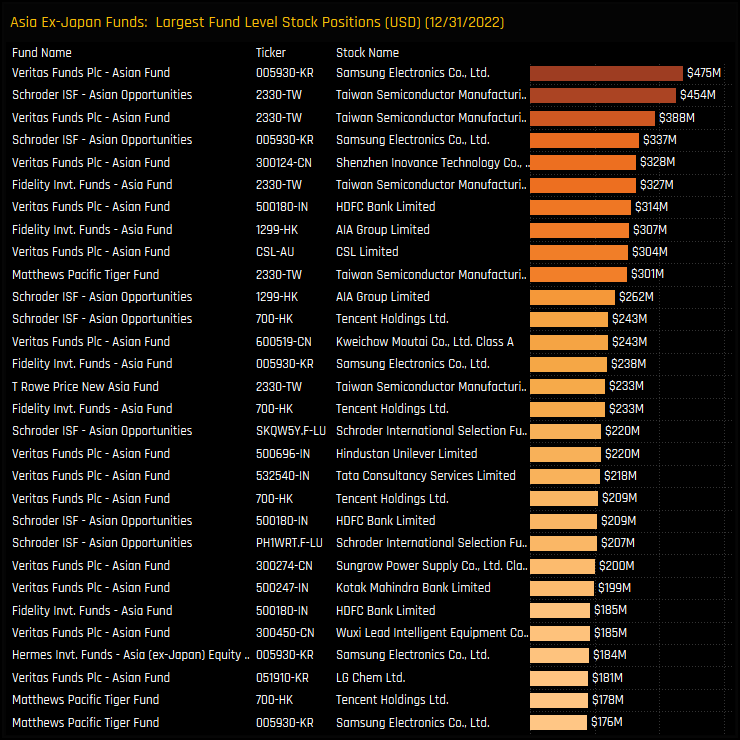
Largest Fund Level Stock Positions, $
The top 30 largest individual fund level stocks positions on a fund AUM basis.
Largest Ownership Increases
The stocks with the largest net increase in the percentage of funds invested between 12/31/2021 and 12/31/2022
Largest Ownership Decreases
The stocks with the largest net decrease in the percentage of funds invested between 12/31/2021 and 12/31/2022
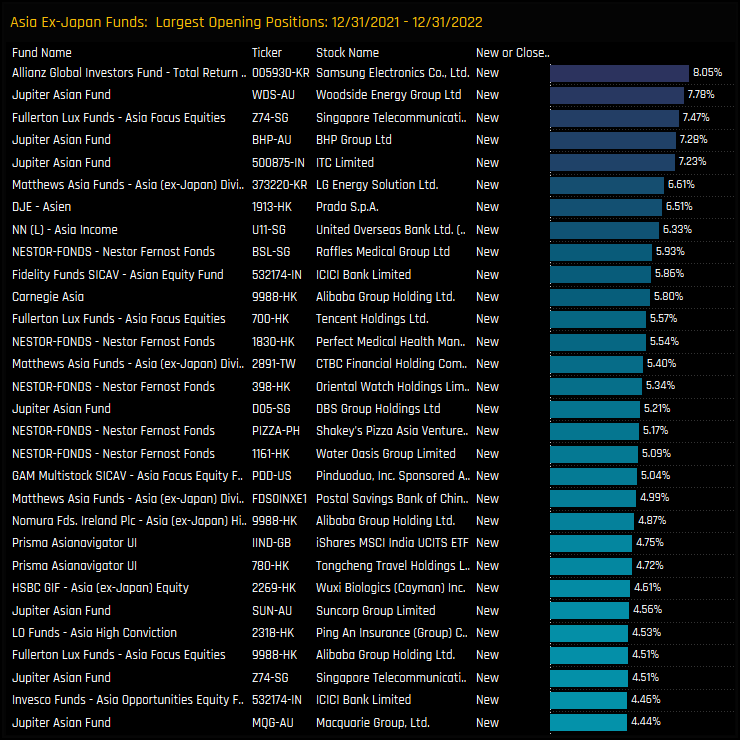
Largest Opening Positions
The largest opening stock positions between 12/31/2021 and 12/31/2022
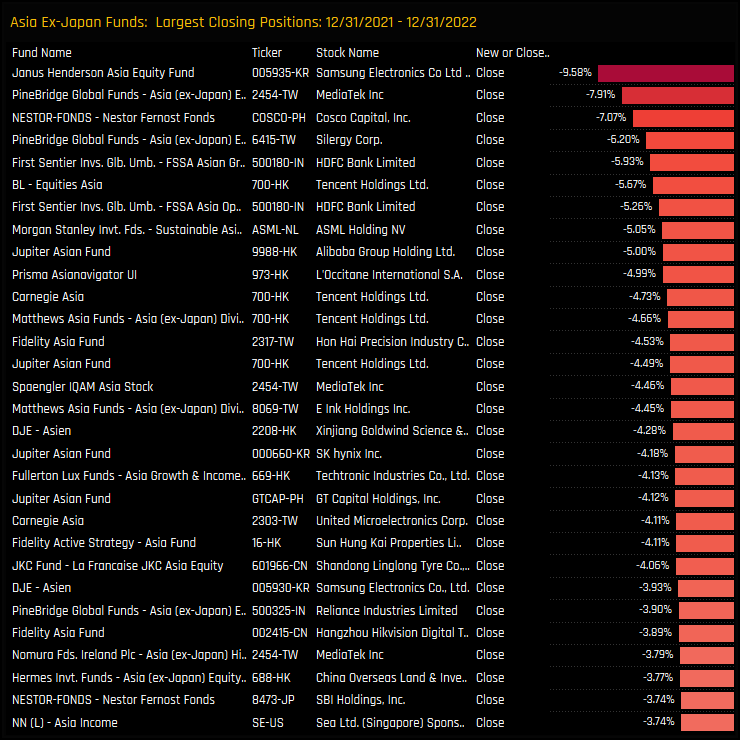
Largest Closing Positions
The largest closing stock positions between 12/31/2021 and 12/31/2022
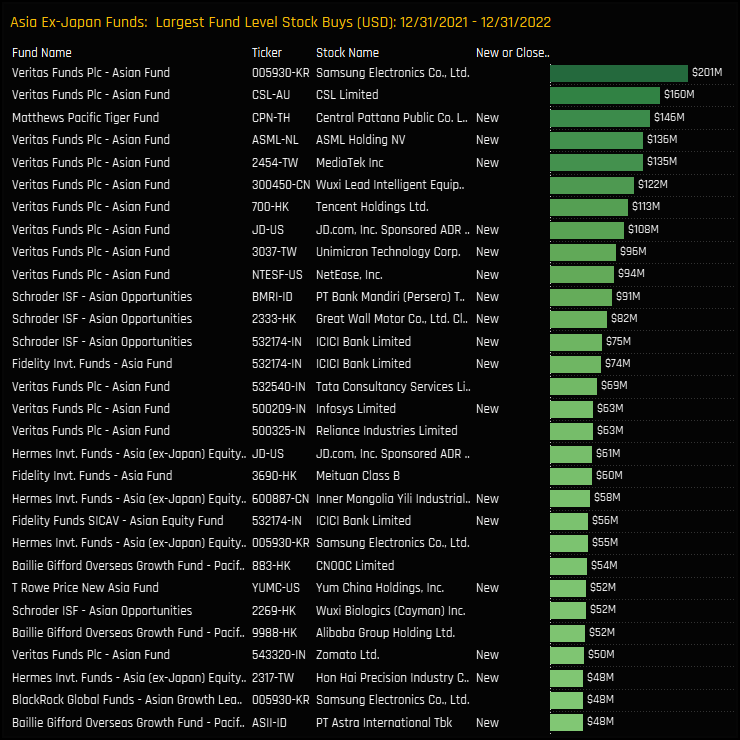
Largest Fund Level $ Stock Inflows
The largest fund level stock inflows between 12/31/2021 and 12/31/2022.
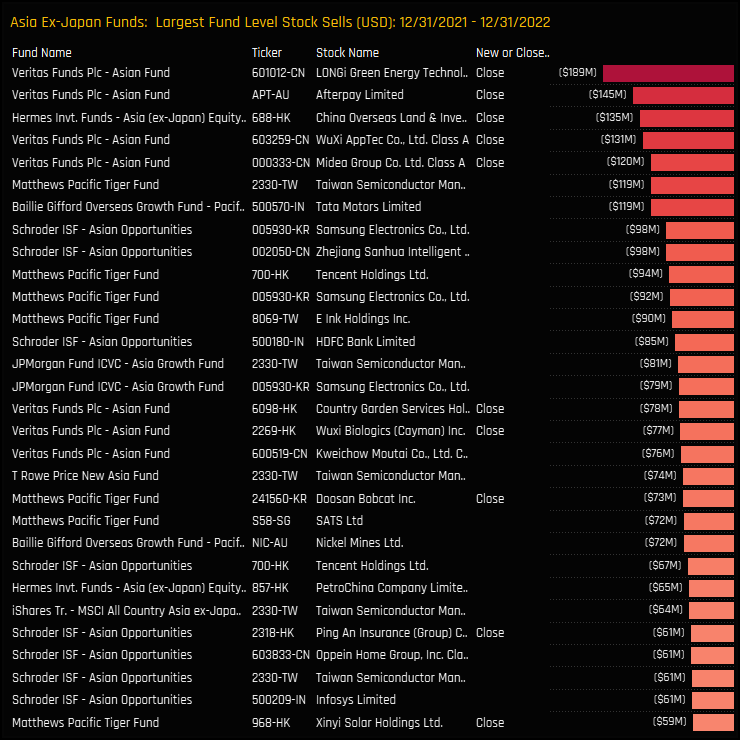
Largest Fund Level $ Stock Outflows
The largest fund level stock outflows between 12/31/2021 and 12/31/2022.
91 Active Asia Ex-Japan Funds, AUM $55bn
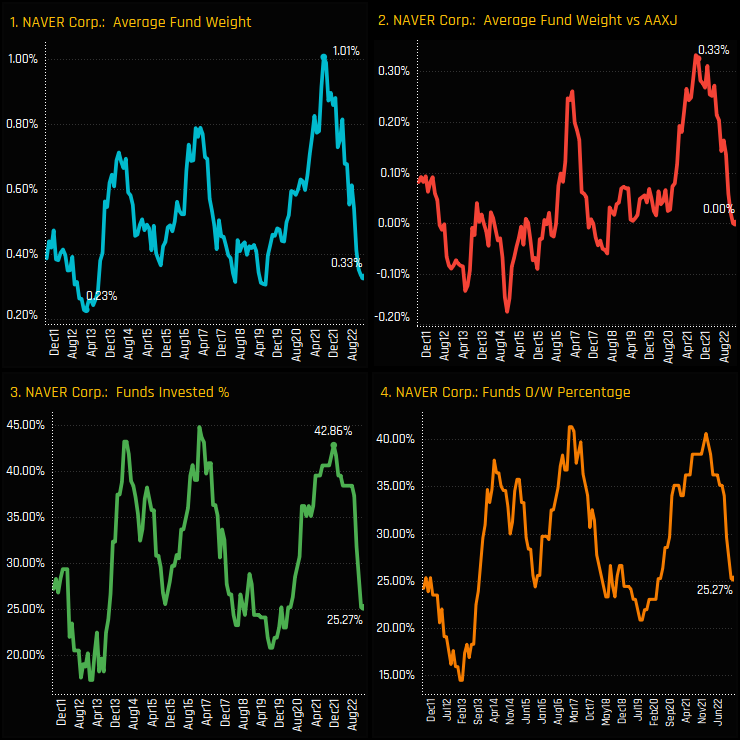
NAVER Corp: Back to the Lows
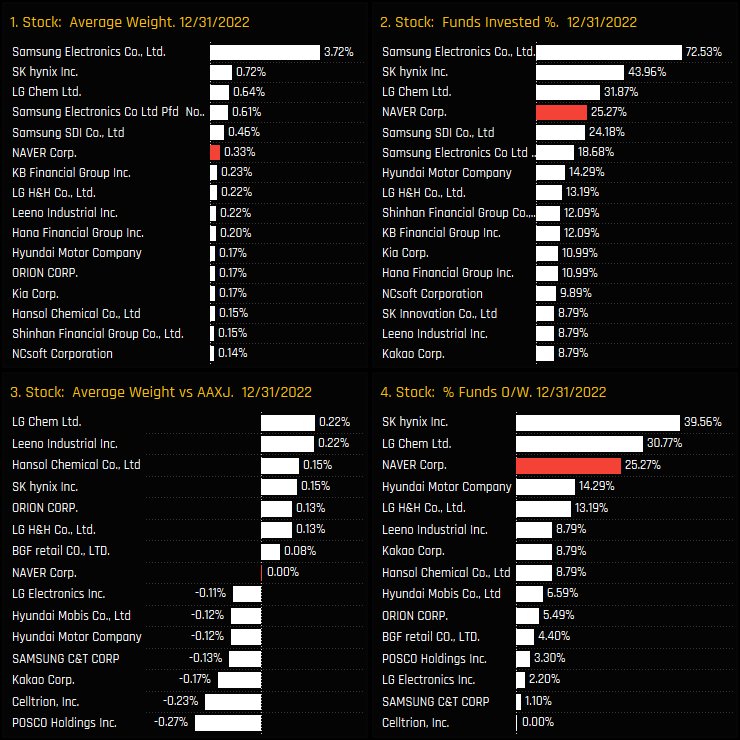
Sentiment towards NAVER Corp among Asia Ex-Japan funds has significantly declined. In late 2021, over 40% of the funds in our analysis were invested in the company, but a surge of selling has decreased ownership levels to just 25.3%, close to the lowest on record. Commensurate with this exodus, average weights have fallen from 1% to 0.33% and overweights from 0.33% to flat.
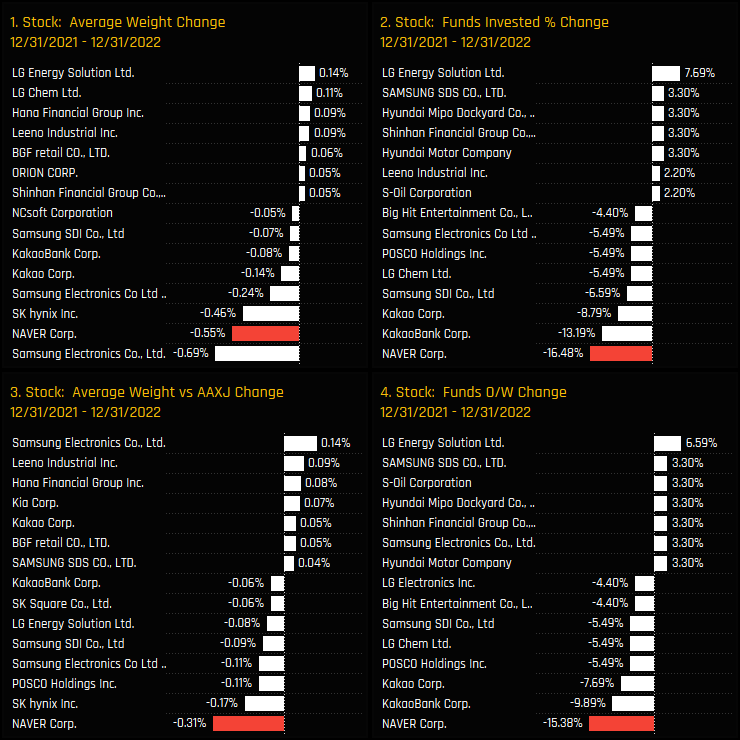
Exposure towards South Korean stocks has taken a dive over the last 12-months, with NAVER Corp at the heart of the moves lower. Over the last 6-months, NAVER Corp saw the largest decrease in ownership among South Korean peers, losing investment from 16.5% of the managers in our analysis, with absolute and relative weight moves among the worst in the country.
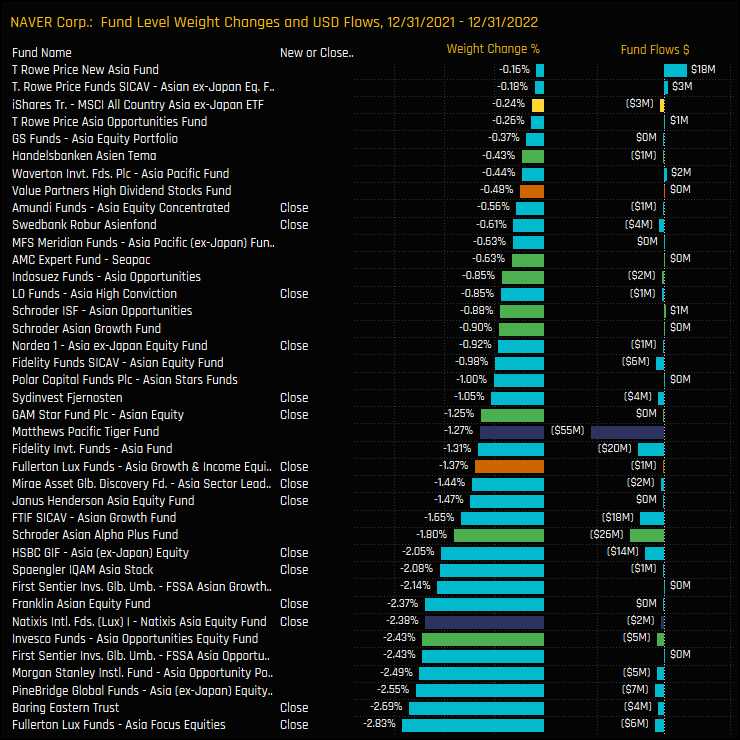
Fund Holdings & Activity
The below chart shows the changes in holding weight in NAVER Corp for all the funds in our Asia Ex-Japan analysis through 2022. The majority of funds either reduced exposure or closed positions entirely, led by Fullerton Asia Focus (-2.83%) and Baring Eastern Trust (-2.69%).
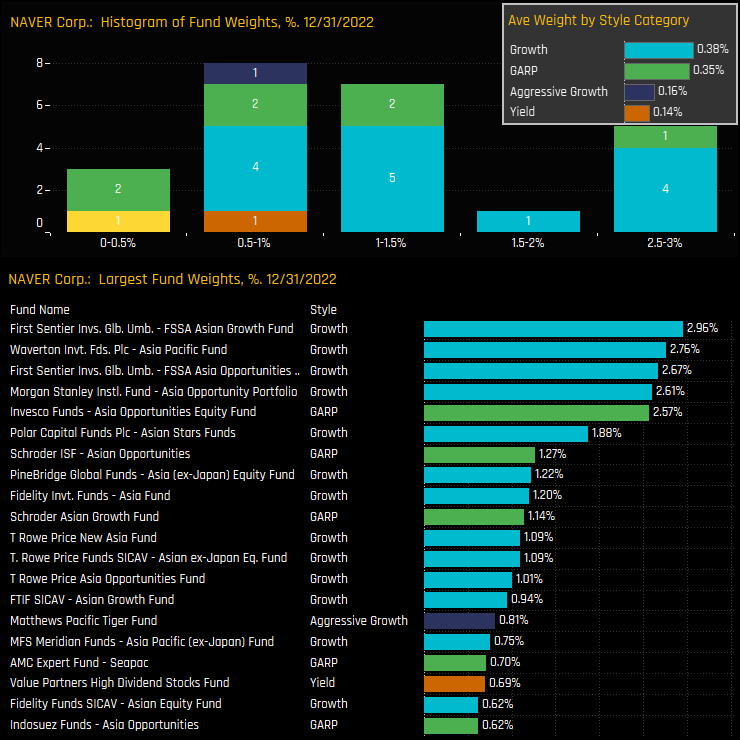
Whilst this has severely trimmed the holdings register, NAVER Group is still held by over a quarter of Asia Ex-Japan investors. Growth and GARP funds are the key allocators, and though most hold less than a 1.5% stake, 6 funds hold more, led by First Sentier Asian Growth (2.96%) and Waverton Asia Pacific Growth (2.76%).
Conclusions & Data Report
NAVER Corp has seen an aggressive fall in ownership among Asia Ex-Japan investors in recent months. Whilst this fall in exposure is part of a broader rotation out of South Korea, NAVER appears to have borne the brunt.
From being the 2nd most widely held stock in South Korea to now the 4th, Naver’s relevance to Asia Ex-Japan investors has declined. However, analysis of past ownership trends suggests a constant cycle of rising and falling ownership, with each cycle lasting between 1 and 2-years. As wise man once said, “be greedy when others are fearful’. Perhaps today’s depressed levels represent something of an opportunity.
For more analysis, data or information on active investor positioning in your market, please get in touch with me on steven.holden@copleyfundresearch.com


