Asia Ex-Japan Fund Positioning Analysis, September 2023
In this issue:
Information Technology: Back to Top Overweight After Upward Trend Resumes
China & HK Banks: Depressed Positioning
Baidu: Back in the Mix
103 Asia Ex-Japan Funds, AUM $61.4bn
Information Technology: Back to Top Overweight After Upward Trend Resumes
• Technology allocations resume their upward trends after bottoming out in September last year.
• Technology has been a key beneficiary of sector rotation, with South Korea and Taiwan Tech the drivers behind the moves.
• Technology moves to the top sector weight and top overweight. Active managers are expecting outperformance.
Time Series & Sector Activity
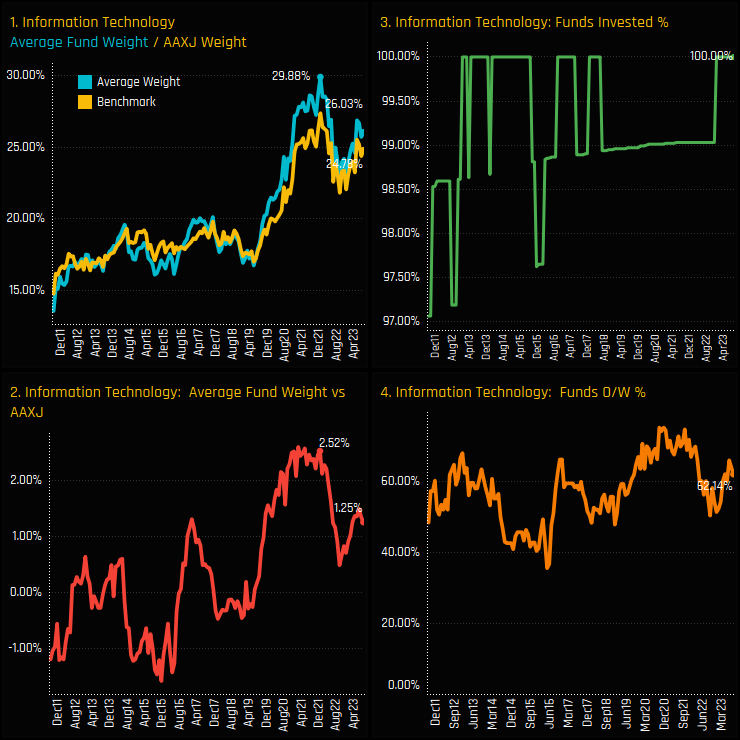
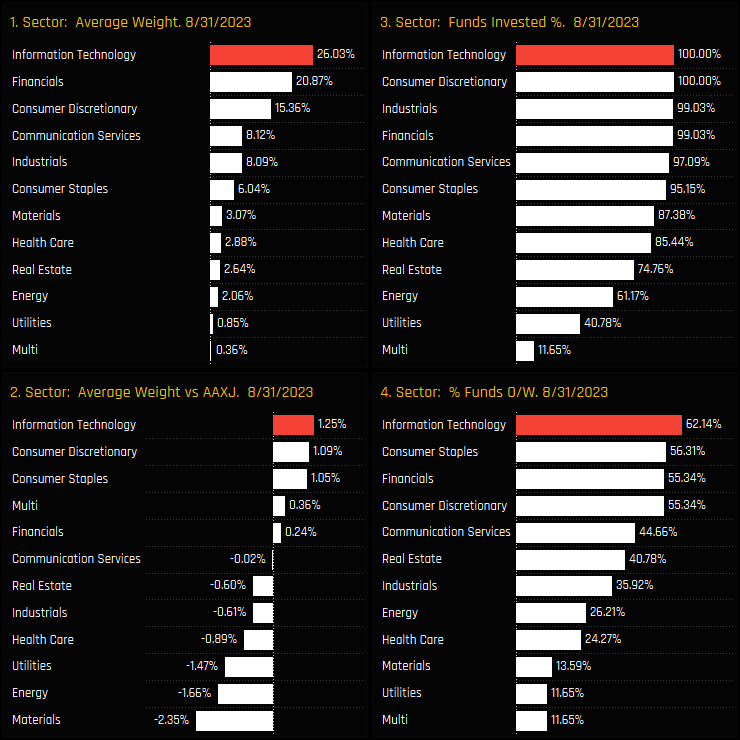
Information Technology weights among active Asia Ex-Japan investors are on the rise again. Average holding weights stand at 26.03%, rallying from the September 2022 lows of 22.3% but still someway from the December 2021 highs of 29.9%. These levels of exposure represent an overweight versus the iShares MSCI Asia Ex-Japan ETF of +1.25%, with 62.1% of funds positioned ahead of the benchmark.
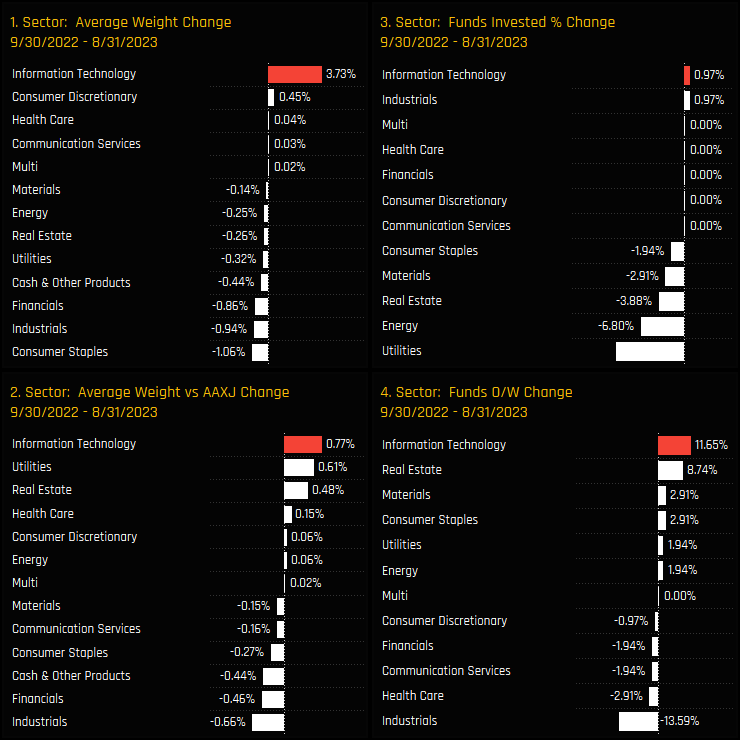
Fund level activity since the lows of September last year show Technology as a key beneficiary of sector rotation. Average weights increased by +3.73%, offsetting declines in Consumer Staples, Industrials and Financials weights. A further 11.65% of funds moved to an overweight stance, pushing the net overweight versus the iShares MSCI Asia Ex-Japan ETF higher by +0.77%.
Fund Activity and Latest Holdings
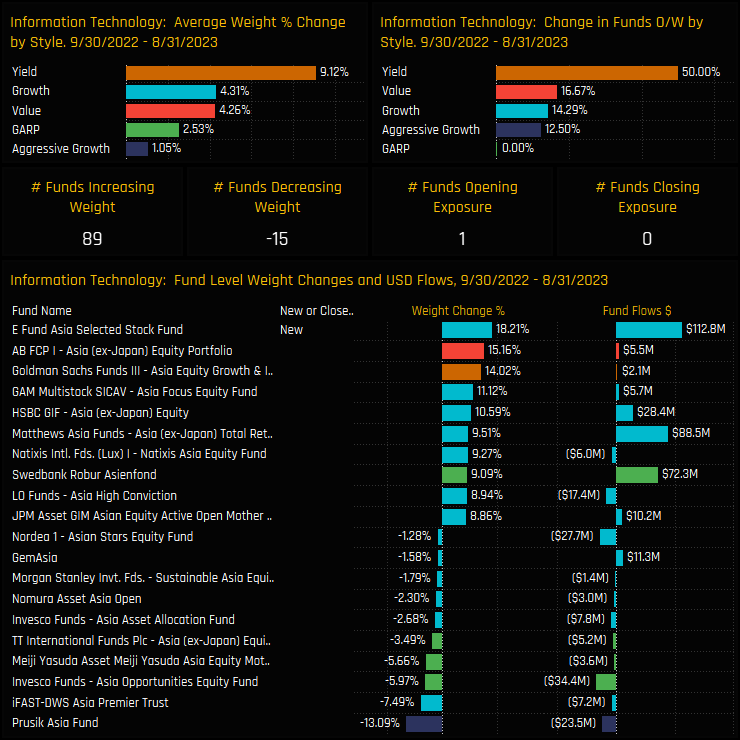
The fund level activity driving this rotation can be seen in the charts below. Between 09/30/2022 and 08/31/2023, average fund weights increased across all the Style groups, led by Yield (+9.1%) and Growth (+4.3%). Single fund weight increases were led by new positions from E Fund Asia Selected Stock (+18.2%) and large increases from AB Asia Ex-Japan (+15.16%) and Goldman Sachs Asia Equity Growth & Income (+14%).
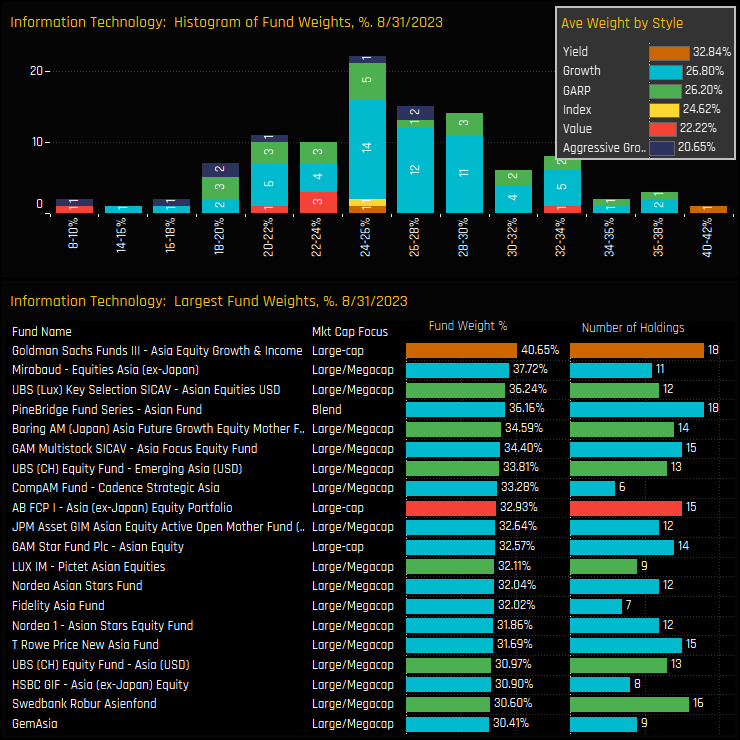
This histogram of fund weights in the Technology sector shows the majority of holders allocating between 20% and 30%, with the more bullish strategies led by Goldman Sachs Asia Equity Growth & Income (40.65%) and Mirabaud Equities Asia (37.7%). Most funds tend to spread their Technology exposure across 5 to 15 companies, considerably less than the 150 that are in the iShares MSCI Asia Ex-Japan ETF.
Country Positioning & Activity
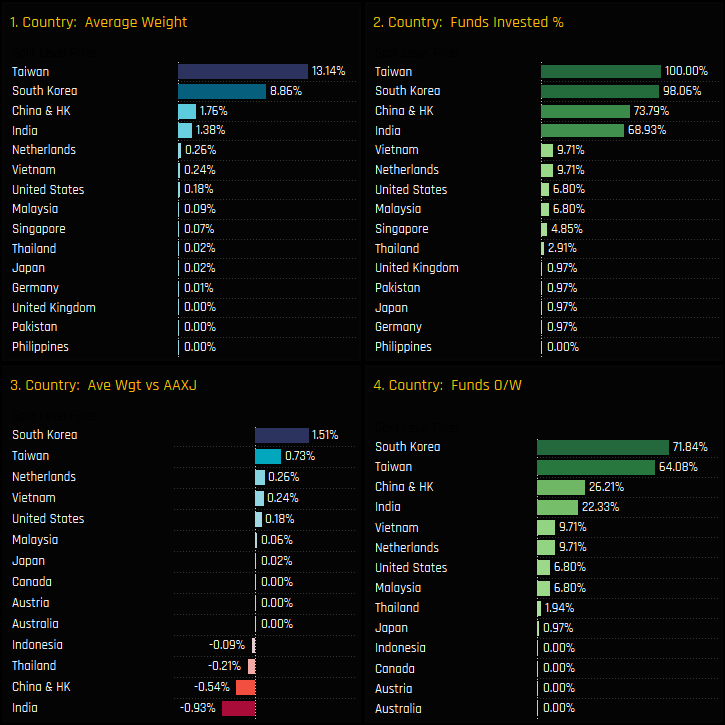
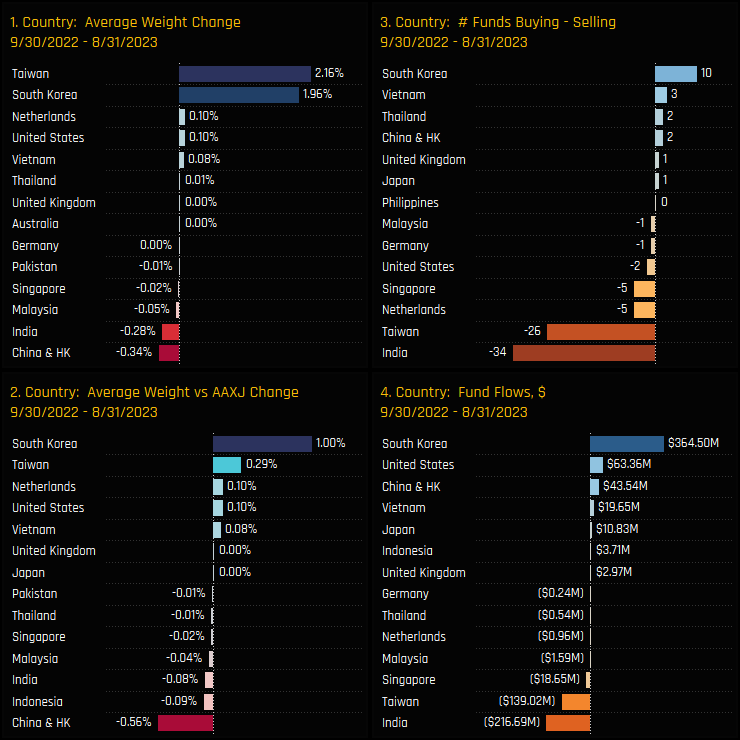
Country level positioning within the Technology sector is dominated by Taiwan and South Korea. Together they account for 84.5% of the total Tech allocation, with every fund in our analysis holding some exposure to Taiwan Tech and 98.1% to South Korean Tech. Against the benchmark, South Korea and Taiwan Technology are key overweight positions for active managers, with 71.8% and 64.1% positioned overweight respectively. India and China & HK Technology stocks occupy a much smaller weight, with both countries held underweight the benchmark, on average.
Country level activity between 09/30/2022 and 08/31/2023 highlights both Taiwan and South Korea as the key drivers of the overall increase in Information Technology weight. Average fund weights increased by 2.16% for Taiwan and 1.96% for South Korea, but of the 2 South Korea benefited more from ‘active’ rotation. South Korean Technology stocks captured an excess of buyers over sellers, positive fund flows and a big change in the net overweight. India and Taiwan Tech, in contrast, saw an excess of sellers and net fund outflows.
Stock Holdings & Activity
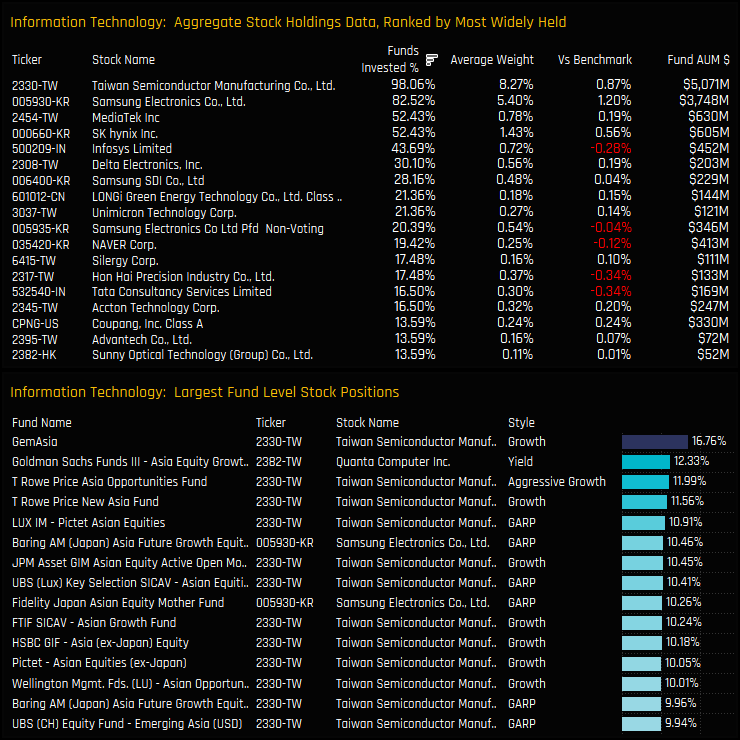
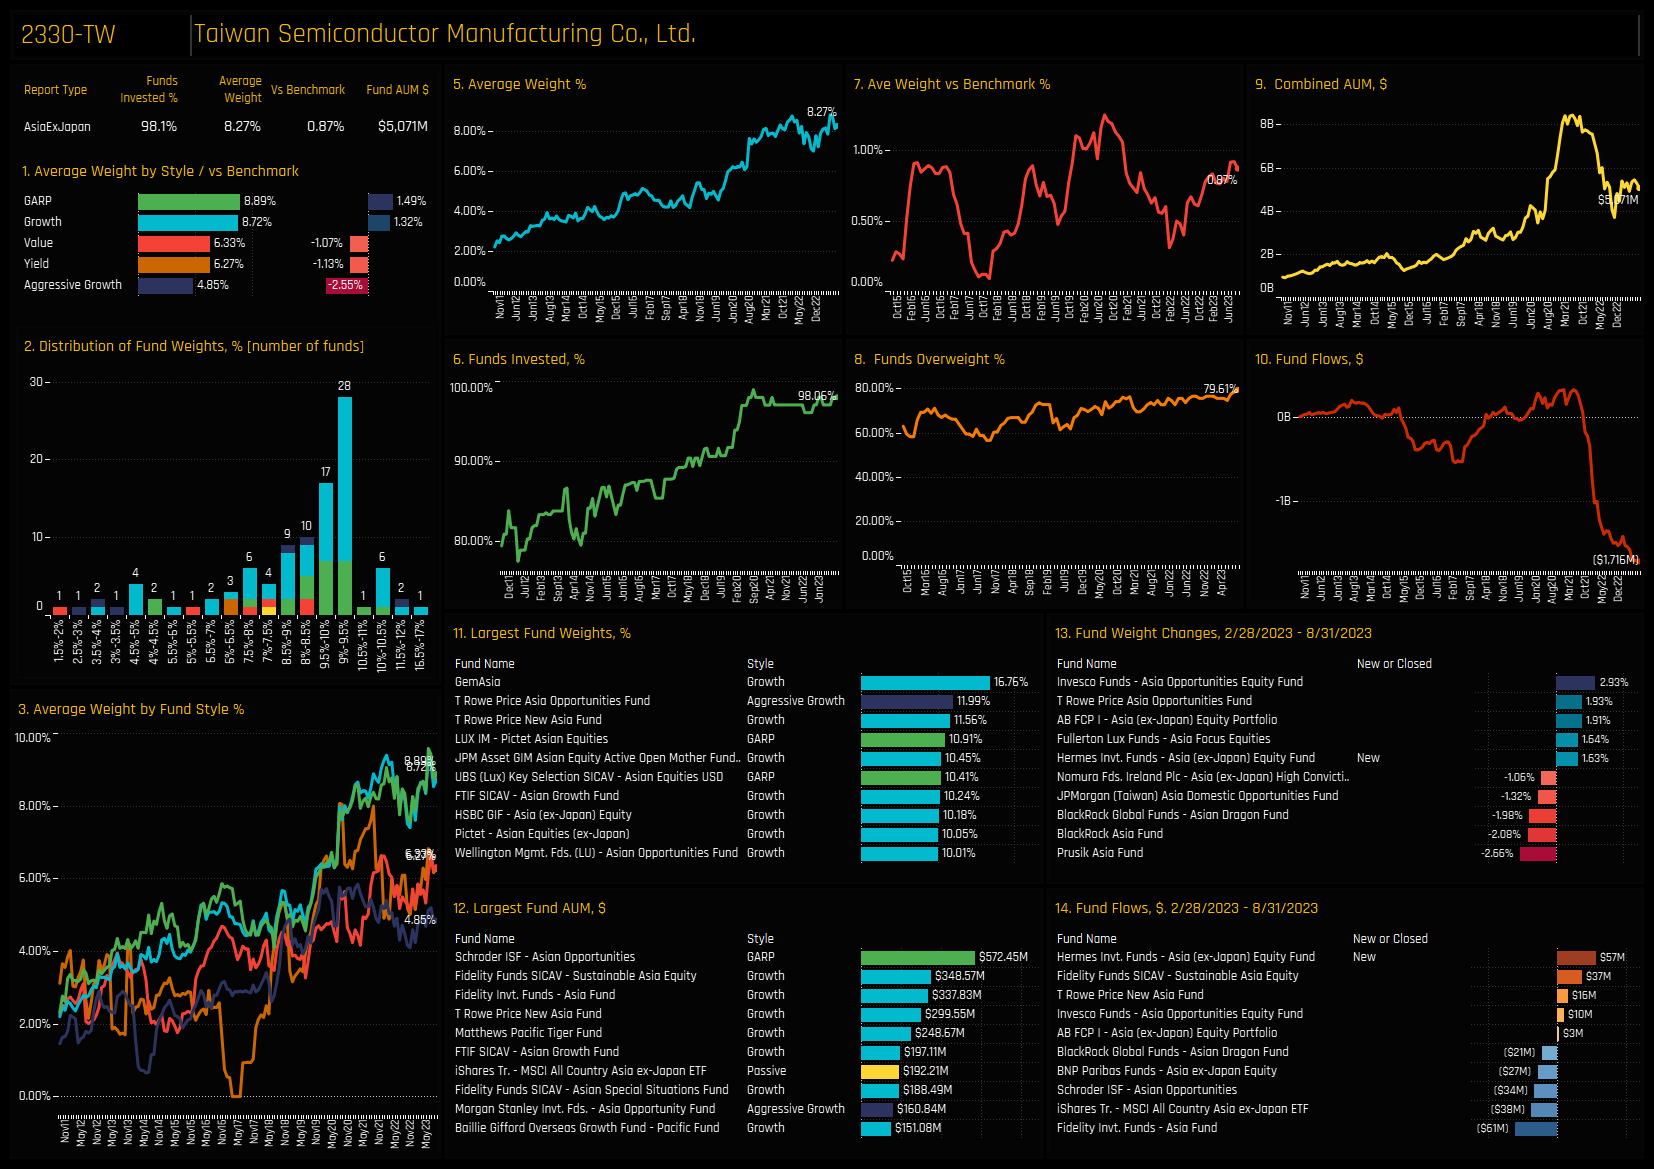
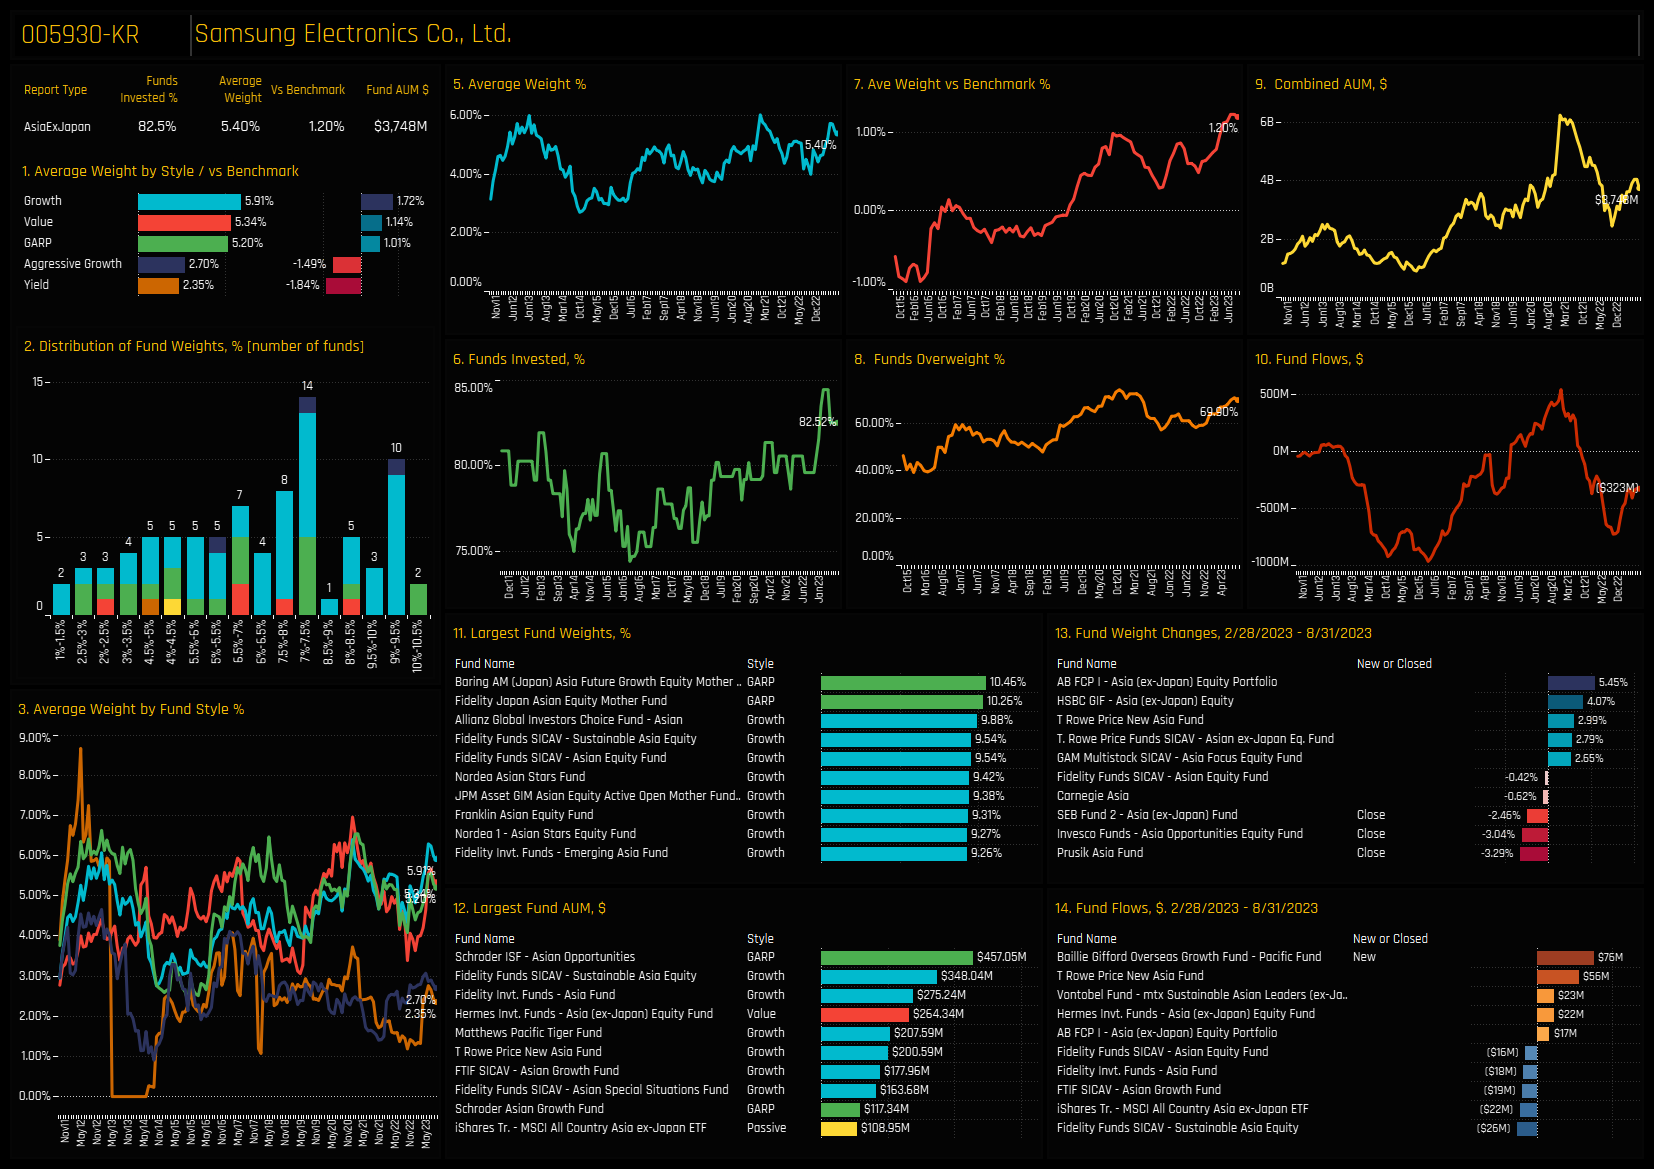
Stock holdings in the Information Technology sector run deep. Six companies are held by more than 30% of managers, though TSMC and Samsung Electronics are the sector leaders by some distance. TSMC is held by 98.1% of funds at an average weight of 8.27%, more than most country allocations outside of the big 4. Samsung Electronics is the key overweight, held on average +1.2% above benchmark. The key underweights are in Xiaomi Corp (not shown as held by just 1 fund), Infosys Limited and Hon Hai Precision.
Stock level activity between 09/30/2022 and 08/31/2023 shows a number of companies seeing significant changes in ownership among the funds in our analysis. The percentage of funds invested in Delta Electronics and Samsung SDI Co increased by +8.74%, with smaller gains seen across Accton Technology, Xiamen Faratronic Co and Largan Precision. Against this, -10.7% of funds closed positions in NAVER Corp and -7.8% closed their Hon Hai Precision and LONGi Green Energy Technology exposure.
Conclusions & Links
The adjacent chart displays the most recent ownership metrics for sectors in Asia Ex-Japan. The recovery from the lows of September 2022 has propelled Information Technology back to the pinnacle of sector allocations among active managers. Moreover, no other sector is more bullishly positioned against the index, with 62.1% of funds overweight at an average +1.25% above benchmark.
On every level, active Asia Ex-Japan investors are expecting Information Technology to outperform.
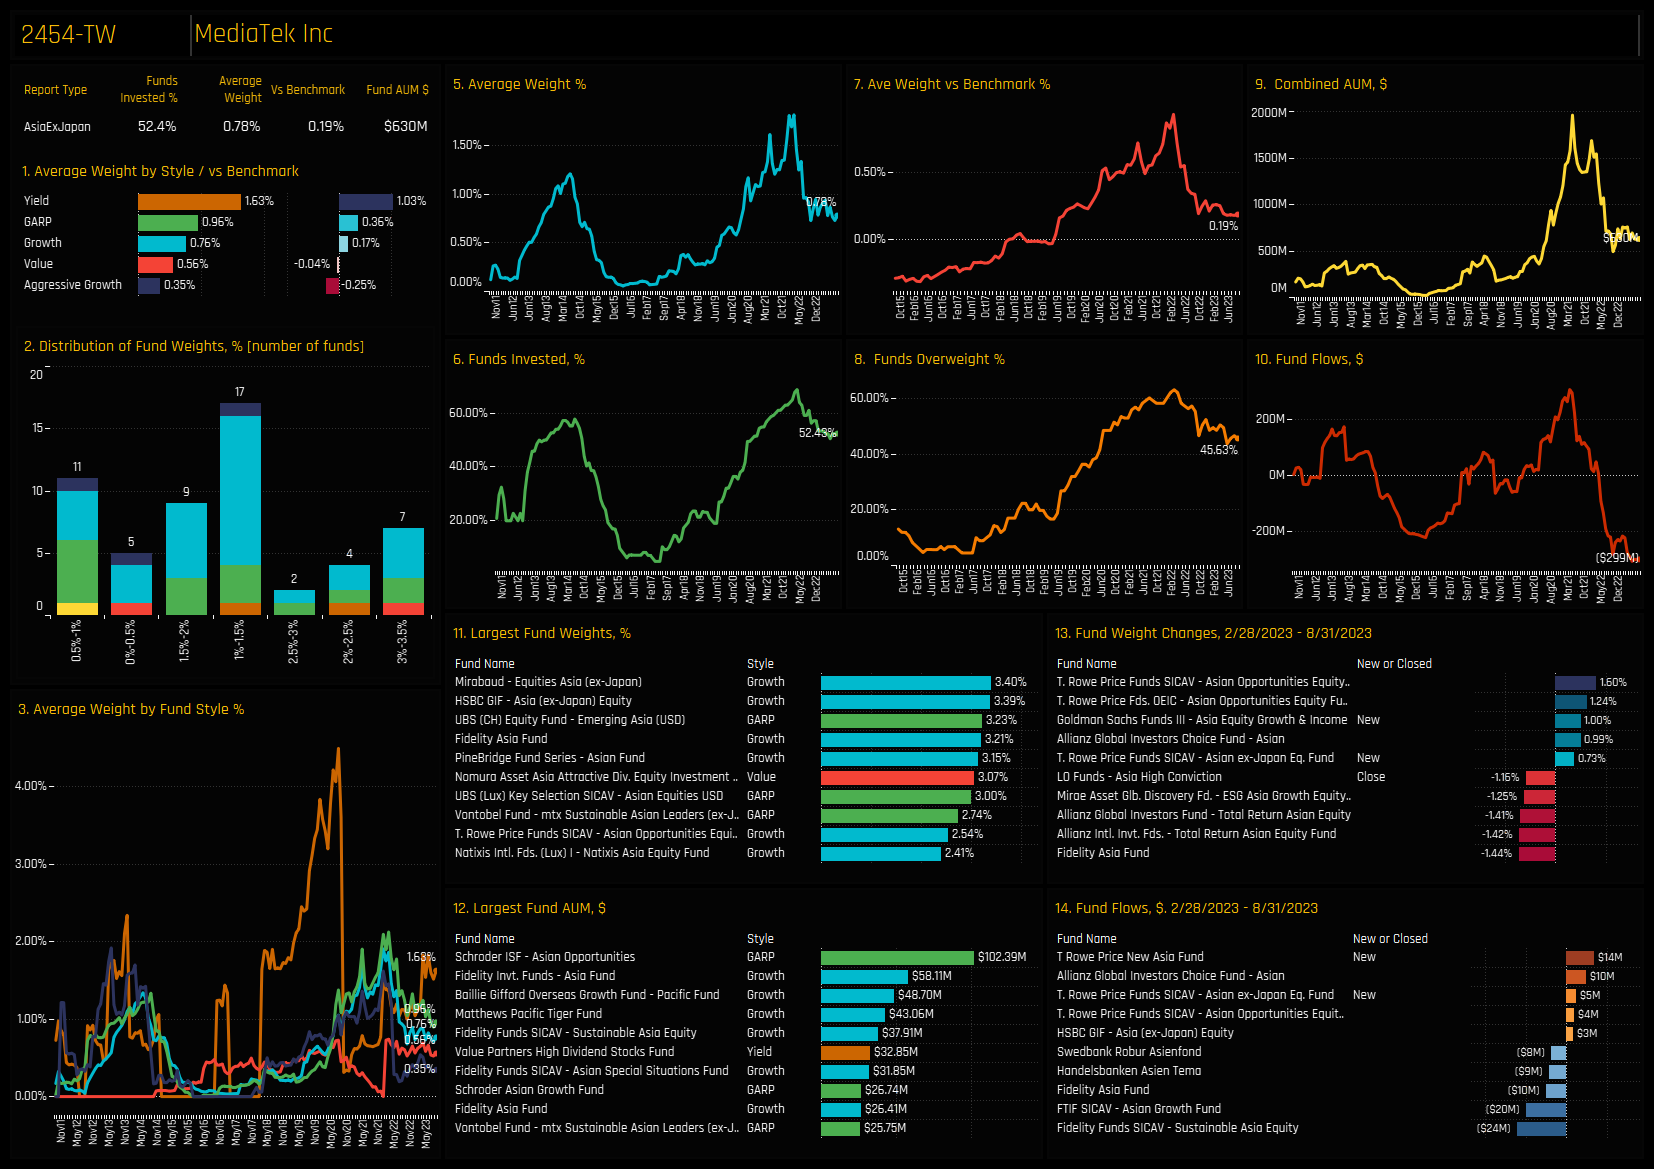
Click below for the extended data report on Information Technology investor positioning. Scroll down for stock profiles on TSMC, Samsung Electronics and MediaTek.
• Fund exposure to China & HK Banks closes in on lowest levels on record
• Asia Ex-Japan investors prefer Indian and Indonesian Banks, whilst Tech/Internet industry groups dominate portfolios.
• China & HK Banks stand as the largest industry underweight, with 87% of funds positioned below the benchmark. Underperformance is expected.
Time-Series & Country/Industry Activity
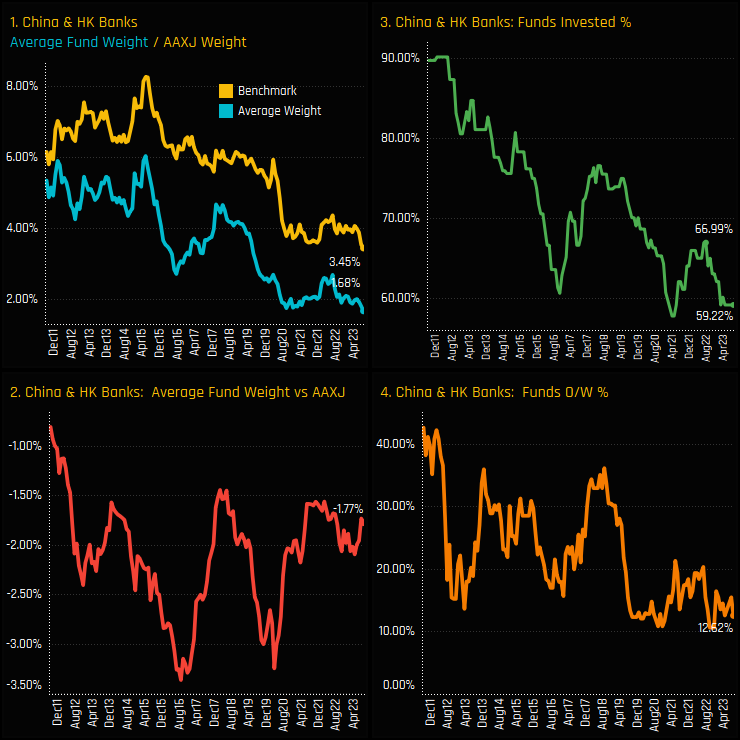
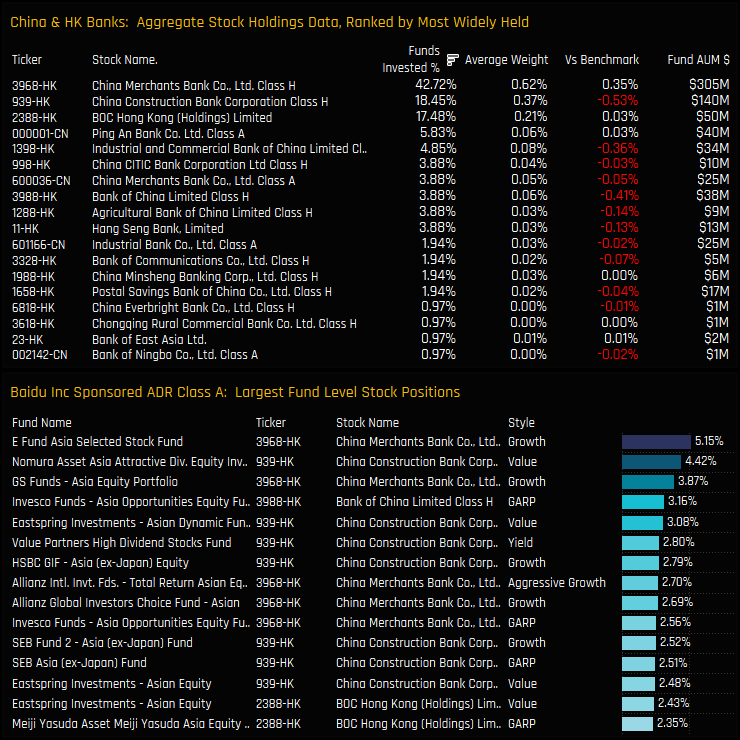
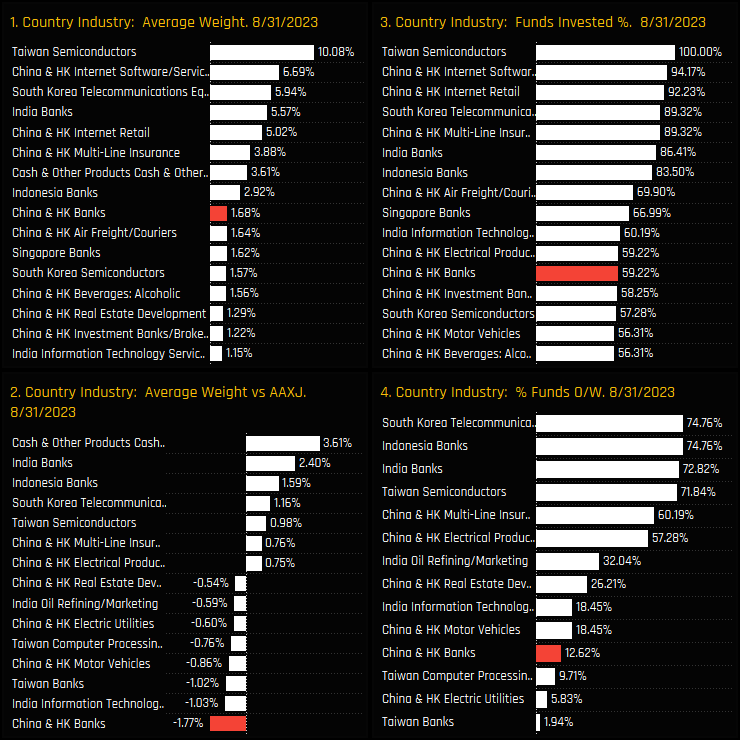
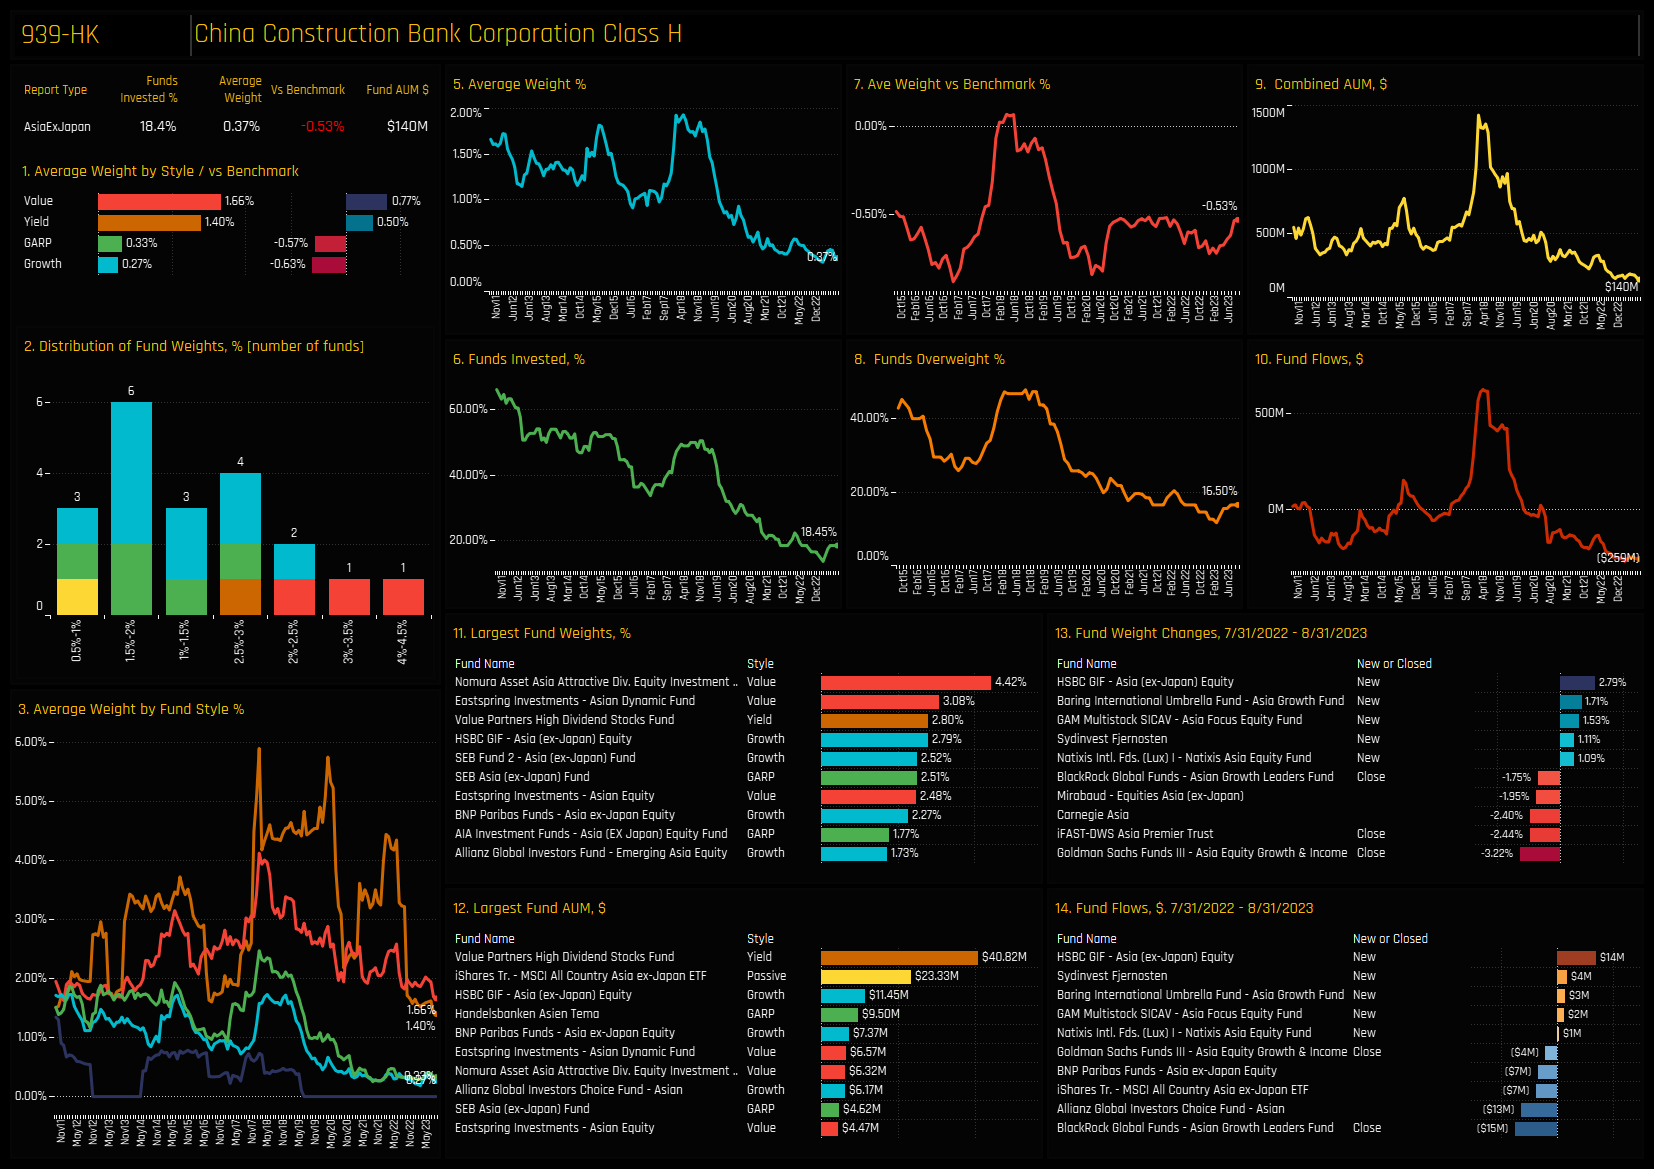
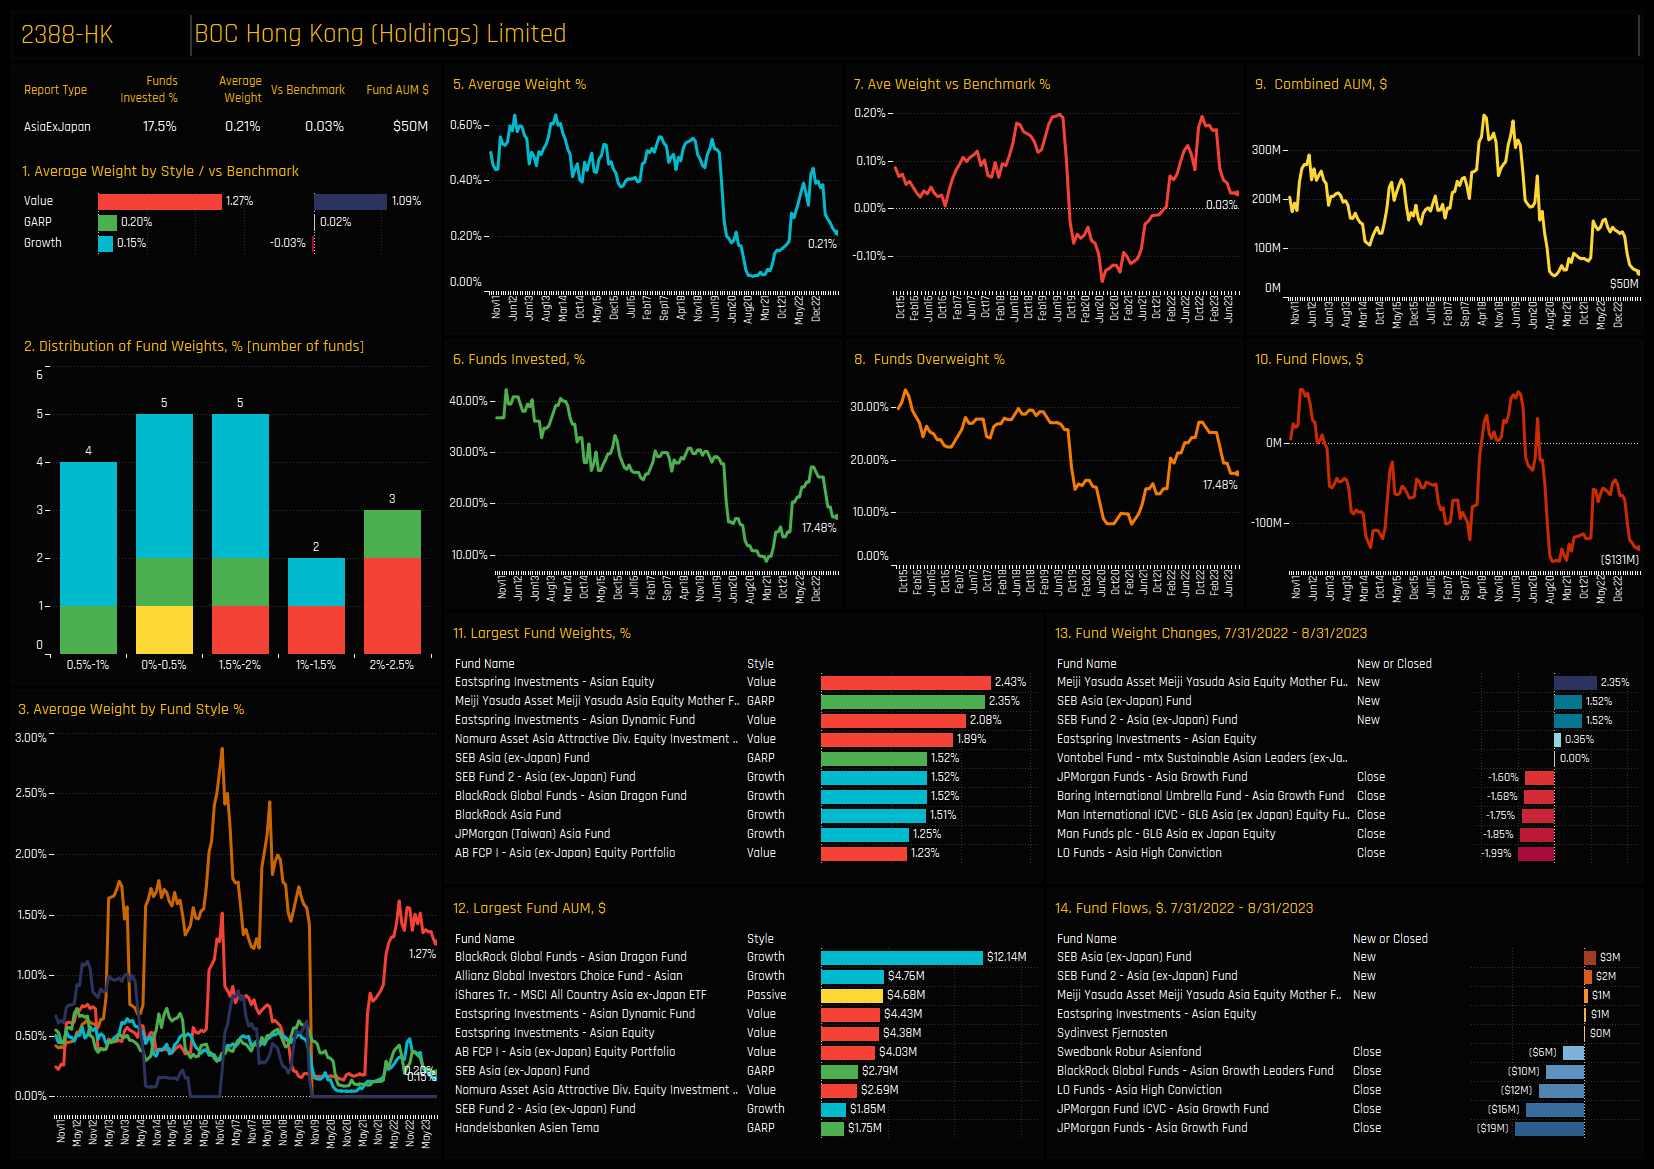
Ownership levels in China & HK Banks are closing in on their lowest levels on record. From ownership of over 90% of funds back in 2011, just 59.2% of the 103 funds in our analysis now have exposure to the industry group (ch3), with average portfolio weights falling to record lows of 1.68% (ch1). Versus the benchmark iShares Asia Ex-Japan ETF, active funds are net underweight by -1.77% (ch2), with only 12.6% of managers positioned ahead of the benchmark (ch4). This is far from a bullish picture.
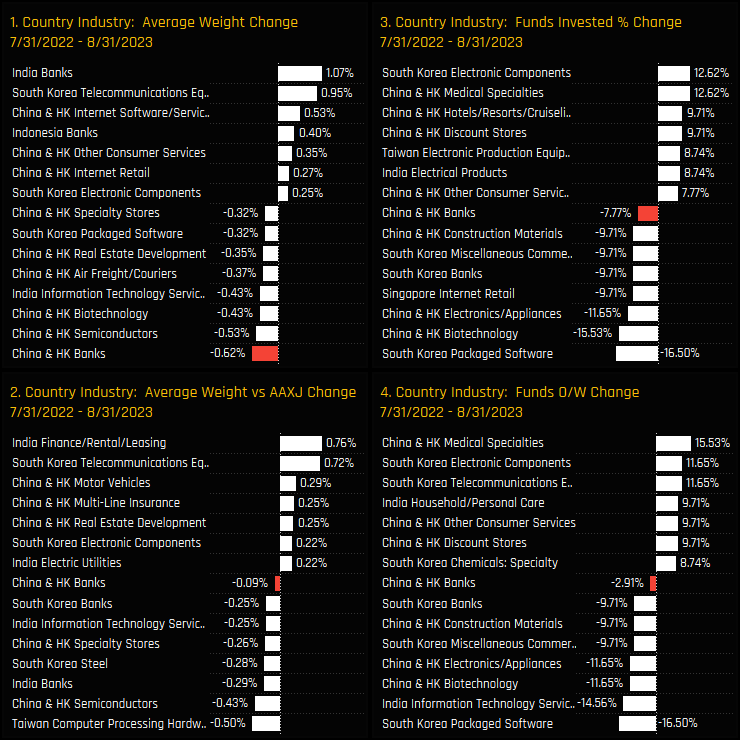
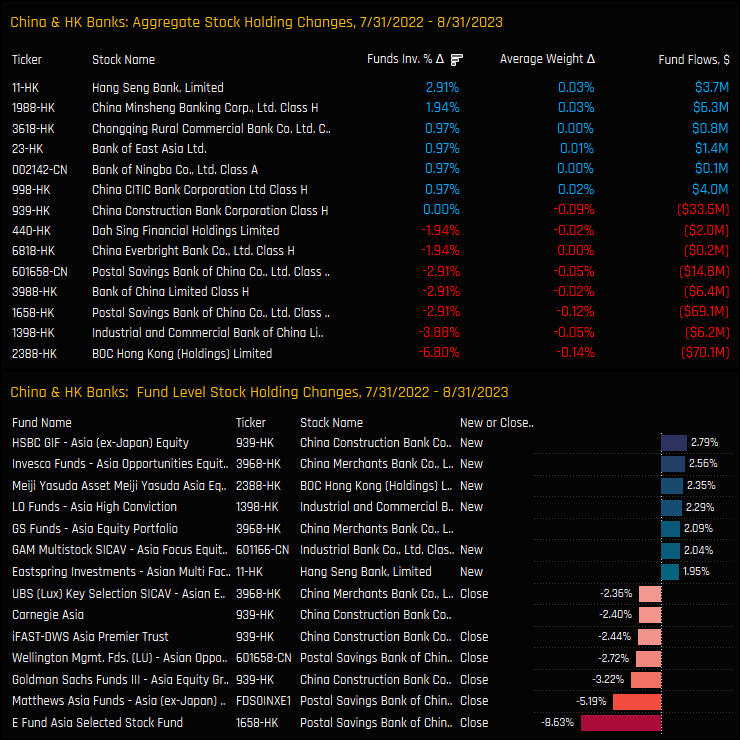
Aggregate fund level activity between the last peak in July 2022 and today only serves to compound the longer-term trend of falling exposure. All 4 measures of fund ownership declined over the period, with -2.9% of funds moving to underweight and -7.7% closing exposure completely. This led to a decline in average weights of -0.62%, the most of any Industry group, and increasing underweights of -0.09%. This has been an active and deliberate rotation away from China & HK Banks.
Fund Holdings & Activity
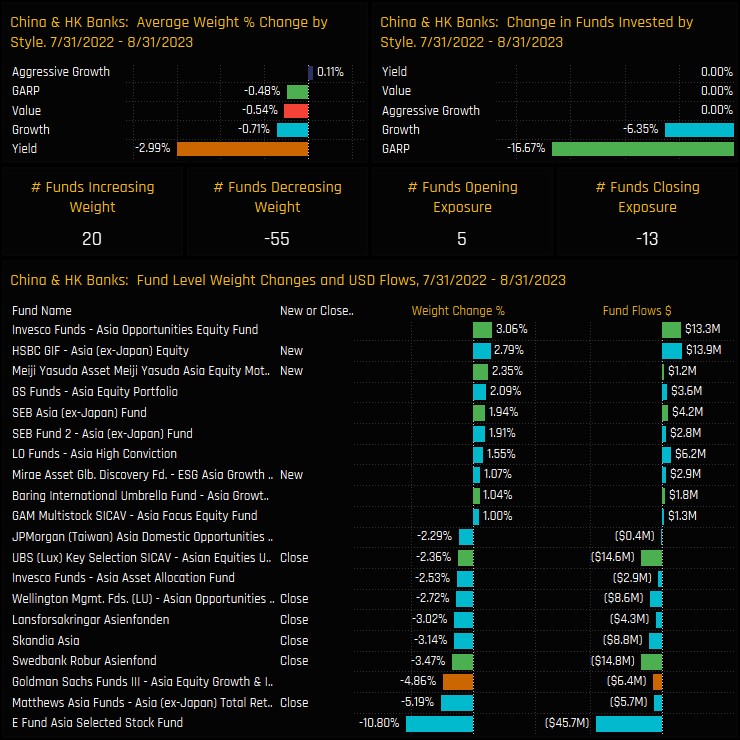
Fund level activity between 07/31/2022 and 08/31/2023 was heavily skewed to the sell-side, with average weights falling for most Style groups and led by Yield (-2.99%) and Growth Funds (-0.71%). Over the period, there were 13 closures versus 5 openings, with E-Fund Asia Selected Stock Fund (-10.8%) and Matthews Asia Ex-Japan Total Return Fund (-5.19%) leading the way.
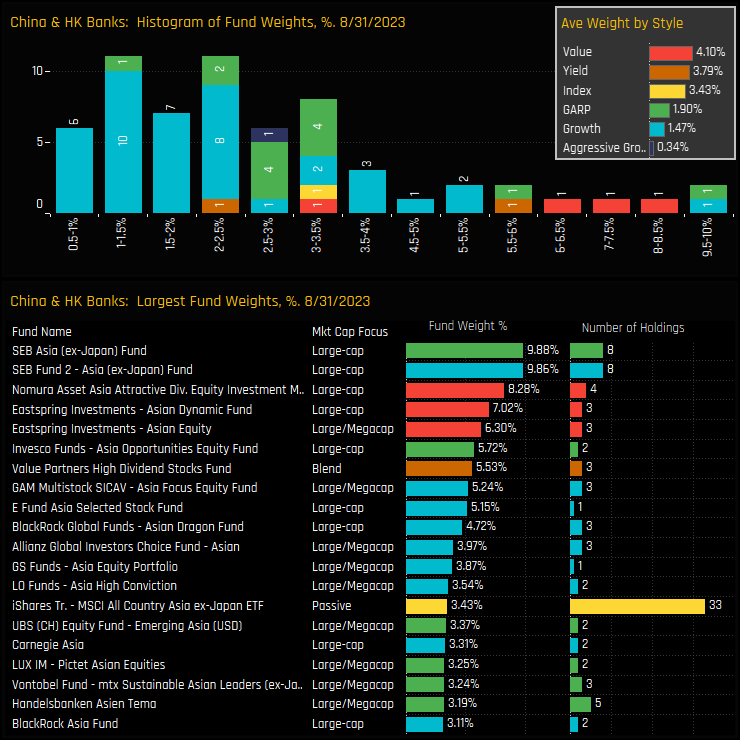
The histogram of fund holdings in the China & HK Banks industry group is shown in the top chart below. It highlights the core of the distribution at between 0.5% and 3.5%, with an extended tail to the upside led by strategies from SEB and Nomura. Note the number of holdings is much smaller than the benchmark, with most funds opting to hold less than 5 China & HK Banks compared to 33 in the iShares MSCI Asia Ex-Japan ETF.
Stock Holdings & Activity
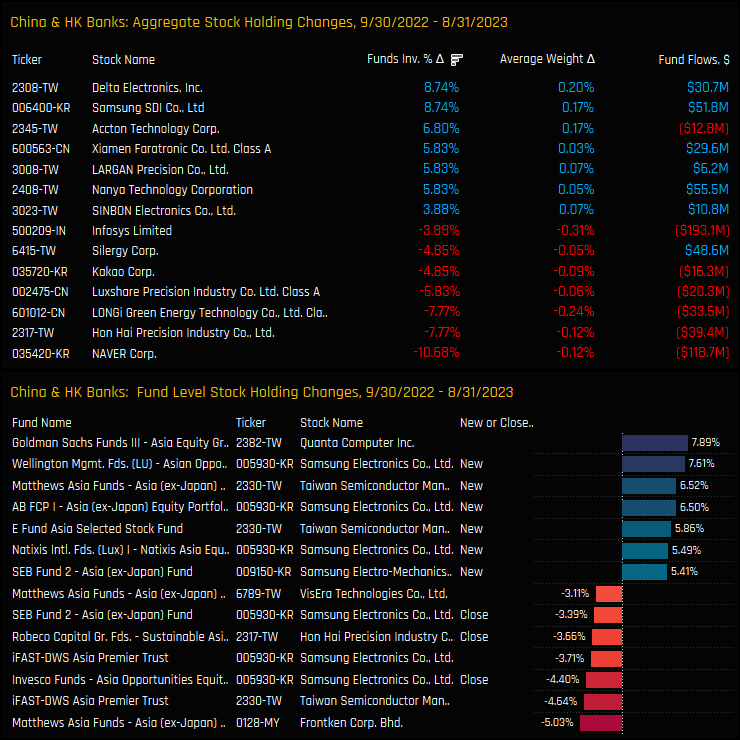
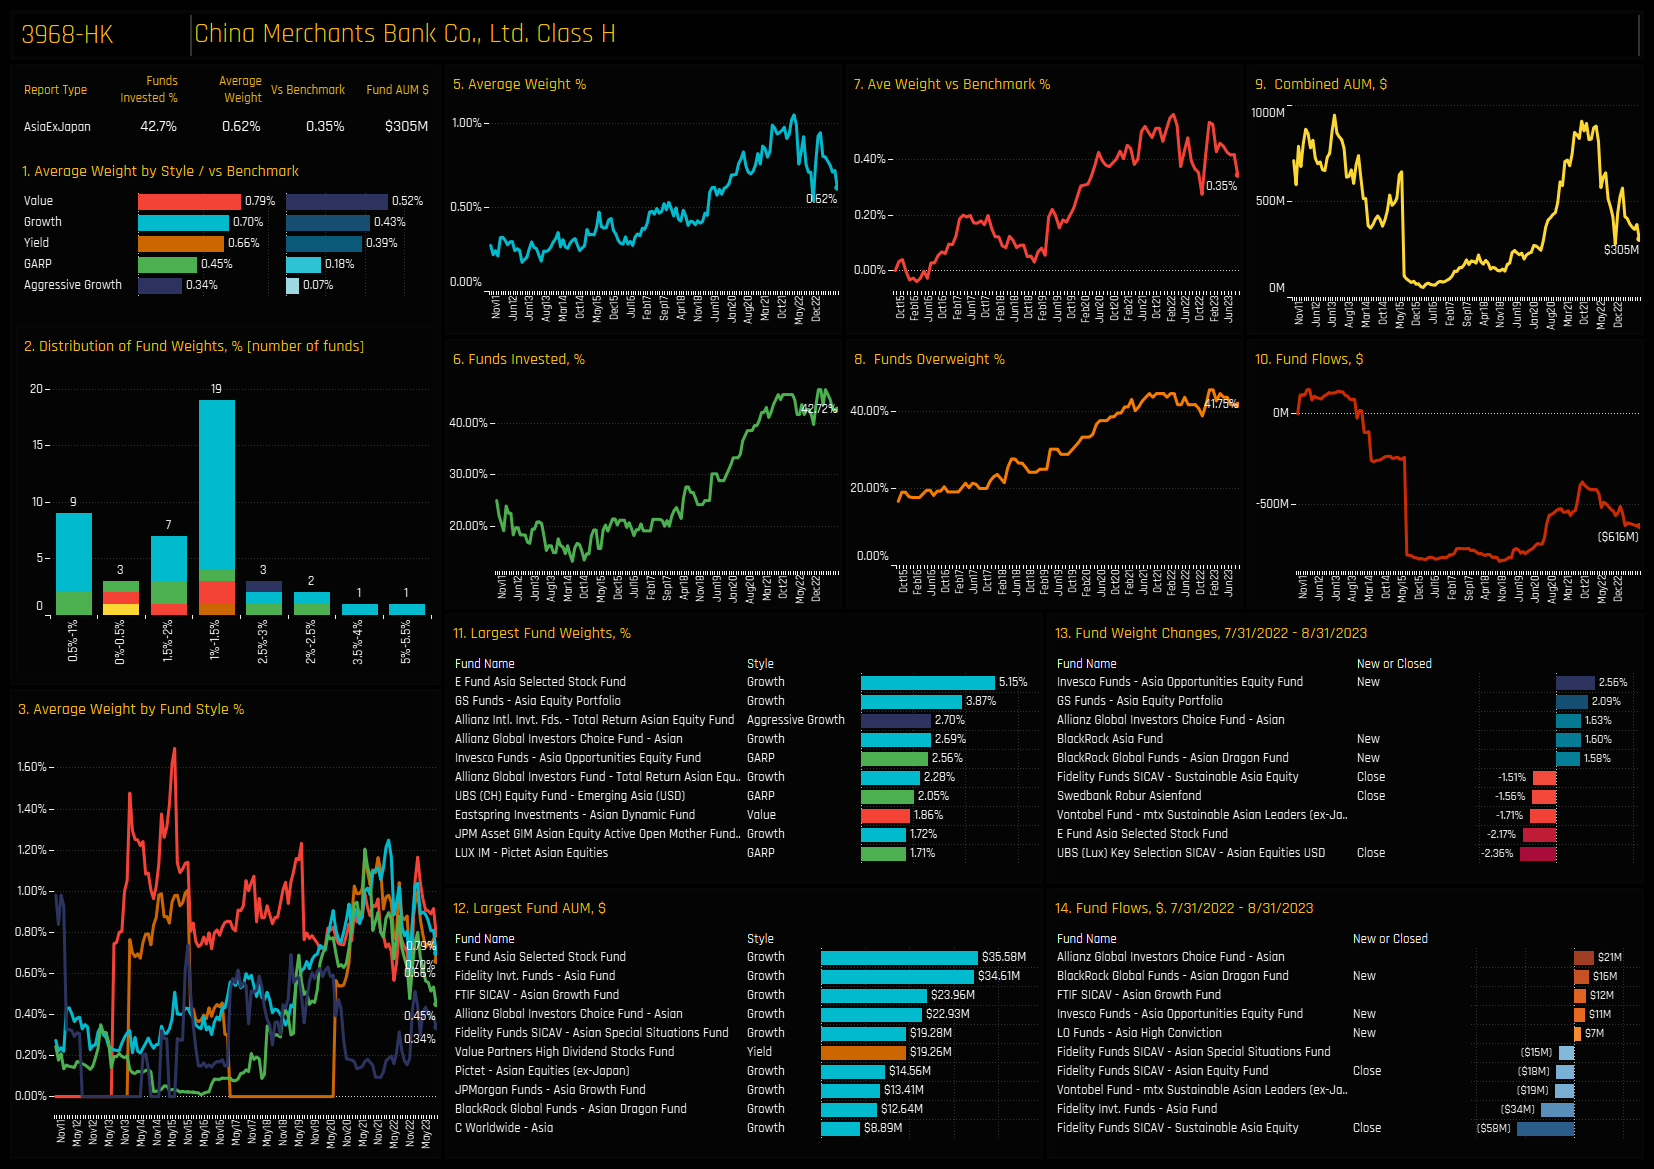
This is confirmed when we break down the aggregate stock level holdings in the China & HK Banks industry group. The most widely held stock is China Merchants Bank by some distance, owned by 42.7% of the funds in our analysis at an average weight of 0.62%. China Construction Bank and BOC Hong Kong are the only other Banks held by more than 10% of funds. In fact, these 3 stocks account for 71.4% of the total China & HK Banks allocation and also dominate the list of large individual fund level positions in the bottom chart.
Stock level activity was, as we would expect, negative on balance with more stocks seeing ownership decreases than increases over our chosen period. BOC Hong Kong Ltd saw -6.8% of funds close positions and Industrial and Commercial Bank of China -3.9% of funds. Postal Savings Bank of China also lost investors, with closures led by E Fund Asia (-9.6%) and Matthews Asia Ex-Japan (-5.19%). Of the few positives, Hang Seng Bank and China Minsheng Banking Corp saw small increases in investment over the period.
Summary
The charts to the right show our ownership metrics for all country/industries among active Asia Ex-Japan funds. From being the largest country/industry weight in 2011, China & HK Banks have drifted down the ranks to 9th, and the 12th most widely held.
Simply put, China & HK Banks are not an essential holding for the average Asia Ex-Japan investor any more. Banks in India and Indonesia are more widely owned, whilst the Tech/Internet related industry groups in China, Taiwan and South Korea now dominate portfolios. The fact that China & HK Banks are the largest country/industry underweight by some distance is testament to the conviction that managers have in their future underperformance.
So positioning is low, momentum is negative and there is a lack of appetite to invest in all but 3 companies in the industry group. The one saving grace is that valuations appear to be attractive enough for Value funds to take an interest. For Growth investors though, China & HK Banks are all too easily avoided.
Click on the link below for an extended positioning report on China & HK Banks among the Asia Ex-Japan funds in our analysis. Scroll down for stock profiles on China Merchants Bank, China Construction Bank and BOC Hong Kong.
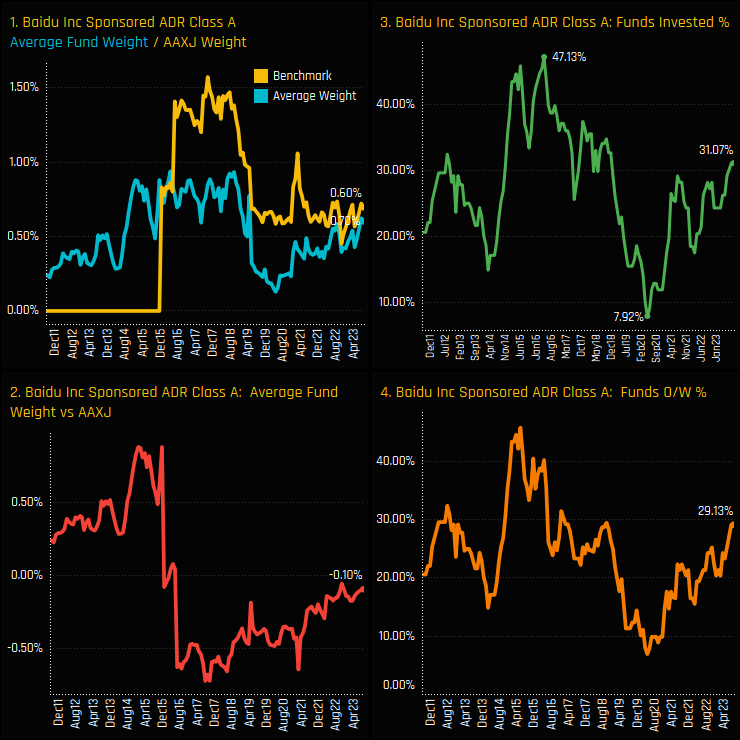
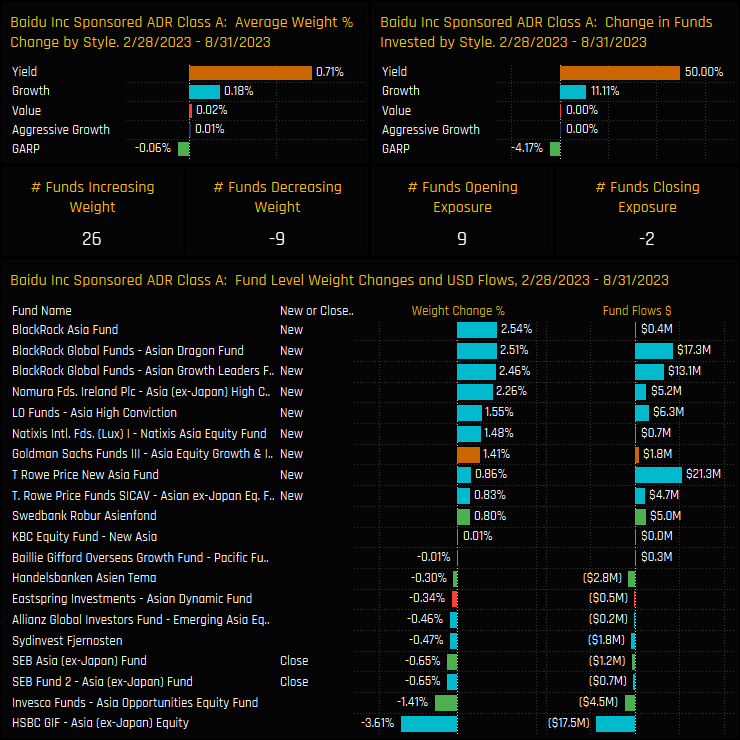
• After a heavy decline in ownership between 2016 and 2020, active Asia Ex-Japan managers are re-engaging with Baidu Inc..
• Ownership levels are at 4-year highs, with Baidu one of the key beneficiaries of manager rotation this year..
• Baidu is the 3rd largest holding in the Communication Services sector, but there a plenty of funds with a history of ownership who remain on the sidelines for now.
Time-Series & Stock Level Activity
Asia Ex-Japan fund ownership in Baidu Inc. is back on the rise. The percentage of funds with a position in Baidu Inc. fell from a high of 47.1% in April 2016 to a low of just 7.9% in April 2020, but since then has recovered strongly (ch3). The 31.1% of funds invested and 29.1% who are positioned overweight (ch4) represents a 4-year high, with underweights decreasing and absolute weights increasing in tandem (ch1&2).
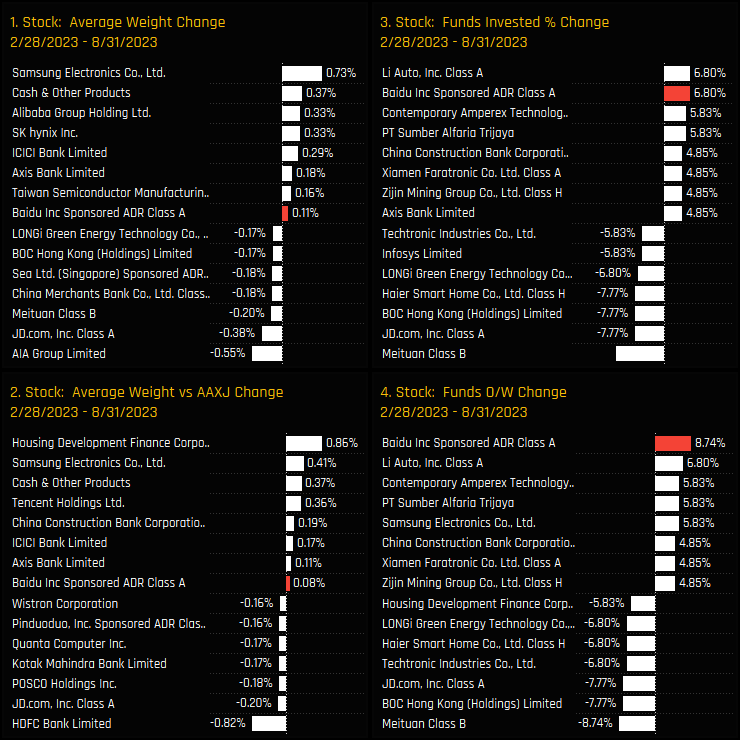
Baidu Inc. has been one of the key beneficiaries of active manager rotation over the past 6-months. The charts below show the change in our ownership metrics between 02/28/2023 and 08/31/2023. Baidu Inc. saw the joint highest funds invested increase of 6.8% alongside Li-Auto (ch3), and the highest increase in the percentage of funds positioned overweight (ch4). The fact that all measures of ownership moved higher confirms the active nature of the rotation.
Fund Activity & Latest Holdings
The fund level activity over the same period provides further details of this active rotation. All Style groups except GARP saw ownership levels rise, led predominantly by Growth funds and the small number of Yield funds in our analysis. Of the 103 funds we track, 26 increased weights in Baidu Inc. and 9 opened new positions compared to just 2 closing.
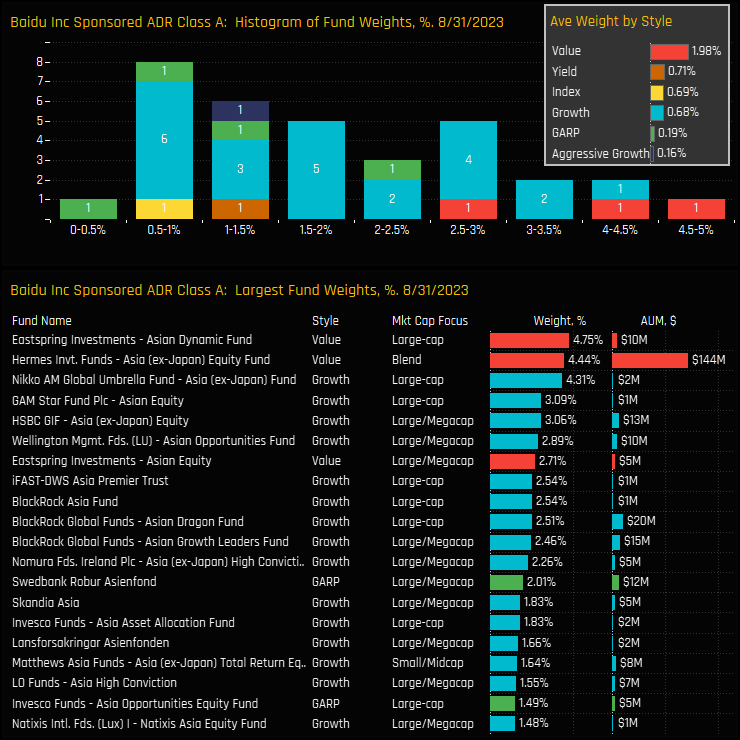
The spread of holding weights in Baidu Inc. is shown in the Histogram below, with portfolio weights spread fairly evenly from 0.5% up to 5%. The small number of Value funds in our Asian analysis are well positioned, with Eastspring Asian Dynamic (4.75%) and Hermes Asia Ex-Japan Equity (4.44%) leading the pack.
Conclusions & Data Report
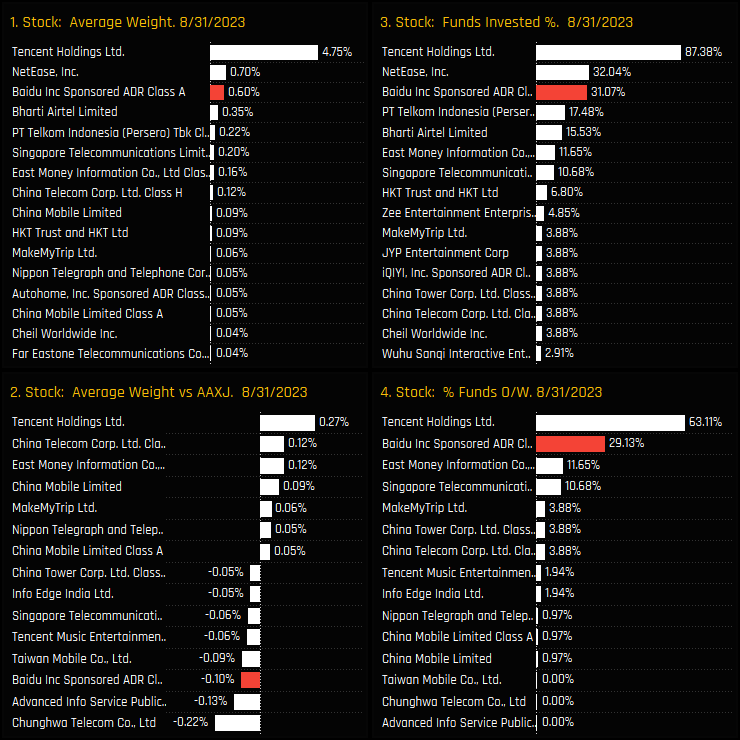
This active rotation has helped maintain Baidu Inc. as a key player in the Asia Ex-Japan stock universe. The charts opposite show our holding metrics for all stocks in the Asia Ex-Japan Communication Services sector. Baidu Inc. is some way behind the ever-dominant Tencent Holdings, but is on a par with NetEase and some way ahead of a 3rd tier that includes Bharti Airtel, PT Telkom Indonesia and Singapore Telecommunications.
The fact that managers are re-engaging with the name after such a heavy period of selling between 2016 and 2020 confirms a marked turnaround in the investment case. Value funds like it and a growing number of Growth funds are buying in to the story. As it stands though, we are a long way from peak ownership. A total of 86 Asia Ex-Japan funds have owned Baidu Inc. at some point over the last decade, but only 32 are currently invested (see PDF p.11). There is plenty of potential for ownership to move higher from here.
Click on the link below for an extended report on positioning in Baidu Inc. among the Asia Ex-Japan funds in our analysis.
For more analysis, data or information on active investor positioning in your market, please get in touch with me on steven.holden@copleyfundresearch.com
Investor Positioning Report — Copley Fund Research Ltd · Last updated: July 2026 · Registered in England and Wales
1. Who we are
Copley Fund Research Ltd provides proprietary institutional fund intelligence to listed companies and investor relations professionals. These terms govern every purchase of an Investor Positioning Report. By completing a purchase you confirm you have read, understood, and agreed to these terms in full.
2. What you are purchasing
The Investor Positioning Report is a bespoke PDF report mapping the institutional fund universe around your stock. It covers current investors, past investors, competitor investors, and white space investors. Every report is built from scratch for the specific company ordered and is not a standardised or templated product.
3. Delivery and process
Following payment or invoice issuance, Copley Fund Research will contact you within one working day to agree your competitor set. Production begins once the competitor set is confirmed in writing. The completed report will be released to you within 48 hours of production starting, provided payment has been received in full; where payment is outstanding, the report will be withheld until payment clears. If the requested company falls outside our covered fund universes, or a competitor set cannot be agreed, Copley Fund Research will issue a full refund or cancel the outstanding invoice.
4. Competitor set agreement
The competitor set is agreed with you in writing prior to production, and the report is built to that agreed specification. Requests to amend the competitor set after delivery, based on a change of preference rather than an error, may be treated as a new order.
5. Refund policy
Because each report is produced individually for your company, orders are non-refundable once production has begun, except as set out in clauses 3 and 5a below. By purchasing, you agree not to dispute the charge with your card provider on the basis that the service was not as described, provided the report has been delivered to the agreed specification or corrected under clause 5a.
5a. Quality remedy
If a delivered report contains a material error caused by Copley Fund Research — for example, an incorrect company analysed, a competitor omitted from the agreed set, or content missing from the specification in clause 2 — Copley Fund Research will correct and redeliver the report at no additional charge, within a reasonable timeframe. This is your sole remedy for such errors.
6. Data and accuracy
All fund positioning data in the report reflects holdings as disclosed at the most recently available reporting date at the time of compilation. The timing of fund holdings disclosures is determined by regulatory requirements applicable to each fund and is outside the control of Copley Fund Research Ltd. This data may not reflect current fund positions. Copley Fund Research takes reasonable care to ensure accuracy but makes no warranty, express or implied, as to the completeness or current accuracy of the underlying data — though this does not affect the quality remedy in clause 5a for errors in how that data was analysed or presented. Past fund positioning is not indicative of future fund behaviour or investment decisions.
7. Not investment advice
The Investor Positioning Report is produced for investor relations intelligence purposes only. It does not constitute investment advice, financial advice, or a recommendation to buy, hold, or sell any security. The data reflects historical fund positioning and must not be relied upon as a prediction of future fund behaviour or investment decisions. Copley Fund Research Ltd is not authorised or regulated by the Financial Conduct Authority for the provision of investment advice.
8. Permitted use and confidentiality
The report is licensed for internal use by the purchasing organisation only. You may share it with employees and directors of your organisation. You may not: reproduce, redistribute, publish, or resell the report or any part of it; share it with any third party outside your organisation without prior written consent; use the fund or portfolio manager names contained in the report to approach those individuals on behalf of Copley Fund Research or in a manner that could damage Copley Fund Research's relationships with those funds; or use the data for any purpose other than your own investor relations strategy. The data, analysis, and methodology contained in the report are the intellectual property of Copley


