In this issue:
EM Industrials Deep Dive
Emerging Market Funds: A Style Analysis
MercadoLibre's Bullish Run Continues
372 emerging market Funds, AUM $402bn
EM Industrials Deep Dive
• Industrials sector weights sit near record highs, but current data suggests a period of consolidation and stalling momentum among EM Managers.
• Allocations are correlated to Style (Growth over Value), whilst Small/Midcap strategies are allocating significantly more than their larger cap counterparts.
• China & HK dominates country-level allocations, with noticeable rotation in to Brazil, Thailand, and India and out of South Africa and China & HK in recent months.
• Meituan is the most widely held stock in the sector, but with more Industrials stocks finding investment than any other sector in EM ,there are no shortage of investment opportunities, especially among Small and Midcap companies..
Time Series & Sector Activity
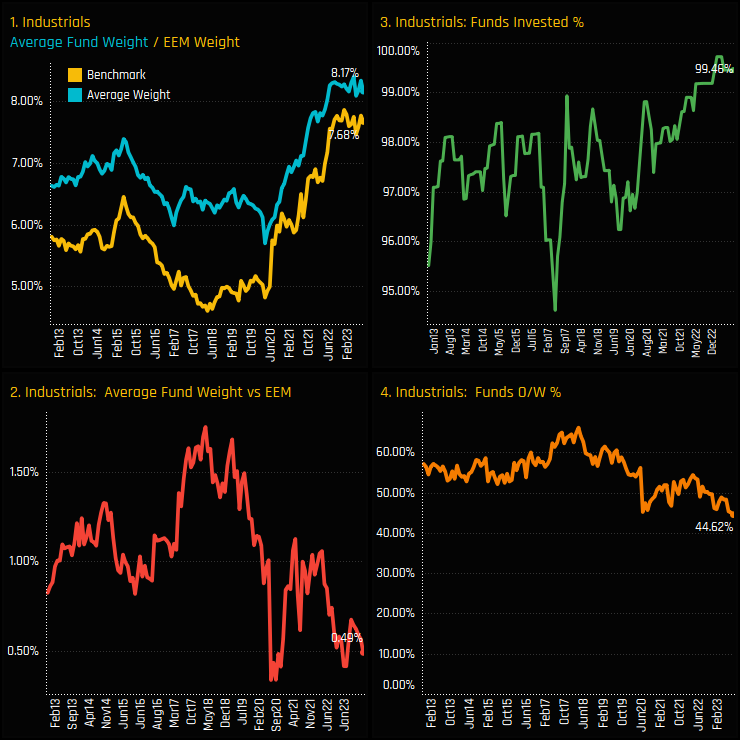
Ownership levels in the Industrials sector have risen to new highs over the last 3 years. Average fund weights broke through the 8% barrier in early 2022 and have held on to those gains, though we appear to have entered a period of consolidation as weights have failed to push on any further since then (ch1). Versus the benchmark, active managers remain overweight Industrials on average, but the size of the overweight has fallen towards the bottom of the long-term range (ch2), with a declining number of funds positioned ahead of the index (ch4).
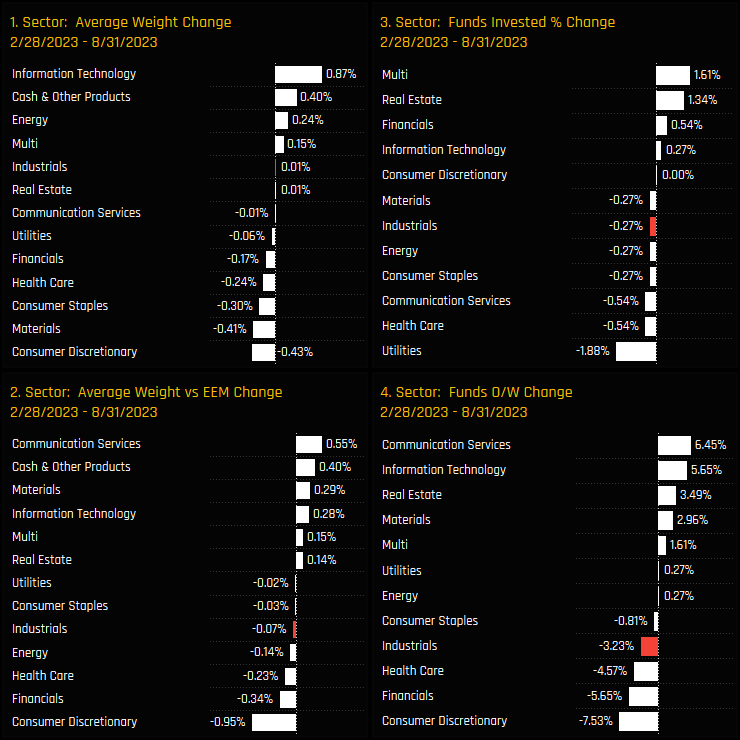
The sense of momentum stalling can be seen in the charts below, which measure the change in our 4 sector ownership metrics between 02/28/2023 and 08/31/2023. A small number of funds have switched from overweight to underweight (ch4), but on the remaining 3 metrics ownership levels have stayed fairly constant. Managers have instead raised their Information Technology allocations whilst rotating away from Consumer Discretionary.
Sector Positioning & Sentiment
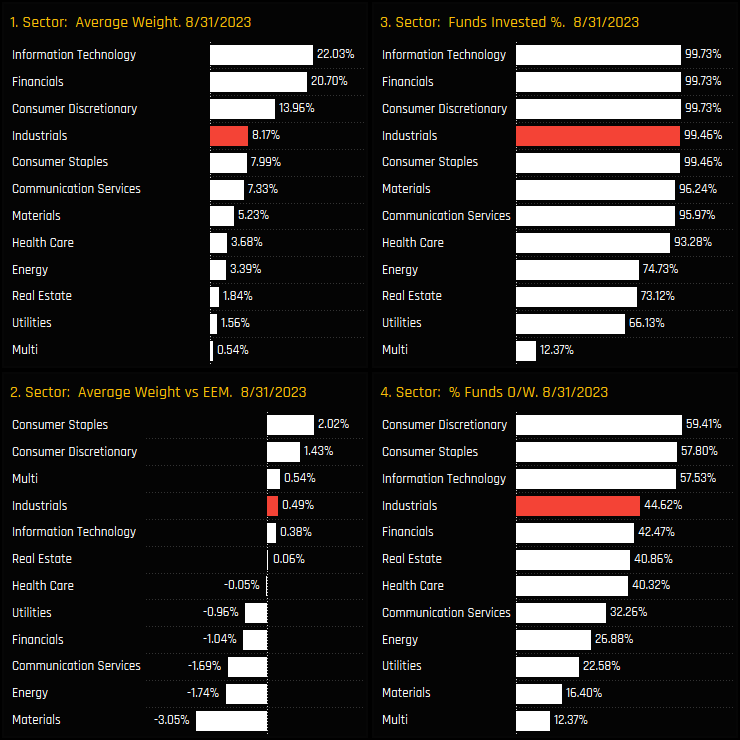
The latest snap of sector positioning shows Industrials as the 4th largest allocation on average, some way from the top 3 of Information Technology, Financials and Consumer Discretionary but marginally ahead of Consumer Staples and Communication Services. Versus the iShares MSCI EEM ETF benchmark, Industrials are a moderate overweight, but lag behind the consensus overweights of Consumer Discretionary, Consumer Staples and Information Technology.
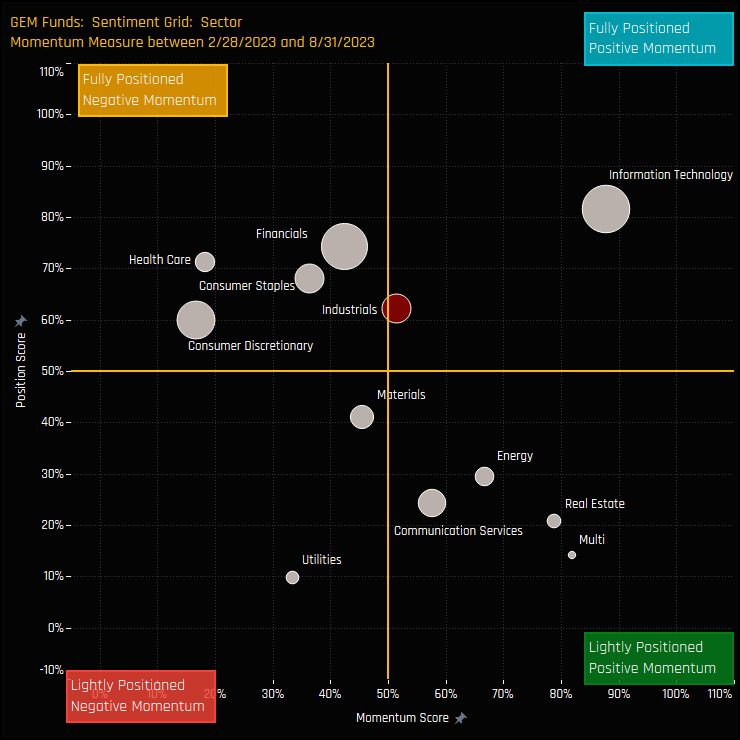
The Sentiment Grid below brings long-term positioning and short term manager activity together in a single chart. The Y-axis shows the ‘Position Score’, a measure of current positioning in each sector compared to its own history going back to 2008 on a scale of 0-100%. The X-Axis shows the ‘Momentum Score’, a measure of fund manager activity for each sector between 2/28/2023 and 08/31/2023 on a scale of 0% (maximum negative activity) to 100% (maximum positive activity). It highlights a lack of strong sentiment in either direction, with both positioning and momentum towards the middle of the Grid.
Fund Holdings & Market Cap Trends
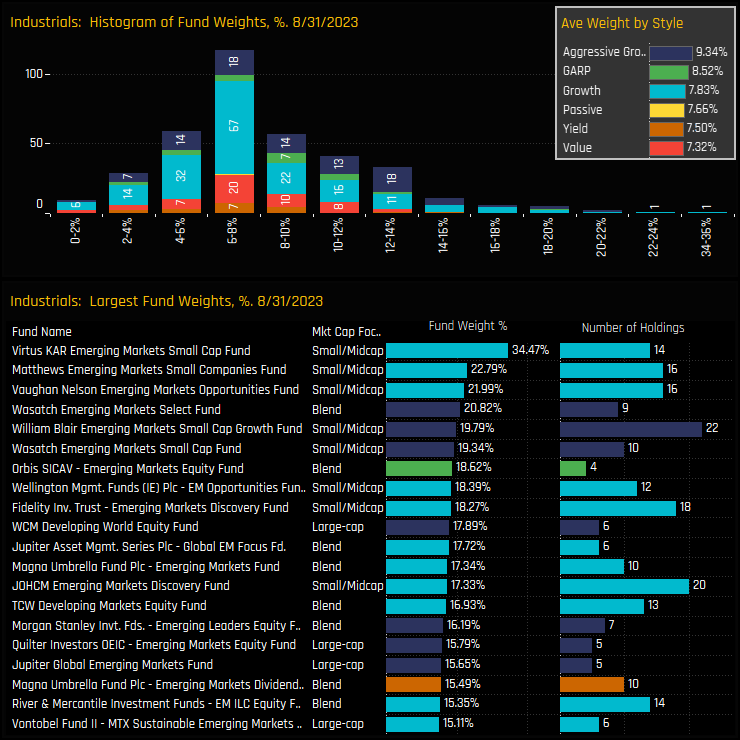
The top chart below shows the histogram of fund holdings in the Industrials sector and the inset chart the average weight by fund Style. Allocations are centered around the 6-8% level with exposure largely correlated to Style (Growth over Value). The extended tail to the upside is led by the Small/Midcap strategies of Virtus KAR EM Small Cap (34.5%), Matthews Emerging Market Small Companies (22.8%) and Vaughan Nelson Emerging Markets Opportunities (21.99%).
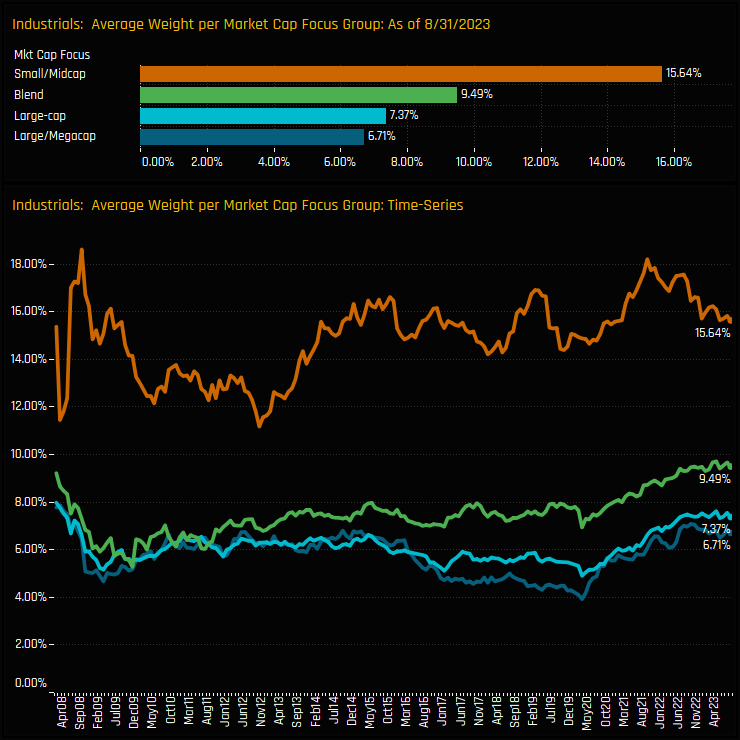
Small/Midcap strategies have long allocated more than their larger cap peers in the Industrials sector. Average weights among the 19 Small/Midcap strategies in our analysis stand at 15.64%, more than double that for both Large/Megacap and Large-Cap funds. However, the time-series chart shows how the growth in Industrials weights since 2020 have been mainly driven by Large/Mega, Large-Cap and Blend Strategies, who are all close to record levels of exposure.
Country Positioning & Activity
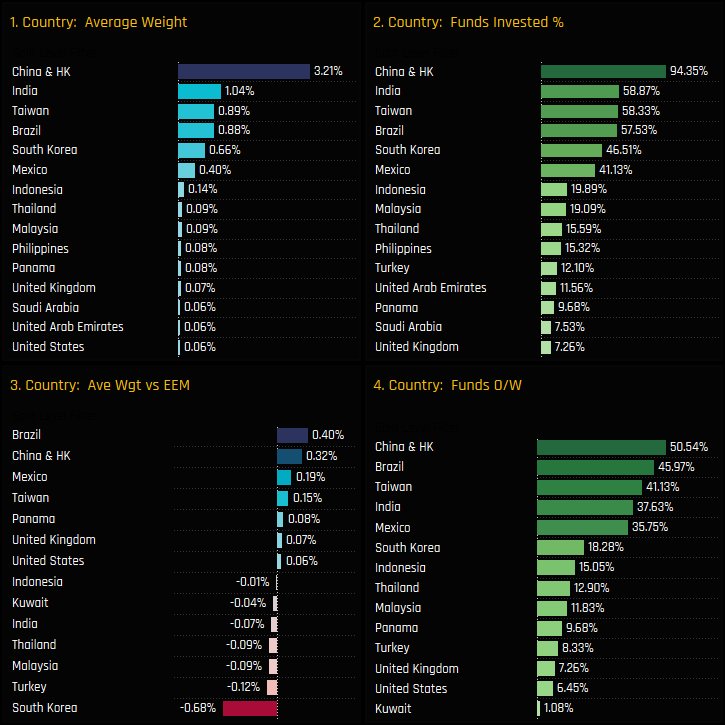
Country level positioning within the Industrials sector is dominated by 6 nations. China & HK is the dominant force with a 3.2% allocation, followed by India (1.04%), Taiwan (0.88%) and Brazil (0.88%). Outside of South Korea and Mexico, ownership is relatively non-existent. Versus the benchmark, active EM funds are overweight Brazil, China & HK, Taiwan and Mexico Industrials and underweight South Korea, Turkey and Malaysia.
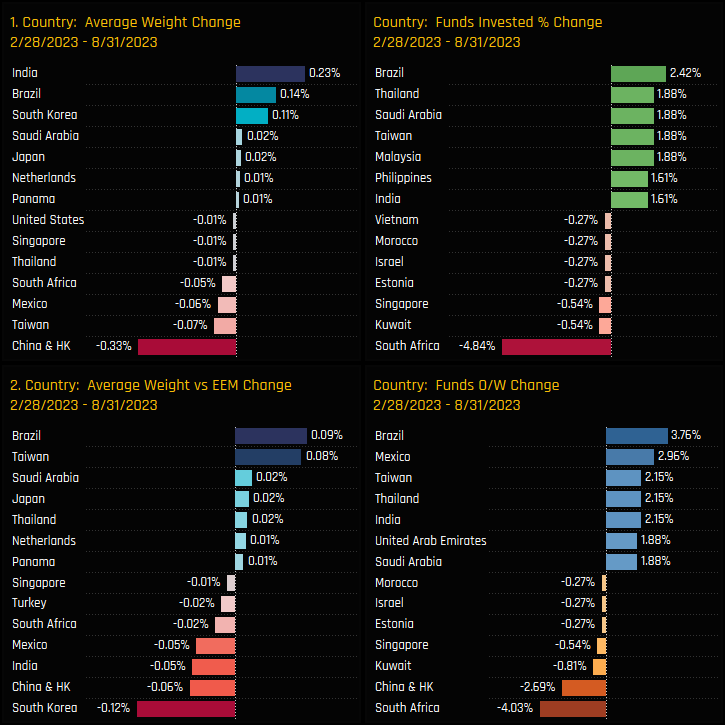
Though top-level Industrials ownership has been fairly static over the last 6-months, there has been a degree of country rotation within the sector. Active increases in Brazil, Thailand and Indian Industrials were offset by a rotation away from South Africa and China & HK Industrials.
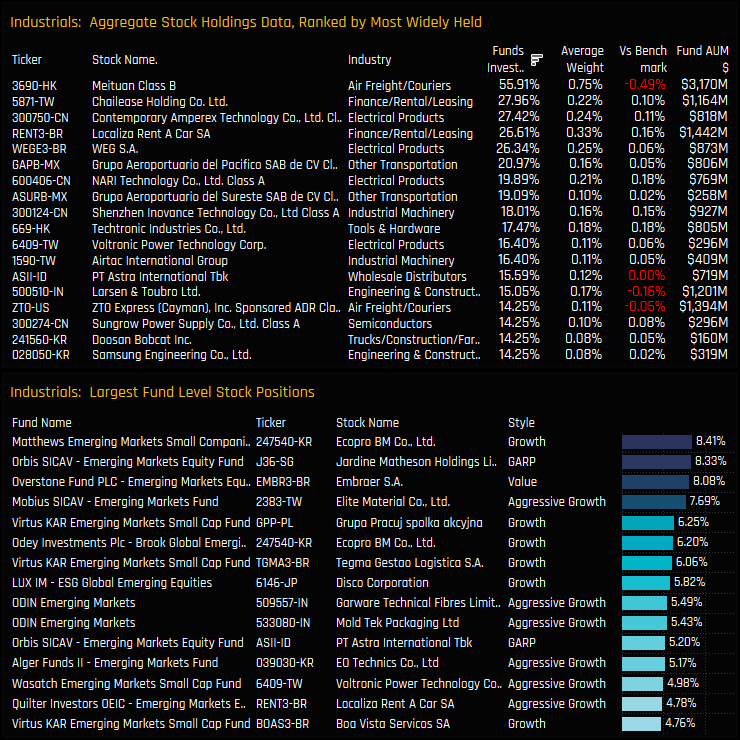
Stock Holdings & Activity
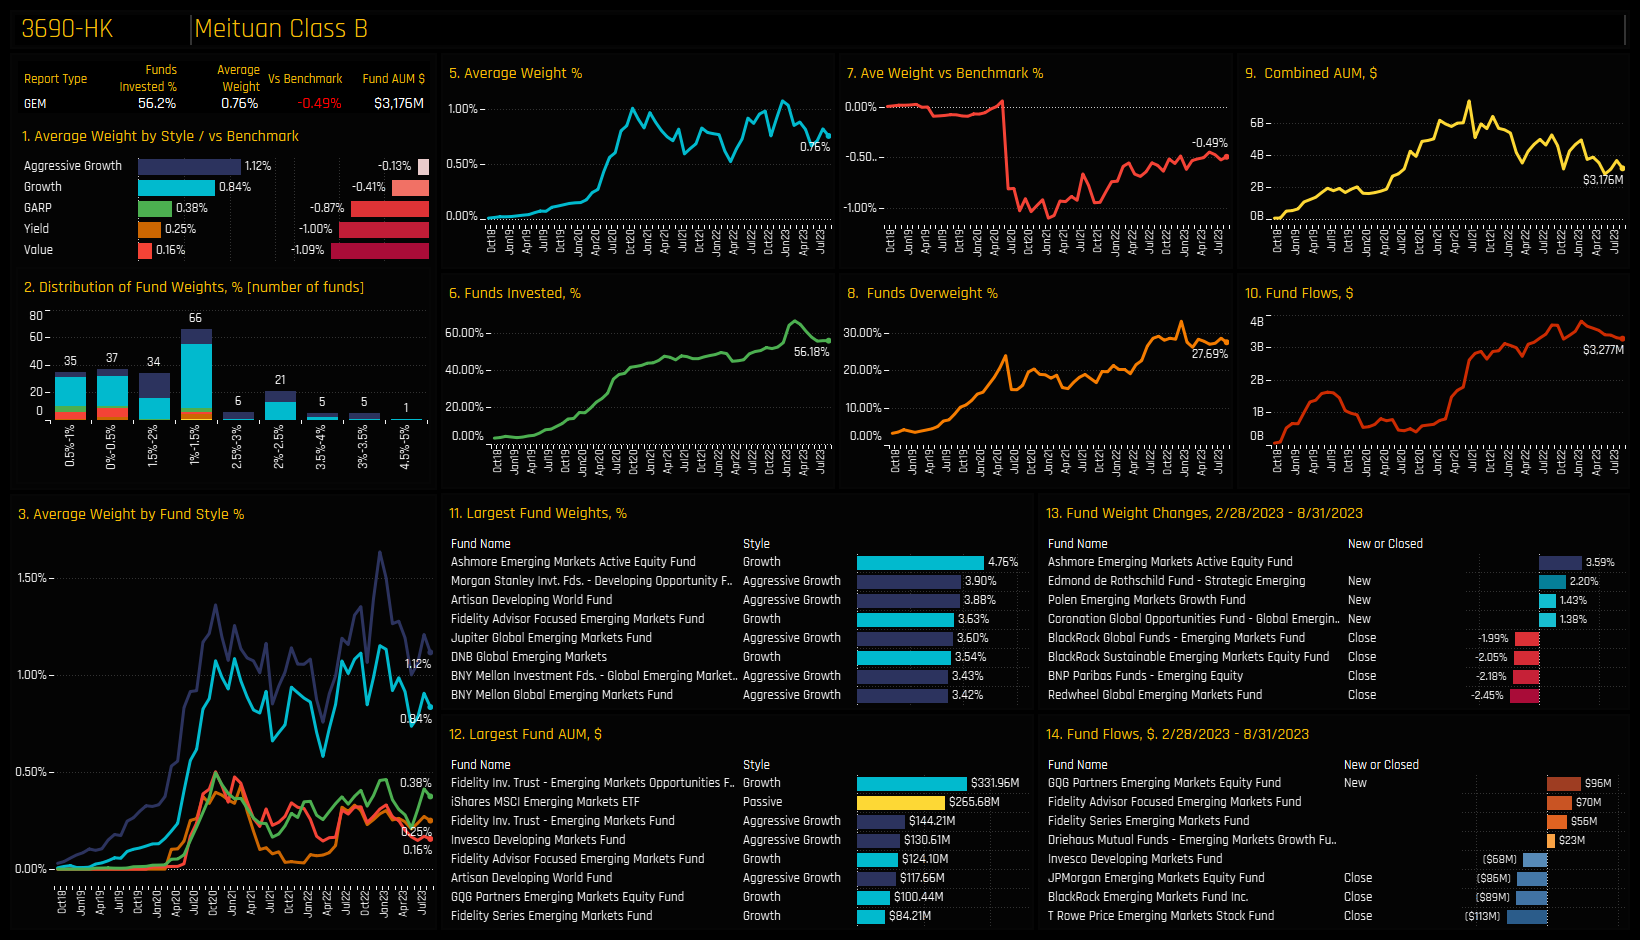
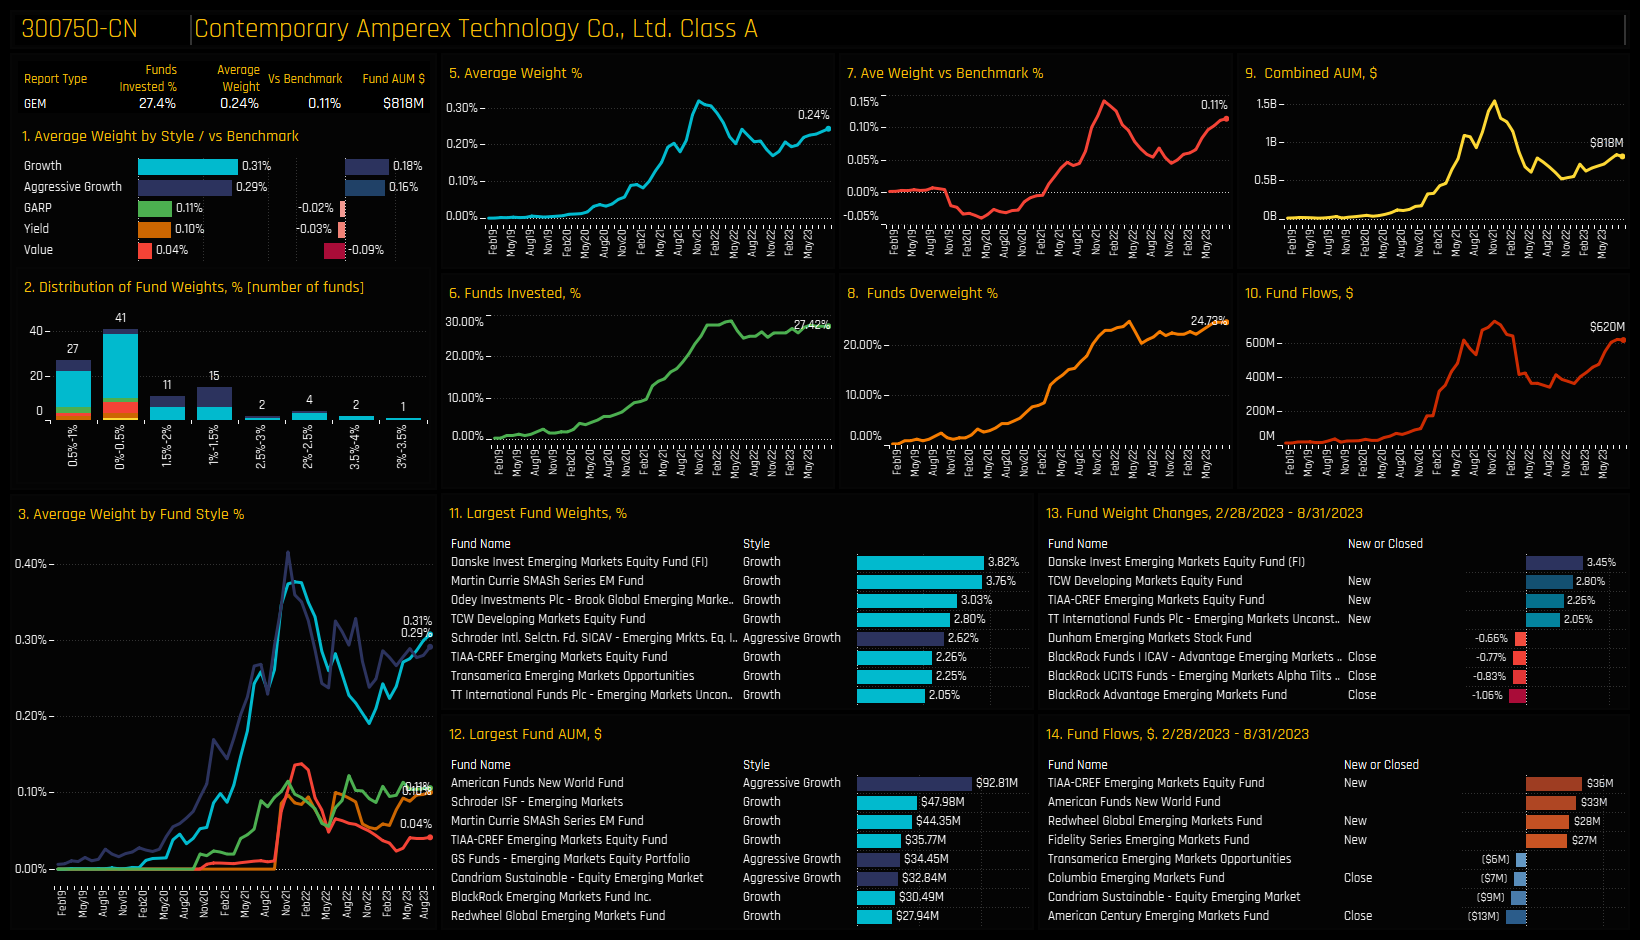
The leading company in the sector is Meituan by some distance, owned by 55.9% of funds at an average weight of 0.75% and a combined $3.17bn in EM fund investment. The 2nd tier is comprised of Chailease Holding, Contemporary Amperex Technology, Localiza Rent A Car and WEG S.A. Underweights are led by Meituan, Larsen & Toubro and a host of South Korean stocks such as LG Energy Solution, Ecopro and Doosan Enerbility. The largest fund level positions sit within the Small cap strategies, shown in the bottom chart.
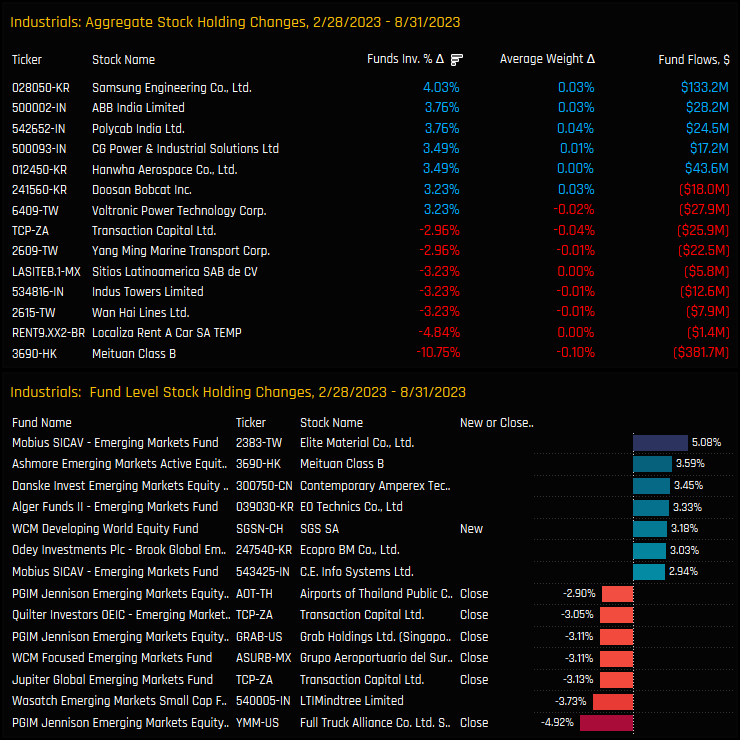
Stock level activity over the last 6-months shows active EM funds increasing exposure to Samsung Engineering, ABB India and Polycab India among others. Decreases in ownership were led by Meituan, with a significant -10.75% of funds closing exposure to the stock between 2/28/2023 and 08/31/2023. The largest individual fund level stock changes were spread across a multitude of companies, with PGIM’s -4.92% closure of Full Truck Alliance and Mobius’ +5.08% increase in Elite Material the standout moves.
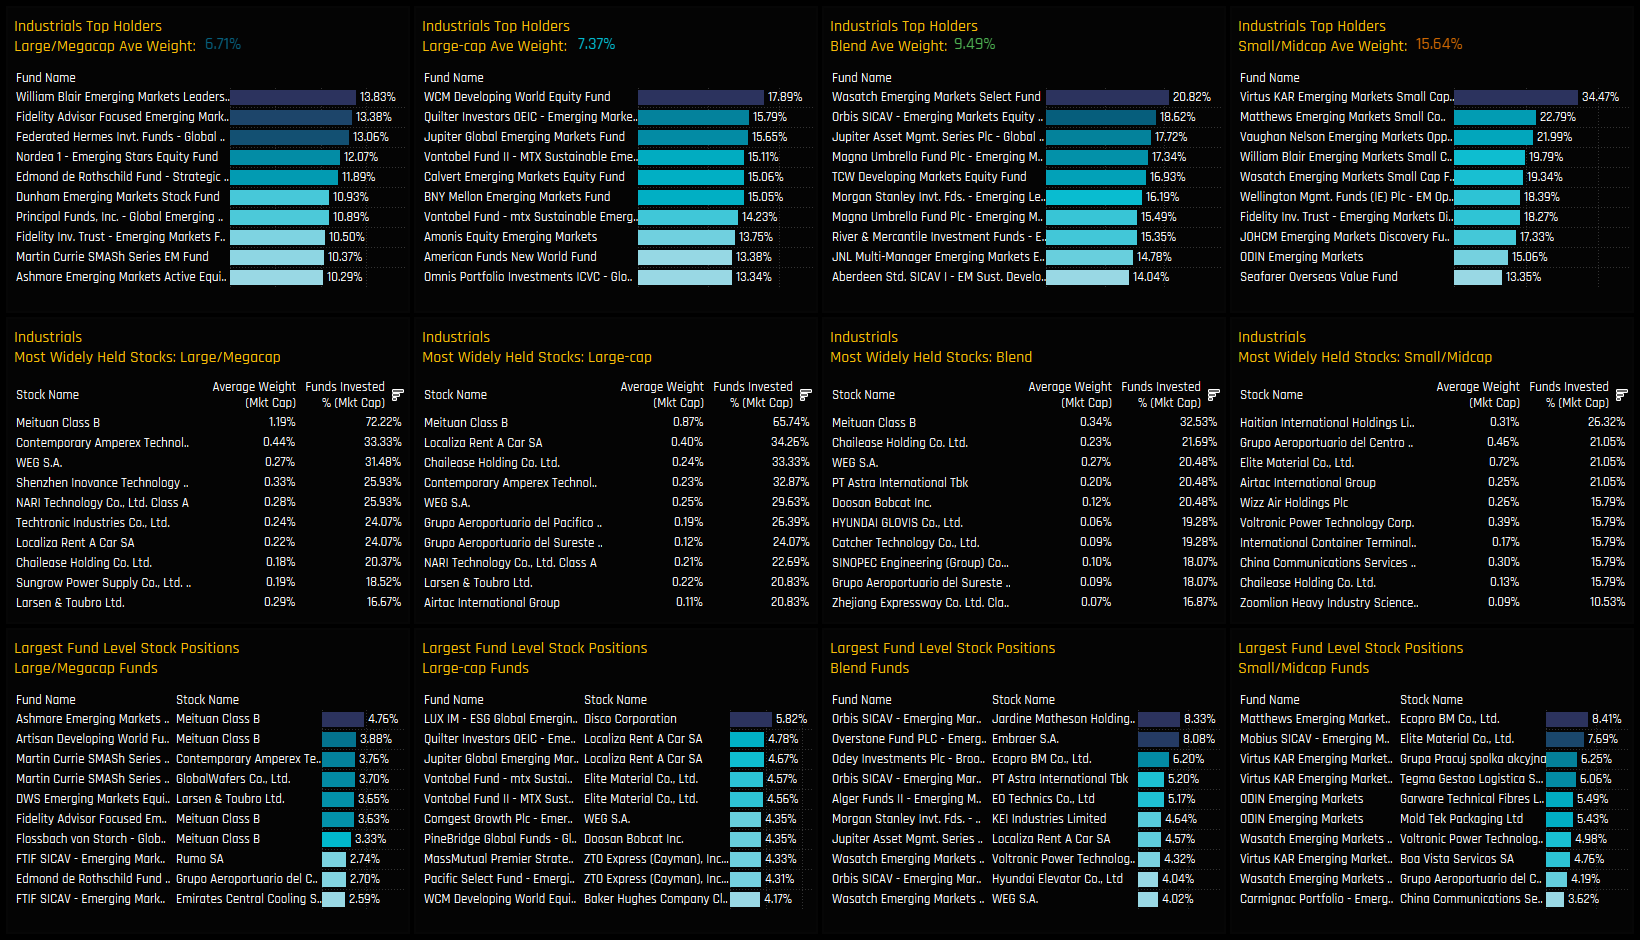
Stock Positioning by Market Cap Focus
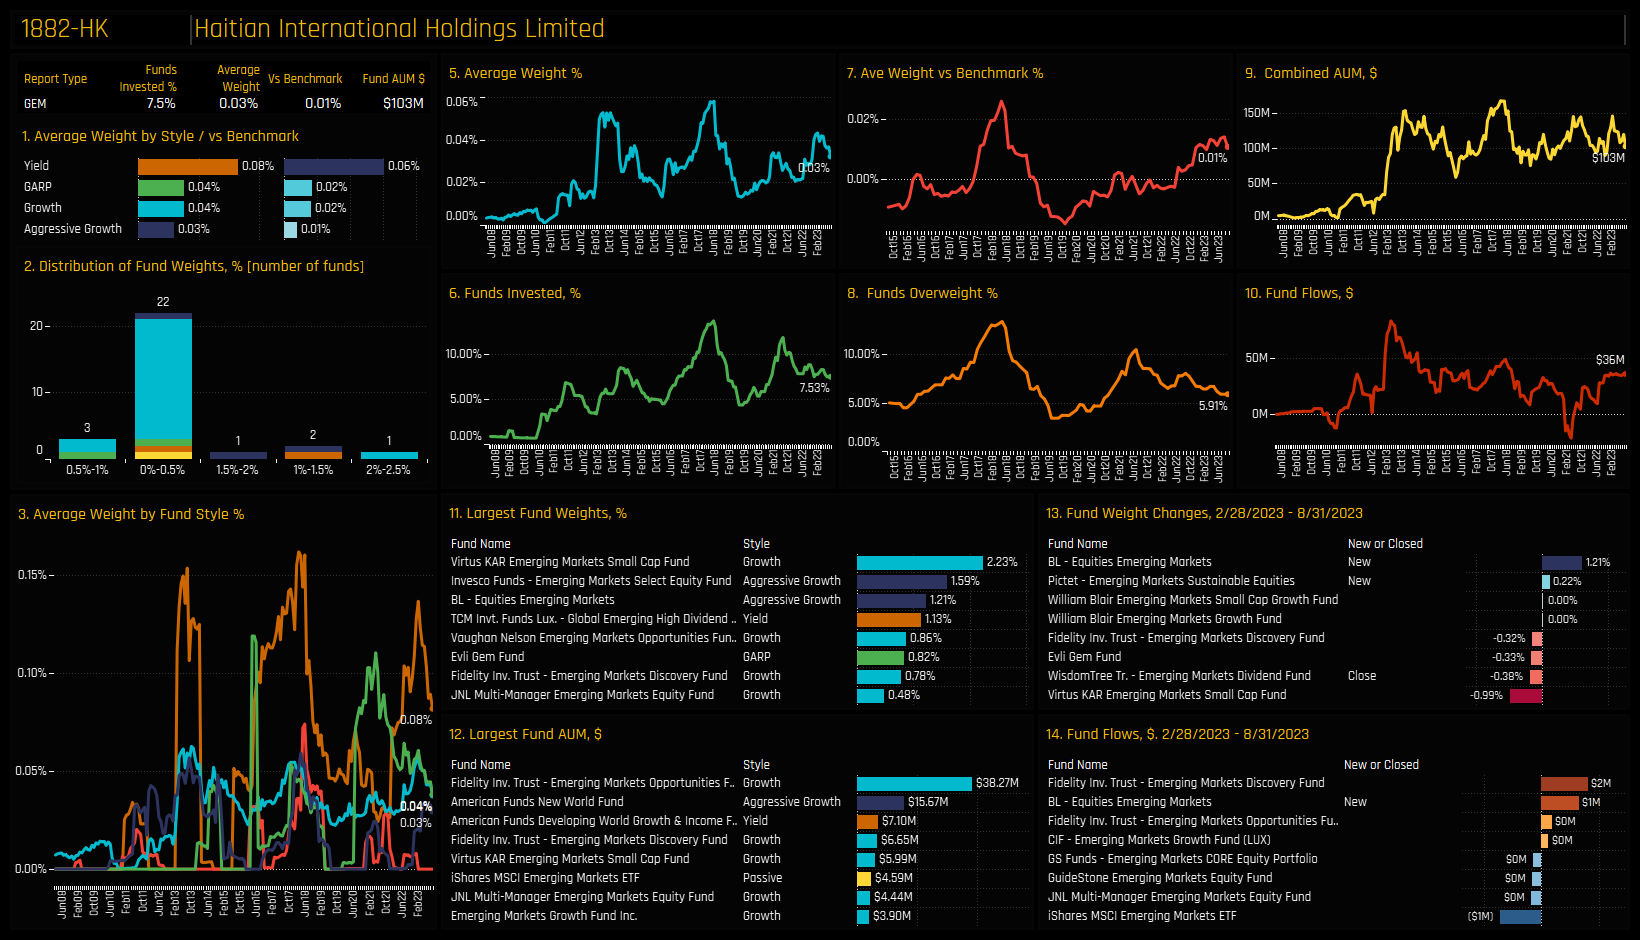
The below charts break down the largest holders, the most widely held stocks and the largest fund level stock holdings in the Industrials sector, split by the Market Cap Focus of the fund. Large/Megacap and Large Cap funds share similar ownership profiles, with Meituan the most widely held stock and decent sized stakes in Contemporary Amperex Technology, Localiza Rent A Car and WEG S.A, among others. Blend funds bring PT Astra International and Doosan Bobcat Inc in to the mix, whilst Small/Midcap funds share few similarities. The most widely held stock among Small/Midcap funds is Haitian International Holdings, though the 15.64% allocation among Small/Midcap managers is spread across a wide spectrum of companies. To put some figures around this, the top 20 largest stock weights among Large/Megacap funds account for 68% of the total Industrials allocation, for the benchmark this figure is 50% but for Small/Midcap strategies stands at 38.1%.
Conclusions & Links
Industrials exposure among active Emerging Market funds appears to be at a consolidation point. The momentum that took average weights from sub-6% in 2019 to 8%+ today has faded, though there are few signs of a full scale reversal.
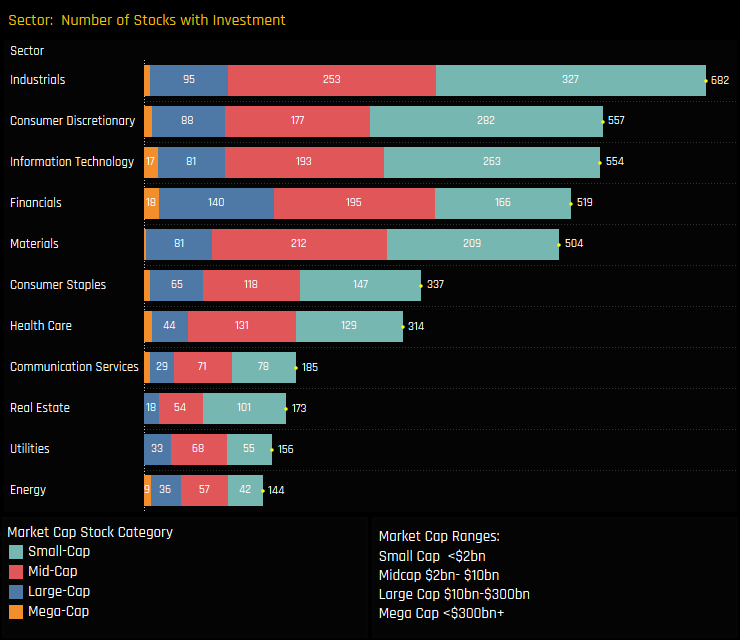
The chart opposite shows the number of companies that have found investment from the 372 active EM funds in our analysis, split by sector and the Market Cap of the stock. Industrials has more companies capturing investment than any other sector, with 682 stocks in total and 327 of those with a Market Cap of below $2bn.
When combined with the fact that Small/Midcap strategies are allocating substantially more to the Industrials sector than their Large Cap peers, it highlights the breadth of opportunity within the sector. Perhaps the next leg higher will be driven by the next generation of companies at the lower end of the market cap spectrum – there is certainly no lack of investible opportunities.
Click below for the extended data report on EM Industrials investor positioning. Scroll down for stock profiles on Meituan, Haitian International Holdings and Contemporary Amperex Technology.
• The divergence between Value fund returns and Aggressive Growth is a key theme again this year
• This analysis uncovers the key country, sector and stock differences among the 5 Style groups in our analysis, with particular focus on where Value funds and Aggressive Growth funds diverge.
• We find that all Styles are underweight Asia and overweight the Americas, India continues to divide Value and Growth investors, whilst TSMC is loved by all.
Style Categorisations
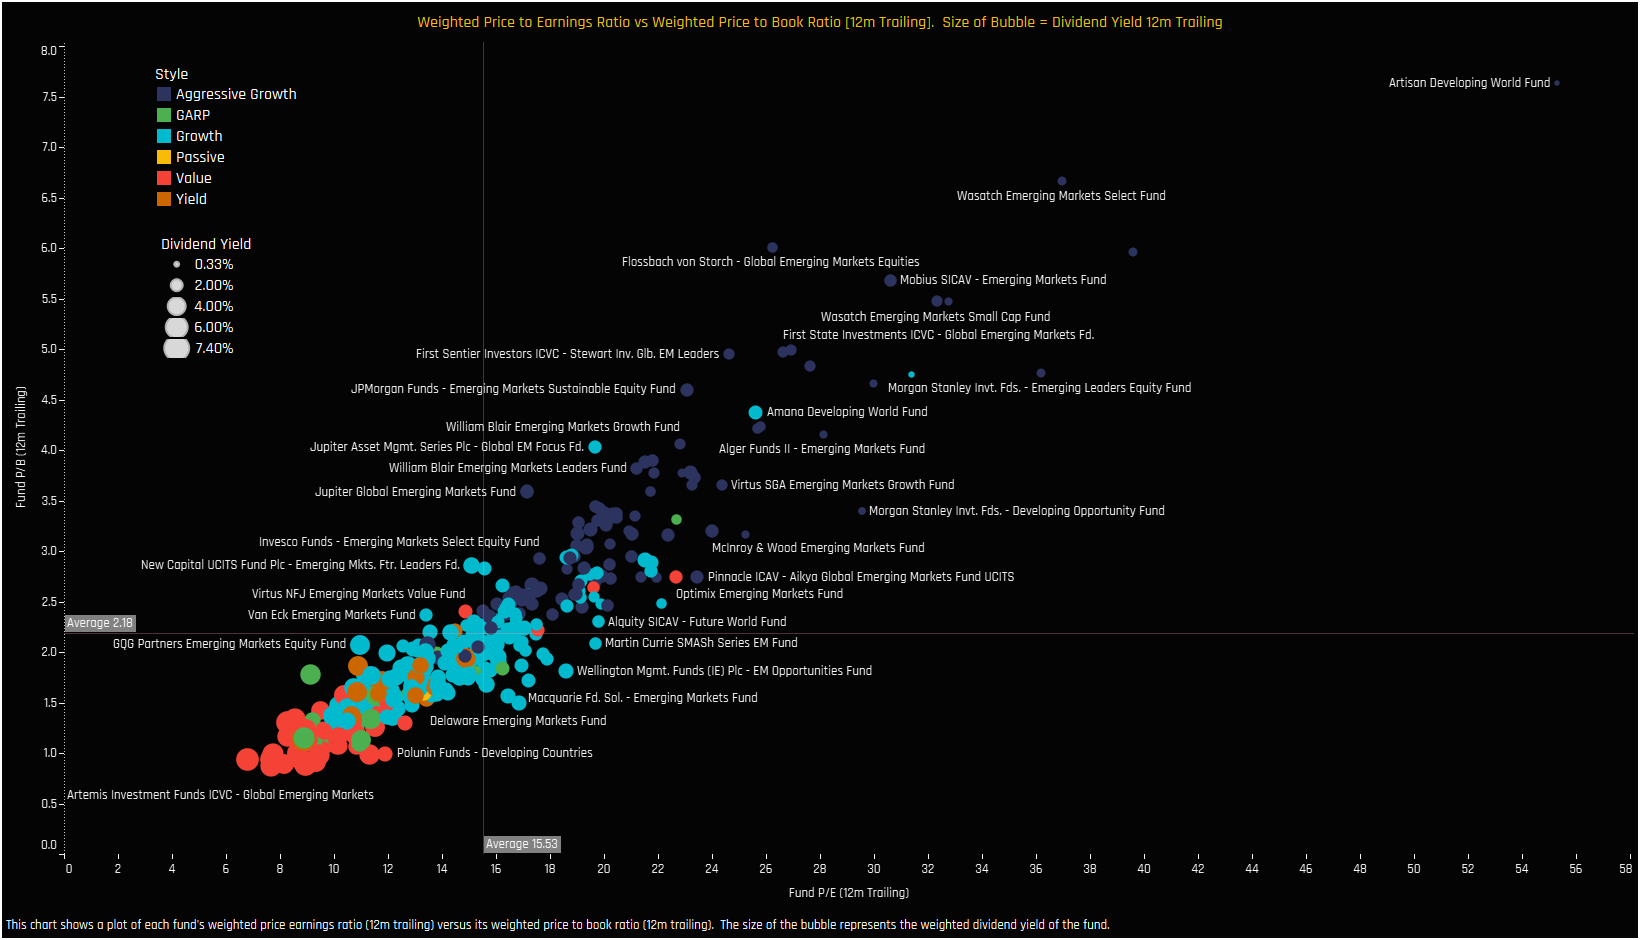
Each of the 372 funds in our EM analysis is categorised in to 1 of 5 Styles based on either the valuation profile of the fund or explicitly by it’s fund description. The Style classifications are described opposite, with the chart below plotting the weighted P/E (12m trailing) of each fund versus the weighted P/B (12m trailing). The size of the bubble represents the weighted Dividend Yield of the fund and the colour the Style.
Aggressive Growth: At least 70% of the portfolio in stocks with a higher P/E than the iShares Emerging Market ETF (EEM) average, and at least 70% with a higher P/B ratio.
Growth: At least 50% of the portfolio in stocks with a higher P/E than the iShares EEM ETF average, and at least 50% with a higher P/B ratio.
Value: Either by the fund description, or at least 50% of the portfolio in stocks with a lower P/E ratio than the iShares MSCI EEM ETF average, and at least 50% with a lower P/B ratio
Yield: As per the fund description only (i.e Yield, Dividend, Income funds).
GARP: All other iterations that do not fit under the above classifications.
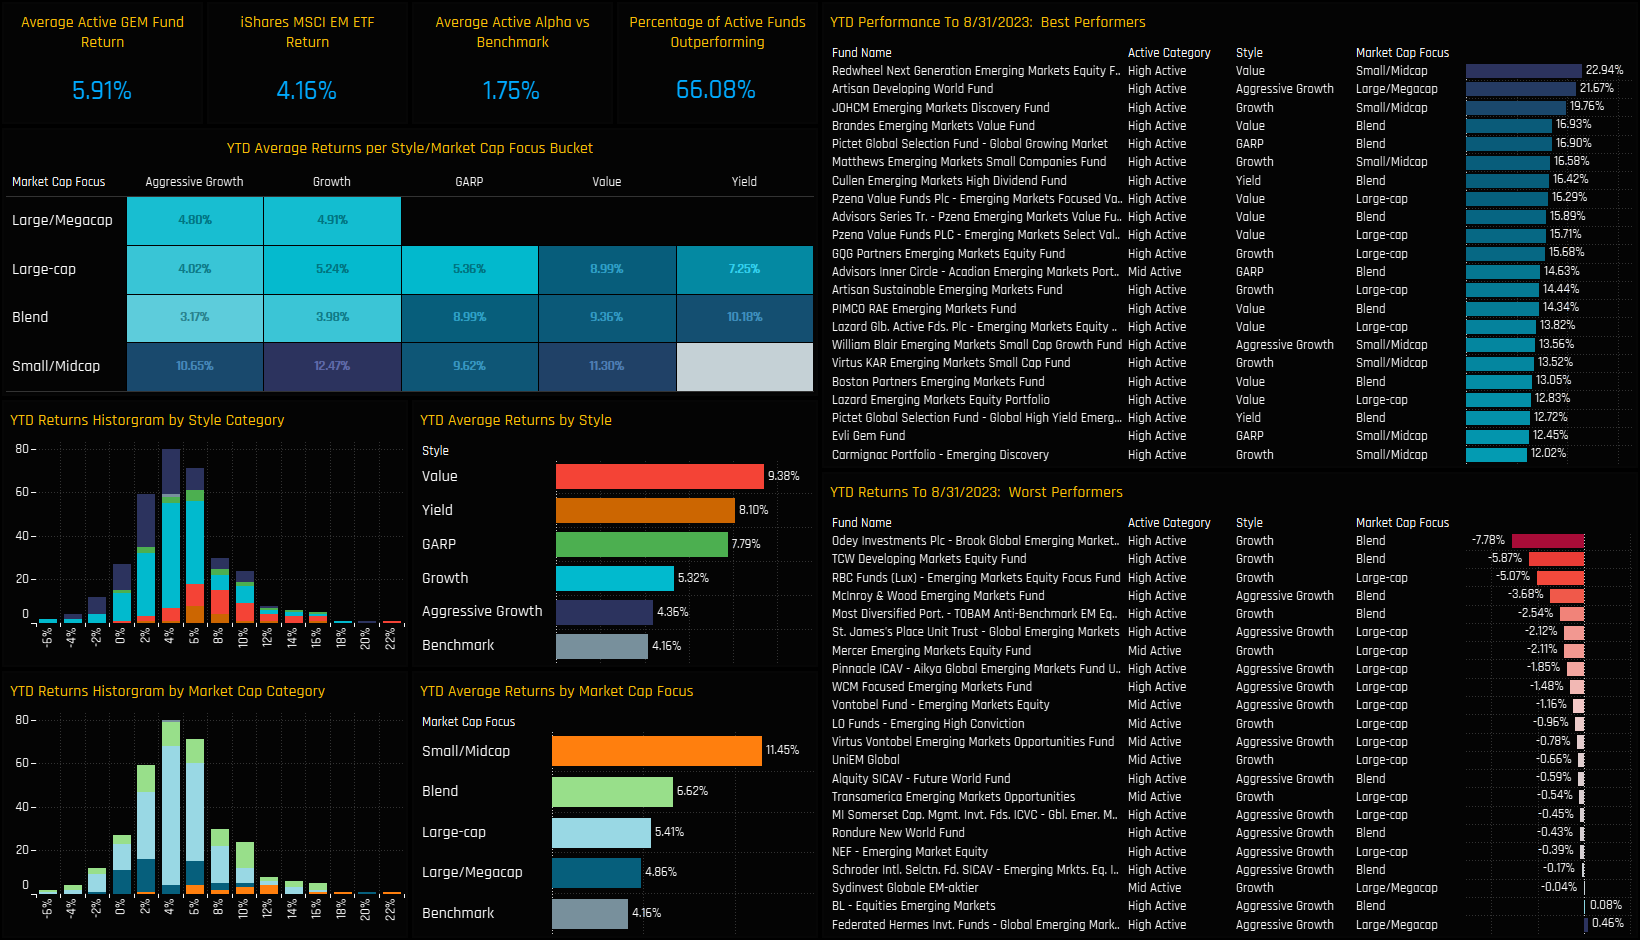
Fund Performance by Style
So far this year there has been a fair amount of divergence in performance between the Style groups. Whilst the majority of funds (66.1%) are outperforming the benchmark, the divergence between Value funds (9.38%) and Aggressive Growth Funds (4.36%) is a clear theme for the year.
With that in mind, this analysis looks in to the key differences in allocations between the Style groups. We look at regional, country, sector, country/sector and stock differences to help us understand what the drivers of performance will be for the remainder of the year.
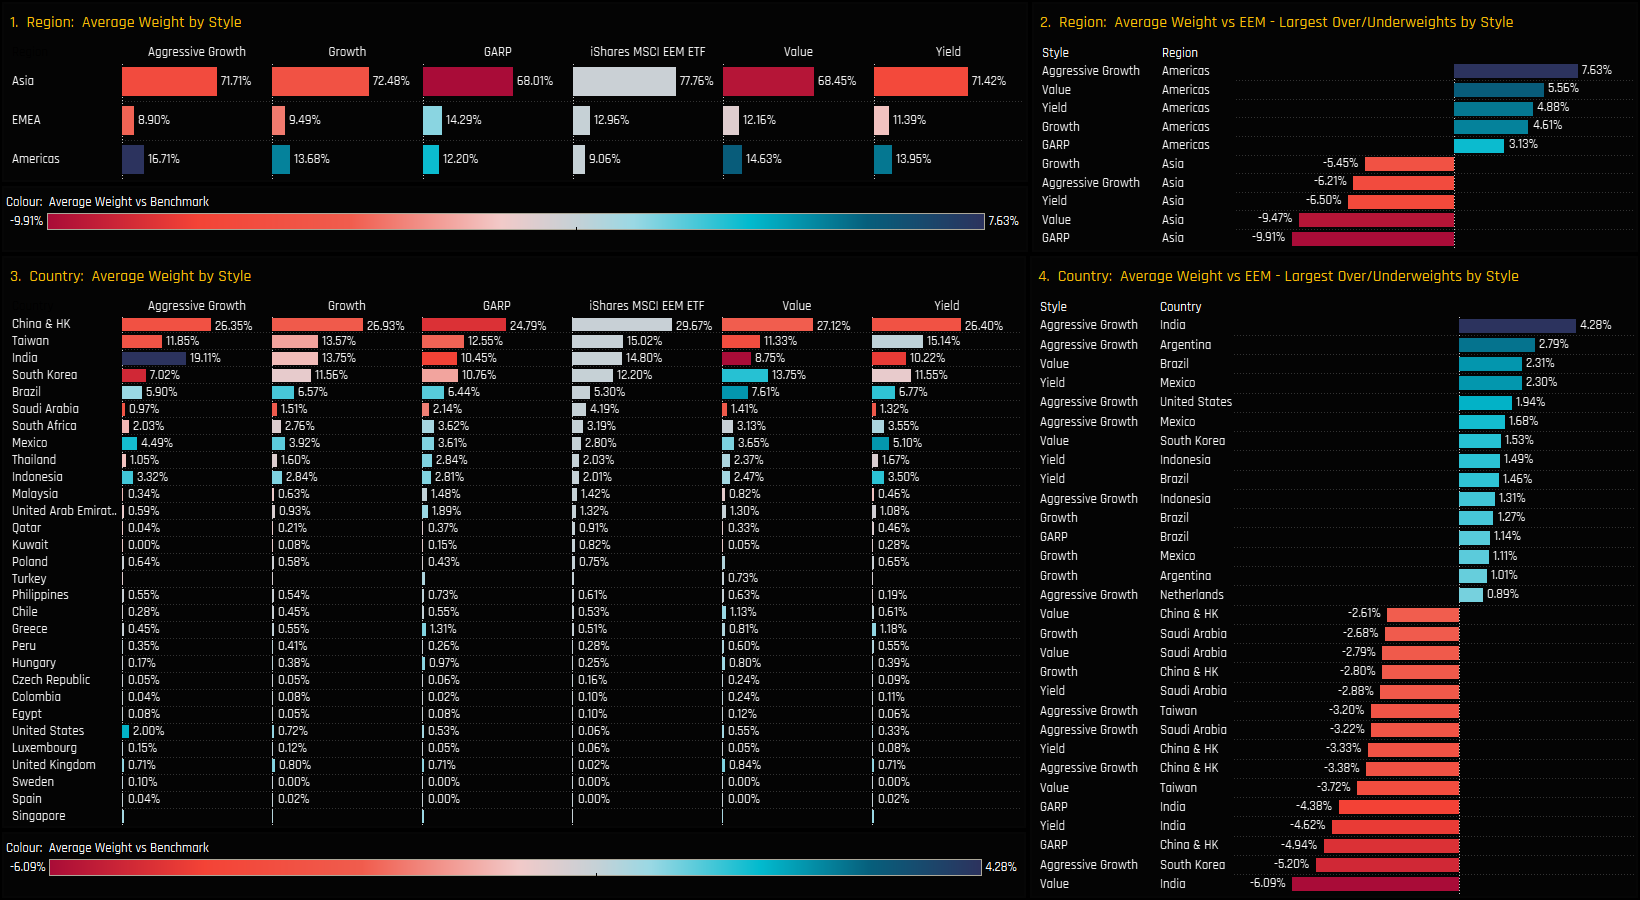
Regions & Countries
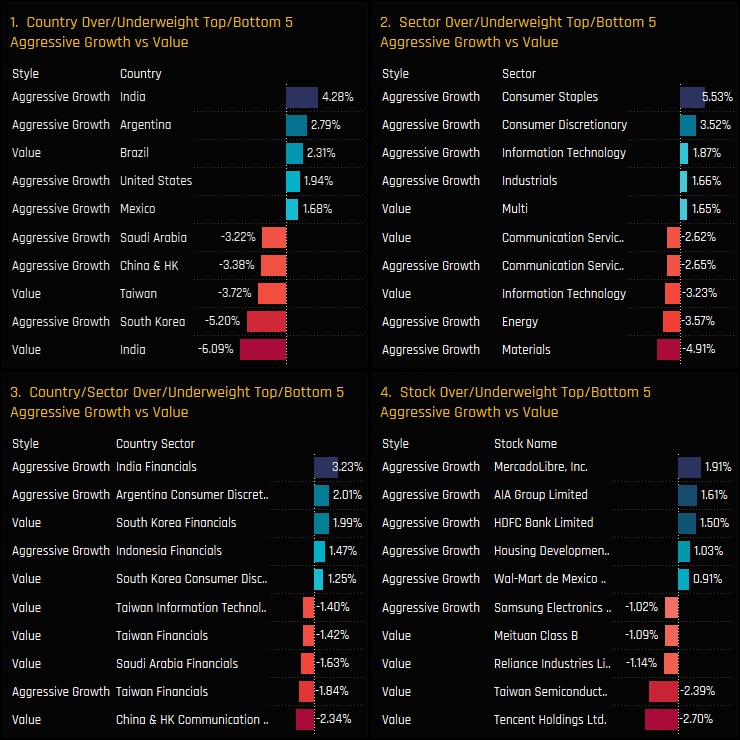
Chart 1 breaks down the regional weights by fund Style, alongside the iShares MSCI EEM ETF allocation. Asia is the dominant region for all Style groups, though all are positioned underweight the iShares EEM ETF on average. All Style groups with the exception of GARP differ from the benchmark in their EMEA and Americas allocations, with EMEA the 2nd largest weight in the benchmark but the 3rd largest among the other Style groups. Chart 2 ranks the largest net overweight and underweight allocations by region, with Americans the key overweight for all Styles and Asia the key underweight.
On a country level, all Style categories rank China & HK, Taiwan, India and South Korea as their top 4 country allocations. Of the 4, Value funds rank South Korea higher up the ranks than peers and also run a larger overweight in Brazil. The big difference is in India, with Aggressive Growth funds running a +4.28% overweight compared to Value a -6.09% underweight. Non-benchmark positions in Argentina and the United States are key overweights for Aggressive Growth, whilst GARP funds occupy some of the larger underweight positions in both China & HK and India.
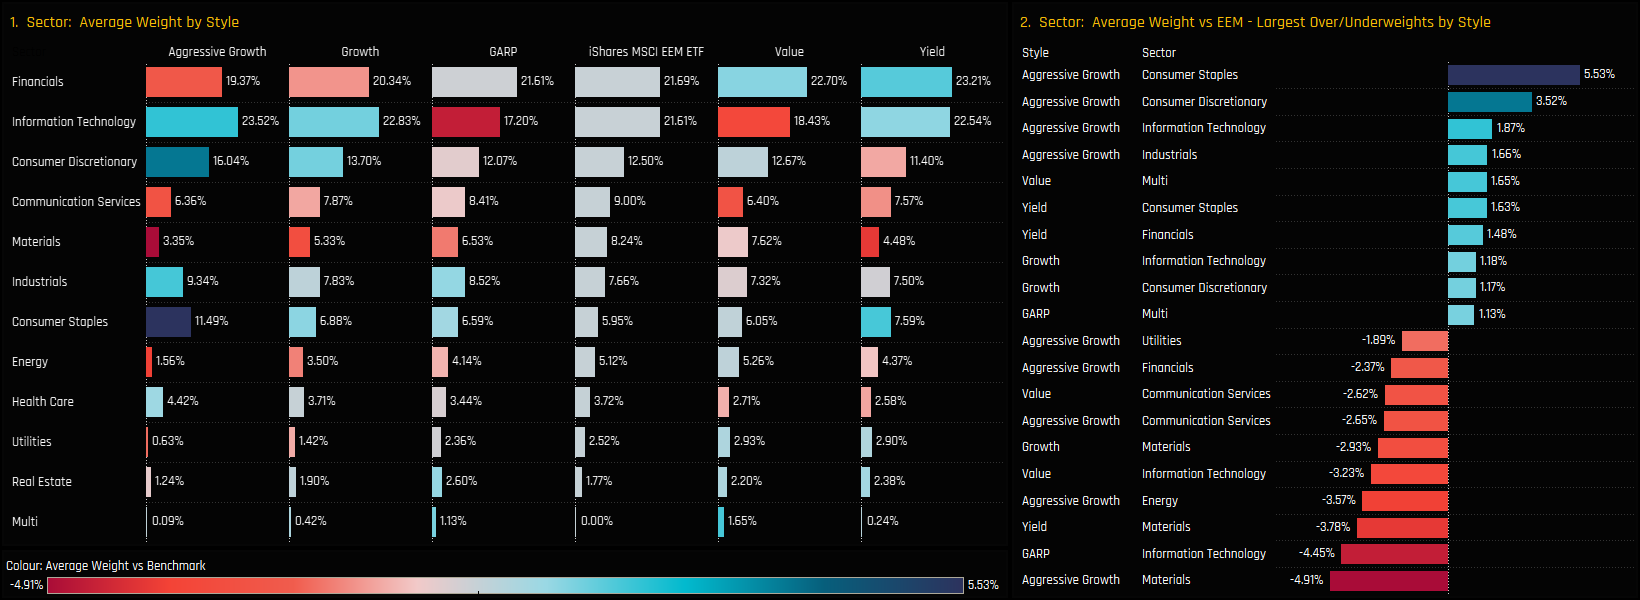
Sectors
Financials and Information Technology are the top 2 sector allocations across the board, though Tech is preferred for Growth funds and Financials for Value. The standout overweights are in Consumer Staples (+5.5%) and Consumer Discretionary (+3.5%) among Aggressive Growth funds, offsetting a sizeable underweight of -4.9% in the Materials sector.
Value funds are more closely aligned to the benchmark in their sector allocations, running underweights in Information Technology and Communication Services, and overweights in Financials and Multi-sector products. Other notable underweights are in Tech among GARP funds (-4.45%) and Materials among Yield funds (-3.8%).
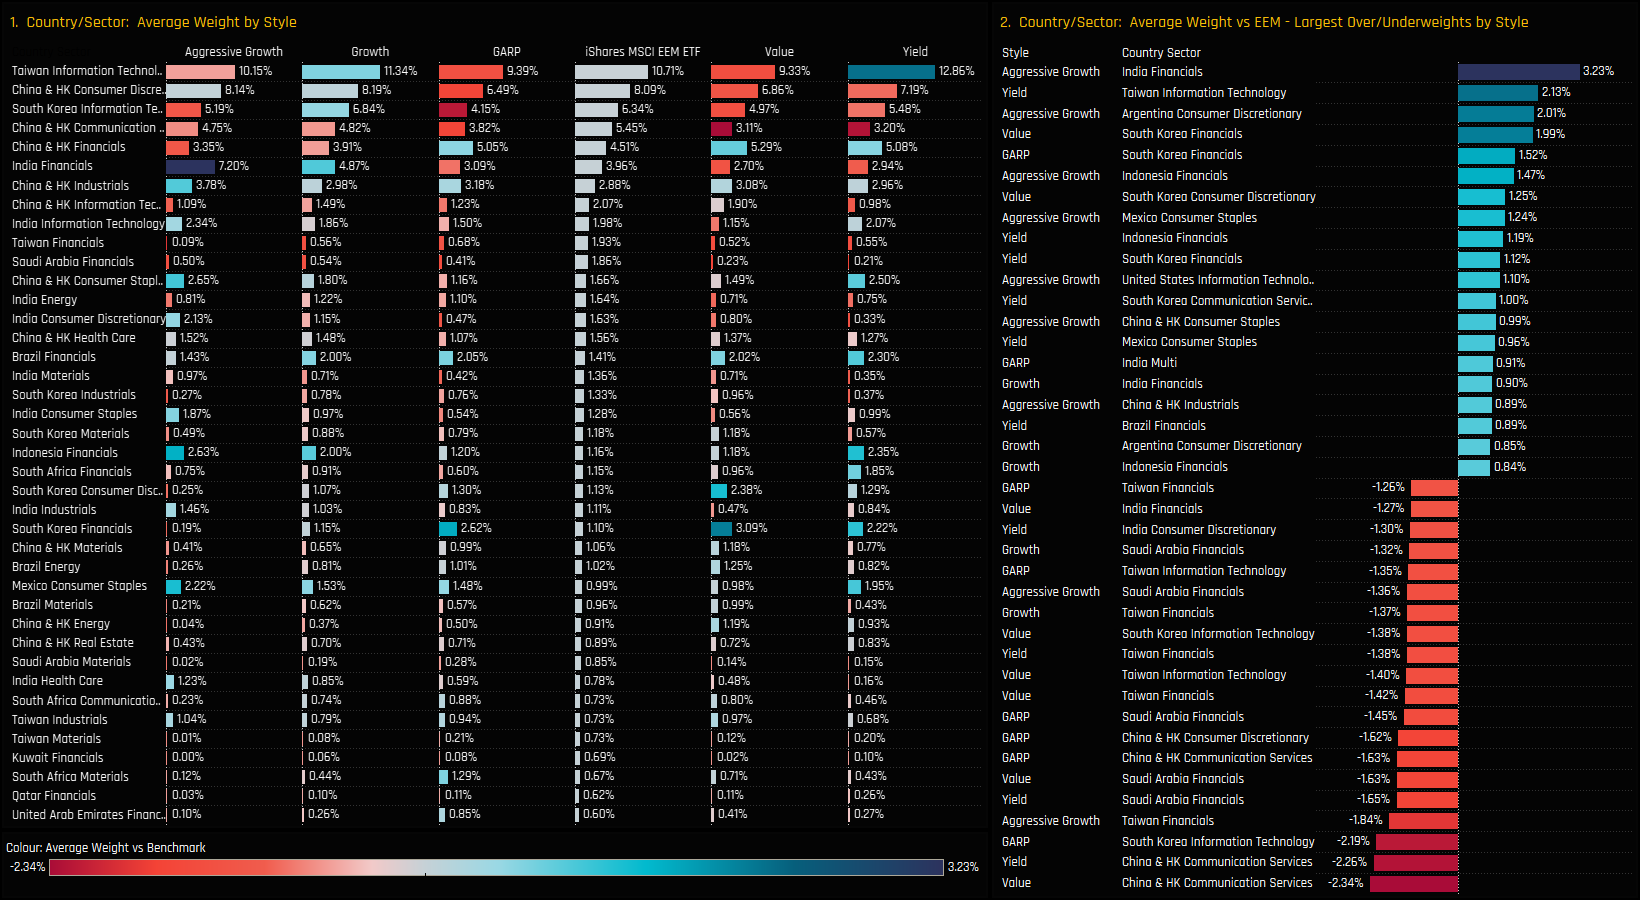
Country/Sectors
Taiwan Information Technology is the largest sector allocation for all Style groups, though Yield funds are particularly bullish with a +2.1% overweight. China & HK Communication Services is an underweight across the board, with Value funds running the largest underweight of -2.34%. GARP and Value funds are underweight each of the top 4 largest country/sector weights in the benchmark index.
Aggressive Growth funds are running sizeable overweights in Indian Financials, Argentina Consumer Discretionary and Indonesian Financials, offsetting underweights in Taiwan and Saudi Arabian Financials. Overweights in South Korean Financials are a standout for GARP, Yield and Value funds, offsetting underweights in the South Korean Technology sector.
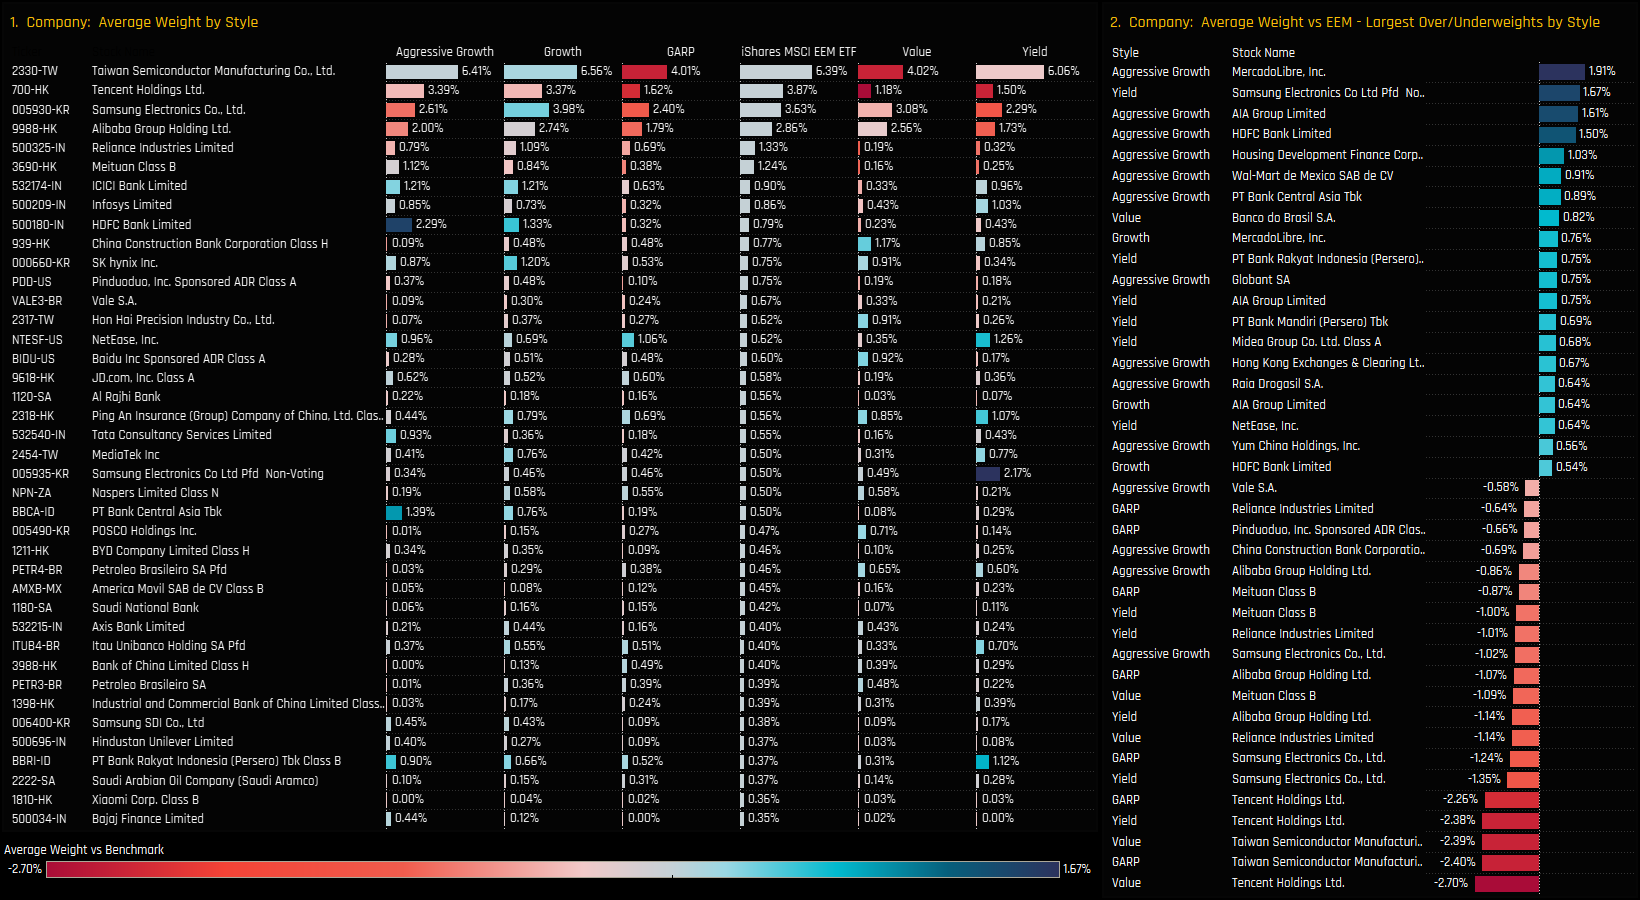
Company
TSMC is the largest stock holding for all Style Groups, with GARP and Value running decent sized underweights and Growth/Aggressive Growth small overweights. The remaining 3 big hitters of Tencent, Samsung Electronics and Alibaba Group Holdings all command good sized holdings across the Style spectrum, though Tencent and Alibaba Group are consensus underweights.
Aggressive Growth funds occupy the majority of the larger overweight positions, led by sizeable positions in MercadoLibre, AIA Group and HDFC Bank, among others. Value funds’ largest overweight is in Banco do Brasil, only partially offsetting underweights in the ‘big 4’ as well as in Meituan and Reliance Industries. Yield managers prefer Samsung Prefs, PT Bank Rakyat and AIA Group Limited.
Summary
That concludes our analysis on Style positioning. The chart to the right highlights the largest over and underweights among the 2 most extreme Styles; Value and Aggressive Growth.
For that performance to continue, Value funds will be hoping for the outperformance of Brazil and the underperformance of India. Technology is also a bone of contention, with 5.1% separating the Aggressive Growth overweight and the Value underweight. On a stock level, Aggressive Growth funds are more congregated in a select band of names, led by MercadoLibre, AIA Group and HDFC Bank. Value funds’ overweight positions are spread more evenly, but their underweights are pretty clear in Tencent, TSMC, Reliance Industries and Meituan.
372 emerging market Funds, AUM $402bn
MercadoLibre's Bullish Run Continues
• Despite MercadoLibre’s non-benchmark status, ownership among active EM managers has reached new highs.
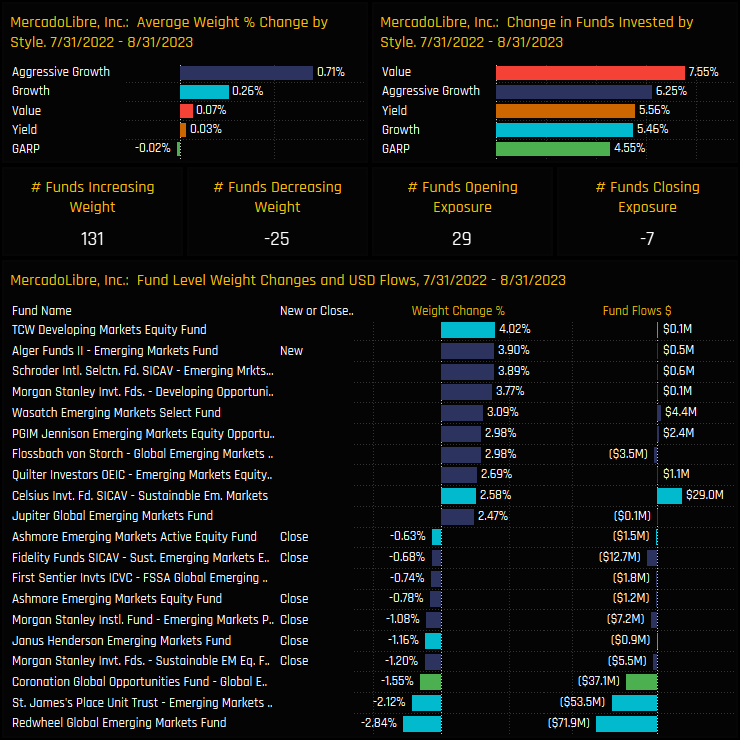
• MercadoLibre has been the beneficiary of significant manager rotation over the last year, with 131 funds increasing weights and 29 opening new positions.
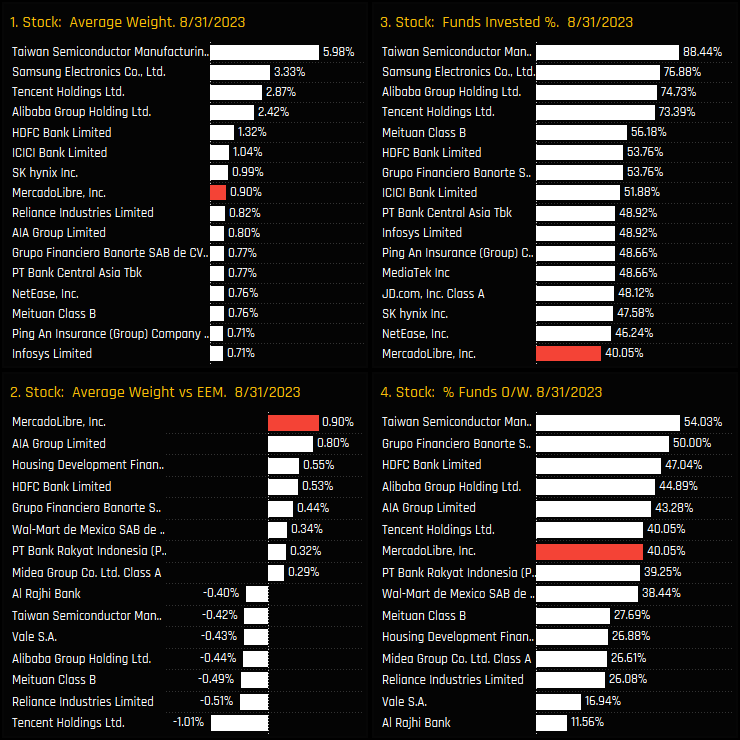
• MercadoLibre is now the 8th largest holding on an average weight basis and has recently overtaken AIA Group as the largest overweight stock position across all regions.
Time-Series & Stock Level Activity
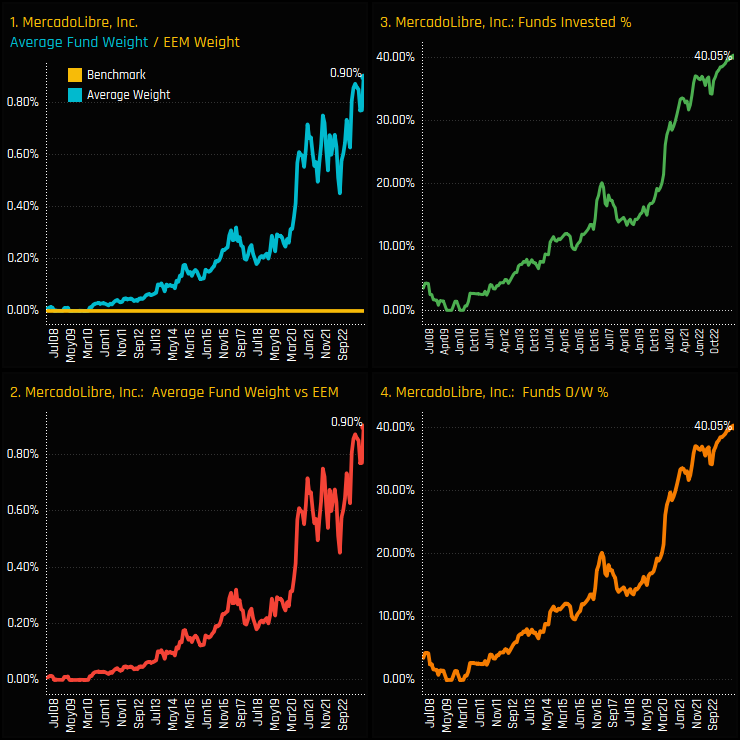
EM Fund exposure in MercadoLibre has reached new highs. The percentage of funds invested in MercadoLibre now stands at a record 40.05% (ch3) after resuming the upward trend of the last decade following a stall in 2021/22. This has pushed average holding weights to 0.9%, with both benchmark relative metrics following suit on account of MercadoLibre’s non-benchmark status.
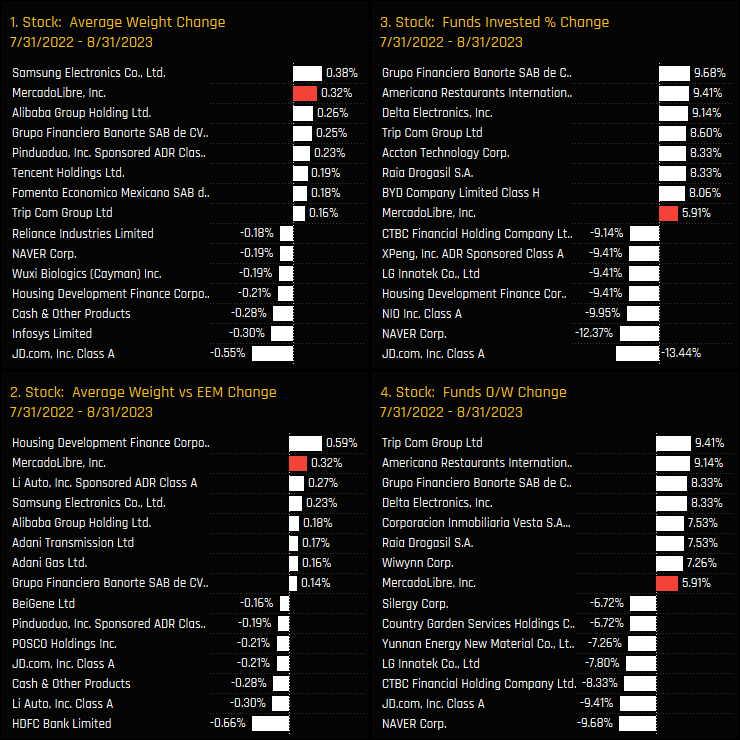
Since the resumption in the upward trend in July of last year, MercadoLibre has been one of the key beneficiaries of active manager rotation. The charts below show the change in our ownership metrics between 07/31/2022 and 08/31/2023. MercadoLibre saw the 2nd largest average weight increase of 0.32% after Samsung Electronics and the 2nd largest overweight increase after Housing Development Financials Corp. The fact that all measures of ownership moved higher confirms this as an active rotation.
Fund Activity & Latest Holdings
The fund level activity over the same period provides further details of this active rotation. All Style groups saw ownership levels rise, with 7.5% of Value funds opening new positions and 6.25% of Aggressive Growth. Of the 372 funds in our analysis, 131 increased weights in MercadoLibre and 29 opened new positions. Though the chart below appears to highlight an excess of closures, opening positions are numerous below the top 10 weight increases shown.
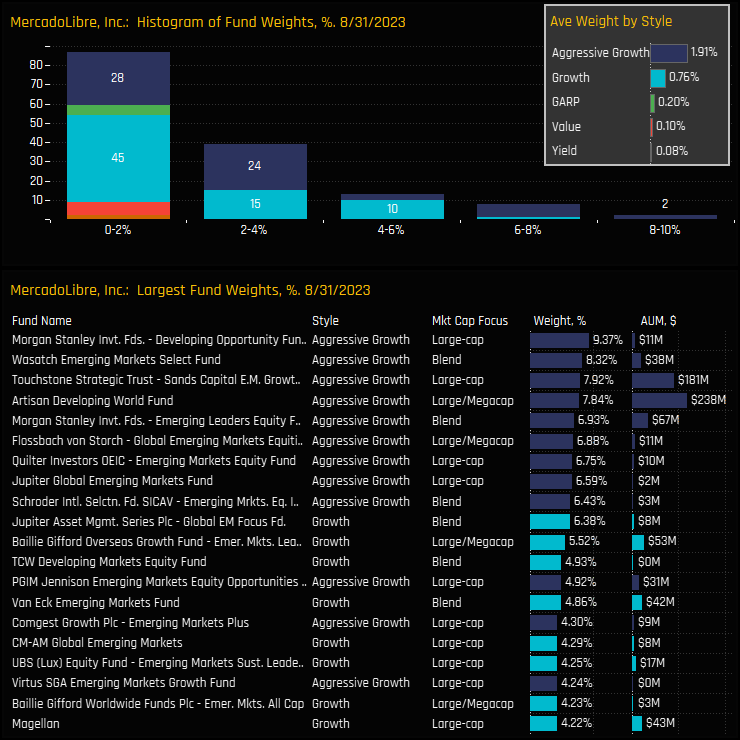
The spread of holding weights in MercadoLibre are shown in the Histogram below. The majority of positions sit between 0% and 2% with most of the investor base comprised of Aggressive Growth and Growth strategies. The tail to the upside is comprised of outsized positions from Morgan Stanley Developing Opportunity (9.37%) and Wasatch Emerging Markets Select (8.32%).
Conclusions & Data Report
This active rotation has further cemented MercadoLibre as a key player in the Emerging Market landscape. The charts opposite show our holding metrics for all stocks in the EM Universe. MercadoLibre is the 8th largest holding on an average weight basis and has recently overtaken AIA Group as the largest overweight stock position.
For managers to bank on a non-benchmark name with such conviction shows the belief they have on the investment case. Over the course of this year, this conviction has been justified and has contributed meaningfully to the active versus passive outperformance as highlighted in the previous piece. Moreover, in our analysis at least, there are few signs that this belief is wavering.
Click on the link below for an extended report on positioning in MercadoLibre among the GEM funds in our analysis.
For more analysis, data or information on active investor positioning in your market, please get in touch with me on steven.holden@copleyfundresearch.com
Investor Positioning Report — Copley Fund Research Ltd · Last updated: July 2026 · Registered in England and Wales
1. Who we are
Copley Fund Research Ltd provides proprietary institutional fund intelligence to listed companies and investor relations professionals. These terms govern every purchase of an Investor Positioning Report. By completing a purchase you confirm you have read, understood, and agreed to these terms in full.
2. What you are purchasing
The Investor Positioning Report is a bespoke PDF report mapping the institutional fund universe around your stock. It covers current investors, past investors, competitor investors, and white space investors. Every report is built from scratch for the specific company ordered and is not a standardised or templated product.
3. Delivery and process
Following payment or invoice issuance, Copley Fund Research will contact you within one working day to agree your competitor set. Production begins once the competitor set is confirmed in writing. The completed report will be released to you within 48 hours of production starting, provided payment has been received in full; where payment is outstanding, the report will be withheld until payment clears. If the requested company falls outside our covered fund universes, or a competitor set cannot be agreed, Copley Fund Research will issue a full refund or cancel the outstanding invoice.
4. Competitor set agreement
The competitor set is agreed with you in writing prior to production, and the report is built to that agreed specification. Requests to amend the competitor set after delivery, based on a change of preference rather than an error, may be treated as a new order.
5. Refund policy
Because each report is produced individually for your company, orders are non-refundable once production has begun, except as set out in clauses 3 and 5a below. By purchasing, you agree not to dispute the charge with your card provider on the basis that the service was not as described, provided the report has been delivered to the agreed specification or corrected under clause 5a.
5a. Quality remedy
If a delivered report contains a material error caused by Copley Fund Research — for example, an incorrect company analysed, a competitor omitted from the agreed set, or content missing from the specification in clause 2 — Copley Fund Research will correct and redeliver the report at no additional charge, within a reasonable timeframe. This is your sole remedy for such errors.
6. Data and accuracy
All fund positioning data in the report reflects holdings as disclosed at the most recently available reporting date at the time of compilation. The timing of fund holdings disclosures is determined by regulatory requirements applicable to each fund and is outside the control of Copley Fund Research Ltd. This data may not reflect current fund positions. Copley Fund Research takes reasonable care to ensure accuracy but makes no warranty, express or implied, as to the completeness or current accuracy of the underlying data — though this does not affect the quality remedy in clause 5a for errors in how that data was analysed or presented. Past fund positioning is not indicative of future fund behaviour or investment decisions.
7. Not investment advice
The Investor Positioning Report is produced for investor relations intelligence purposes only. It does not constitute investment advice, financial advice, or a recommendation to buy, hold, or sell any security. The data reflects historical fund positioning and must not be relied upon as a prediction of future fund behaviour or investment decisions. Copley Fund Research Ltd is not authorised or regulated by the Financial Conduct Authority for the provision of investment advice.
8. Permitted use and confidentiality
The report is licensed for internal use by the purchasing organisation only. You may share it with employees and directors of your organisation. You may not: reproduce, redistribute, publish, or resell the report or any part of it; share it with any third party outside your organisation without prior written consent; use the fund or portfolio manager names contained in the report to approach those individuals on behalf of Copley Fund Research or in a manner that could damage Copley Fund Research's relationships with those funds; or use the data for any purpose other than your own investor relations strategy. The data, analysis, and methodology contained in the report are the intellectual property of Copley


