Emerging Market Funds: 2022 Performance & Attribution Report

276 Active GEM Funds, AUM $343bn.

2022 Performance & Attribution Report

In this report, we provide an overview of 2022 performance among the GEM active funds in our analysis. We look at annual performance broken down by Style and Market Cap focus, together with longer-term analysis of active versus passive. We then identify the drivers behind 2022 performance based on the average active GEM fund stock portfolio versus the iShares Emerging Markets ETF (EEM).

2022 Active Returns

2022 was a challenging year for active EM managers. Average fund returns came in at -21.58%, underperforming the MSCI Emerging Markets index by -1.08% with 38.7% of strategies outperforming on the year.  Returns were correlated to Style, with Value and Yield funds outperforming their Growth peers, whilst on a Market Cap basis, the year belonged to Small/Midcap and Blend funds.

The top and bottom performers on the year are listed below.  Only Redwheel Next Gen EM (+2.94%) and Pictet Global Growing Markets (+0.95%) posted positive returns on the year, with the top 20 dominated by Small/Midcap and Blend strategies.  High Growth/Large-cap funds had a particularly tough year.


Returns by Style & Market Cap Focus

The grid below shows the top 3 and bottom 3 performers in each Style and Market Cap bucket

Time-Series Active v Passive

Active EM managers really lost the year in the first 4 months of 2022.  Widespread Russian overweights didn’t help, with active EM managers lagging the benchmark by -2.98% by the end of April.  Moderate outperformance in the proceeding 3 months, together with a strong September and October rescued the year somewhat for active EM funds.

Over the last 10-years, this puts 2022 as the 3rd worst performing year after 2016 and 2018, snapping a run of 3 years of consistent outperformance from active EM funds.  Cumulative 10-year alpha stands at +2.43%, on average.


Performance by Style and Active Category

The charts below show the average annual performance (top) and cumulative performance (bottom) split by fund Style over the last decade.  Aggressive Growth funds still lead the way over 10-years with returns of 21.82%, though the gap to Value has narrowed over the last 2-years.  Growth funds are the only Style group to have underperformed the benchmark over the period, on average.

Fund performance split by active category still provides strong evidence that an active approach is the way to go in EM.  High Active funds (active shares >75%) have returned +19.08% on average, versus 16.68% for Mid Active (60% < active share < 75%).  Low active funds, those with active shares below 60% have seen significant underperformance over the last decade.

10-Year Performance Summary

Fund Performance Contribution

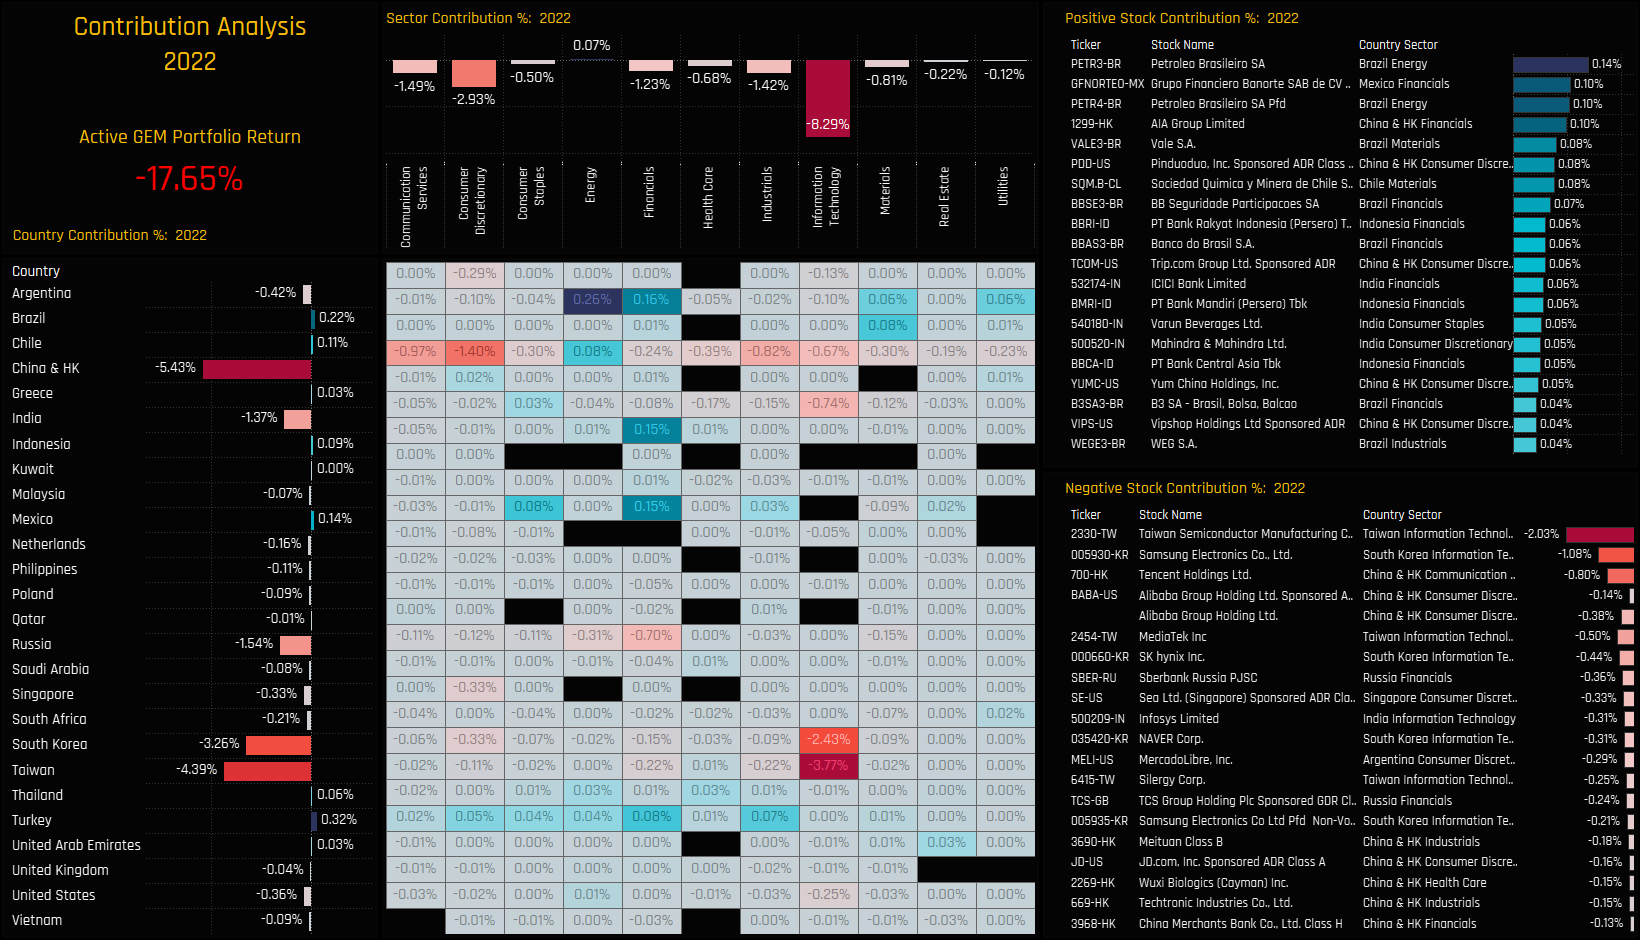
We now look at the drivers behind last year’s absolute and relative performance.  We do this by creating a portfolio based on the average allocations of the 276 active strategies in our analysis.  This theoretical portfolio, with no fees and based on monthly holding observations returned -17.65% on the year.  On a country level, -5.43% of that was driven by China & HK holdings followed by Taiwan (-4.39%) and South Korea (-3.26%).  Russia contributed -1.54%.  On a sector level, all sectors except Energy produced negative returns on the year, led by Tech (-8.29%), Consumer Discretionary (-2.93%) and Communication Services (-1.49%).  On a stock level, the major stock winners came from South America, India and ASEAN, with Petrobras, Grupo Financiero Banorte and PT Bank Rakyet contributing positively over the year.  The big detractors were large holdings in underperformers TSMC, Samsung Electronics, Tencent and Alibaba Group Holdings.  

Portfolio Attribution

We perform attribution analysis on this portfolio versus a representation of the benchmark based on the iShares MSCI Emerging Markets ETF.  The portfolio underperformed by -1.37% in 2022, a summary of the key drivers are documented below.

What worked:  

  • Cash holdings, Taiwan underweights, China Consumer Discretionary stock selection.
  • Consumer Staples overweights
  • India/Indonesian Financials overweights
  • Underweights in Nio Inc, TSMC, XPeng Inc.
  • Overweights in non-benchmark AIA Group and HDFC Group.  

What didn’t:  

  • Russian overweights, Saudi Arabia underweights, Argentina overweights
  • India Utilities and Industrials underweights
  • Materials and Energy underweights
  • Overweights in Sea Limited, MercadoLibre, Sberbank and TCS Group
  • Underweights in Vale SA, Pinduoduo, Petrobras.

For more analysis, data or information on active investor positioning, please get in touch with me on steven.holden@copleyfundresearch.com