In this issue:
China Banks: Optimism Fading
EM Restaurants: High Conviction Theme
Greece: Gaining Traction
Active Quant Portfolios
270 emerging market Funds, AUM $360bn
China & HK Banks: Optimism Fading
Lack of faith in China & HK Banks as positioning slumps to all-time lows.
Time Series & Peer Positioning
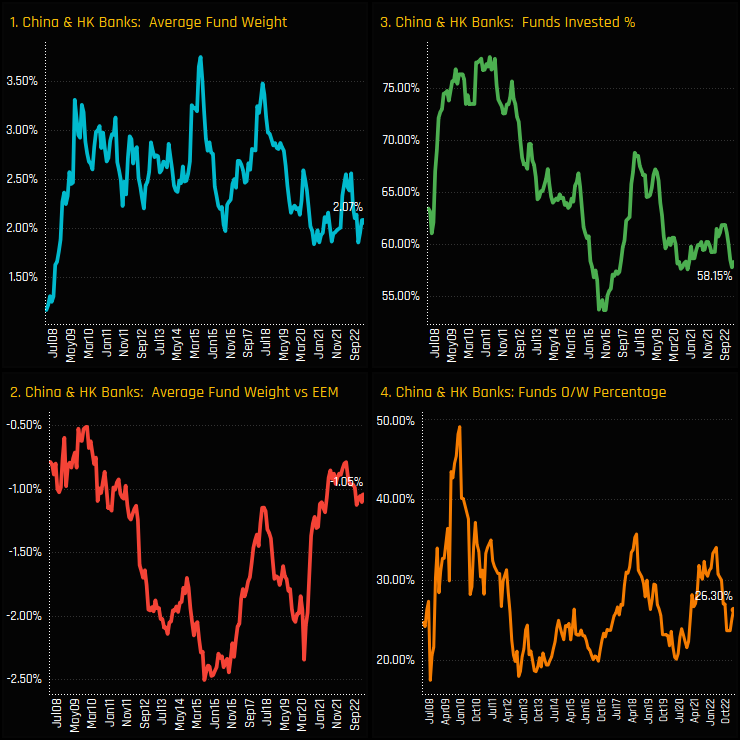
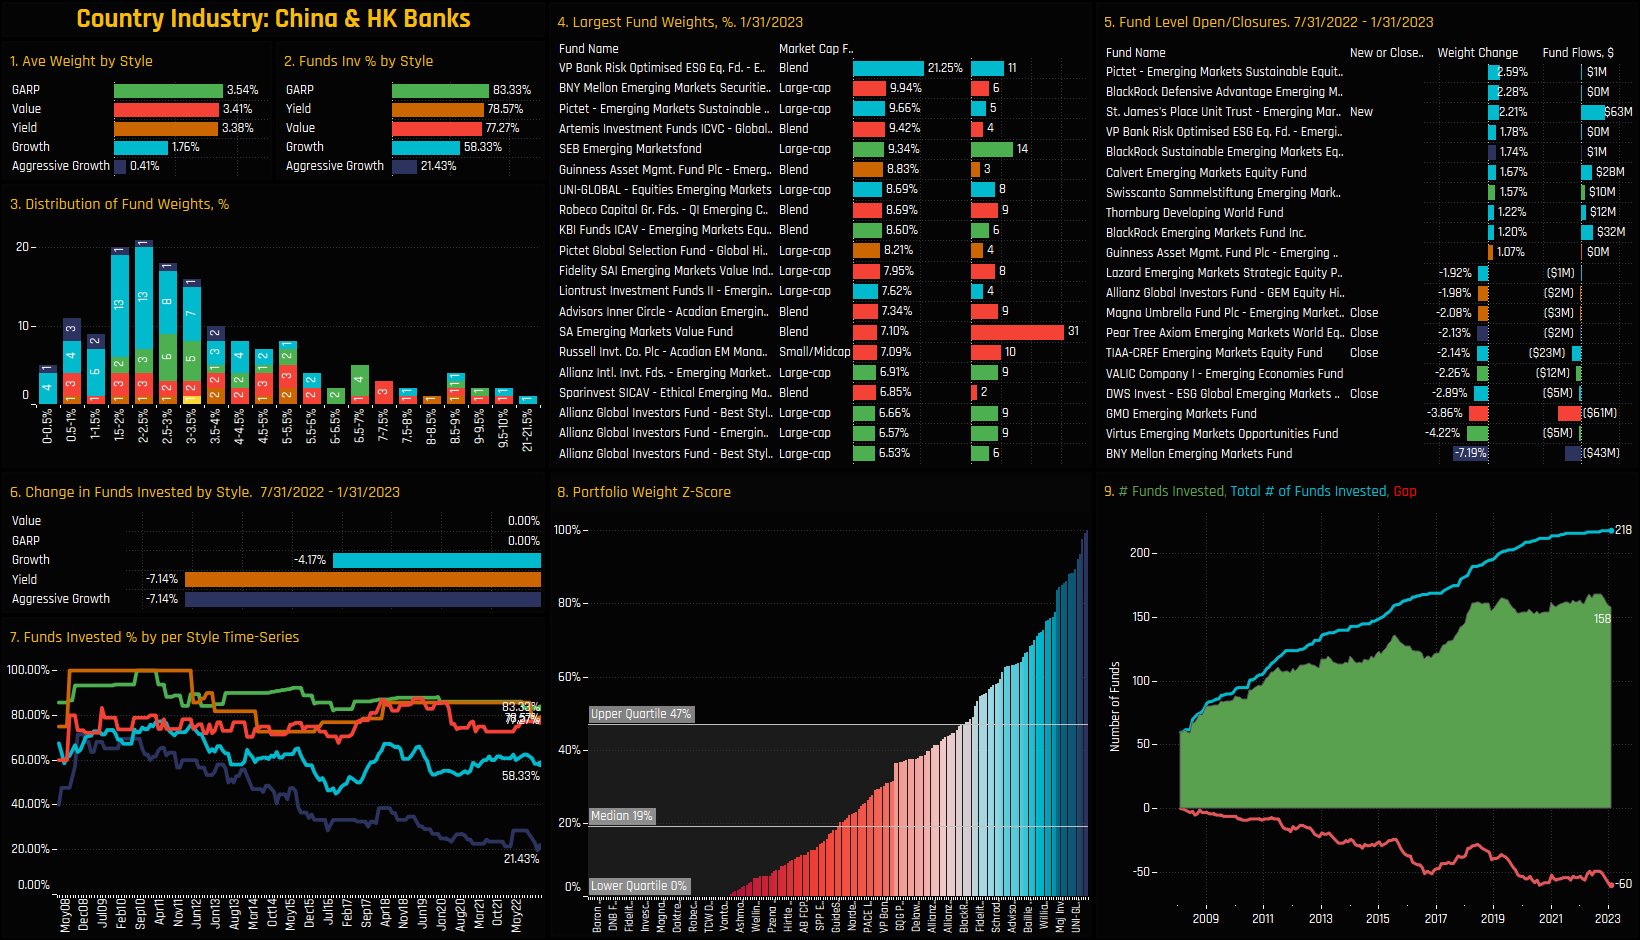
Allocations in China & HK Banks are at depressed levels. Average weights of 2.07% sit at the lower end of the 15-year range (ch1), with EM funds running a consistent underweight since our records begin in 2008 (ch2). The percentage of funds with exposure to China & HK banks has fallen from a high of 78% in 2011 to just 58.2% today (ch3), with nearly three quarters of funds positioned underweight the iShares MSCI EM ETF benchmark (ch4).
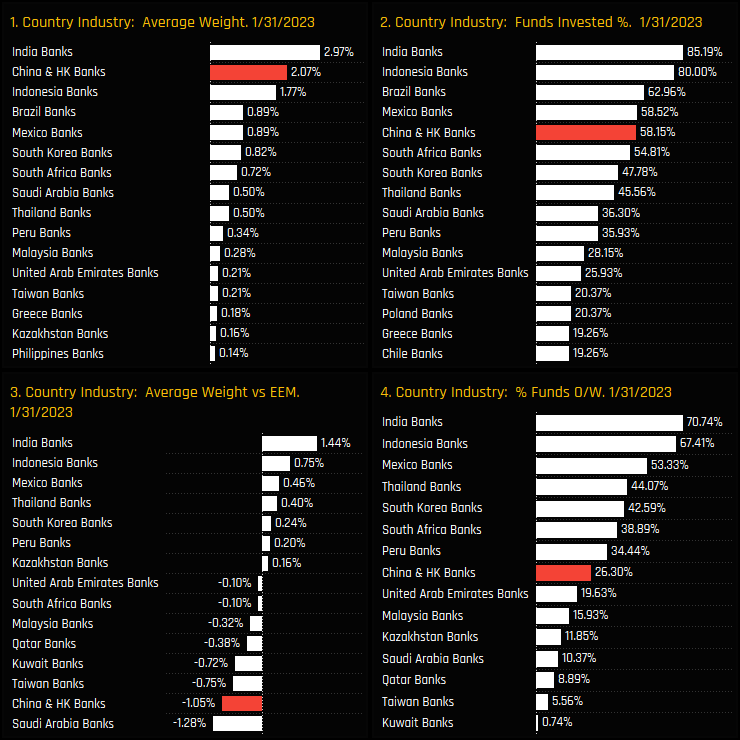
Compared to EM Banking peers, China & HK Banks are the 2nd largest allocation on an average weight basis behind Indian Banks (ch1), yet more funds have exposure to Mexico, Brazil and Indonesian Banks (ch2). Relative to benchmark, active EM funds are running underweights in Saudi Arabian, China & HK and Taiwan Banks to fund overweights in India, Indonesia and Mexico Banks (ch3).
Banks Activity and Long-Term Trends
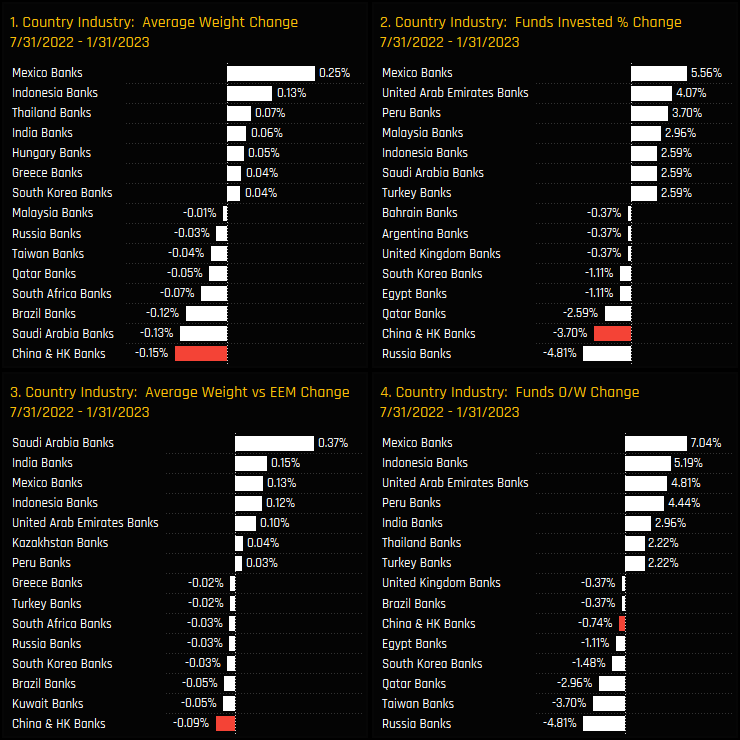
Activity over the last 6-months highlights the declining investor appetite for China & HK Banks exposure. All measures of fund ownership moved lower, with investors instead raising allocations to Mexican and ASEAN Banking stocks.
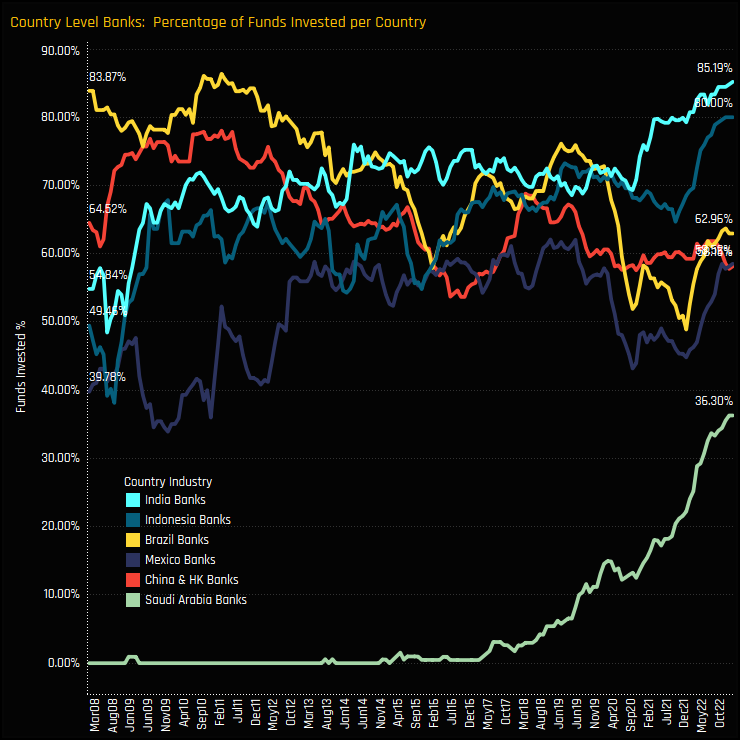
The time-series of the percentage of funds invested in each Country Banking sector highlights how China & HK Banks have fallen down the ranks over the past 15 years. Whilst Indian and Indonesian banks have soared to new ownership highs, China & HK Banks have been stagnant and have not participated in the recent upturn in Financials sector exposure since late 2021.
Fund Holdings & Activity
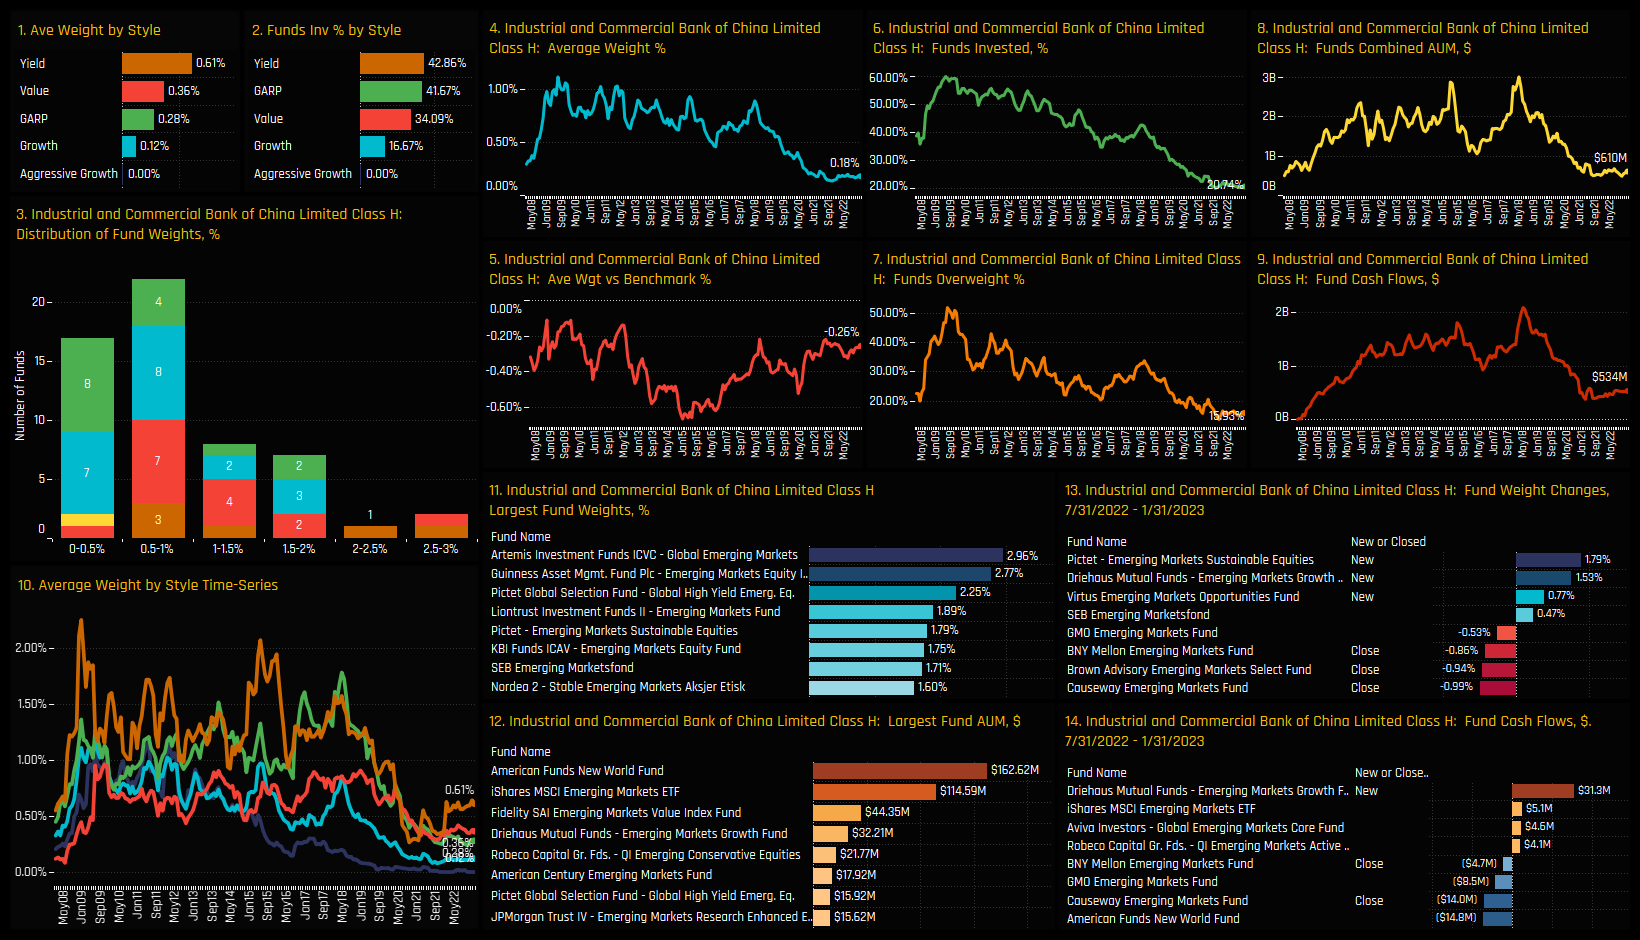
Among current holders, the bulk of the portfolio weight distribution sits between 1.5% and 3.5%, though there is a tail to the upside led by VP Risk Optimised ESG (21.25%) and BNY Mellon EM Securities (9.94%). Over the longer-term, Growth and Aggressive Growth funds have driven allocations lower (ch7), with both groups lightly allocated compared to Value focused peers. Activity over the last 6-months saw heavy rotation out of China banks from BNY Mellon EM and Virtus EM Opportunities, and numerous closures led by DWS ESG Global EM and TIAA-CREF EM Equity(ch5).
Chart 8 shows the Z-Score of current fund weights versus history for China & HK Banks. A value of 100% means today’s weight is the highest on record for that fund, zero the lowest. With a median Z-Score of 19%, EM funds are lightly allocated compared to their own history. Chart 9 plots the total number of funds (out of 270) who have ever owned China & HK Banks (blue line) versus the number of number of funds invested at any one time (green line) and the red line the difference. A download sloping red line means existing investors are closing out positions, with the gap of 60 funds the largest on record. It’s a picture of declining sentiment.
Stock Positioning & Activity
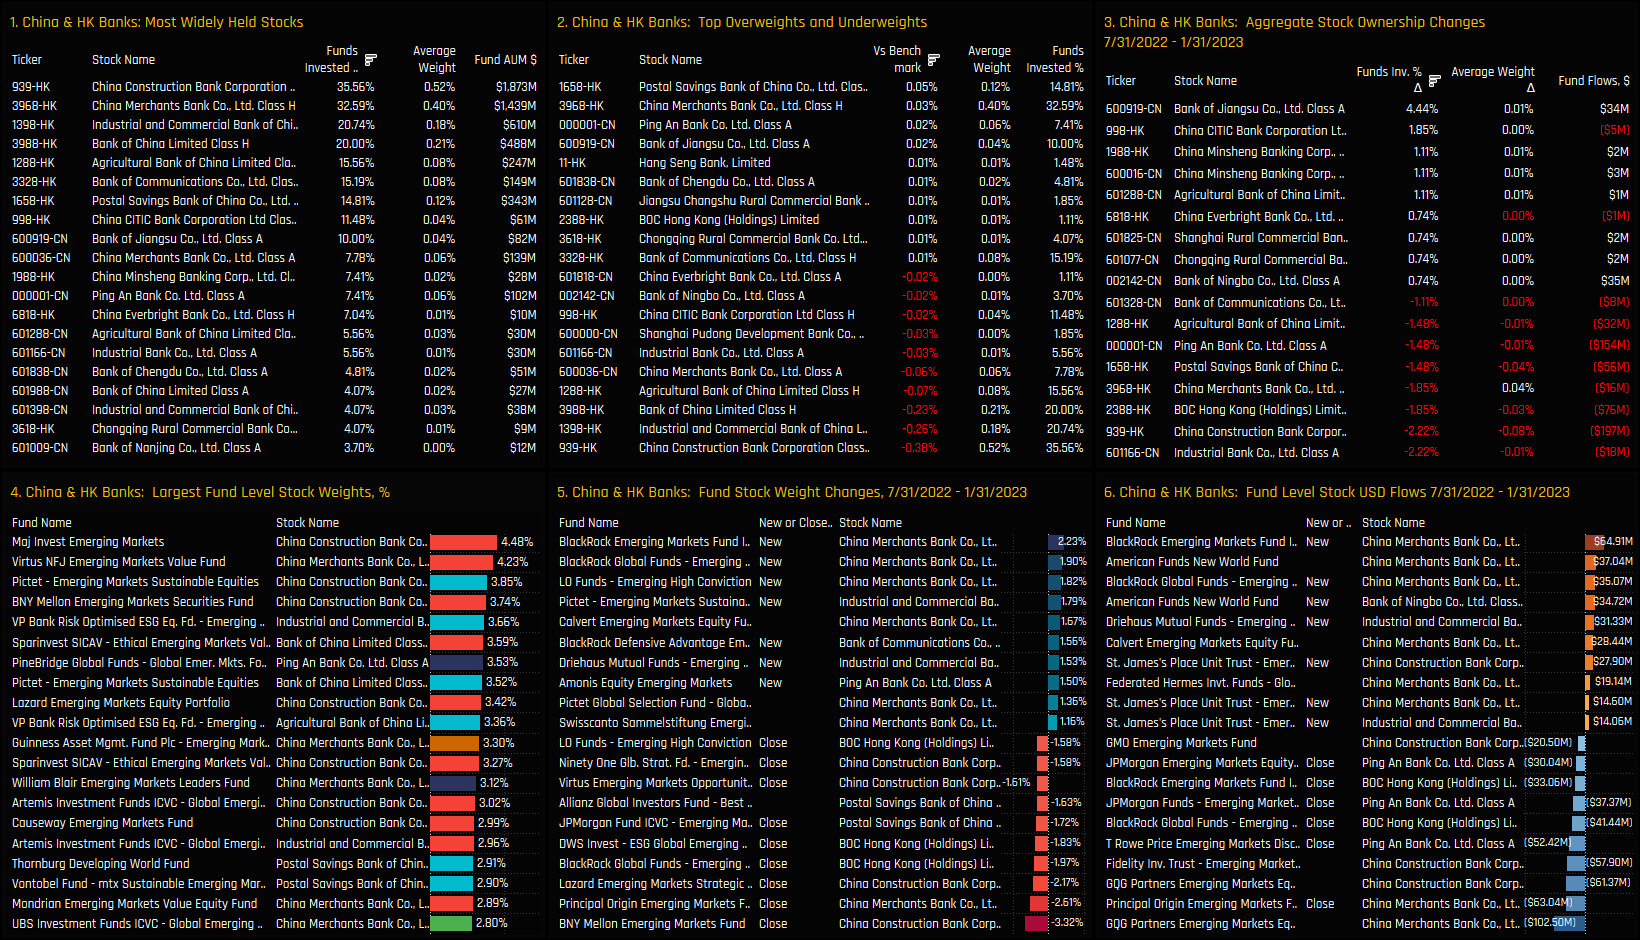
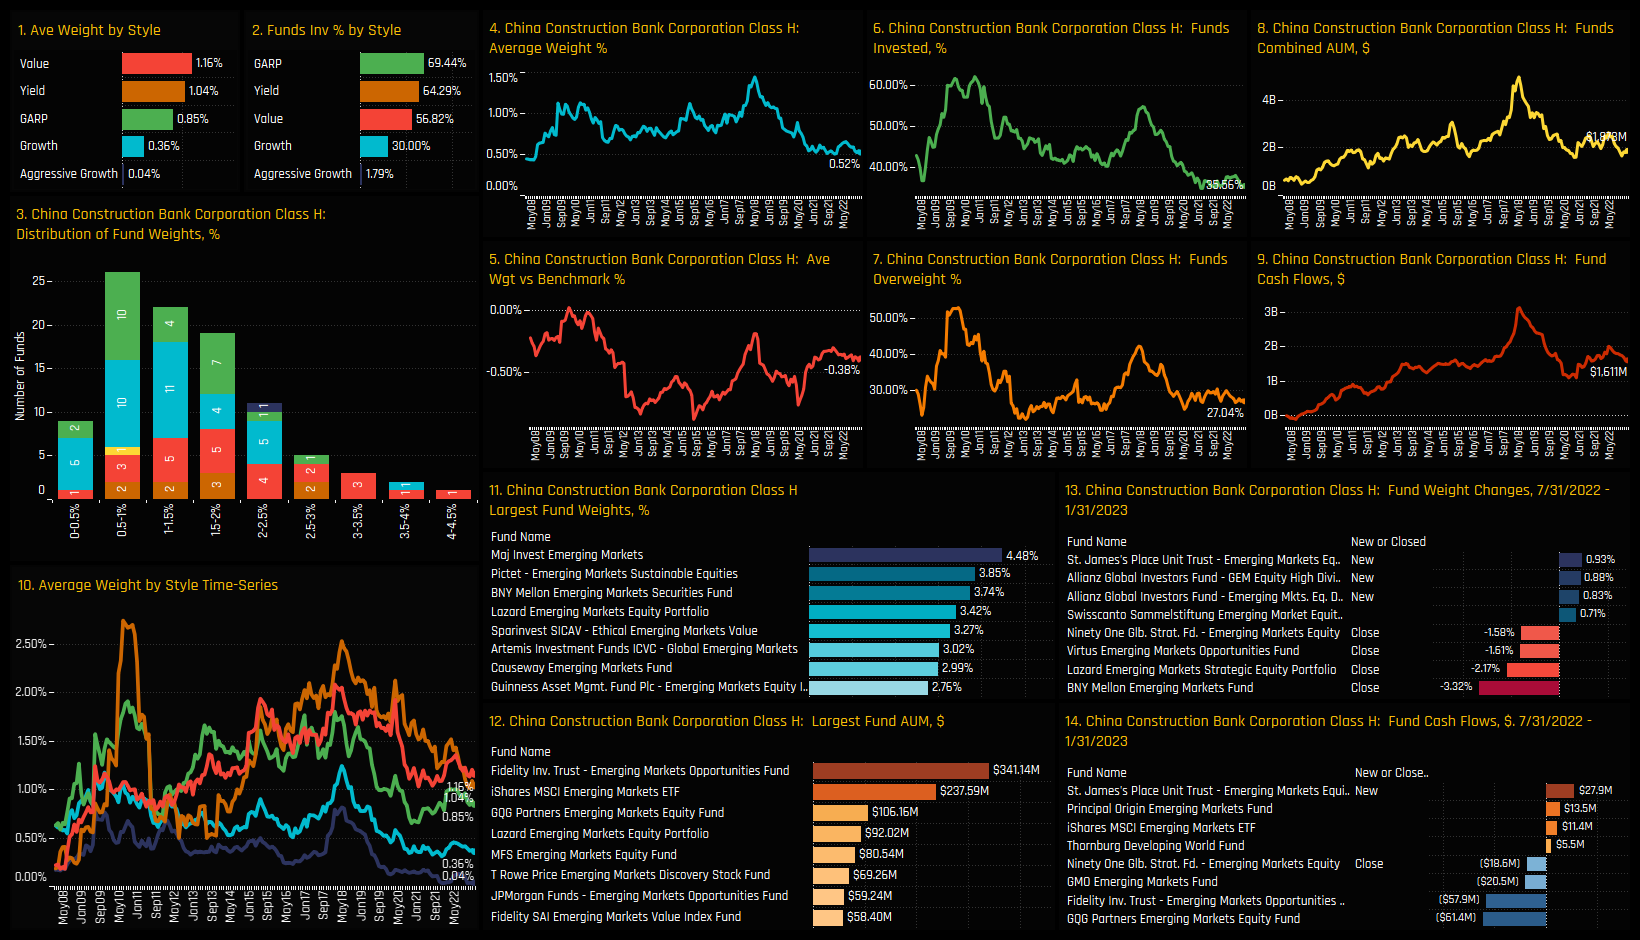
The most widely held stocks are China Construction Bank and China Merchants Bank, which together account for 44% of the total China Banks weight (ch1). China Construction Bank, ICBC and Bank of China are the leading underweight exposures (ch2), with the latter 2 only owned by 20% of the EM funds in our analysis. Outside of these 4 stocks, ownership levels are dispersed across a further 40 companies and in small size.
Stock activity between 07/31/2022 and 01/31/2023 was skewed to the sell-side, with ownership levels falling in most of the major industry holdings (ch3). China Merchants bank saw good 2-way activity, with Blackrock and LO Funds opening new exposure against GQG Partners reducing stakes and Principal Origin closing altogether (ch 5&6).
Conclusion and Links
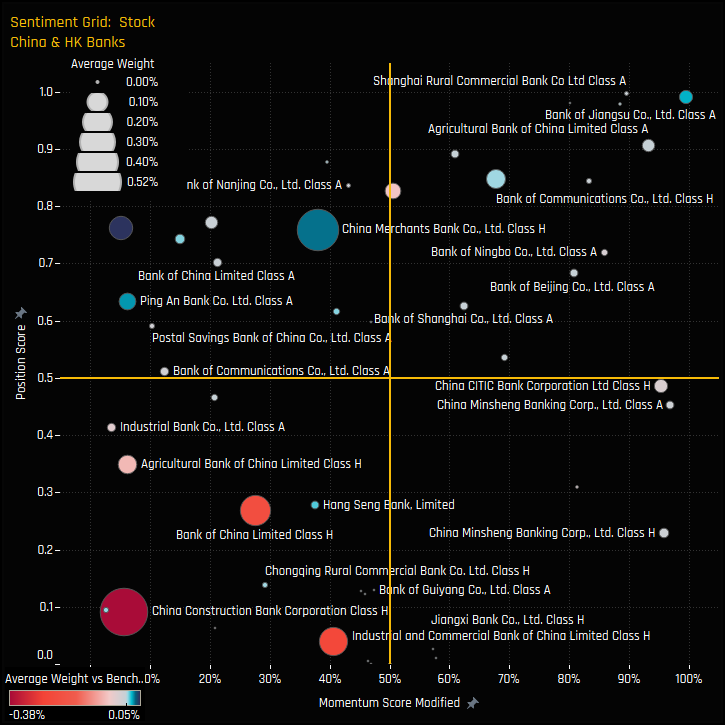
The sentiment grid opposite shows where current positioning in each China & HK Banking stock sits versus its own history going back to 2008 on a scale of 0-100% (y-axis), against a measure of fund activity for each stock between 07/31/2022 and 01/31/2023 (x-axis). It is a picture of low positioning and negative sentiment for the major names in the sector. The few bright spots are in fringe names such as Bank of Jiangsu Co and Shanghai Rural Commercial Bank.
All of this points to a complete lack of faith in China & HK Banks to deliver outsized performance in the months/years ahead. This isn’t an industry phenomenon, it’s very much specific to China & HK Banks, with rising ownership and overweight positioning in other EM countries, notably India, Indonesia and Mexico Banks.
Click on the link below for our data pack on China & HK Banks positioning among active EM funds. Scroll down for stock profiles on China Merchants Bank, ICBC and China Construction Bank.
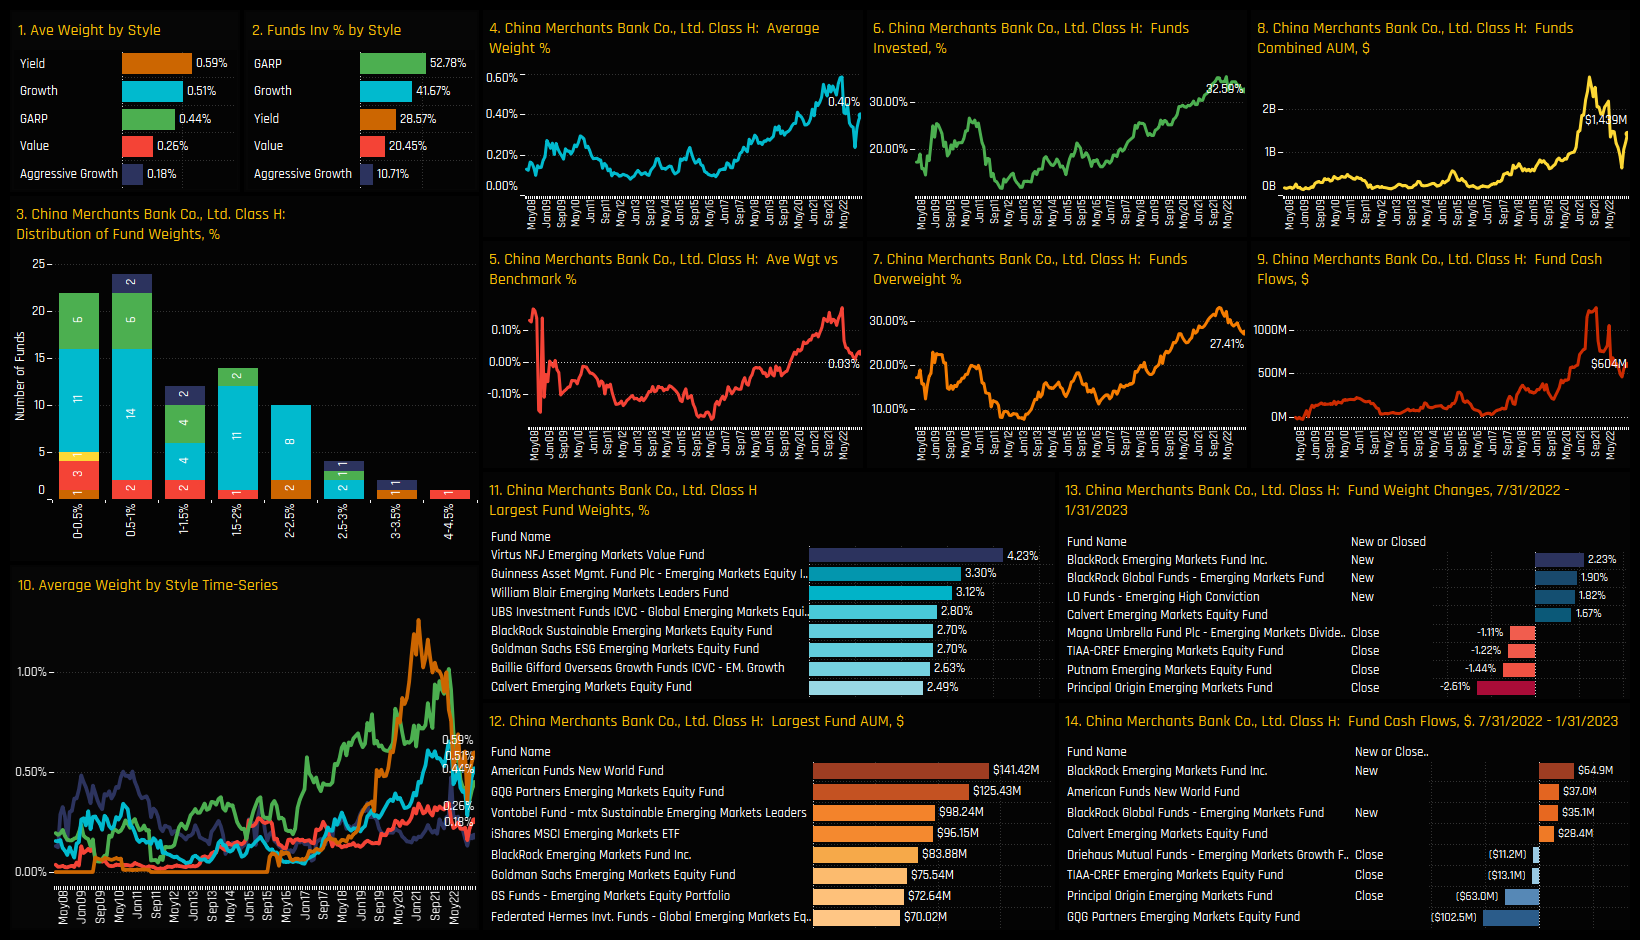
Stock Profile: Industrial and Commercial Bank of China, Class H
China Construction Bank Corp, Class H
270 emerging market Funds, AUM $360bn
Restaurants: High Conviction Theme
Rising allocations, record exposure and high conviction among selected managers - Restaurants are becoming a key theme among active EM investors.
Time-Series & Sentiment
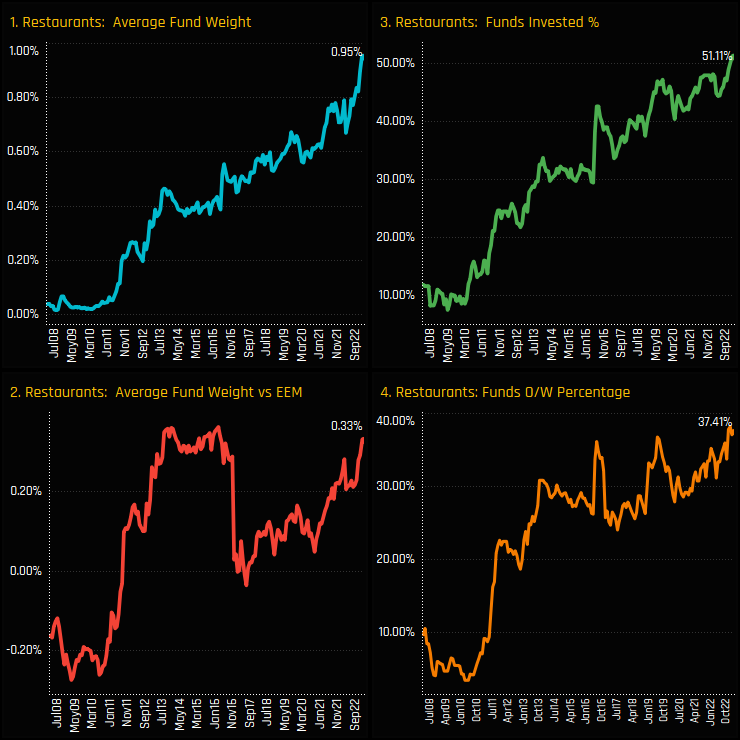
EM fund exposure in the Restaurants industry group is soaring to new heights. A record 51.1% of the EM funds in our analysis now have exposure at an average weight of 0.95%. Relative to the iShares MSCI EM ETF benchmark this equates to a net overweight of +0.33%, with 37.4% of funds positioned above the index.
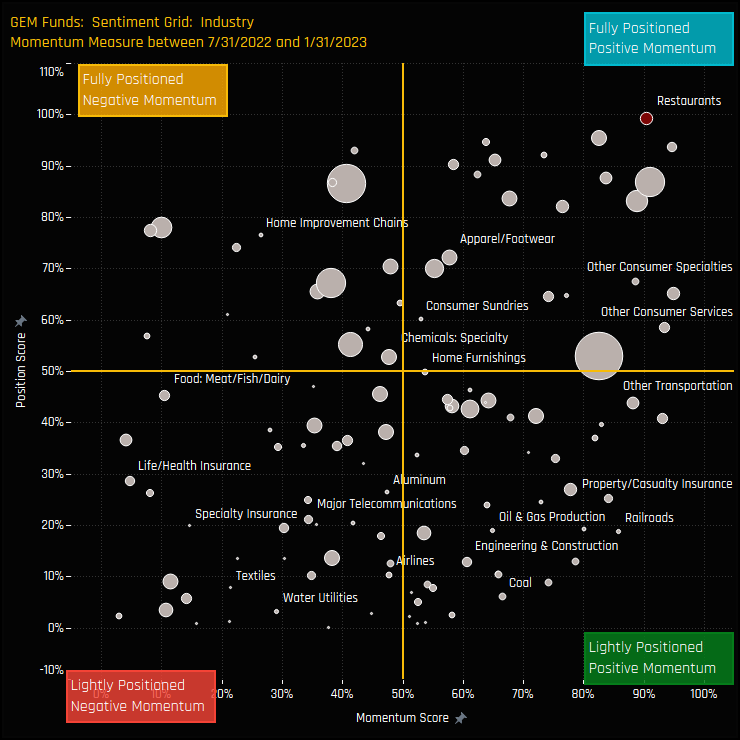
The sentiment grid below shows where current positioning in each Industry group sits versus its own history going back to 2008 on a scale of 0-100% (y-axis), against a measure of fund activity for each Industry between 07/31/2022 and 01/31/2023 (x-axis). Restaurants are at the zenith of both positioning and momentum across all the Industry groups in EM.
Fund Activity & Style Trends
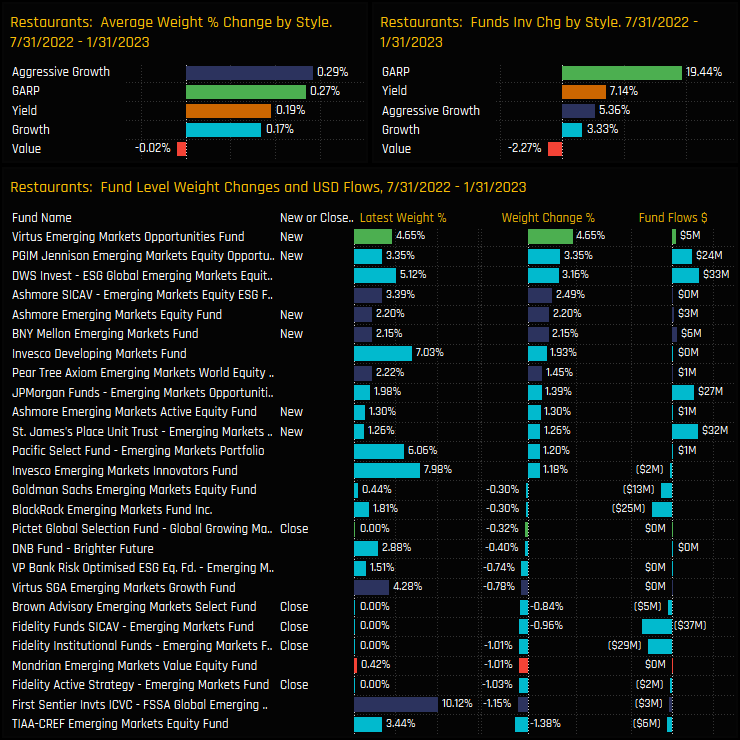
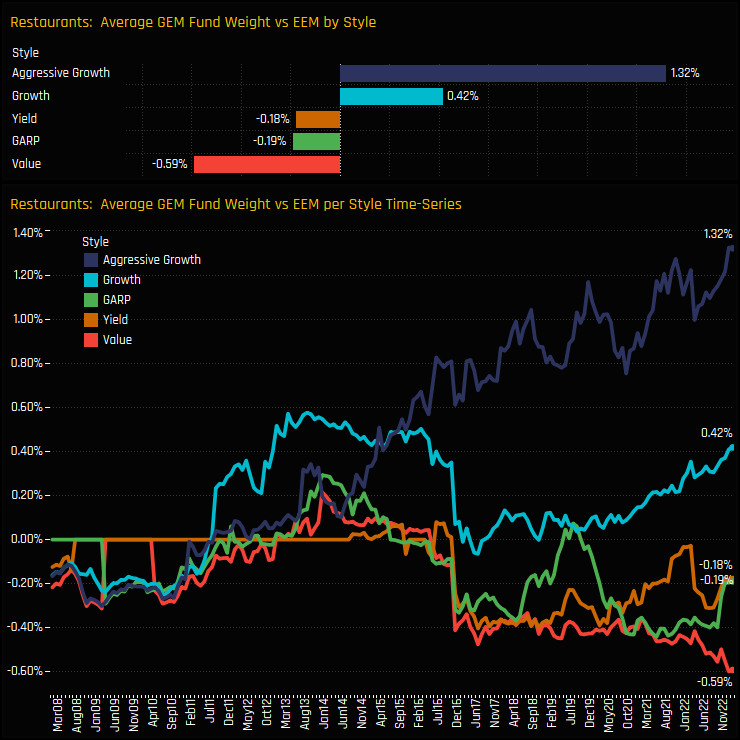
Increases in positioning were seen across all the Style groups save for Value investors, with a significant 19.4% of GARP managers opening exposure over the last 6-months. New positions were led by Virtus EM Opportunities (+4.65%) and PGIM Jennison EM Opportunities (+3.35%), with the largest increases in weight dominated by Growth and Aggressive Growth investors.
The increase in Growth and Aggressive Growth positioning has been a longer-term trend, with a significant and consistent rotation over the past 5-years being a key driver behind record positioning in the Industry Group. In contrast, EM Value funds are positioned at their highest ever underweight of -0.59% below benchmark.
Stock Holdings & Activity
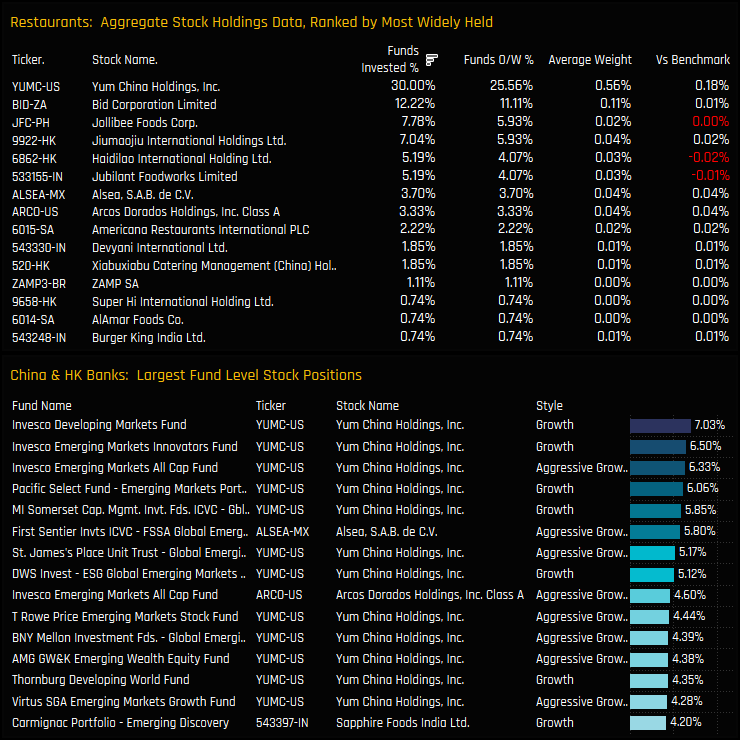
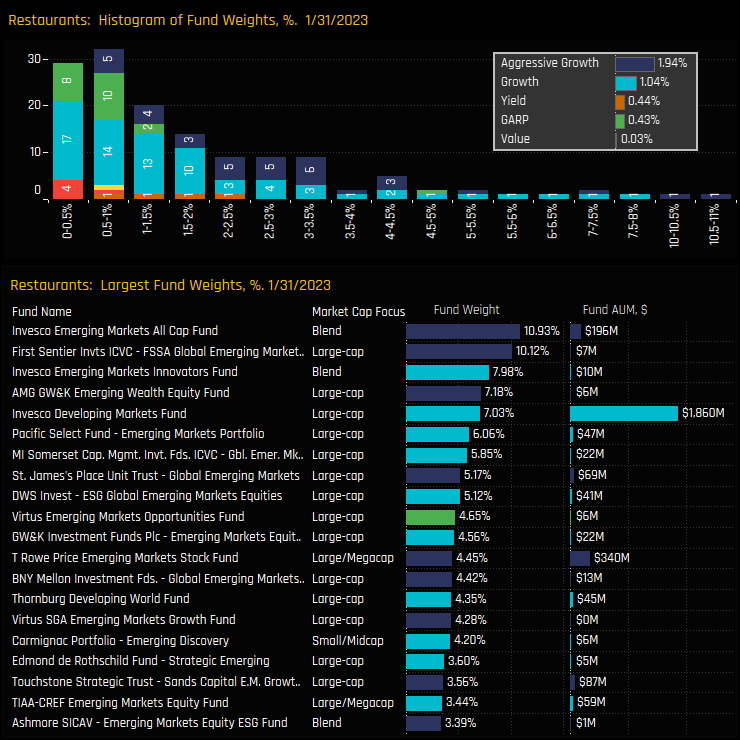
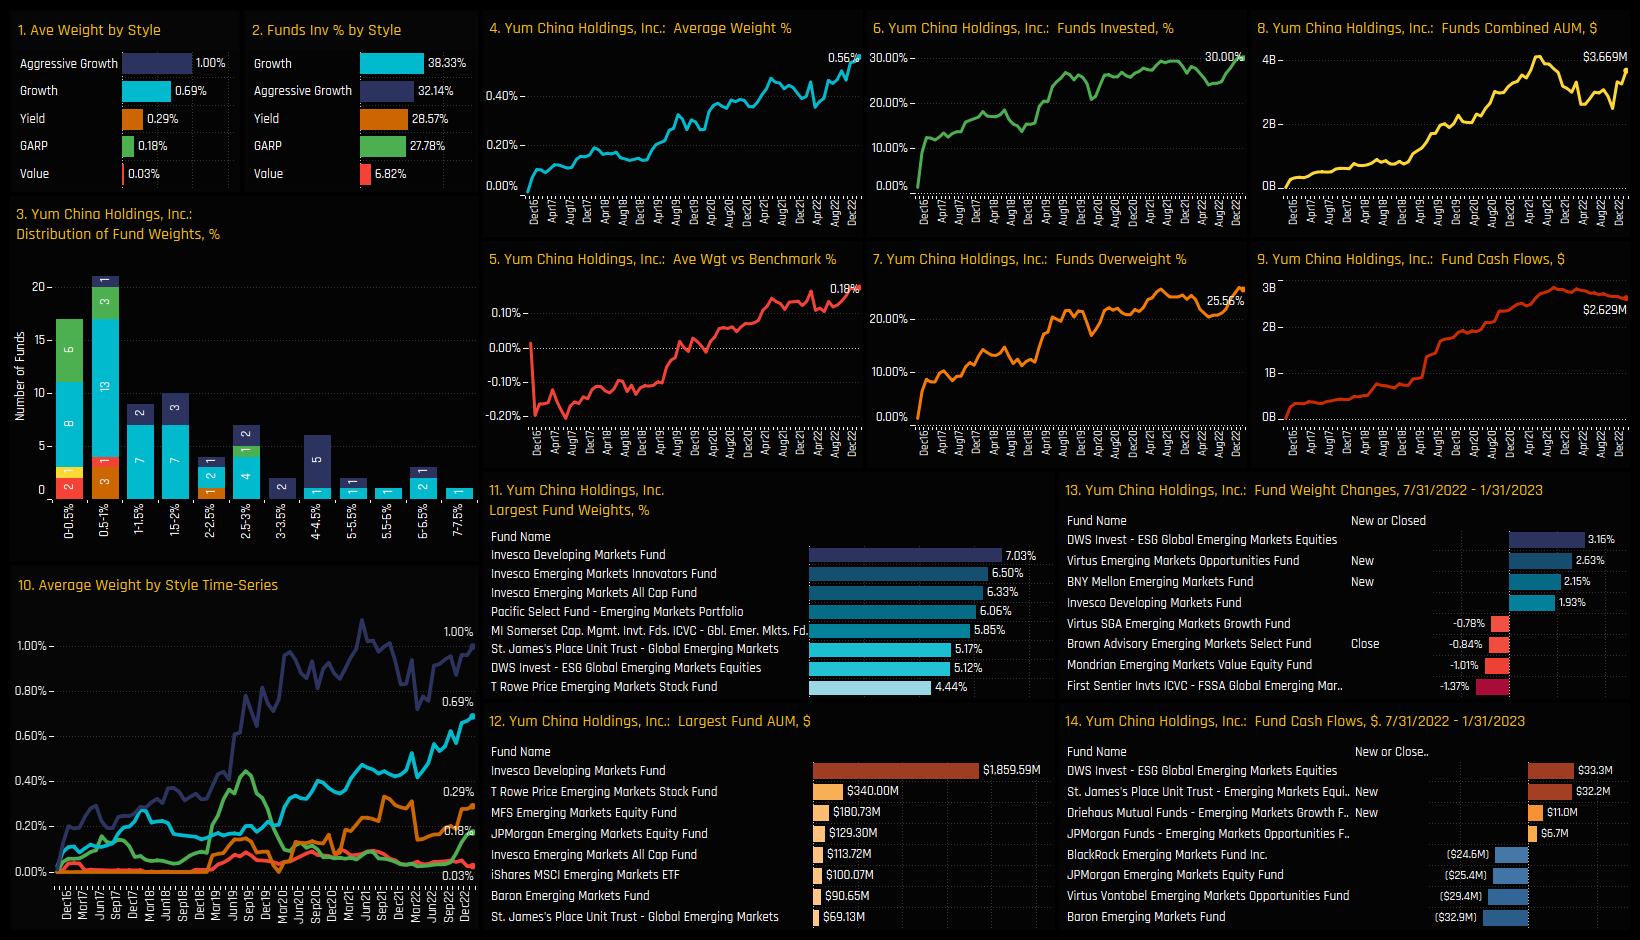
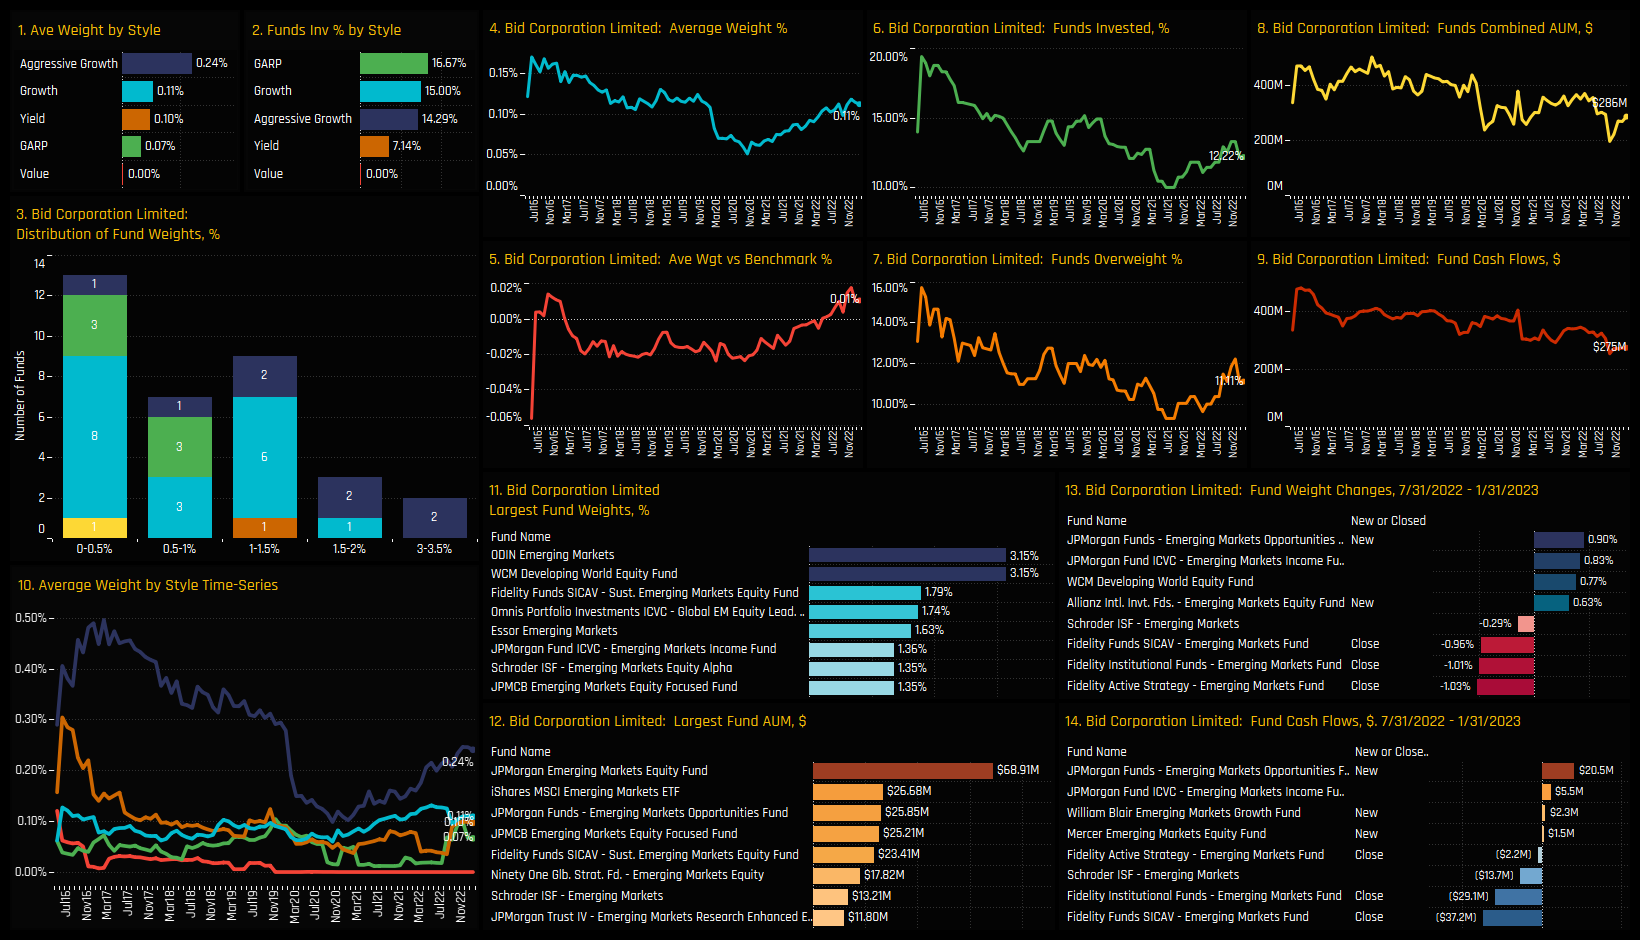
Stock exposure in the Restaurants Industry group is highly concentrated in a small number of names, and specifically weighted in favour of Yum China Holdings. A record 30% of funds now own Yum China Holdings, significantly more than the 2nd tier of names led by Bid Corporation and Jollibee Foods. It accounts for 12 of the largest 15 individual fund positions, led by the Invesco Developing Markets Fund position of 7.03%.
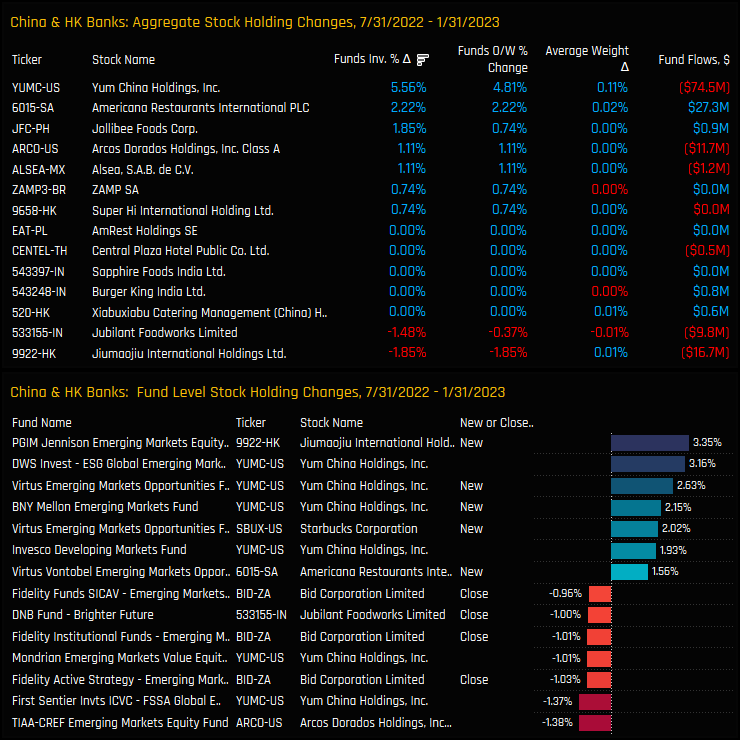
Ownership increases were seen in Yum China Holdings, Americana Restaurants International and Jollibee Foods over the last 6-months, whilst net positioning fell in Jiumaajiu International Holdings and Jubilant Foodworks Limited. Notable activity on a fund level were the position closures in Bid Corporation across the suit of Fidelity strategies and new positions in Yum China Holdings from Virtus EM Opportunities and BNY Mellon EM.
Conclusions & Data Report
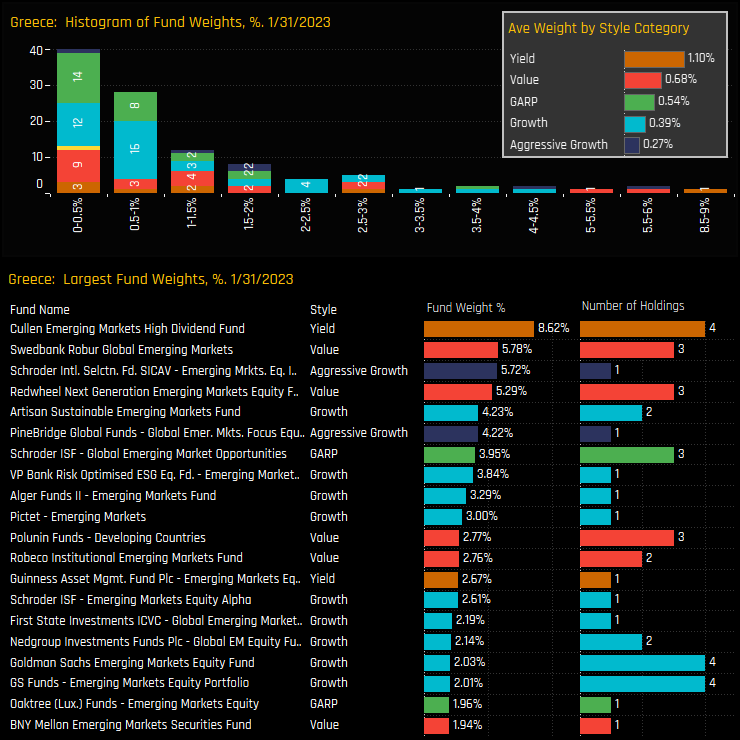
The chart opposite shows the latest snapshot of fund holdings in the Restaurants industry group. The top chart shows the histogram of fund weights, with the bulk of allocations below 1.5% but with a significant right-sided skew. Indeed, the ownership picture within the sector has been characterized by this skew, with selected Growth and Aggressive Growth strategies raising allocations to multiple times the average holding weight.
Funds led by Invesco EM All Cap and First Sentier Global EM are allocating over 10% to the Restaurant industry group, with a further 7 funds allocating more than 5%. Statistically, the ratio between the top 5 largest fund positions and the active fund average is 9.1x, that’s the 2nd highest ratio among the top 30 industry groups in EM, behind Household/Personal care.
When you add together the rising allocations, the record exposure and the extreme conviction among selected managers, Restaurants are becoming a high conviction theme among active EM managers.
Click on the link below for our data pack on Restaurant positioning among active EM funds. Scroll down for stock profiles on Yum China and Bid Corporation.
Active EM investors are beginning to pay renewed attention to Greece as evidenced by record average weights, increasing fund ownership and a net overweight stance.
Time-Series & Peer Group Positioning
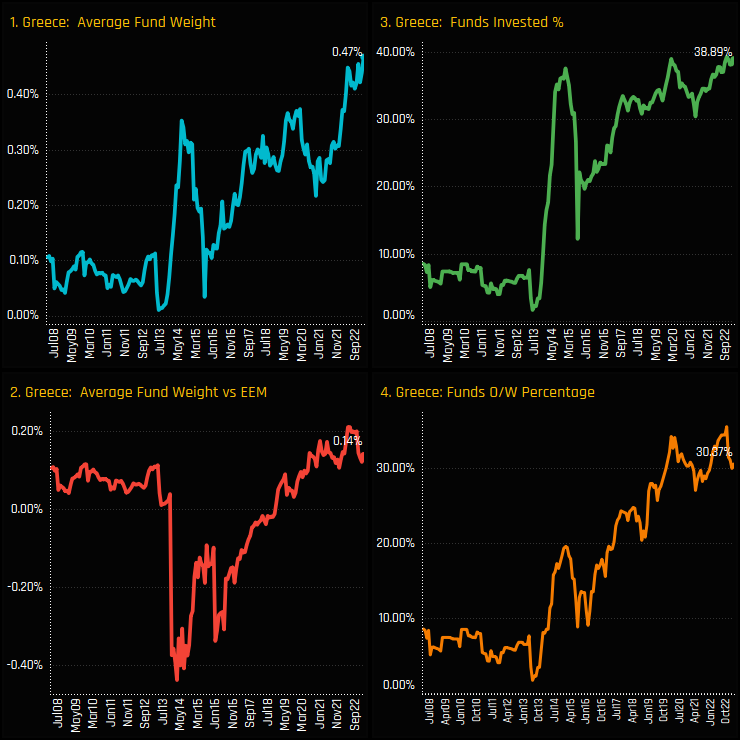
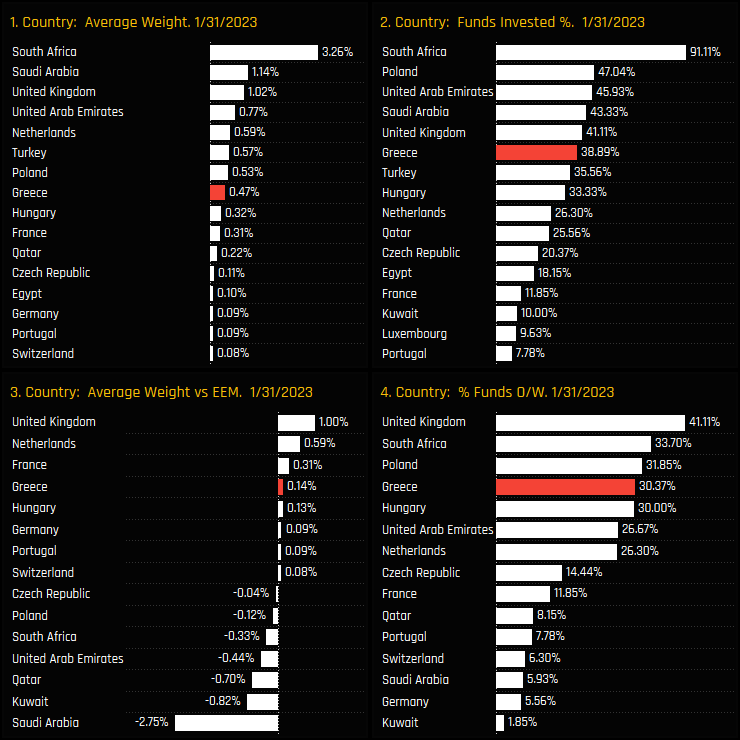
Greek allocations among active EM investors have risen to record levels. With Russia’s deletion from the CEEMEA investment landscape last year, Greece has taken up some of the slack, attracting a growing ownership base among the 270 EM funds in our analysis. The percentage of funds with Greek exposure is at the top of the 15-year range at 38.9%, with average weights hitting a record 0.47% last month.
Versus EMEA country peers, Greece has leapfrogged Turkey as the 6th most widely held country and stands as the 4th largest overweight in the region, behind developed market holdings in the UK, Netherlands and France. It’s still a small allocation in absolute terms, but then so are most of the EMEA allocations outside of South Africa, Saudi Arabia and the UK. Its certainly starting to carve a place for itself among the Eastern European nations.
Fund Holdings & Activity
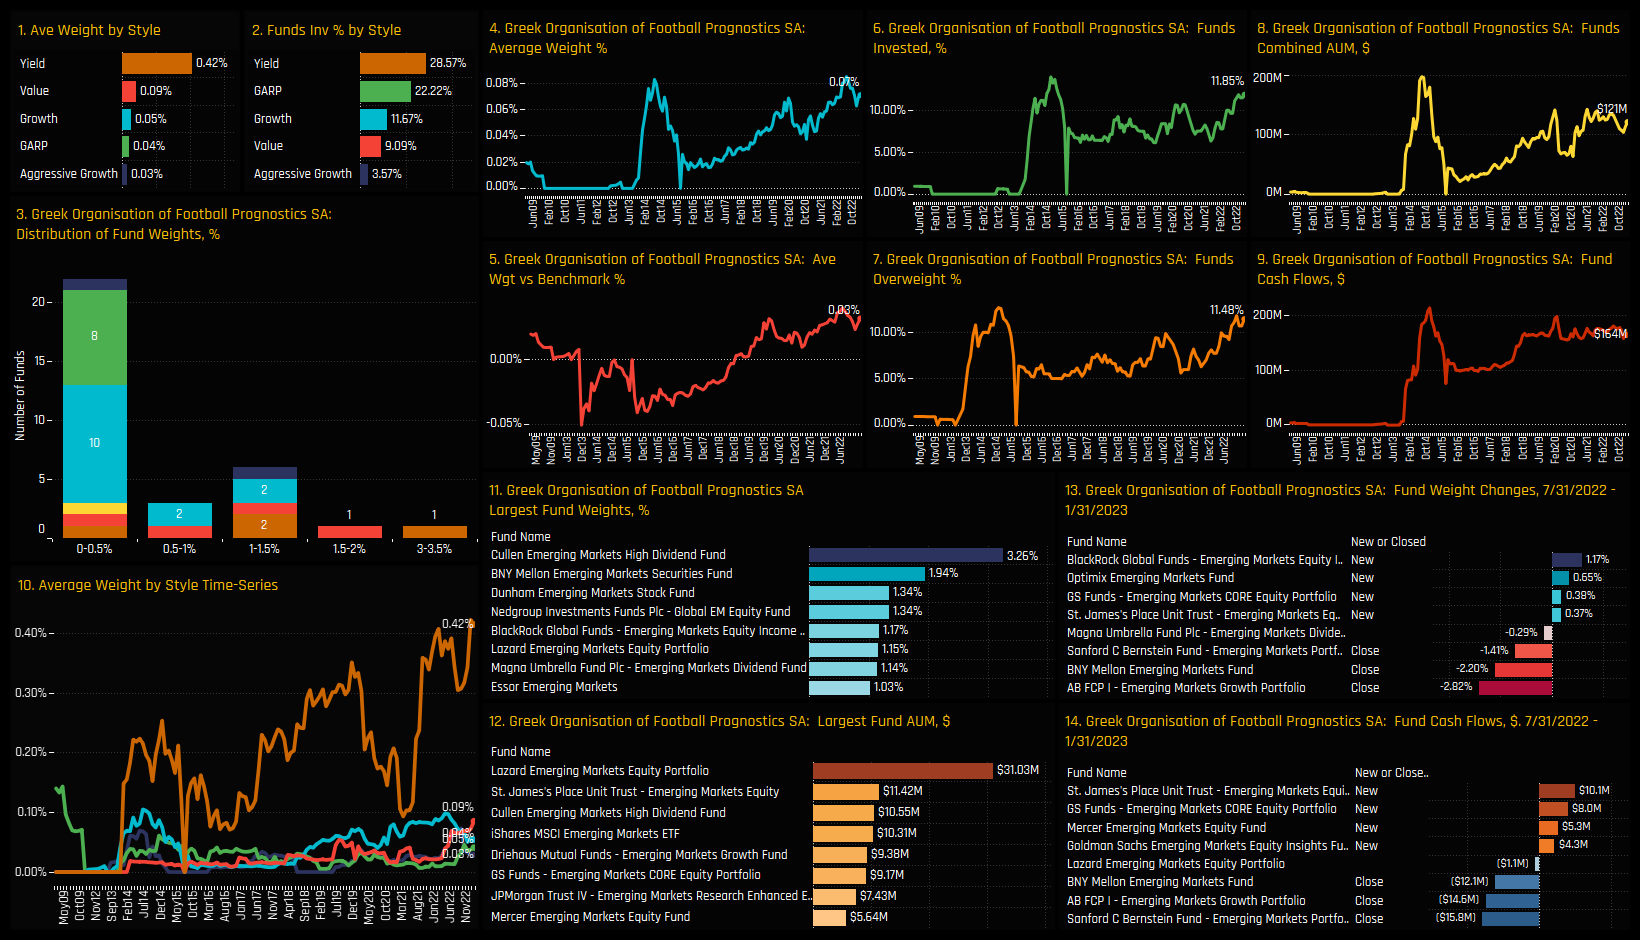
Among the 39% of funds who have exposure to Greece, most hold a sub-1% allocation, yet there are those with higher conviction, led by Cullen EM High Dividend (8.6%) and Swebank Robur Global EM (5.8%). On average, Yield and Value funds hold greater exposure than Growth/Aggressive Growth. However, some of the largest holding weights are occupied by Growth funds, with Artisan Sustainable EM (4.2%) and VP EM Optimised ESG (3.8%) leading the way.
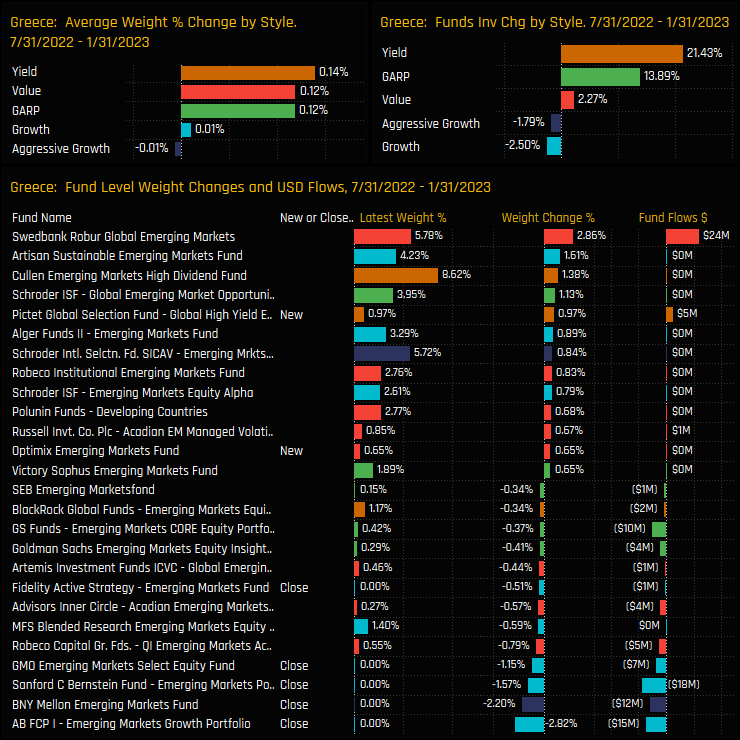
Activity over the last 6-months has seen the Style split widening, with 21.4% of Yield funds adding Greek exposure whilst 2.5% of Growth funds closed. Indeed, whilst opening positions outnumbered closures by a factor of 2, the closures were larger in magnitude, led by AB EM Growth (-2.8%) and BNY Mellon EM (-2.2%). Growth investors, it seems, are less enamoured with the Greek market than their Value peers.
Stock Holdings & Activity
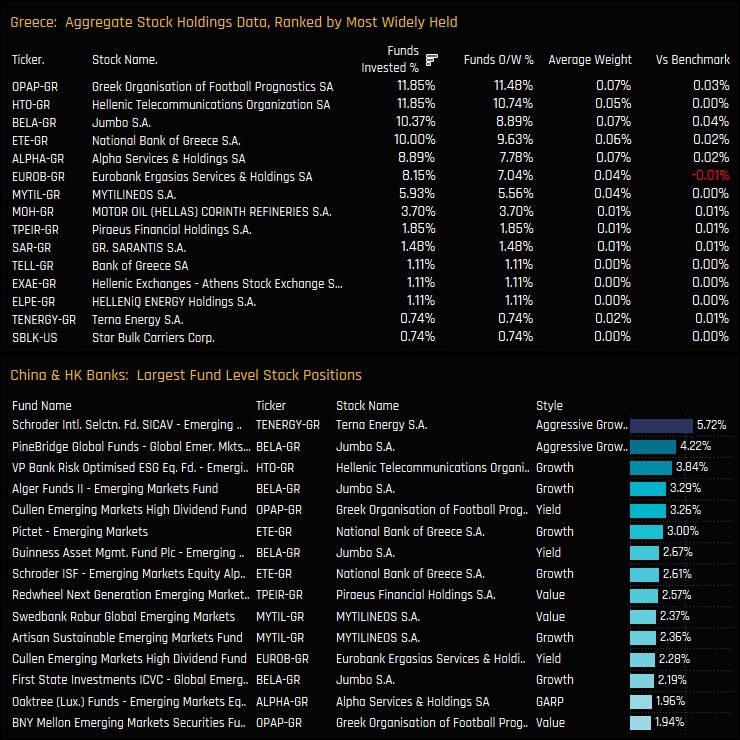
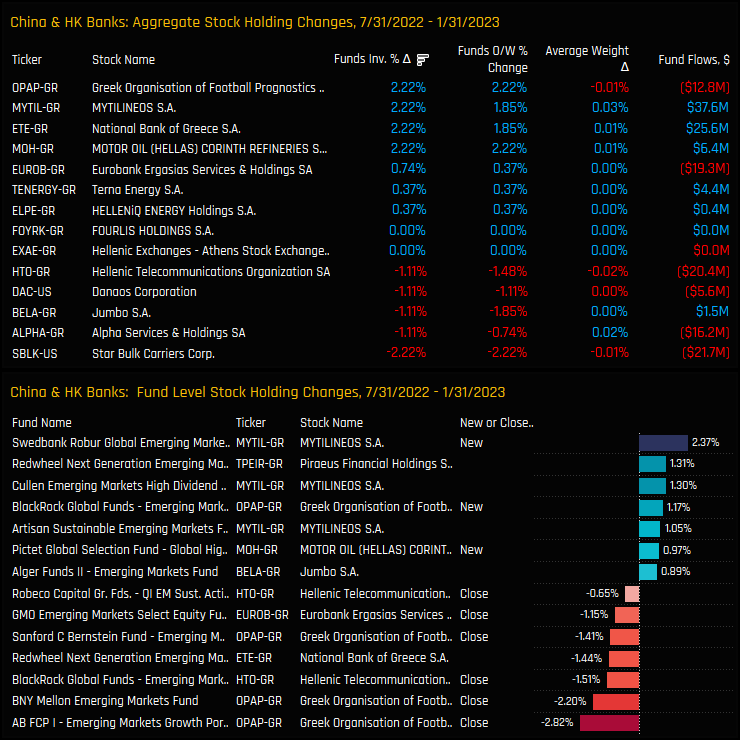
For such a small country allocation, stock ownership is understandably light. The most widely held companies are Greek Organisation of Football and Hellenic Telecommunications, both owned by 11.8% of funds. The top 7 stocks in the top chart below all share similar ownership profiles and account for 86% of the total Greek allocation.
Stock ownership changes between 07/31/2022 and 01/31/2023 were marginally skewed to the buy-side, with net closures in Star Bulk Carriers and Alpha Services & Holdings offset by net openings in Greek Organisation of Football, MYTILINEOS and National Bank of Greece. On a single fund basis, some of the larger closures were in Greek Organisation of Football, despite the net increase in ownership over the period.
Conclusions & Data Report
Active EM investors are beginning to pay renewed attention to Greece as evidenced by record average weights, increasing fund ownership and a net overweight stance, indicating a growing conviction and eagerness to invest. Though not absent from the ownership picture, Growth and Aggressive Growth investors are yet to be fully convinced, with smaller holdings than their Value peers and a degree of scaling back over the last 6-months.
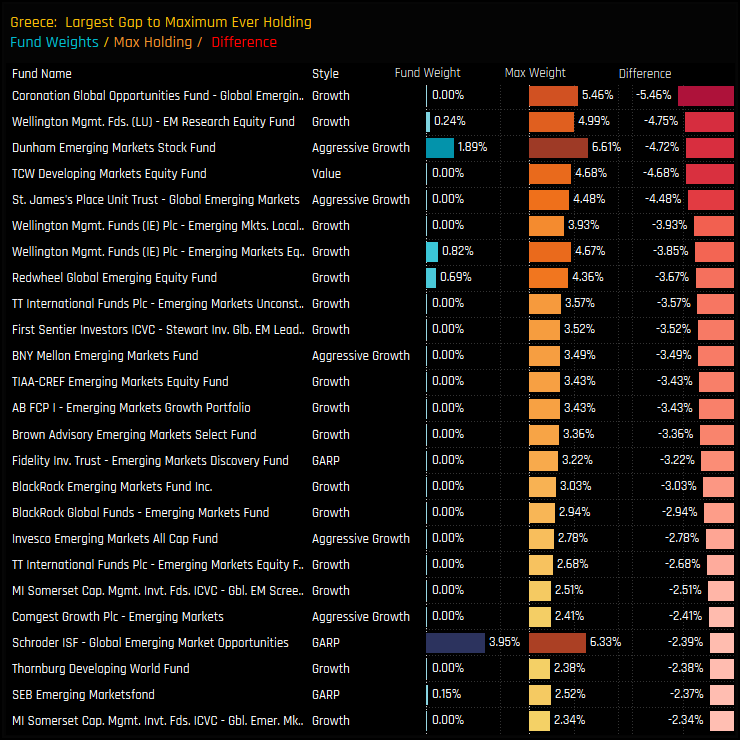
The chart to the right shows the funds with the largest ‘gaps’ between their current weight in Greece and their maximum ever weight since 2008. It shows a number of funds with previously large exposure to Greece who now hold nothing, or significantly less. Indeed, Greece is a well known market to EM investors, with 173 of the 270 funds in our analysis holding a position at some point, but only 105 of those are invested now. This points to the potential for increased ownership growth, especially in light of Russia’s omission from the EMEA landscape in 2022.
Click on the link below for our data pack on Greek positioning among active EM funds. Scroll down for stock profiles on Greek Organisation of Football and Hellenic Telecommunications
In this report, we create 2 portfolios based on the most and least favoured stock holdings among active EM managers.
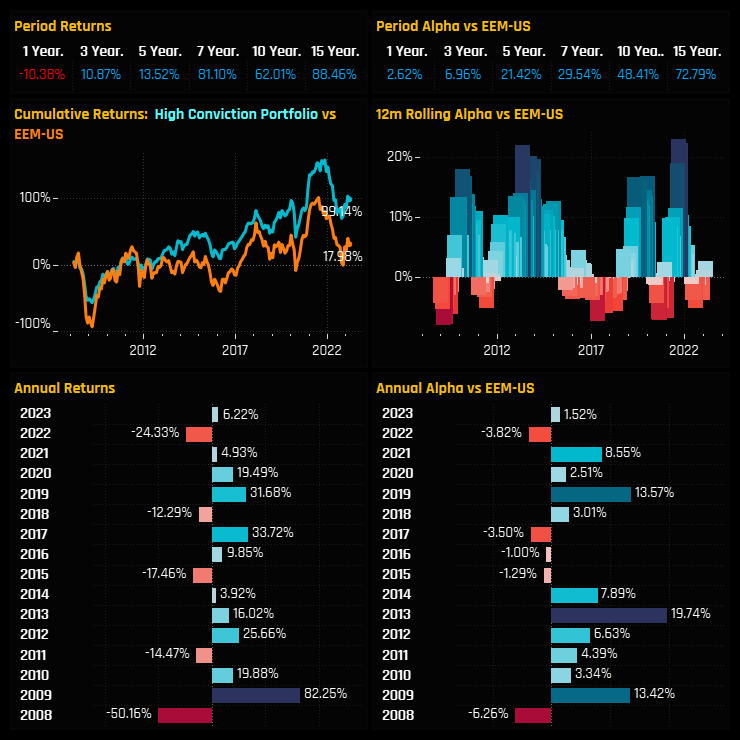
High Conviction Portfolio
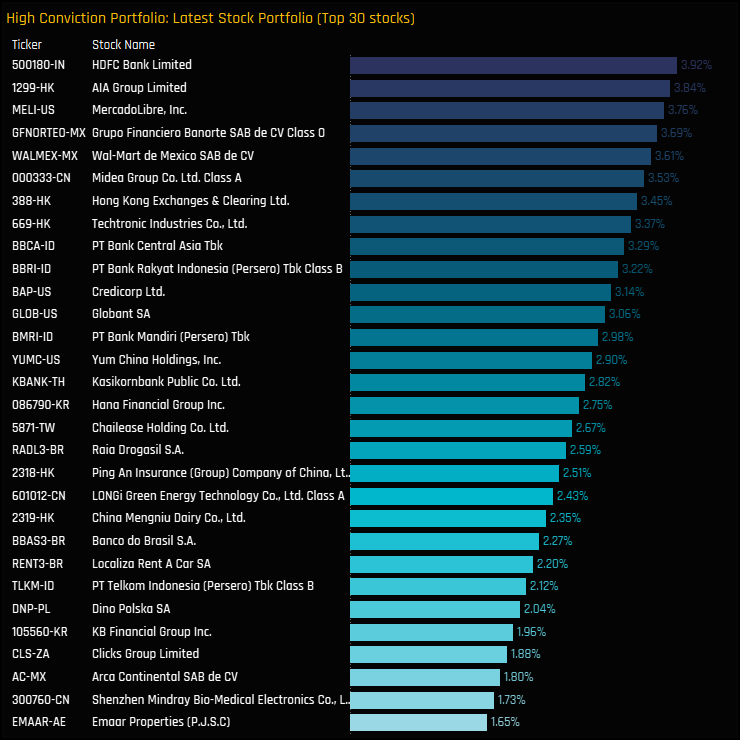
Criteria for inclusion: Stocks that are held overweight the iShares MSCI Emerging Markets ETF on average and held by more than 20% of the funds in our analysis. The portfolio is weighted proportionately to the overweight rank, updated monthly and capped at 50 stocks. Note this is an entirely theoretical portfolio with no fees or costs associated with trading/rebalancing etc.
The top 30 stocks are shown below, with the largest weights in non-benchmark stocks HDFC bank and AIA Group. For the full portfolio, please click on the link below.
Back-testing this portfolio against the iShares EEM ETF shows strong outperformance, with 15-year returns of 88.5%, beating the benchmark by 72.8%.
The consistency of outperformance is a standout, with 11 of the last 16 years beating the benchmark and 63.5% of each 12 month rolling period generating positive alpha. Given that this portfolio is based off the combined wisdom of 270 active EM strategies, we would suggest these stocks should be on the radar of every EM investor.
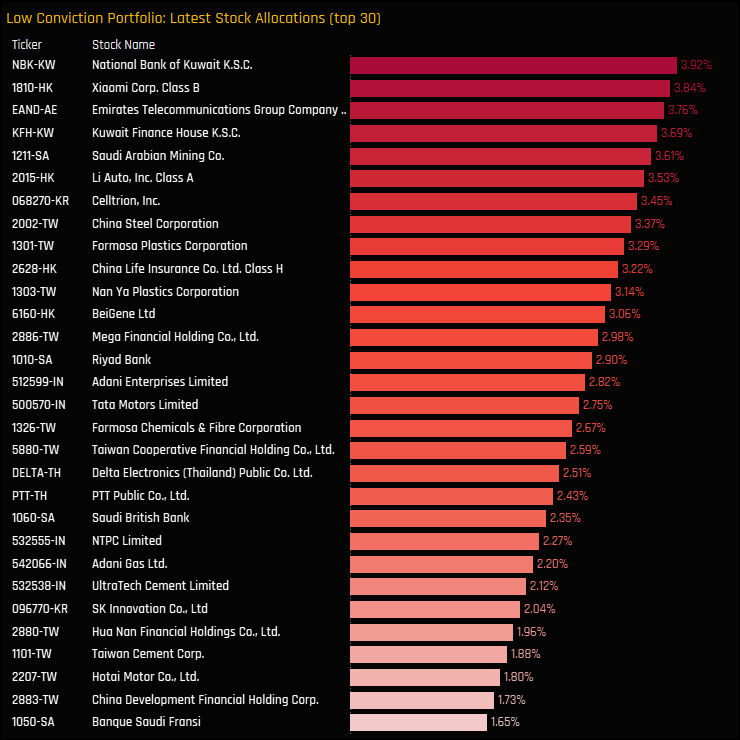
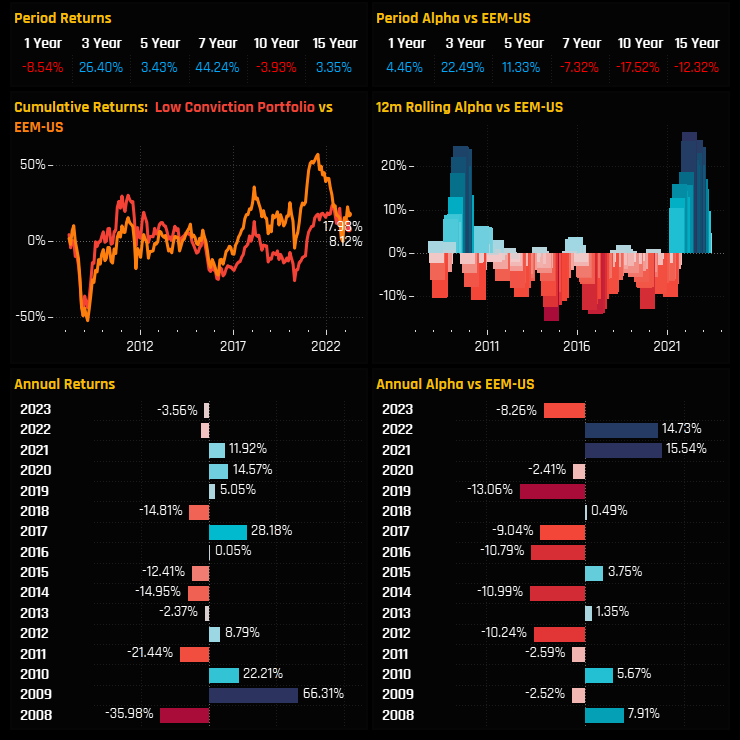
Low Conviction Portfolio
Criteria for inclusion: Stocks that are held underweight the iShares MSCI Emerging Markets ETF on average and held by less than 5% of the funds in our analysis. The portfolio is weighted proportionately to the underweight rank, updated monthly and capped at 50 stocks.
The top 30 stocks are shown below, with the largest weights in National Bank of Kuwait and Xiaomi Corp. For the full portfolio, please click on the link below.
The portfolio is a serial underperformer, with 9 of the past 16 years underperforming the iShares EEM ETF and only 28.2% of each 12 month rolling period generating positive alpha.
However, 2021 and 2022 were blowouts for the portfolio, undoing much of the underperformance over the previous decade. Big underweights in the MENA region were the main driver, as active managers have been hesitant to match benchmark weights in the major stocks. 2023 is off to a better (worse) start, already underperforming the index by -8.26%. With so few active EM funds willing to own these companies, pay caution before deciding to invest.
Click on the link below for more details of the High and Low Conviction portfolios.
For more analysis, data or information on active investor positioning in your market, please get in touch with me on steven.holden@copleyfundresearch.com


