In this issue:
Hotels/Resorts/Cruiselines: Breaking Out
Pinduoduo: Entering the Big League
China A-Shares Rising Stars
MSCI China Fund Characteristics
120 MSCI China Funds, AUM $53bn
Hotels/Resorts/Cruiselines: Breaking Out
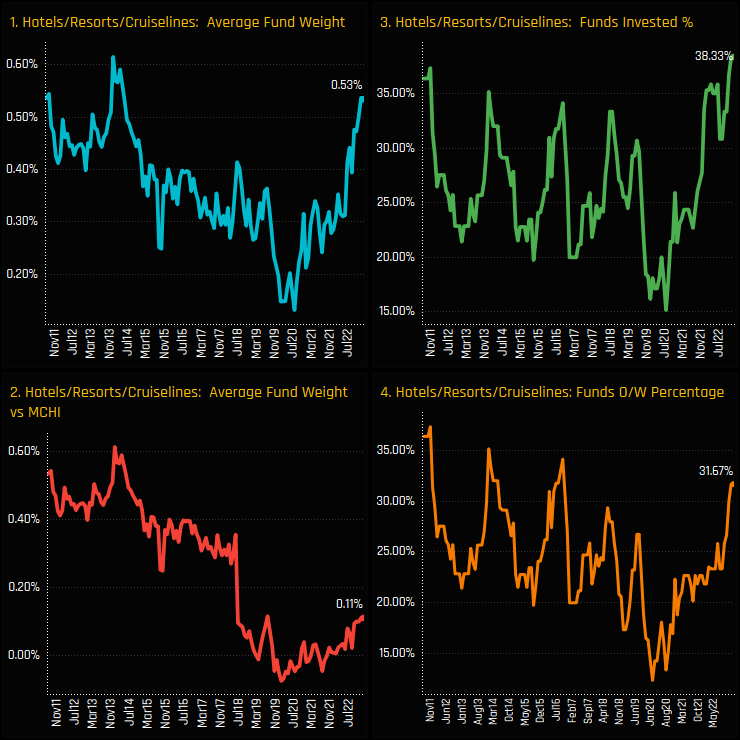
Rotation in to the Hotels/Resorts/Cruiselines industry group pushes ownership levels to all-time highs.
First Casino’s, then Restaurants and now Hotel/Resorts/Cruiselines; active managers across our analysis are ramping up allocations to Consumer facing industry groups in China. The charts below show the time-series of ownership statistics for the Hotel/Resorts/Cruiselines (HRC) industry group, with average weights rising sharply (ch1) and the percentage of funds invested reaching record levels (ch3). Active China managers have switched from a net underweight to an overweight position in recent months (ch2), with a 7-year high of 31.7% of funds overweight the iShares MSCI China ETF benchmark (ch4).
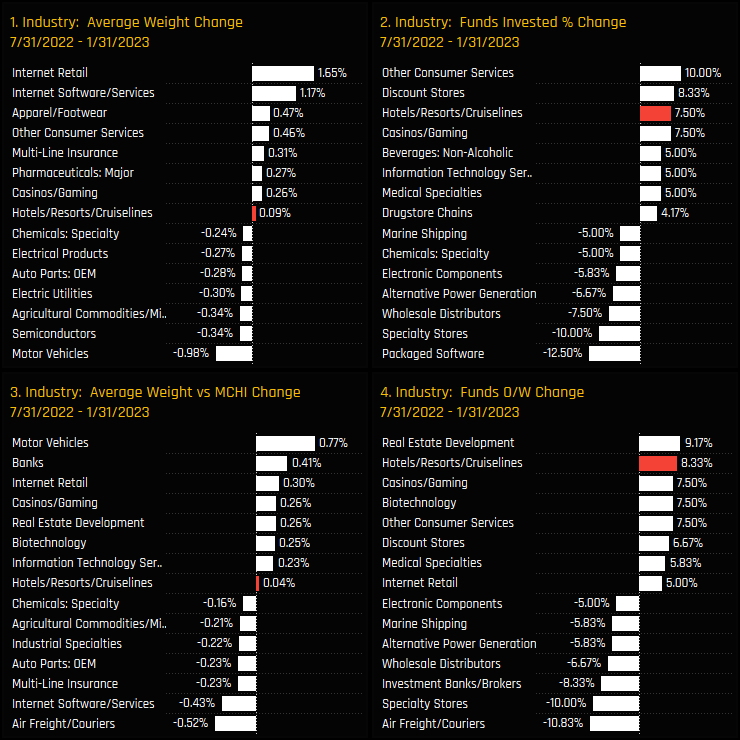
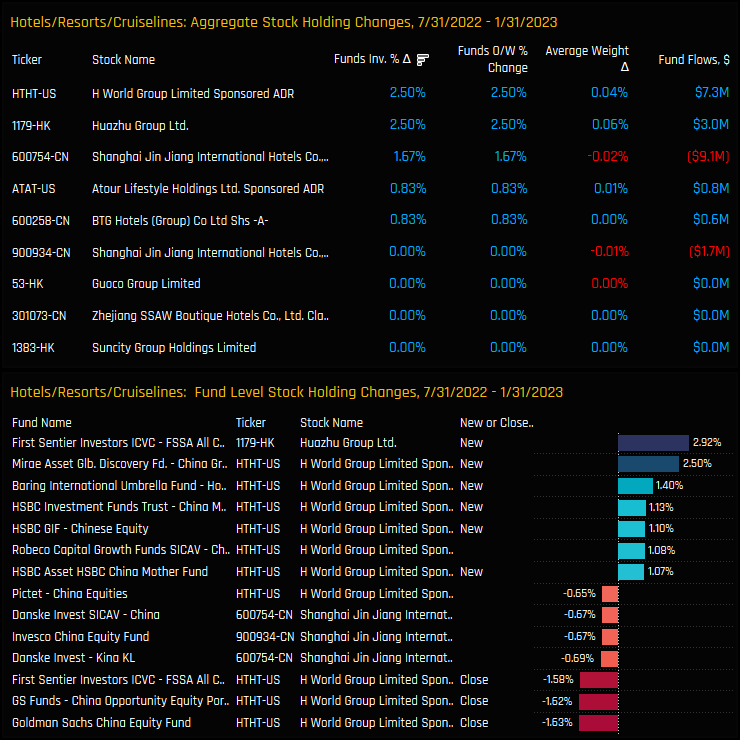
Industry level activity between 07/31/2022 and 01/31/2023 highlights this consumer rotation, with HRC at the forefront of the moves. The percentage of funds moving into HRC stocks (ch2), alongside Discount Stores and Other Consumer Services, highlights how managers are positioning themselves for a rebound following the relaxation of COVID related lockdowns last year.
Fund Activity and Latest Holdings
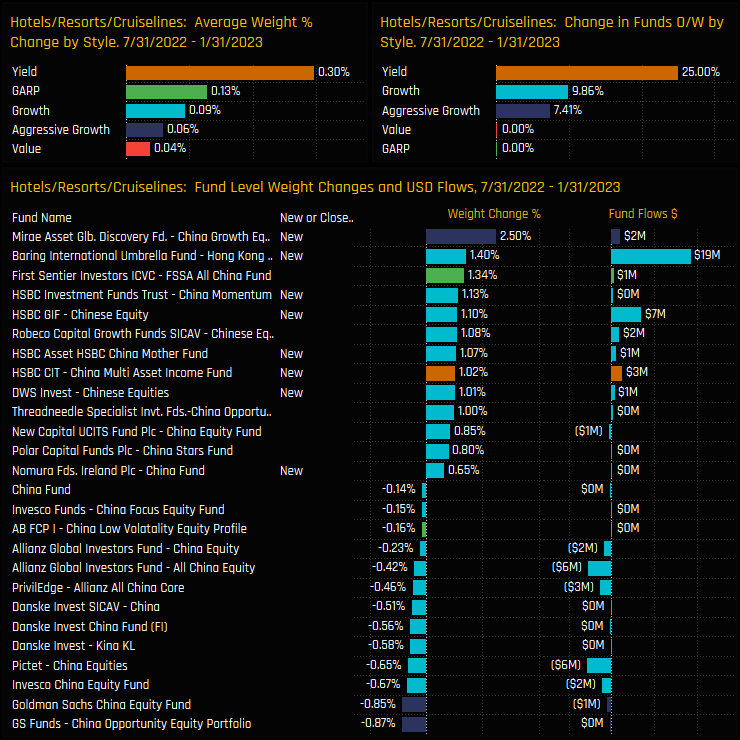
The last 6-months has seen a number of well known China managers opening exposure to the HRC industry group, led by Mirae Asset China Growth (+2.5%) and Baring Hong Kong China (+1.4%). All Style groups saw exposure increase over the period on average, with no funds in our analysis closing exposure.
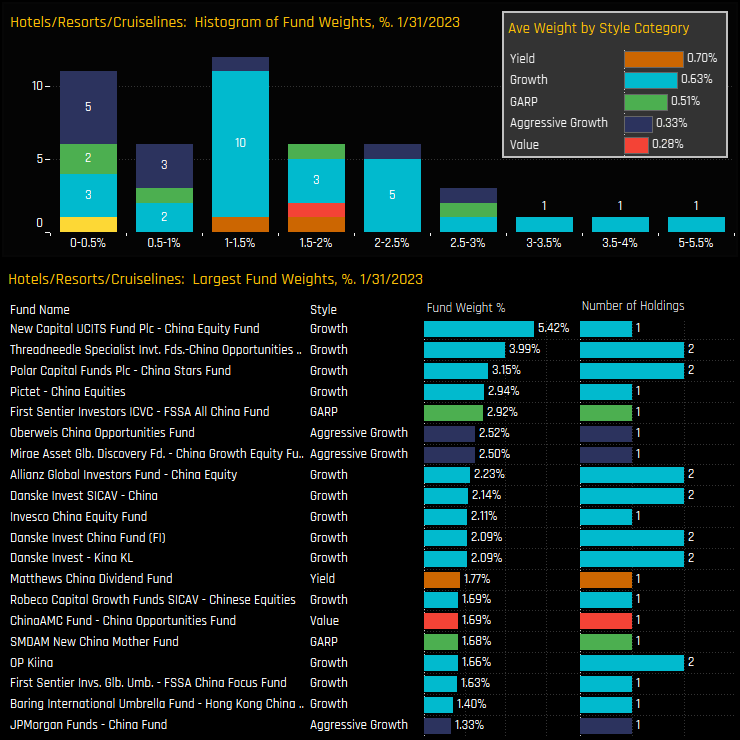
The bulk of the holdings distribution sits below 2%, but there are 12 funds taking a more bullish stance, led by New Capital China Equity (5.4%) and Threadneedle China Opportunities (3.99%). Most of the top holders are exposed to either 1 or 2 stocks in the industry group.
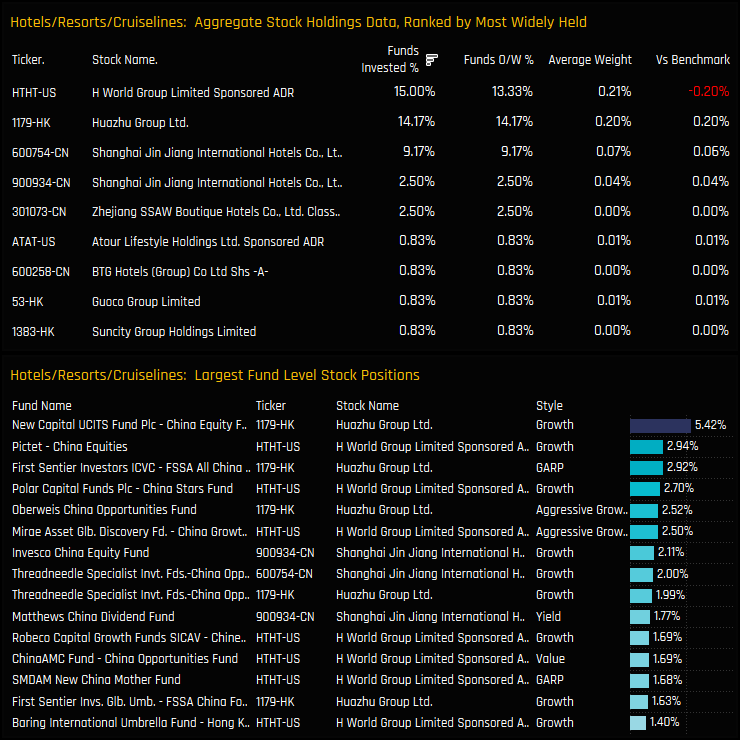
Stock Holdings & Activity
Stock holdings in the Hotels/Resorts/Cruiselines industry group are dominated by 2 companies, H World Group and Huazhu Group. Both share similar ownership profiles, being held by ~15% of the China funds in our analysis at an average weight of ~0.20%. Together they account for 79% of the total HRC weight and dominate the list of larger single fund positions in the lower chart.
Over the last 6-months, both H World and Huazhu captured the largest increases in ownership, with the percentage of funds invested rising by +2.5% in each. First Sentier All China’s +2.92% opening position in Huazhu Group was the standout new position, followed by a number of new holdings in H World Group from Mirae, Barings and HSBC, among others.
Conclusion and Links
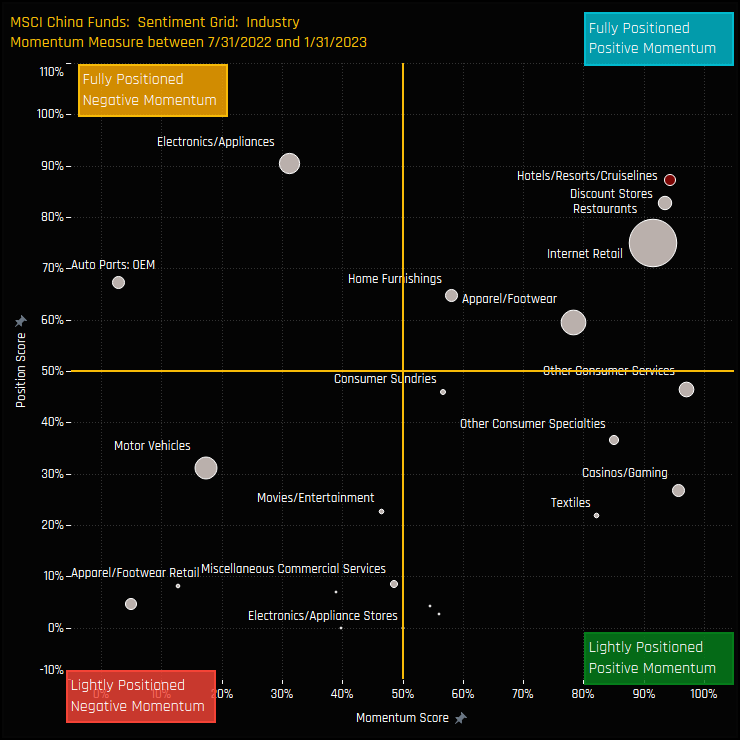
The Sentiment Grid opposite shows where current positioning in each China Consumer Discretionary Industry group sits versus its own history going back to 2011 on a scale of 0-100% (y-axis), against a measure of fund activity for each Industry between 07/31/2022 and 01/31/2023 (x-axis). Hotels/Resorts/Cruiselines join Discount Stores, Restaurants and Internet Retail at the pinnacle of the top-right quadrant.
Record positioning and strong rotation, underpinned by sizeable single fund exposure and a raft of opening positions demonstrates the conviction that selected China investors have towards Hotels/Resorts/Cruiseline stocks. But with only 38% of the 120 MSCI China funds in our analysis currently invested, it’s a long way from being a consensus position.
Please click on the link below for more charts and data on the Hotels/Resorts/Cruiseline industry group among active MSCI China investors.
Pinduoduo has emerged as one of the top stock holdings in China, following a strong recovery from the ownership lows of last year.
Time-Series Analysis & Stock Activity
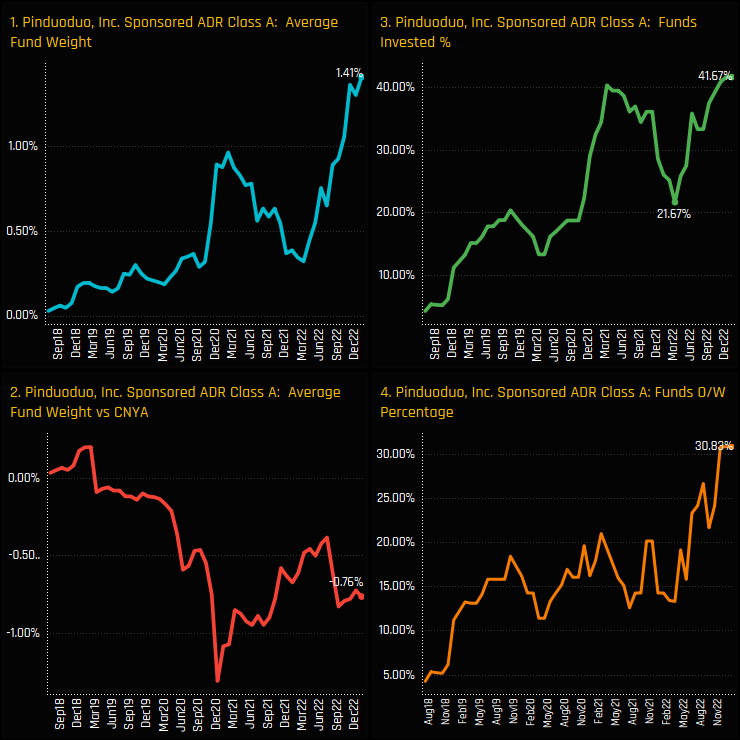
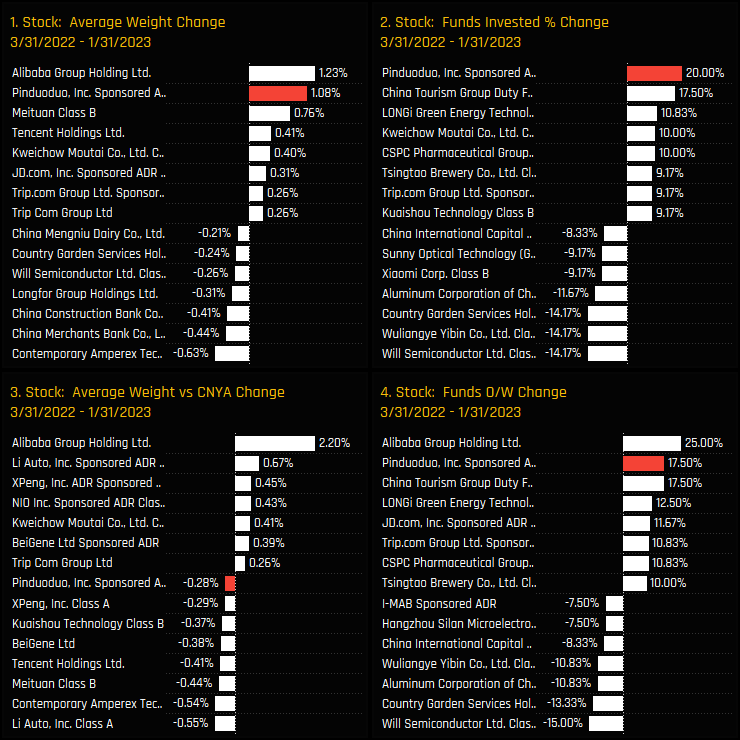
Investor interest in Pinduoduo Inc. has surged, hitting record-high levels of fund ownership this month. After a dip to 21.7% in March 2022, the percentage of funds invested has bounced back significantly, with an additional 20% of active China funds opening new positions (ch3). The average weight has reached a new high of 1.41% (ch1), but this still represents a net underweight of -0.76% compared to the iShares MSCI China ETF (ch2).
Over the period from the recent lows in March 2022 to today, Pinduoduo’s +20% increase in the percentage of funds invested was the highest across all stocks in China & HK. Yet despite a further 17.5% of funds moving to overweight, active managers are still failing to keep up with increases in the iShares MSCI China weight, as underweights increased by -0.28% on average.
Fund Holdings & Activity
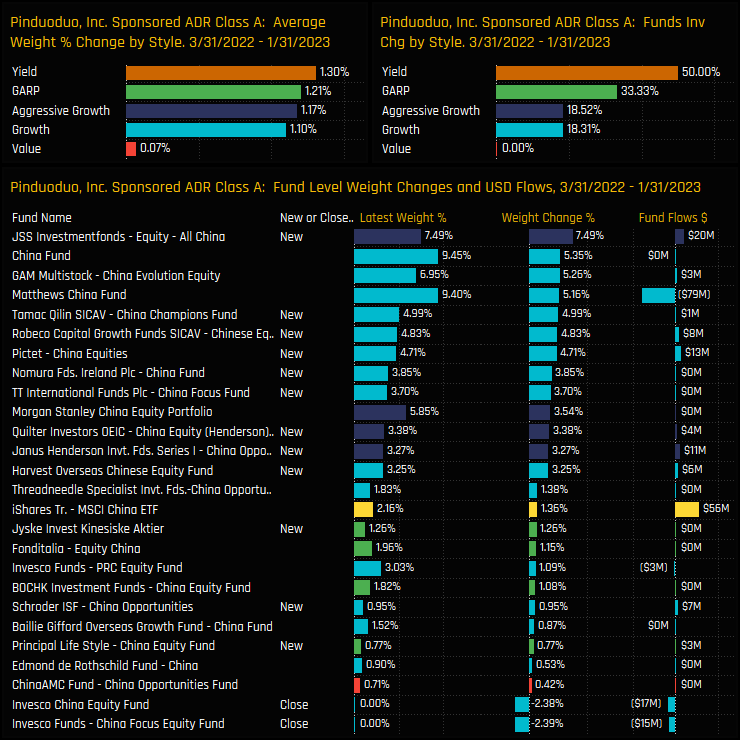
The below charts show the funds behind the rotation in to Pinduoduo. New positions from JSS All China (+7.49%) and Tamaq China Champions (+4.99%) were complemented by increased weights from China Fund (+5.35%) and GAM China Evolution (+5.26%). All Style groups with the exception of Value saw ownership levels increase.
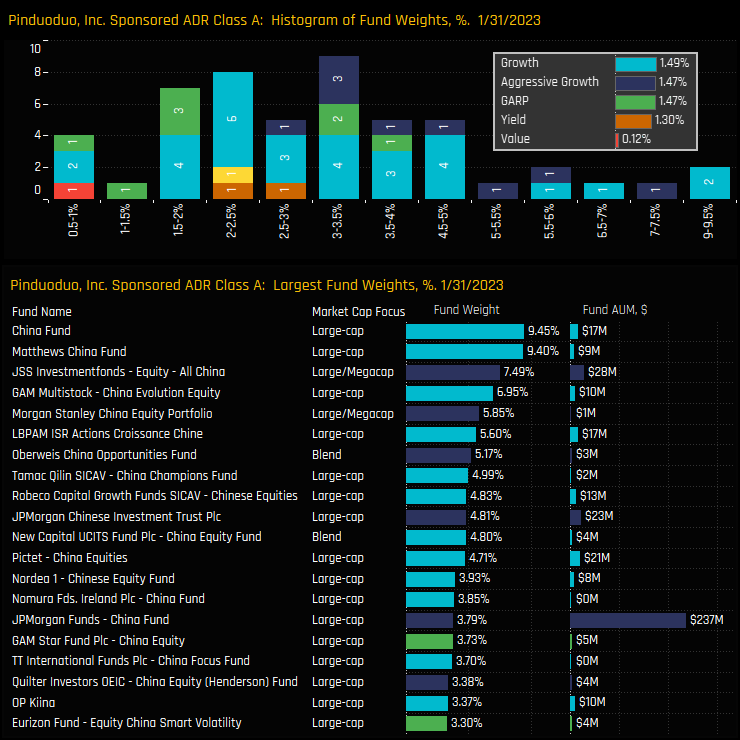
Among the current owners, the distribution of portfolio weights indicates a strong degree of conviction in Pinduoduo – this isn’t a fringe holding by any stretch. Growth and Aggressive Growth funds dominate the holdings register, led by China Fund (9.45%) and Matthews China (9.4%).
Peer Group Positioning
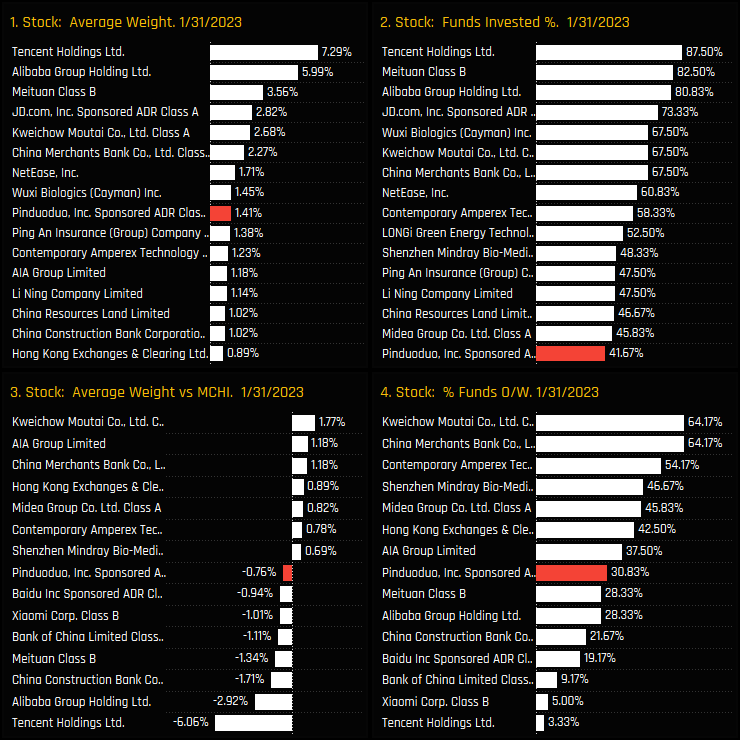
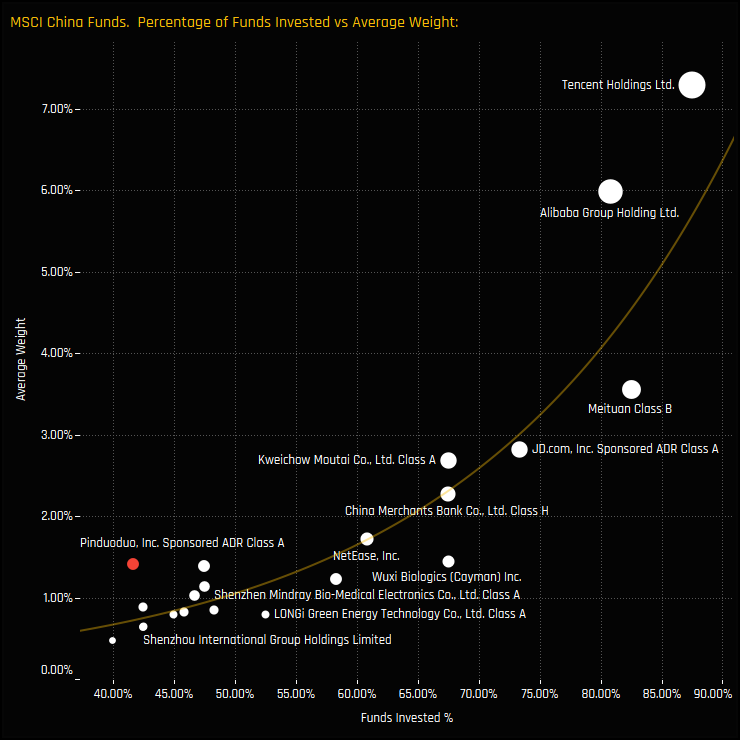
This recent surge in active China fund ownership has propelled Pinduoduo to the 9th largest average holding weight among active China managers (ch1). In terms of outright ownership it sits further down the list (ch2) and versus the benchmark represents one of the key stock underweights on average (ch3). In fact, Pinduoduo remains an underweight holding for 69.2% of the funds in our analysis (ch4). Combine this with the 58.3% of funds still not invested, and the outperformance of Pinduoduo is a risk versus benchmark and a risk versus active peers for the majority.
The scatter chart below plots a stock’s average holding weight versus the percentage of funds who own each stock for the major China holdings. The fact that Pinduoduo is almost an outlier above the trend line reflects the strong conviction among current holders versus a majority of funds who are yet to own a position. With such a disparity between active holders, benchmark weights and non-holders, Pinduoduo will be a key driver of performance differentiation in the months to come.
Links
Click on the link opposite for the full data report on Pinduoduo positioning among active MSCI China funds.
We screen for China A-Share companies that are not widely held but are at record levels of ownership among actively managed funds.
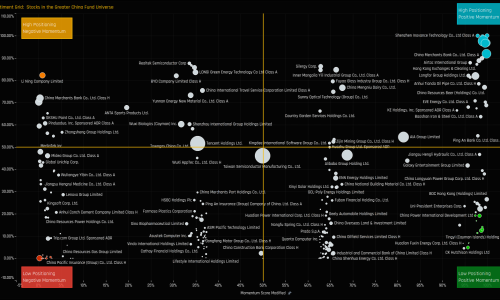
Stock Sentiment Analysis
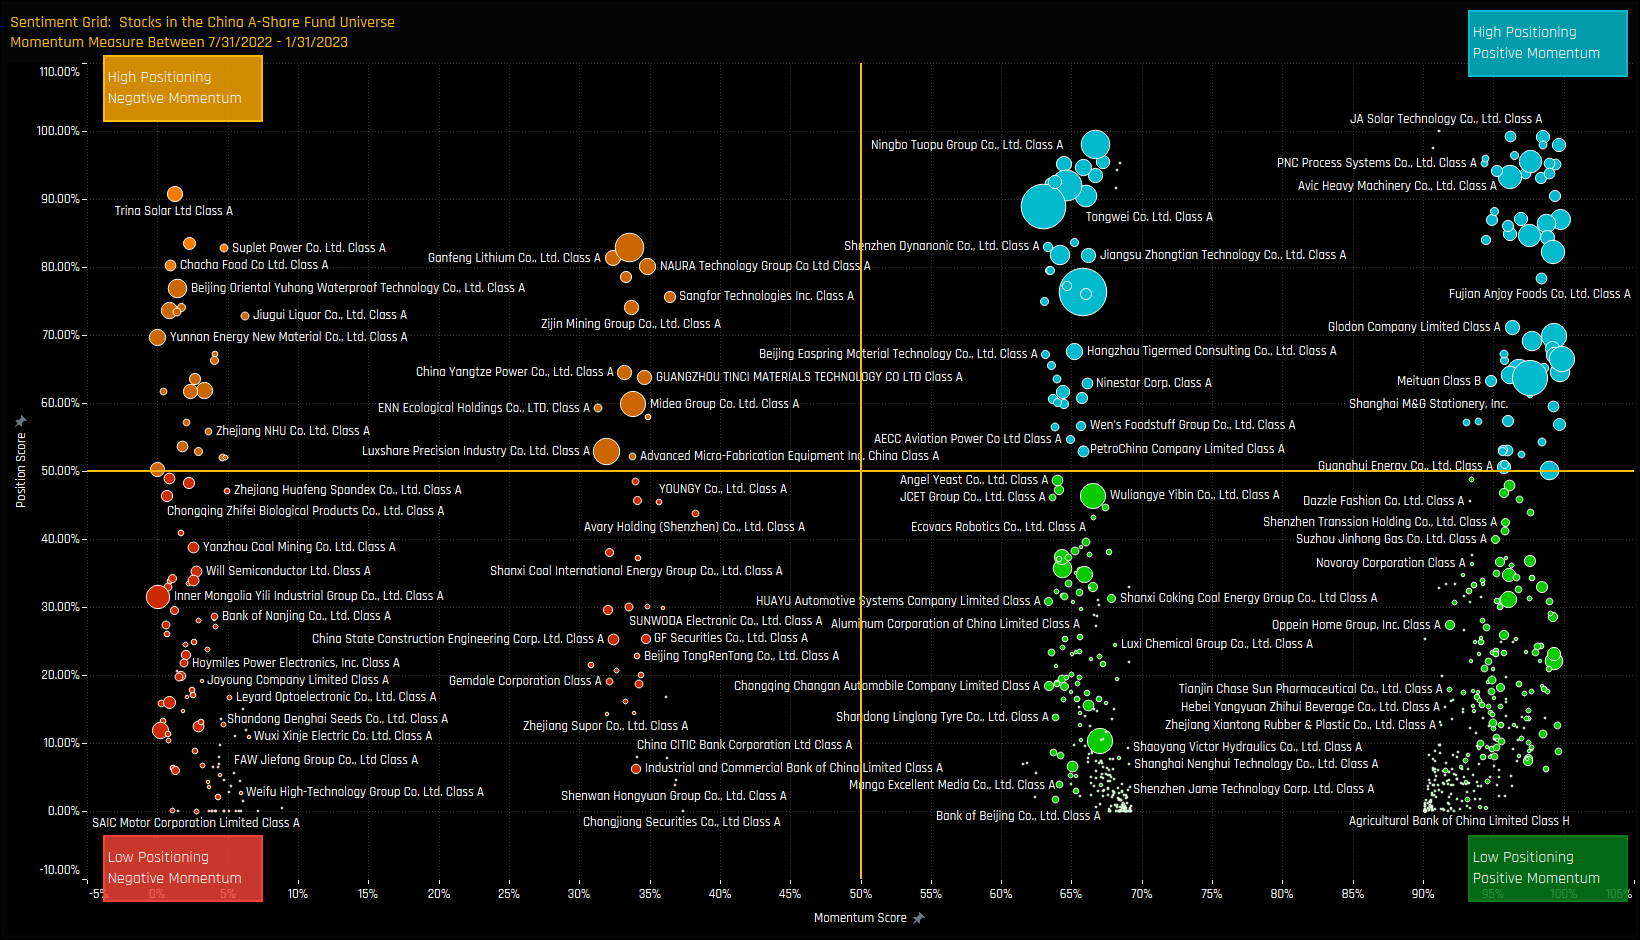
The sentiment grid below shows where current positioning in each stock in our China A-Share universe sits versus its own history going back to 2015 on a scale of 0-100% (y-axis), against a measure of fund activity for each stock between 07/31/2022 and 01/31/2023 (x-axis). The positioning score is based on a stock’s average weight, the percentage of funds who hold that stock and the percentage who are overweight. The momentum score is based on the change in those metrics over the last 6-months.
There is a broad spectrum of positioning and momentum levels among companies. For this analysis, we are interested in the extreme top-right of the grid. Stocks with record levels of positioning after capturing some of the largest increases in ownership over the last 6-months.
Rising Stars Stocks Screen
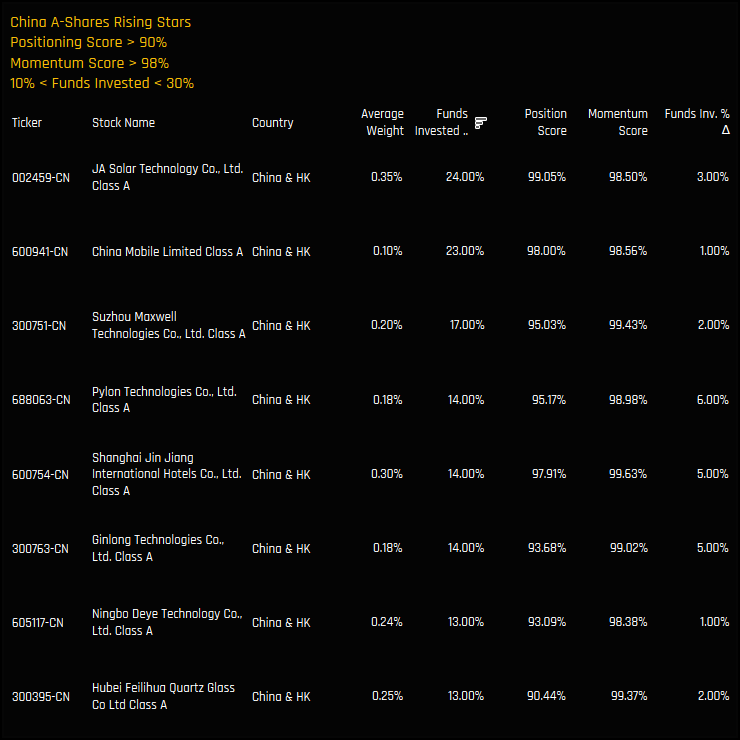
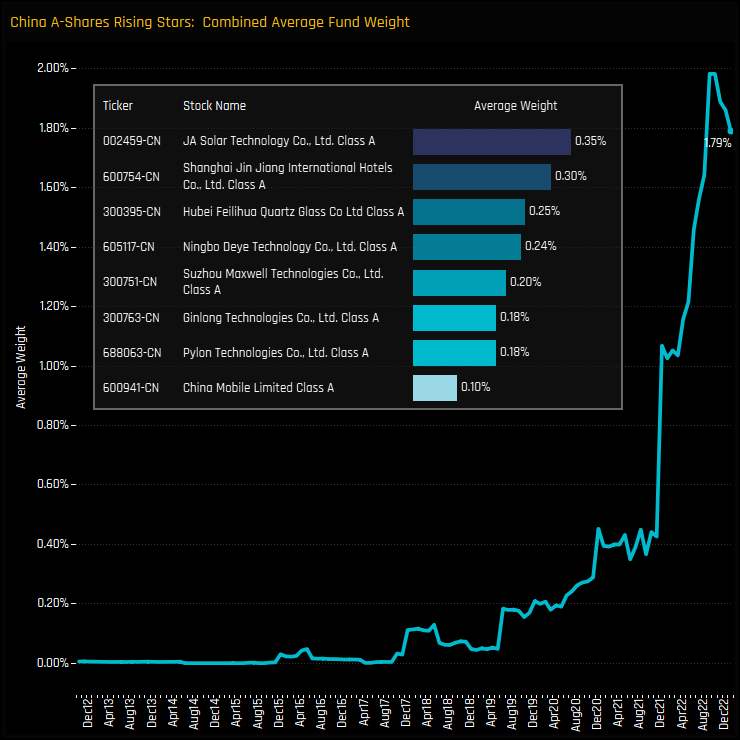
The below table shows stocks with positioning scores above 90% and momentum scores above 98%. We also remove stocks that are owned by less than 10% of funds and more than 30% – we want companies that have established an ownership base but are not universally held. 8 companies make the list, headed by JA Solar Technology, a stock owned by a record 24% of managers and capturing strong ownership growth over the last 6-months.
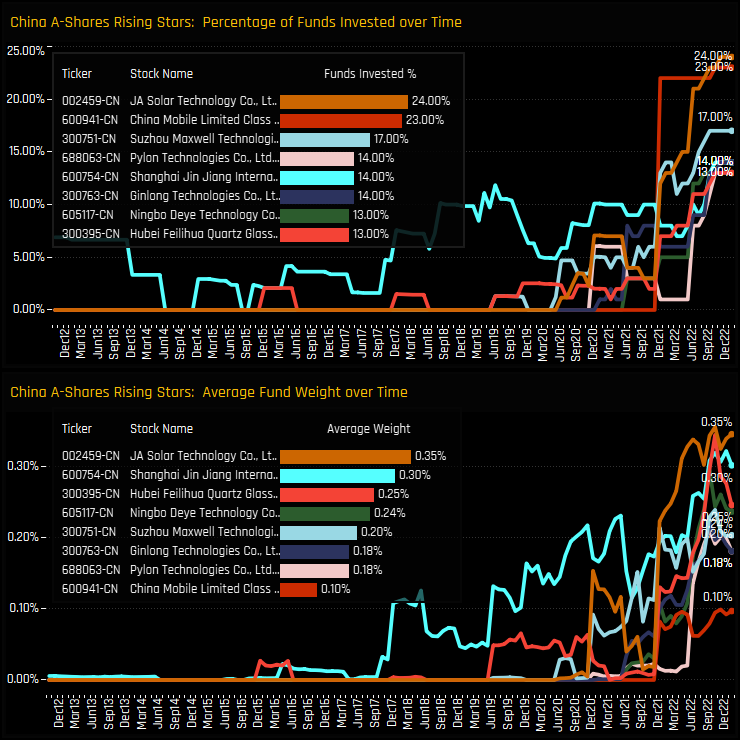
The below charts displays the path of investment growth for each stock over the past decade. For most stocks, the percentage of funds invested is at or close to all-time highs, with strong investment growth seen over the last 6-months. In fact, with the exception of Shanghai Jin Jiang International, active China A-Share funds have only started building positions in these stocks from 2020 onwards.
Conclusions & Data Reports
On an average fund weight basis, these 8 stocks have accelerated to a combined record weight of 1.79% as at the end of last month. The rate of increase has been impressive, with average weights quadrupling since the end of 2021. Yet as it stands, these 8 stocks comprise only a small portion of the average active China A-Shares equity fund. Individual fund positions are small as managers build confidence in the investment case, whilst relying on more established members of the China A-Share Universe to take the lion’s share. For example, the average holding weight for the 8 most widely held stocks in our A-Share analysis is 16.8%. Our China A-Shares Rising Stars are in their ownership infancy, but clearly have a big potential upside. Click below for fund profiles on all 8 stocks.
5 chart dashboards on the characteristics of the 120 active MSCI China Funds in our analysis.
Active Share & Sector Correlation
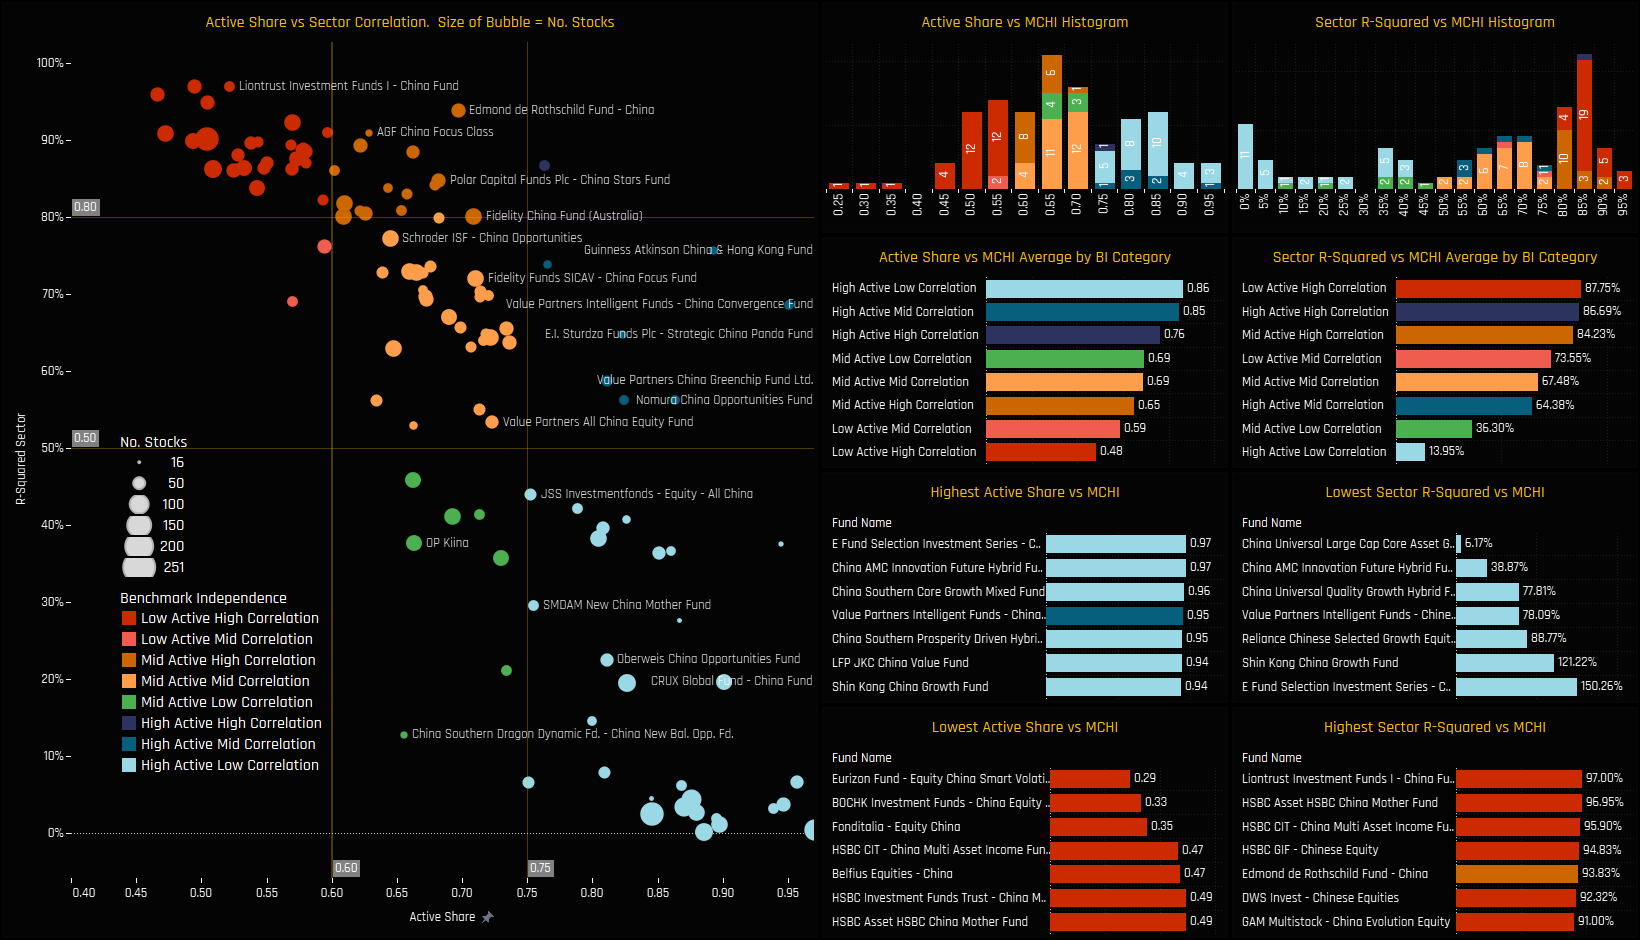
First we look at Benchmark independence, and how each fund differs from the iShares MSCI China ETF benchmark using both Active Share and Sector Correlation. In the scatter chart below, funds with high active shares and very low sector correlations to the benchmark are in the bottom-left corner of the grid. The top left shows strategies much more aligned to the benchmark in their stock and sector allocations.
Our universe is fairly evenly split, with 33 low active funds, 49 mid active and 38 high active. The most benchmark independent funds are led by China Innovation Hybrid Future and E Fund China Dividend Fund, whist strategies from Eurizon and HSBC are more closely aligned to benchmarks.
Price Earnings & Price to Book
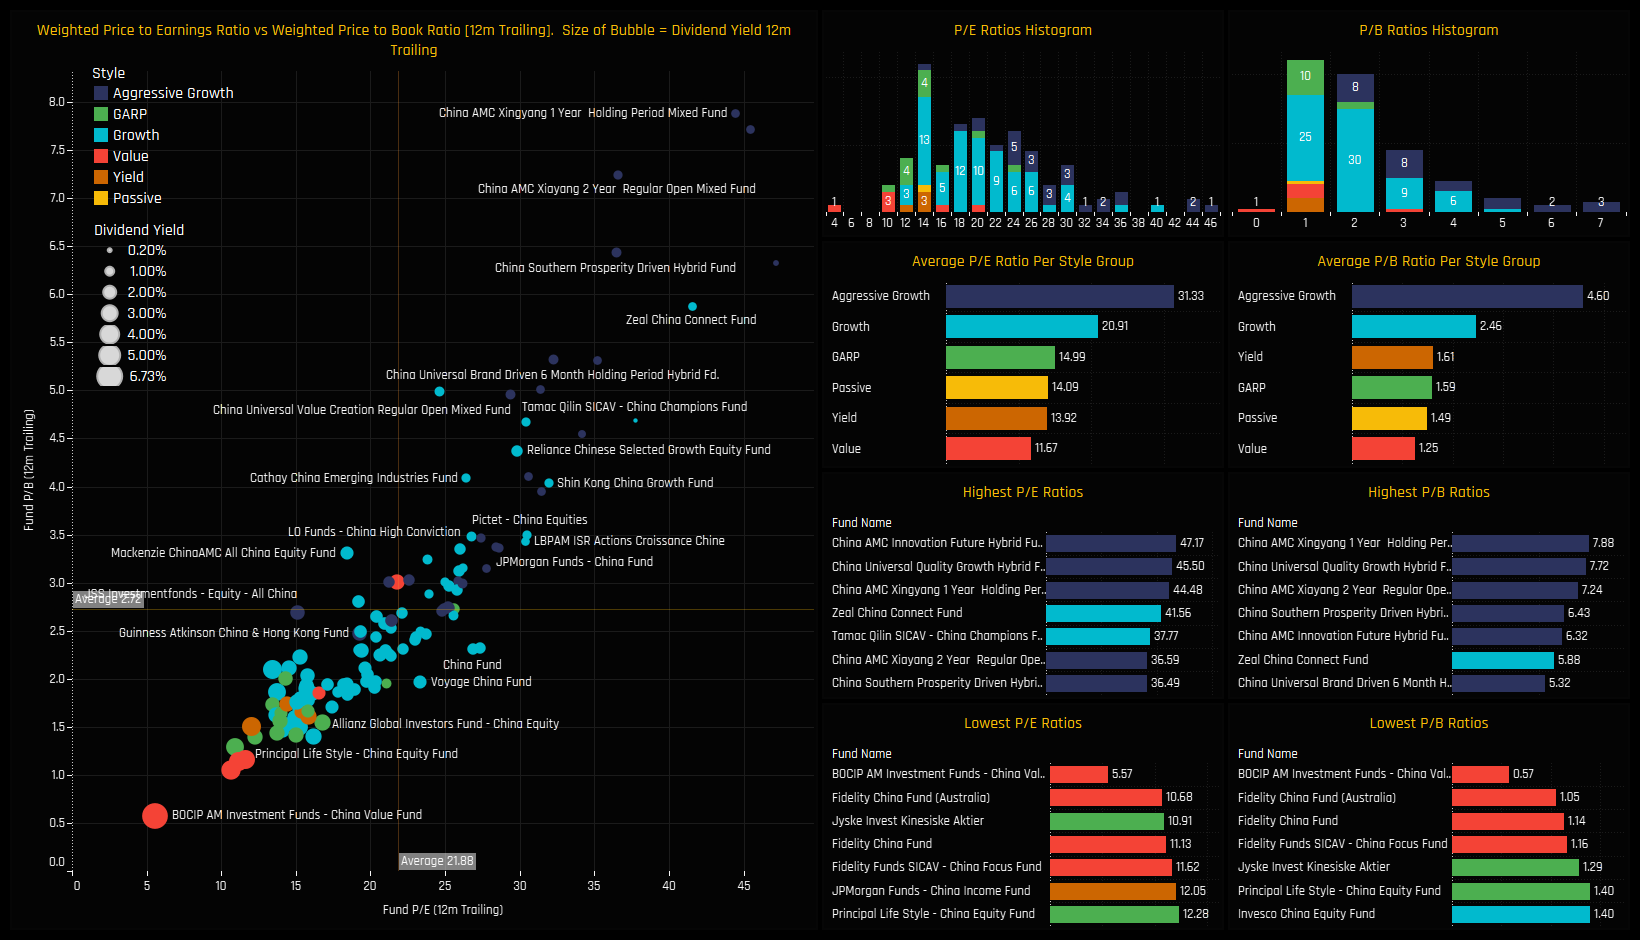
We classify our 120 China fund universe in to the following Style categories: Aggressive Growth: At least 70% of the portfolio in stocks with a higher P/E than the MSCI China average, and at least 70% with a higher P/B ratio. Growth: At least 50% of the portfolio in stocks with a higher P/E than the MSCI China average, and at least 50% with a higher P/B ratio. Value: Either by the fund description, or at least 50% of the portfolio in stocks with a lower P/E ratio than the MSCI China average, and at least 50% with a lower P/B ratio. Yield: As per the fund description only (i.e Yield, Dividend, Income funds). GARP: All other iterations that do not fit under the above classifications.
The active China fund universe has a structural bias towards Growth. On a valuation level, 110 active funds have a higher price to book ratio than the iShares MSCI China ETF and 106 funds a higher price to earnings. Indeed, only 6 funds are classified as Value and just 4 as Yield.
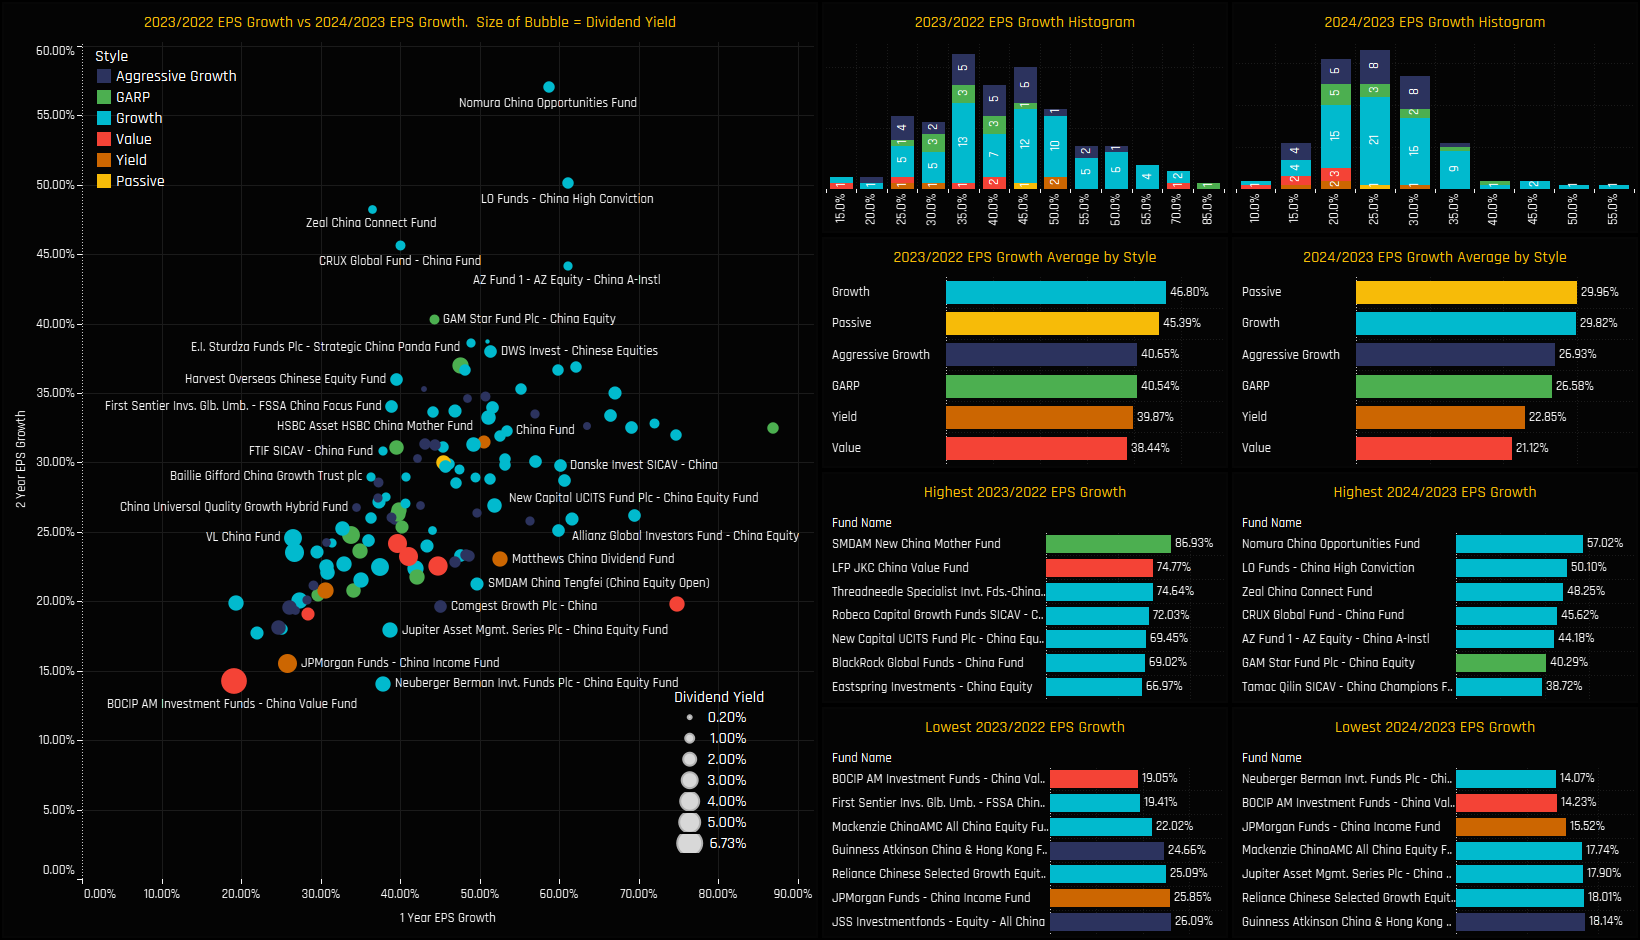
EPS Growth
On an EPS Growth basis, using Factset 2023 and 2024 estimates, earnings growth is largely correlated to Style, with 2023/2024 EPS Growth of 21.1% for Value funds versus 29.8% for Growth.
The spread of EPS growth on an individual fund level is wide, reflective of some large EPS growth expectations among stocks in the China universe following depressed earnings in 2022.
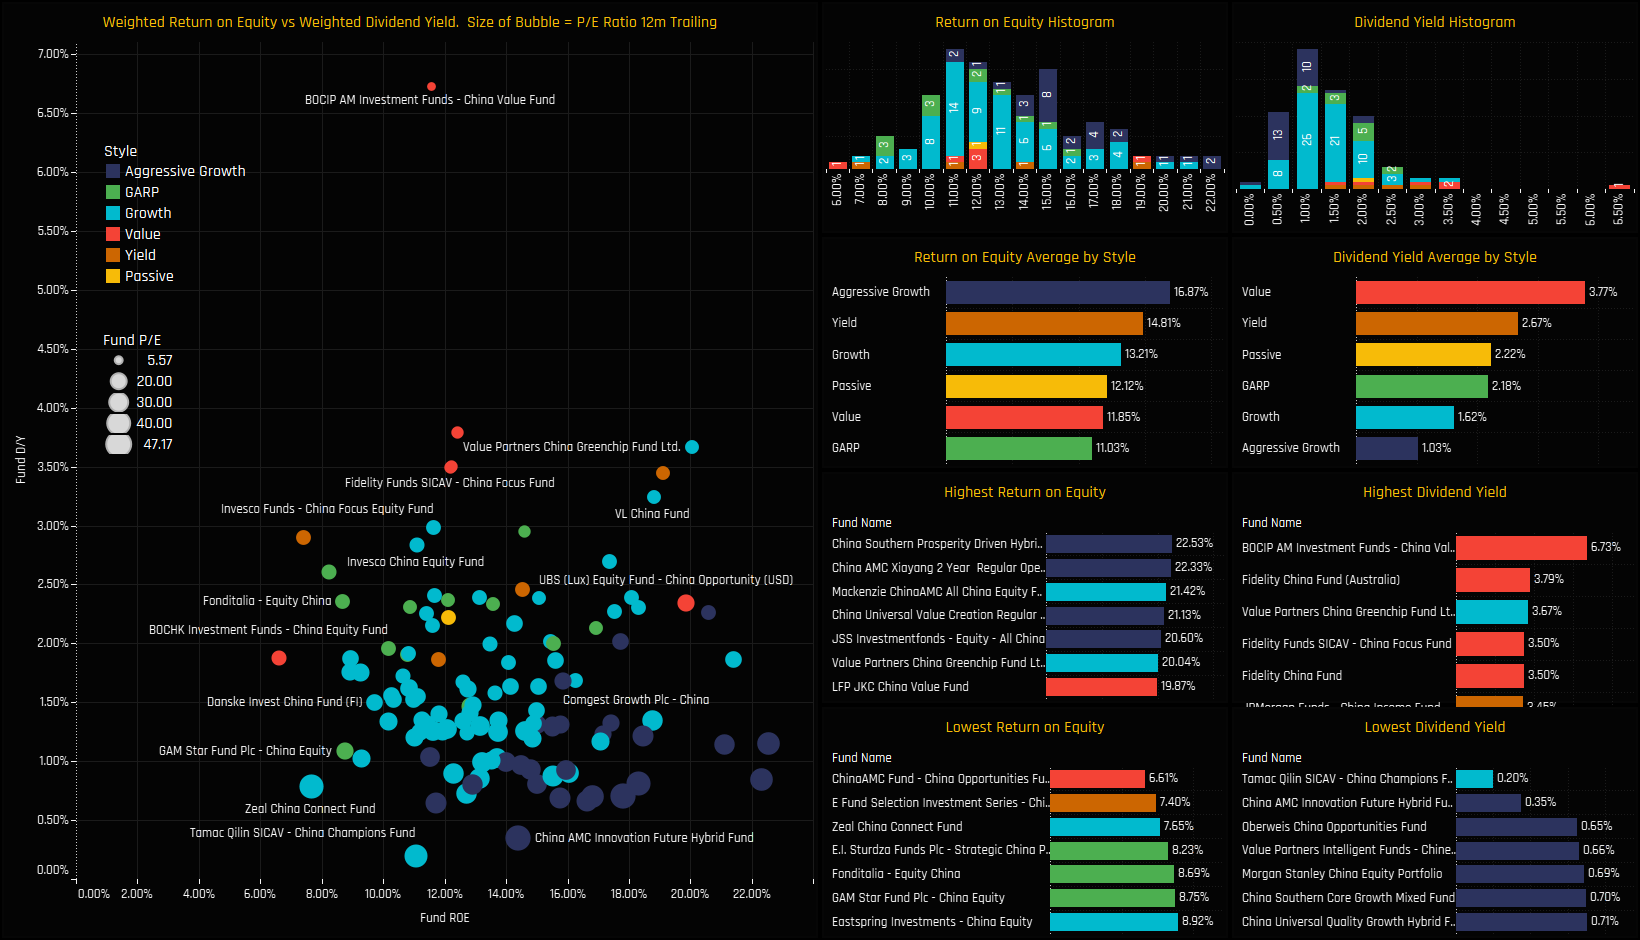
Return on Equity vs Dividend Yield
With the majority of active China investors focused on Growth, it’s little surprise that most offer a lower dividend yield than the benchmark. The spread of dividend Yield ranges from 0.2% to 6.7%, whilst ROE starts at 6.61% for China AMC Opportunities and tops out at 22.5% for China Southern Prosperity.
On a Style basis, Aggressive Growth funds have the highest ROE on average at 16.9%, with GARP (11.03%) and Value (11.85%) offering the lowest.
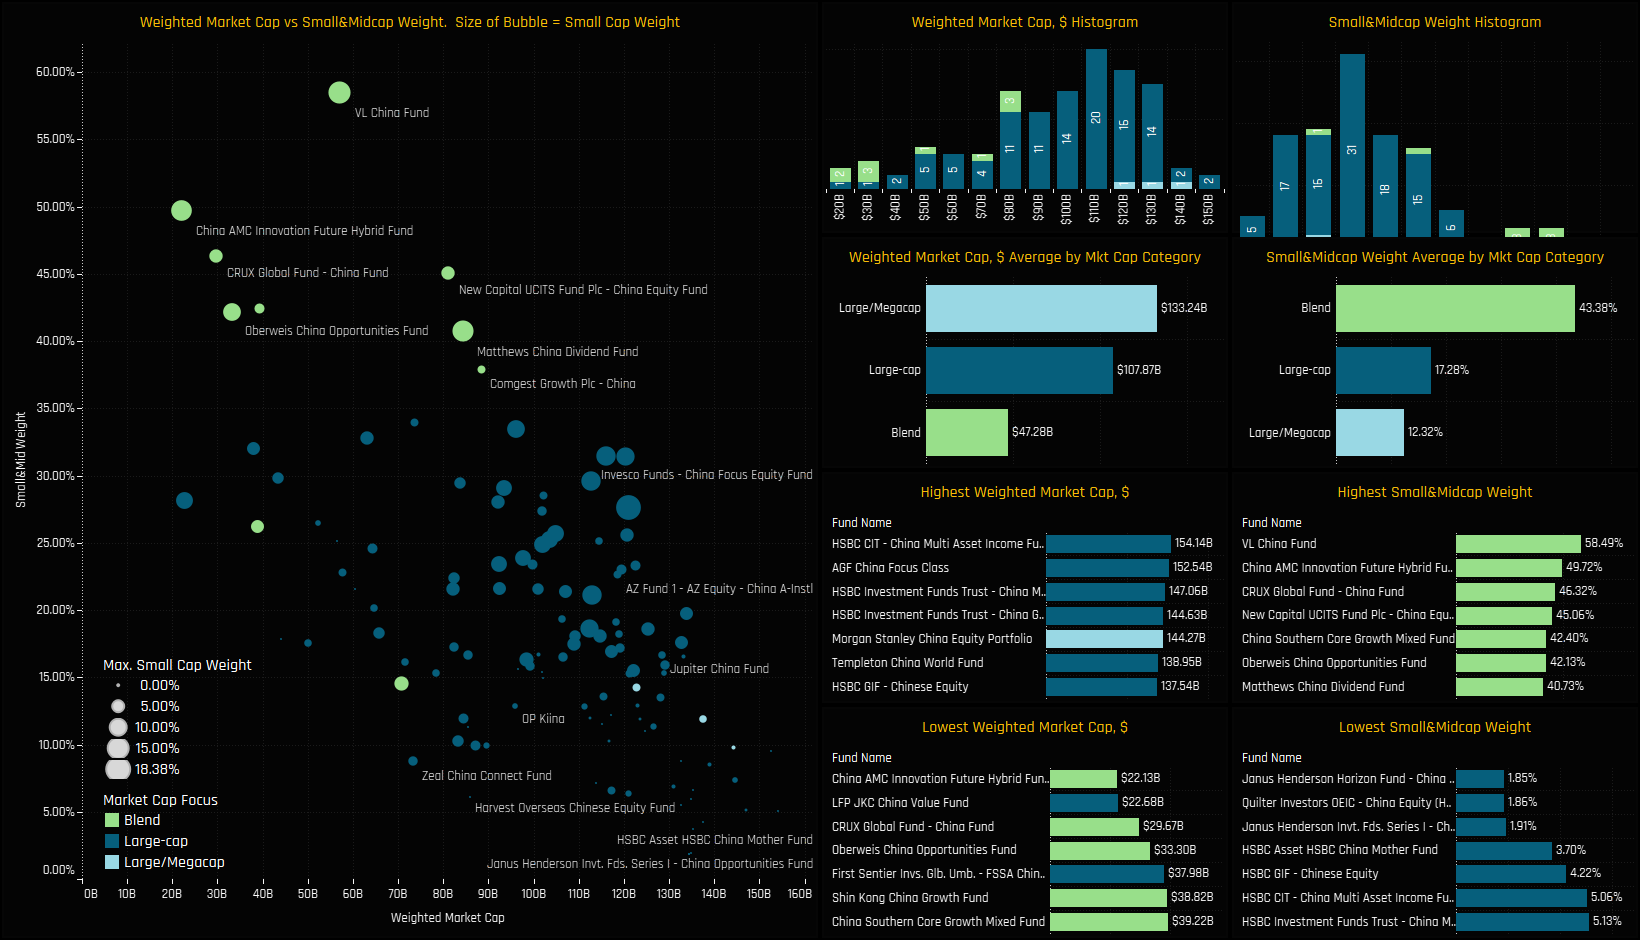
Market Cap
We classify the 120 funds in our analysis based on the market cap profile of the stocks in each portfolio. We split the universe in to 4 categories:
Of the 120 funds in our analysis, 107 come under the Large-cap classification, 10 are Blend and 3 are Large/Mega-cap. There are no Small/Midcap strategies in the analysis.
If you would like further data on the make-up of our China fund universe, do get in touch. Please click on the link below for an excel sheet containing the fund level data from the charts above.
For more analysis, data or information on active investor positioning in your market, please get in touch with me on steven.holden@copleyfundresearch.com

