In this issue:
Q1 Performance & Attribution
China A-Share Financials: Out of Love
Active Sector Rebalancing
257 China Equity Funds, AUM $108bn
Q1 Performance & Attribution
A look at Q1 performance and the drivers of performance among active MSCI China and China A-Share funds.
MSCI China Funds: Performance
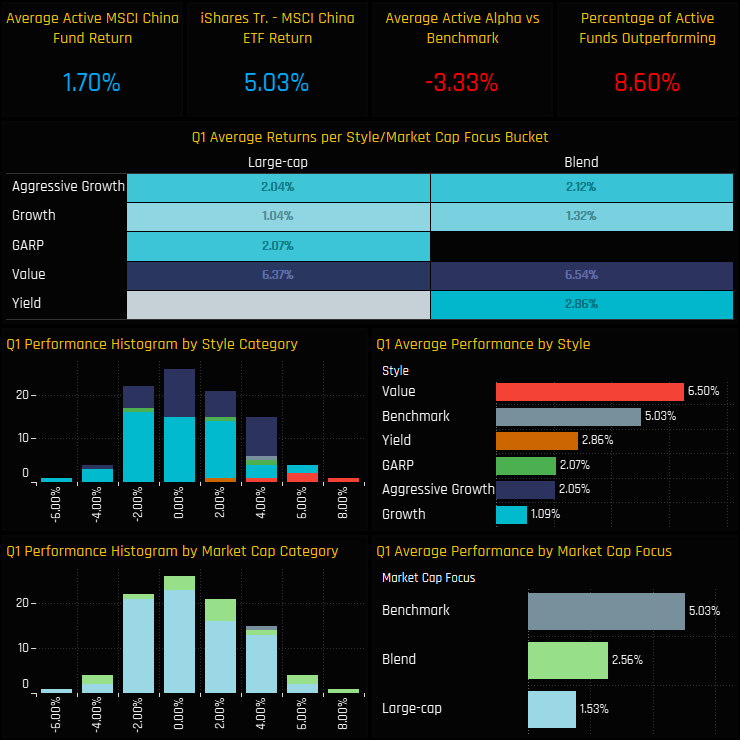
Active China managers have had a tough start to 2023. Average returns of 1.70% fell well short of the iShares MSCI China ETF return of 5.03%, with just 8.6% of funds outperforming. Performance was correlated to Style, with Value funds the only Style group to outperform on the quarter.
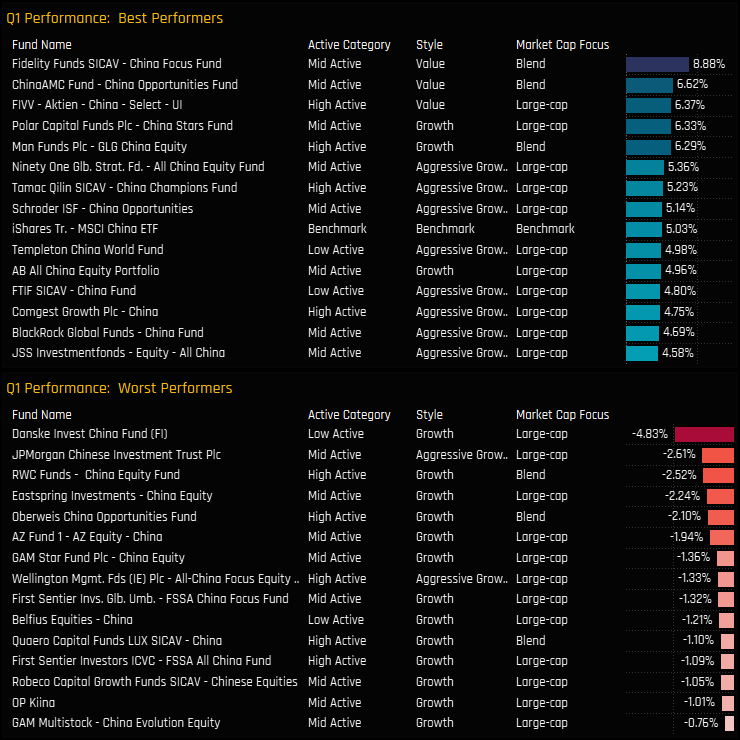
The range of returns was mainly contained between -2% and +4% on the quarter, but there were a small number of funds who fell either side of that. The outperformers were led by the Value strategies of Fidelity China Focus (+8.9%) and China AMC China Opportunities (+6.6%), while Danske China Fund (-4.8%) and JP Morgan Chinese Investment Trust (-2.6%) brought up the rear.
MSCI China Funds: Contribution & Attribution
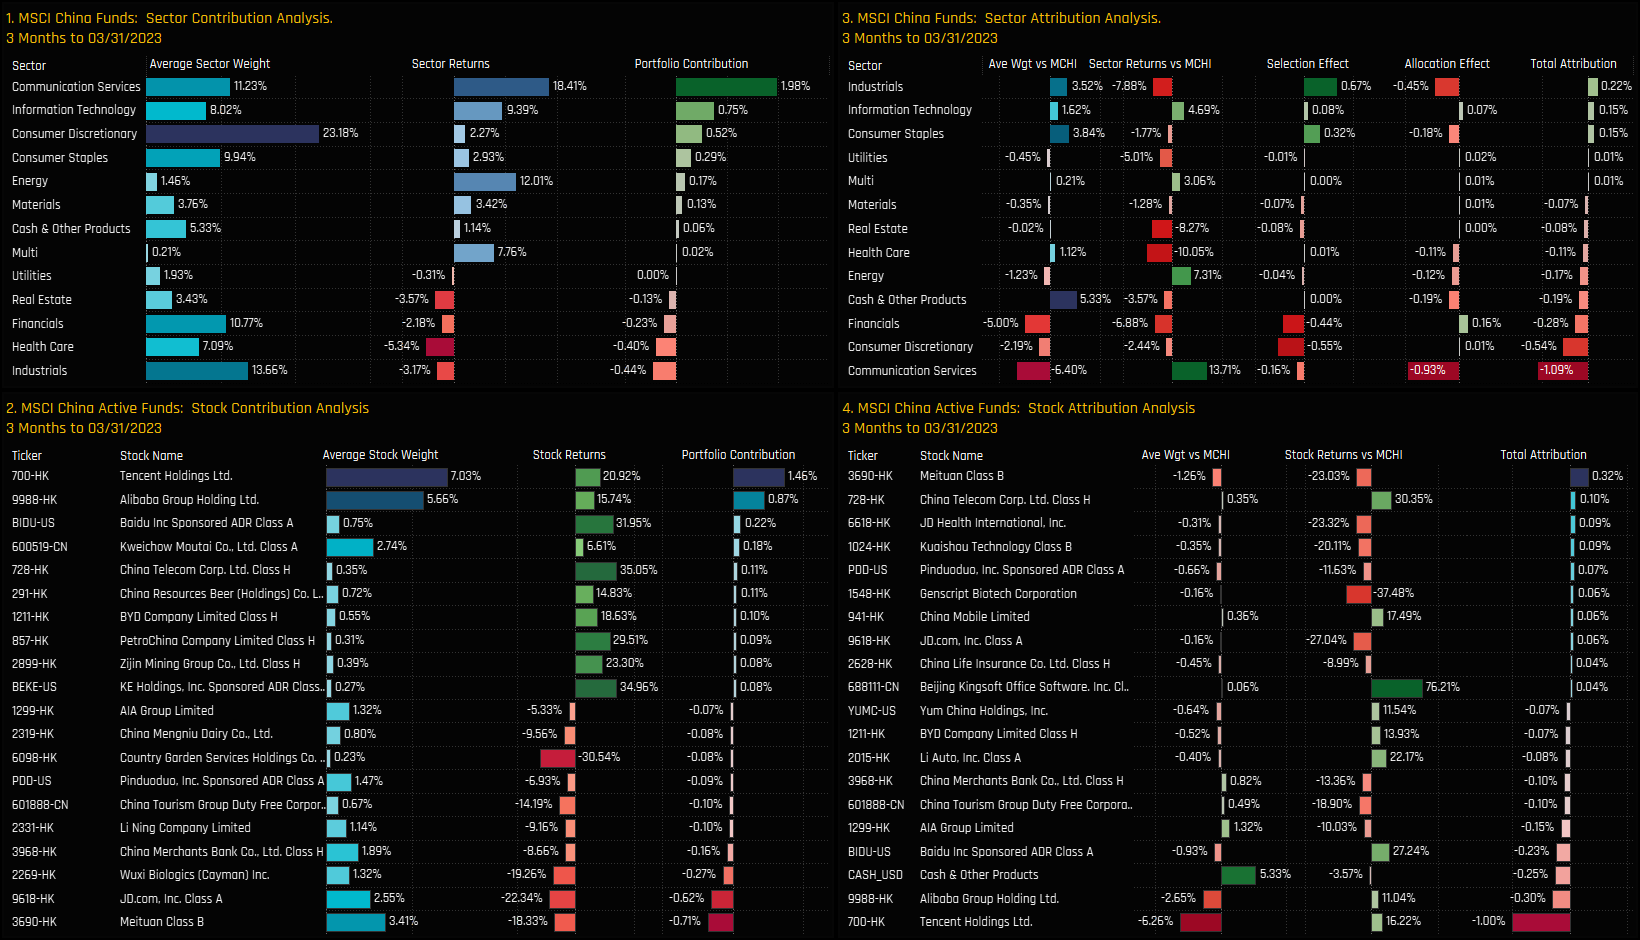
We perform attribution analysis on a portfolio based on the average allocations of the 154 active MSCI China funds in our analysis, versus a representation of the benchmark based on the iShares MSCI China ETF.
The moderately positive returns among active managers were driven by strong performance in the Communication Services and Information Technology sectors, which contributed +1.98% and +0.75% to Q1 returns respectively. Large weights in Tencent and Alibaba contributed the most on a stock level, whilst negative returns from JD.Com and Meituan dragged on quarterly performance.
From an attribution perspective, underperformance was down to big underweights in Communication Services, or more specifically, Tencent Holdings. The -6.26% underweight in Tencent cost managers -1% over the quarter. Elsewhere, China managers benefited from strong stock selection in Industrials and Consumer Staples against poor stock selection in Financials and Consumer Discretionary.
China A-Share Funds: Performance
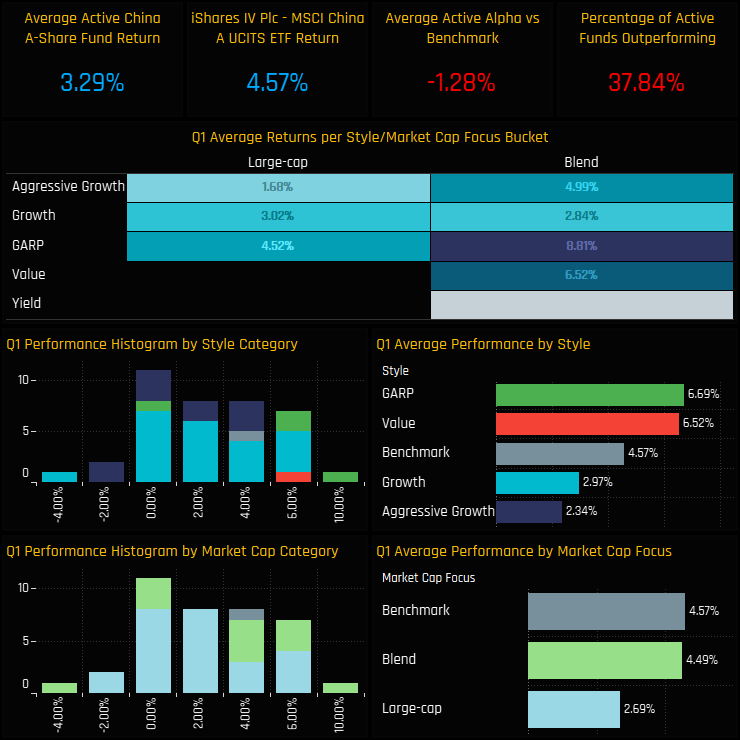
Active China A-Share managers averaged returns of +3.29% in Q1, underperforming the iShares MSCI China A ETF by -1.28%. Again, the Value end of the spectrum performed the best, with both GARP and Value managers outperforming the benchmark by around 2% on average, and Aggressive Growth underperforming by -2.23%.
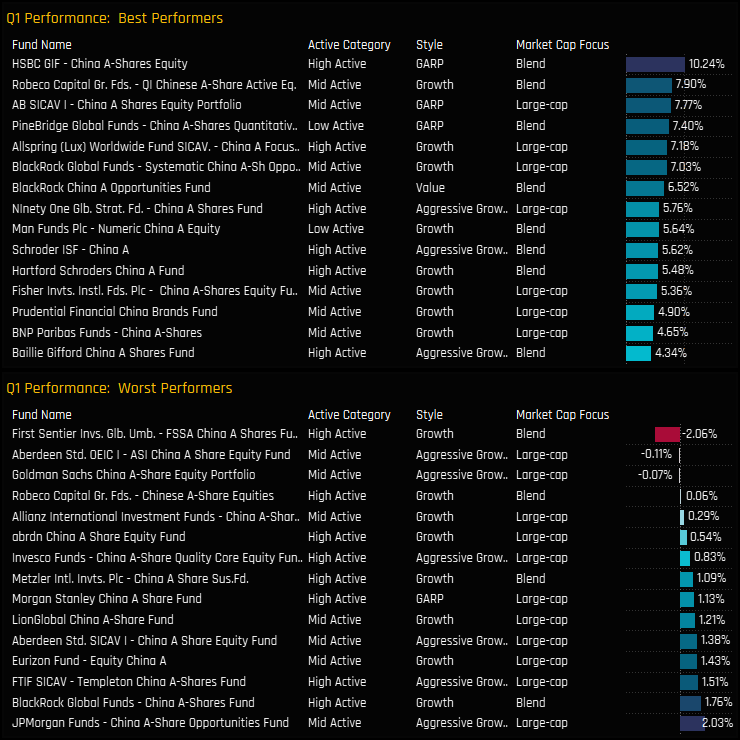
The distribution of returns was mainly contained within 0% and 6% on the quarter. Of the top 5 performers, 3 were a combination of GARP/Blend and led by HSBC China A-Shares on +10.24%. Only 3 funds posted negative returns in Q1, led by First Sentier China A Shares (-2.06%) and Aberdeen China A Share Equity (-0.11%).
China A-Share Funds: Contribution & Attribution
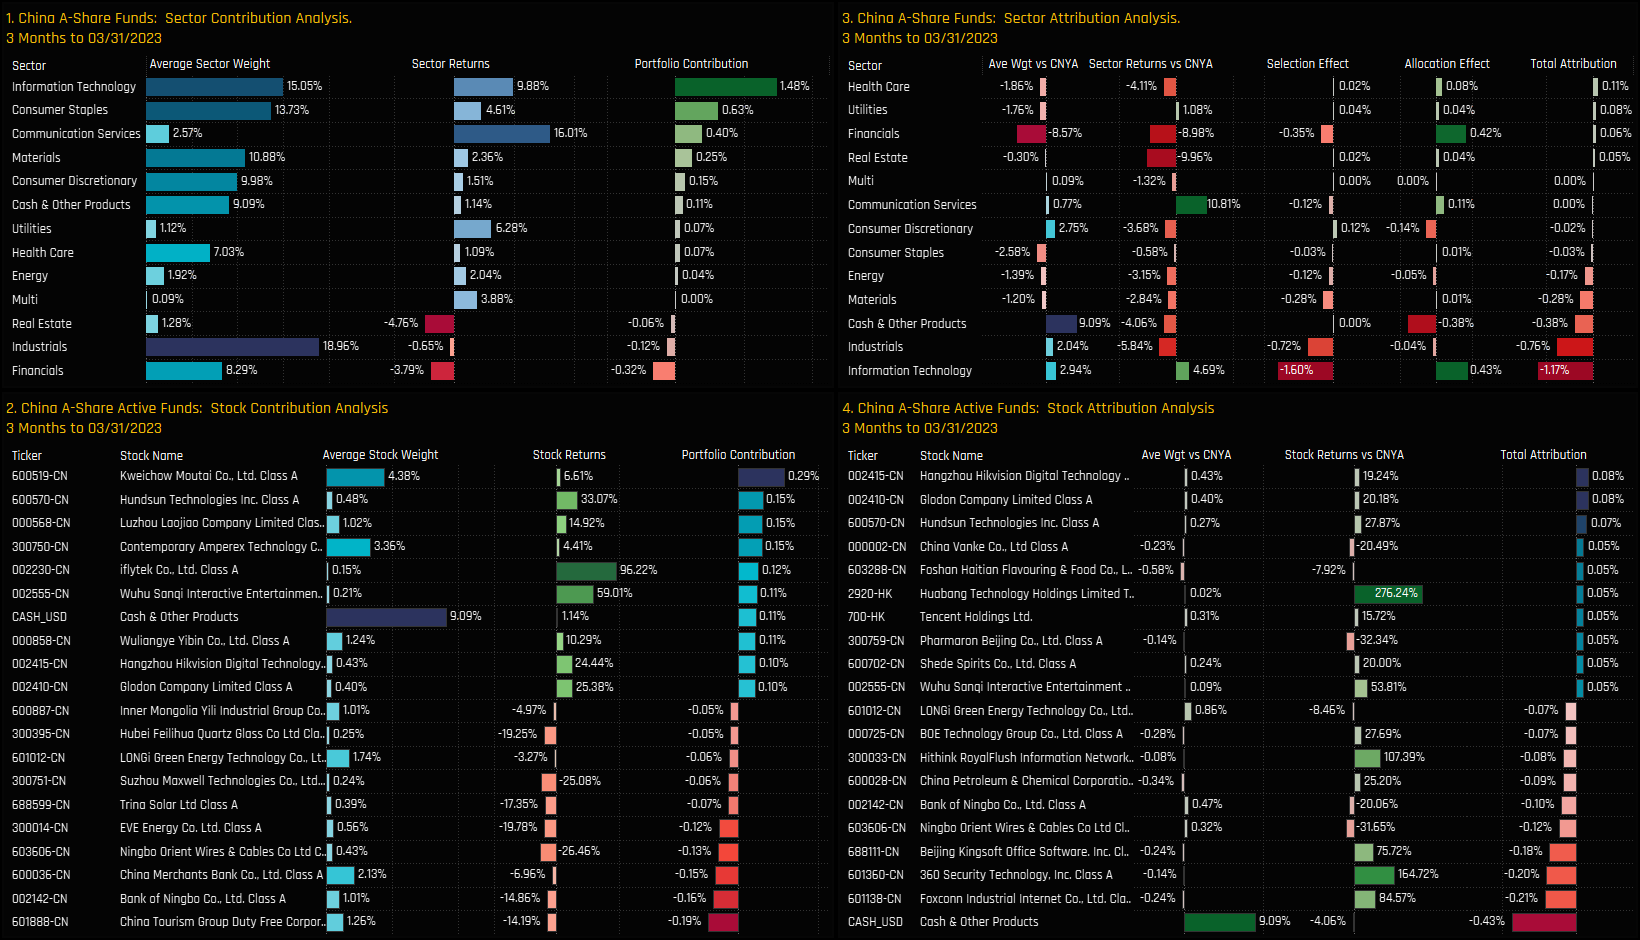
We perform attribution analysis on a portfolio based on the average allocations of the 103 active China A-Share funds in our analysis, versus a representation of the benchmark based on the iShares MSCI China A-Share ETF.
Information Technology holdings contributed the most to quarterly performance, with the sector returning 9.9% on average with fund weights of 15.05%. The largest sector holding of Industrials was a drag on performance, in addition to Financials and Real Estate exposure. On a stock level, Kweichow Moutai and Hundson Technologies were the winners, against losses taken from China Tourism Duty Free and Bank of Ningbo.
From an attribution perspective, underweights in Financials and overweights in Technology were the only bright spots. Instead, poor stock selection in Tech, Industrials and Financials, together with high aggregate cash exposure were the main drivers of underperformance on the quarter. Underweights in some of the mega-performers such as Foxxconn Industrial Internet and 360 Security Technology caused a fair degree of pain.
103 China A-Share Funds, AUM $51bn
China A-Share Financials: Out Of Love
As managers scale back Financials exposure to record lows, we highlight a group of unloved stocks that are behind the move.
Time-Series Analysis & Sector Positioning
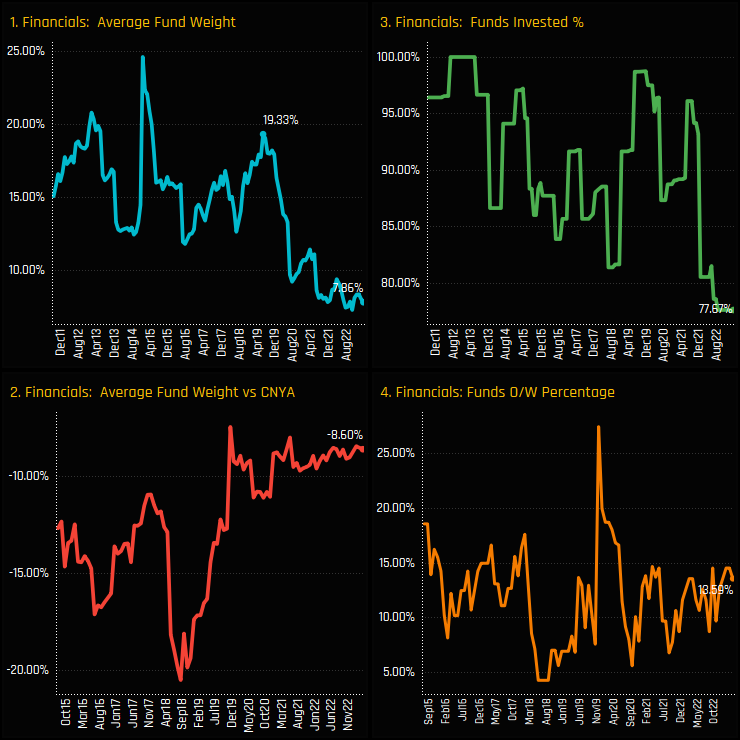
China A-Share fund exposure in the Financials sector is at it’s lowest levels in over a decade. Average weights of 7.86% are a far cry from the 25% weight in mid-2014 (ch1), and the percentage of funds invested in A-Share Financials has dropped from 100% to just 77.7%, the lowest level on record (ch3). Versus the benchmark, active A-Share managers are running an underweight of -8.6%, with just 13.6% of the 103 funds in our analysis positioned overweight.
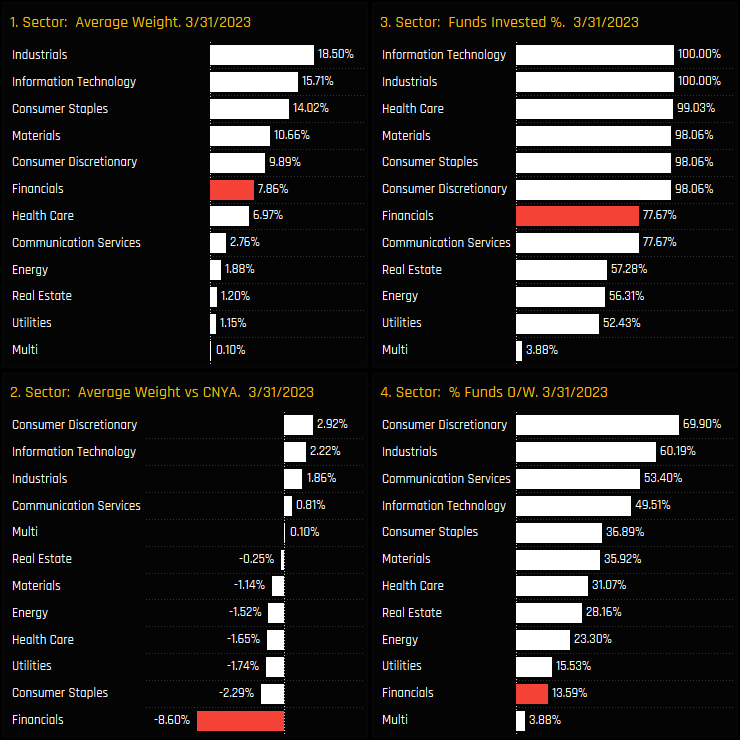
A-Share Financials now stand as the 6th largest holding on an average weight basis and the 7th most widely held. There is a definite gap in ownership compared to the top 6 of Tech, Industrials, Health Care, Materials and the Consumer sectors, with a growing number of funds happy to leave Financials out of their portfolios completely. As such, the Financials sector represents a big underweight compared to the iShares MSCI A-Share ETF benchmark of -8.6%. It’s a massive divergence and the largest underweight across any sector in all of the Fund universes we cover at Copley.
Fund Holdings & Stock Exposure
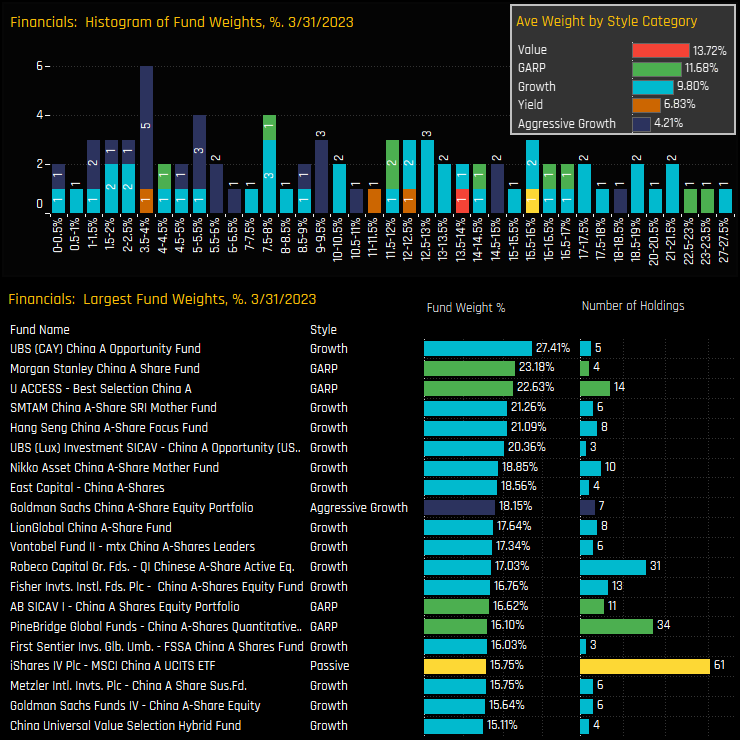
The histogram of fund weights in the Financials sector is shown in the top chart below, and highlights very little in the way of consensus positioning. Funds are allocated in an almost even fashion from zero right through to a high of 27.4%. Only 6 funds hold in excess of a 20% weight, led by UBS China A Opportunity and Morgan Stanley China A-Share.
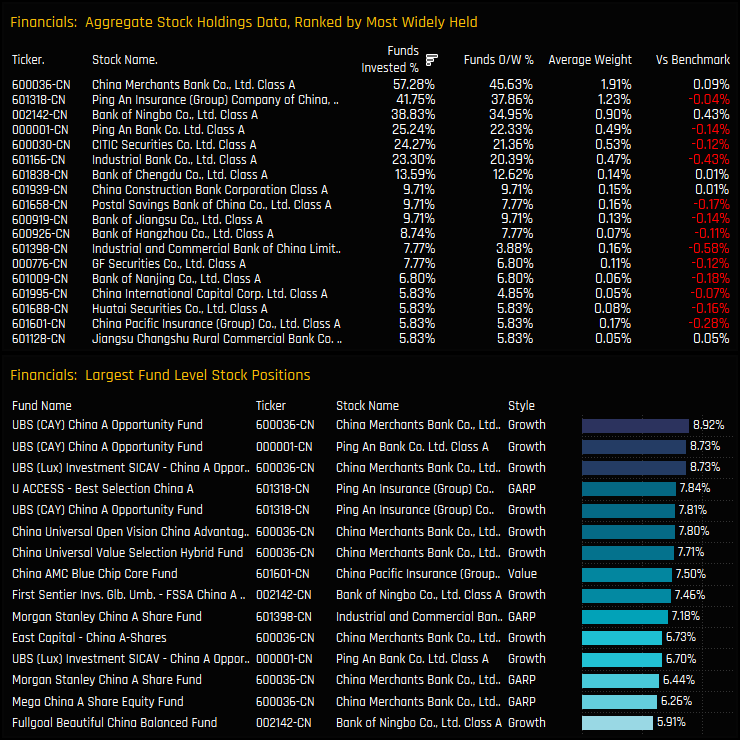
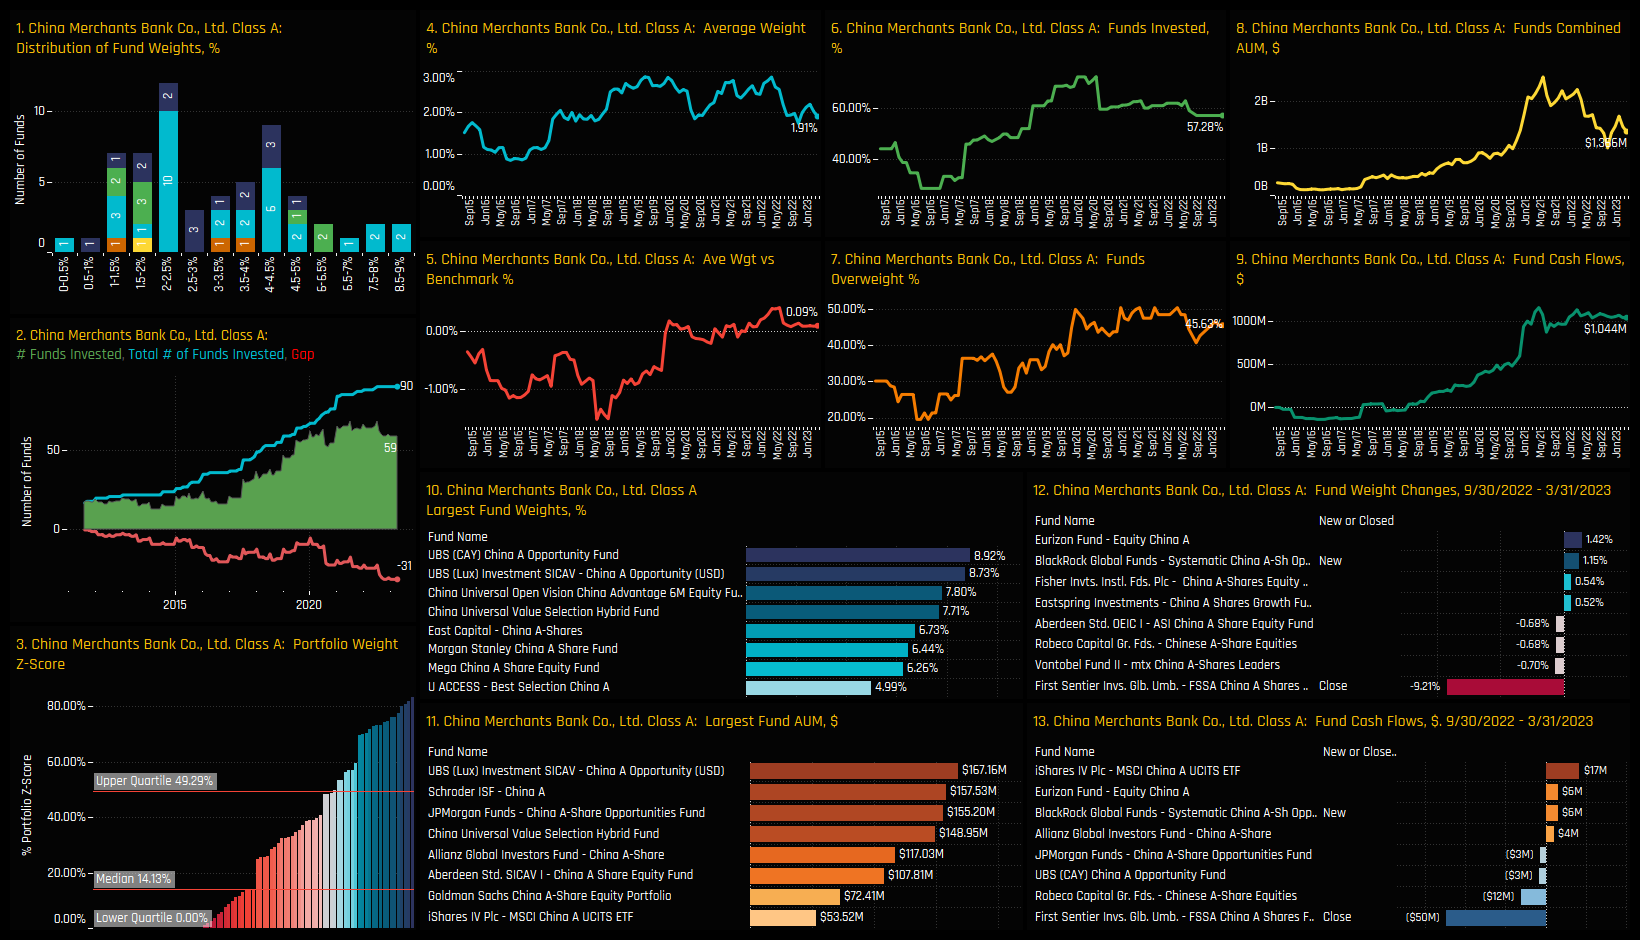
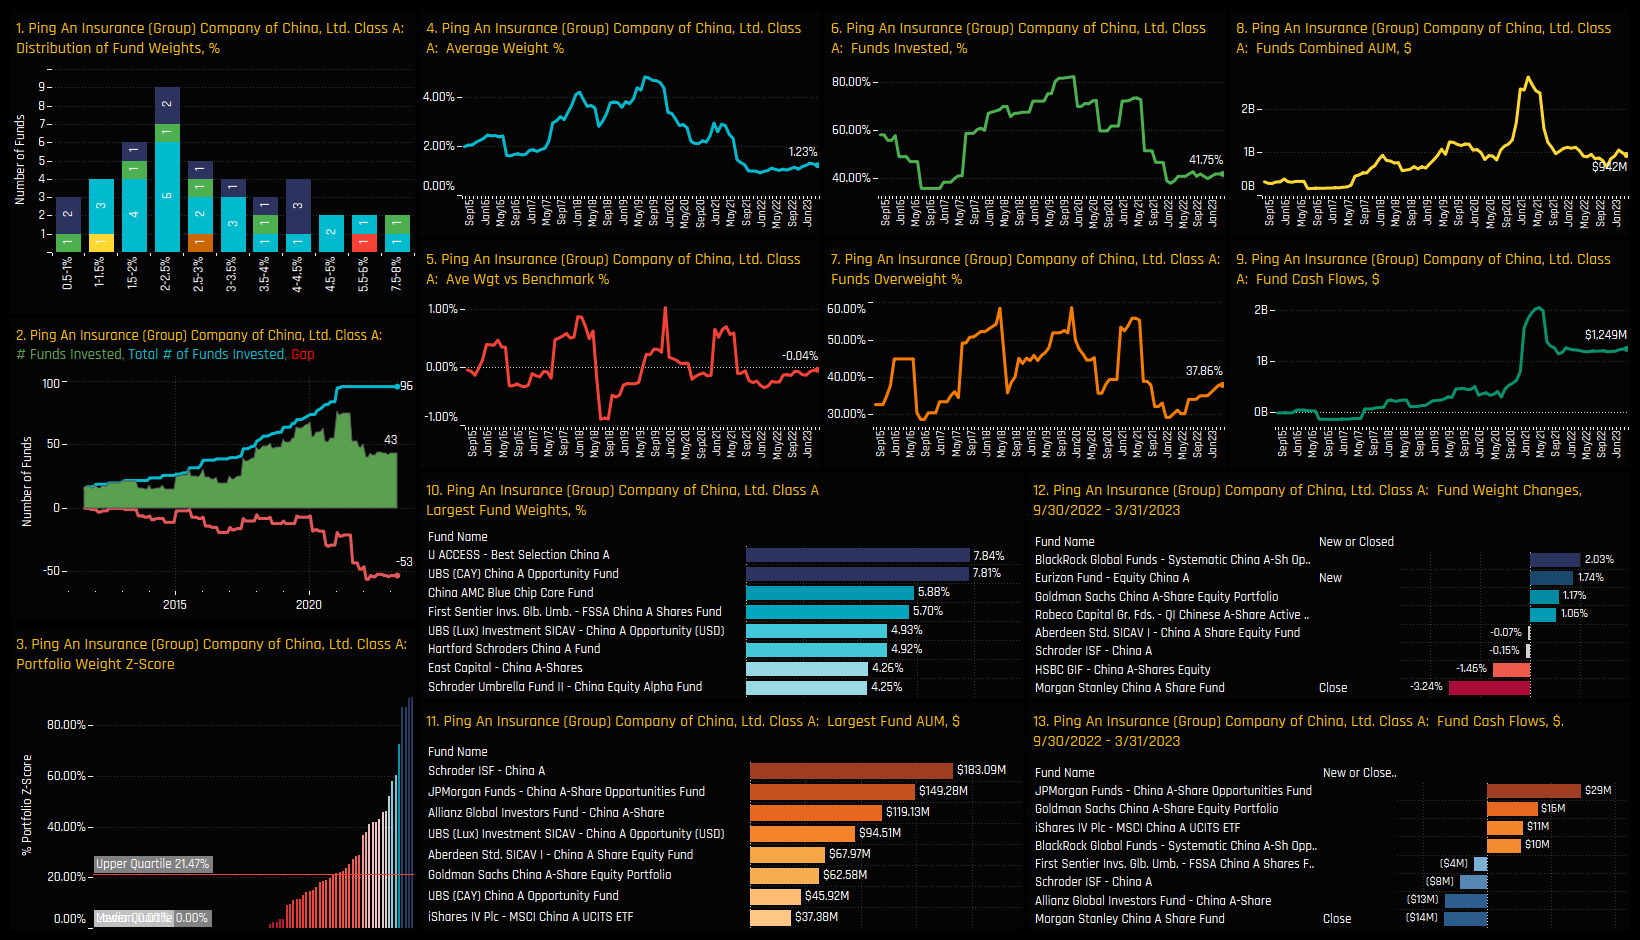
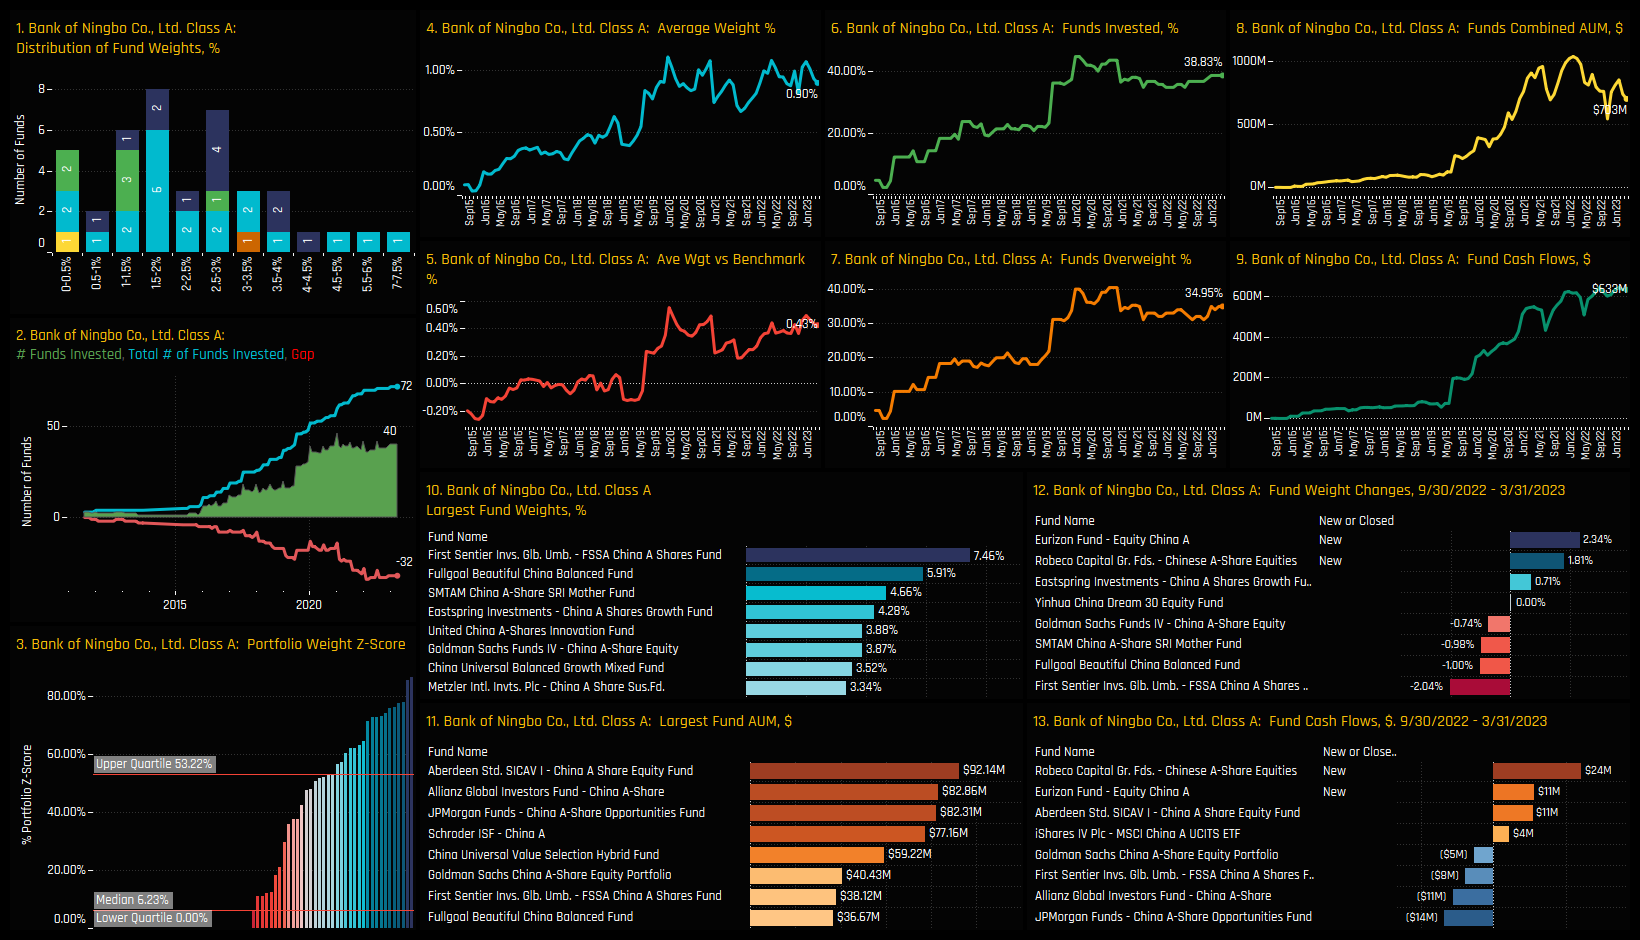
On a stock level, 6 stocks dominate the picture. The combined holdings of China Merchants Bank, Ping An Insurance, Bank of Ningbo, Ping An Bank, CITIC Securities and Industrial Bank account for just over 70% of the total Financials allocation. These stocks also dominate the list of high conviction positions in the bottom chart. After the top 6 stocks, ownership really starts to drop off, with the majority of stocks held by <10% of managers and at net underweights compared to benchmark.
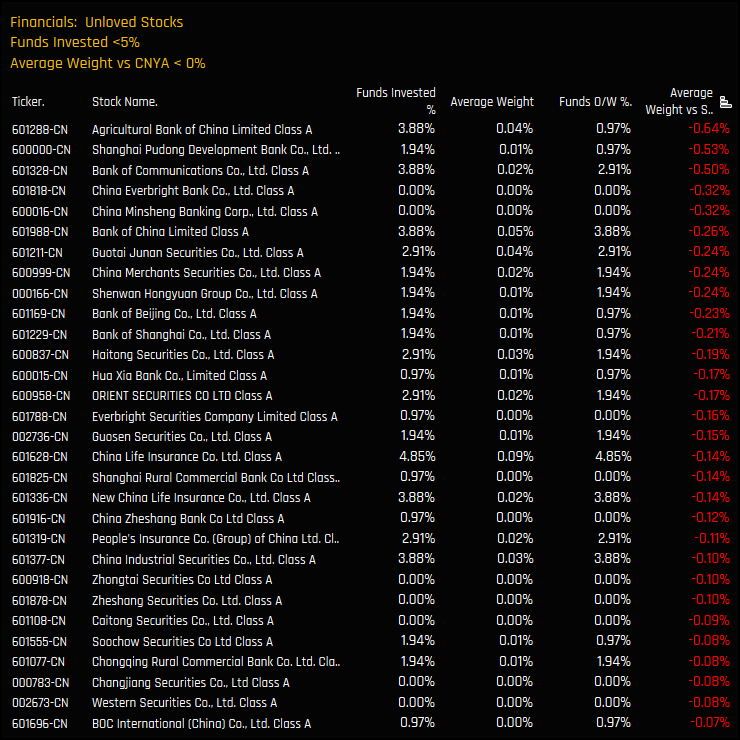
Unloved Financial Stocks
In our analysis, we tend to split underweights in to 2 categories. Firstly, stocks that are widely owned but are held at weights that are lower than the benchmark on average – often these stocks are the major holdings in benchmarks such as Tencent, TSMC, Apple etc. The second group consists of stocks that are held underweight on average, but also almost completely avoided by active investors. The China A-Share Financials sector has a large number of these stocks. The chart below shows A-Share Financials stocks that are held net underweight and owned by less than 5% of the funds in our analysis.
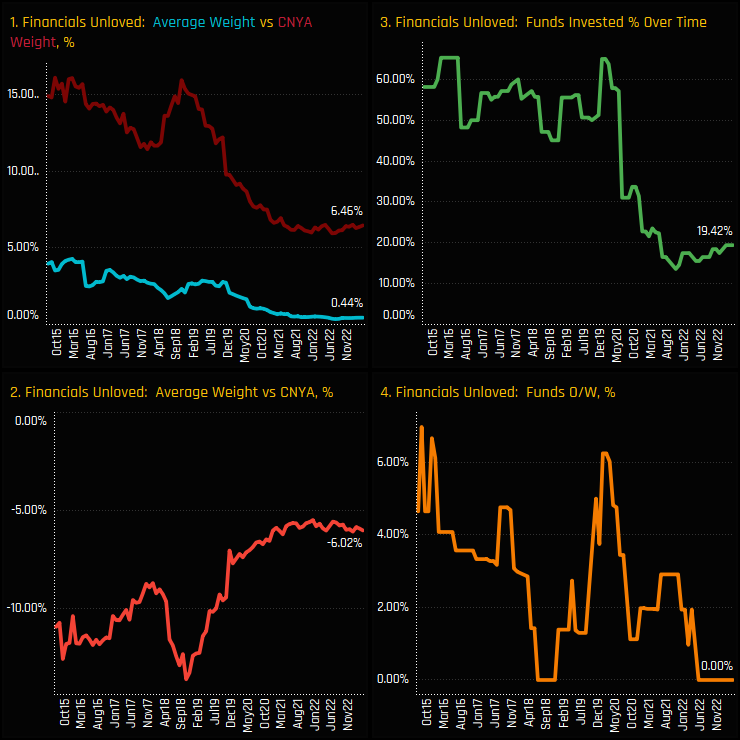
The charts below show the time-series of ownership for these 30 Unloved stocks. Chart 1 shows the benchmark weight in these stocks and the average active fund weight. Chart 2 shows the net over/underweight, with Unloved stocks accounting for -6% of the overall -8.6% total underweight in the Financials sector. Chart 3 shows the percentage of funds in our analysis who hold exposure to any of the 30 Unloved stocks, which has dropped from over 60% to just 19.4% in the space of 4-years, with not a single fund overweight this group of stocks compared to the benchmark.
Conclusions & Links
Ownership levels in the China A-Share Financials sector are at their lowest ebb. The driver of this decline appears to be the lack of confidence that active A-Share managers have outside of a small selection of well held companies. The top 6 most widely held Financial stocks make up 5.5% of the average active A-Share fund and 5.75% in the iShares MSCI China A-Share ETF. But its outside of this where the divergence between active and benchmark occurs. We highlighted above 30 stocks that are ‘unloved’ by active managers, but all stocks outside of the top 6 have struggled to attract interest from active A-Share investors.
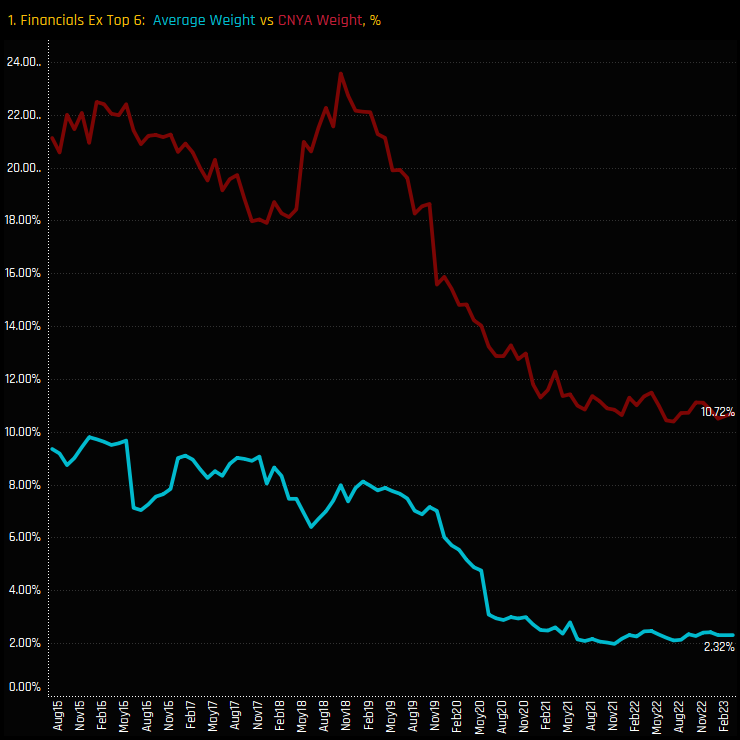
The chart opposite shows the average holding weight in the Financials sector minus the top 6 stocks, for both active managers and the benchmark. Across 83 companies, active A-Share funds have allocated just 2.32% whereas the iShares MSCI China A-Share ETF has allocated 10.72%. The message seems pretty clear – stick to the top 6 and avoid the long tail.
Click below for the full data report on the China A-Share Financials sector. Scroll down for stock profiles on China Merchants Bank, Ping An Insurance and Bank of Ningbo.
Examining the funds who have significantly rebalanced their sector exposures over the last 6-months.
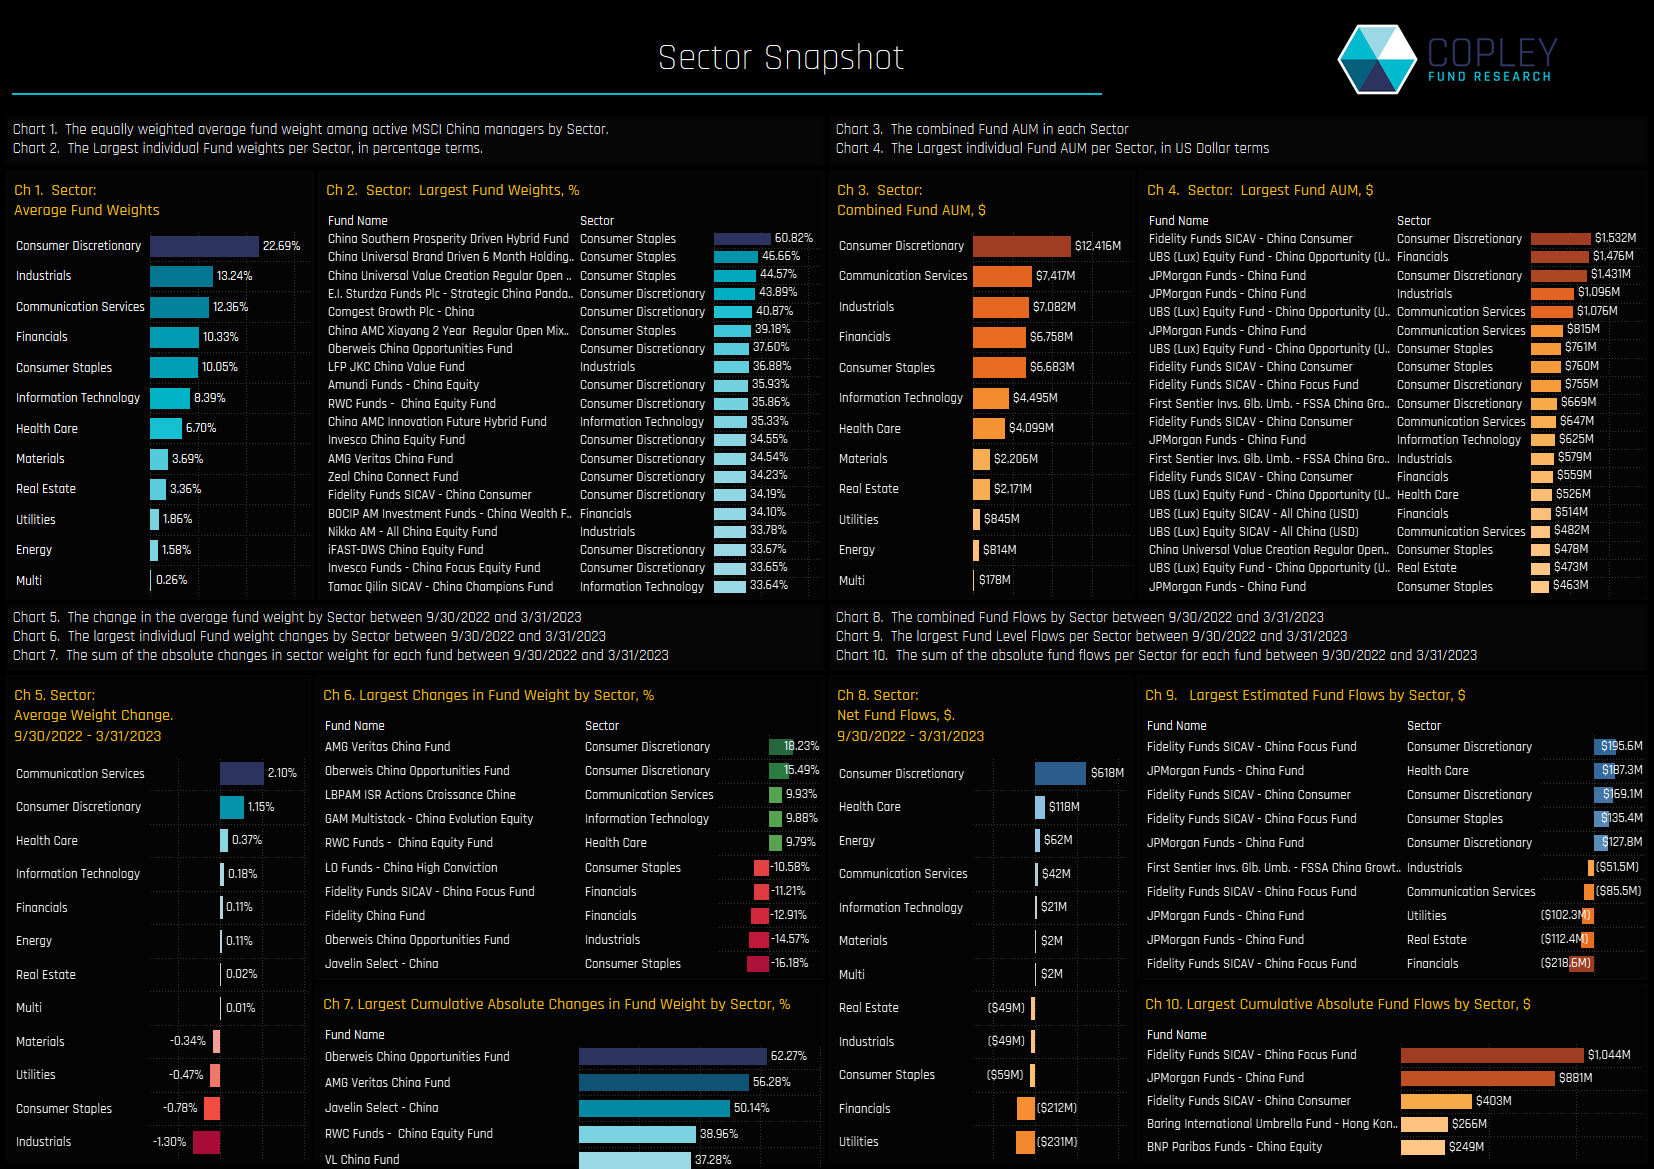
Sector Positioning and Activity
The below chart set shows a summary of sector positioning and activity among the 154 active MSCI China focused funds in our analysis. From a positioning perspective, Consumer Discretionary is king, with average weights of 22.7% well ahead of the chasing pack of Industrials (13.2%), Communication Services (12.4%) and Financials (10.3%). On a fund level, the Consumer Staples and Discretionary sectors dominate the list of large fund exposures on a percentage basis in chart 2.
Over the last 6-months, the Communication Services and Consumer Discretionary sectors captured the largest average weight increase, against decreases in Industrials and Consumer Staples (ch5). Discretionary stocks were the key beneficiary of fund inflows (ch8) after buying from JP Morgan China and Fidelity China Focus (ch9). Both funds topped the list of the largest absolute sector fund flows in chart 10, whilst Oberweis China Opportunity and AMG Veritas China were the most active on a sector weight change basis. We will analyse these 4 funds in more detail below.
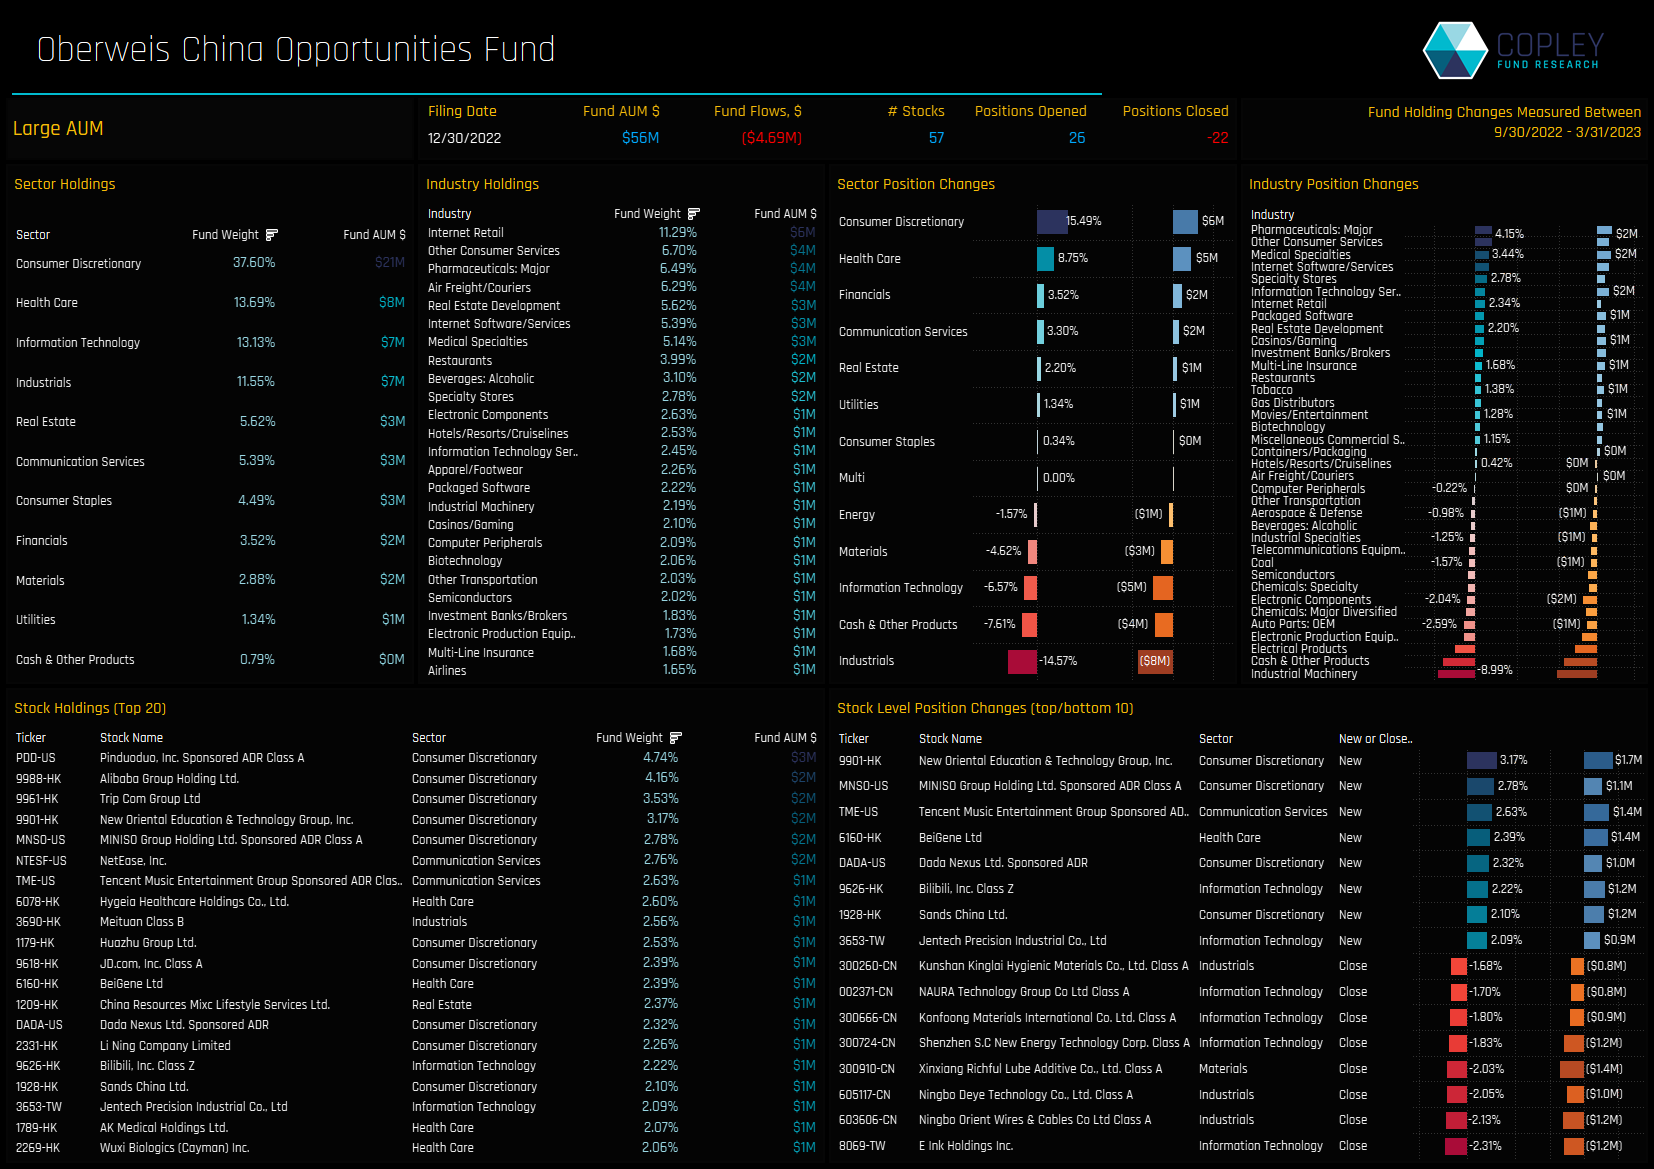
Oberweis China Opportunities
Oberweis China Opportunities is a concentrated fund of 57 stocks with total AUM of $56m. The significant sector rotation was driven by a +15.5% increase in Consumer Discretionary weights and +8.75% increase in Health Care weights. These offset decreases in Industrials (-14.6%), Cash holdings (-7.6%) and Technology (-6.6%). This rotation places Consumer Discretionary as the largest sector allocation by some distance.
On a stock level, the fund was very active, with 26 new positions and 22 closures. Tech and Industrials stocks bore the brunt, with closures in E Ink Holdings and Ningbo Orient Wires & Cables, offset by new positions in New Oriental Education and MINISO Group Holding. The top 5 stocks are in the Consumer Discretionary sector, led by Pinduoduo, Alibaba and Trip.Com
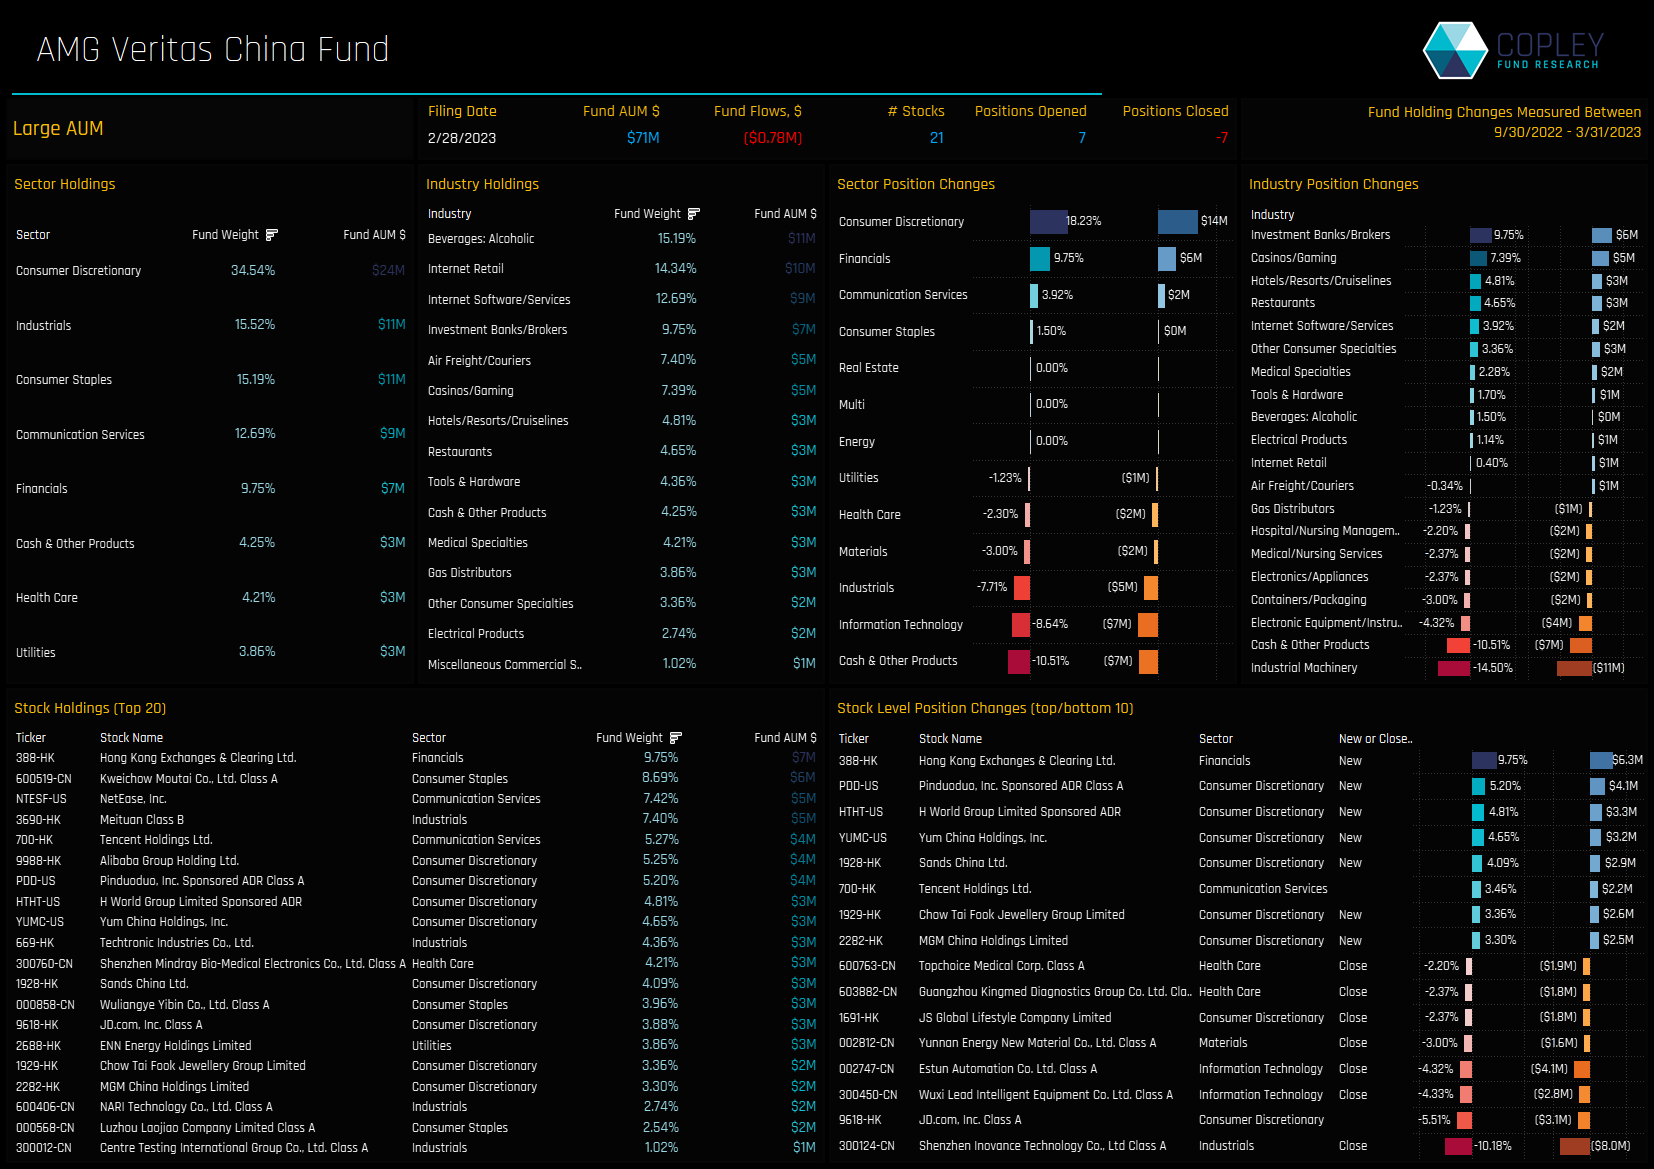
AMG Veritas China Fund
Similar to Oberweis, the main beneficiary of sector rotation was the Consumer Discretionary sector, with weights increasing by +18.2% over the last 6-months. The fund also raised Financials weights by +9.75%, whilst decreasing exposure to Cash (-10.5%), Technology (-8.6%) and Industrials (-7.7%). Consumer Discretionary stocks now account for over a 3rd of total fund exposure.
The fund is highly concentrated with just 21 holdings, and led by significant positions in Hong Kong Exchanges (9.75%) and Kweichow Moutai (8.7%). HK Exchanges was a new position, alongside Pinduoduo, H World Group and Yum China. The fund closed holdings in Shenzhen Inovance Technology, Wuxi Lead Intelligent Equipment and Estun Automation and decreased exposure in JD.Com.
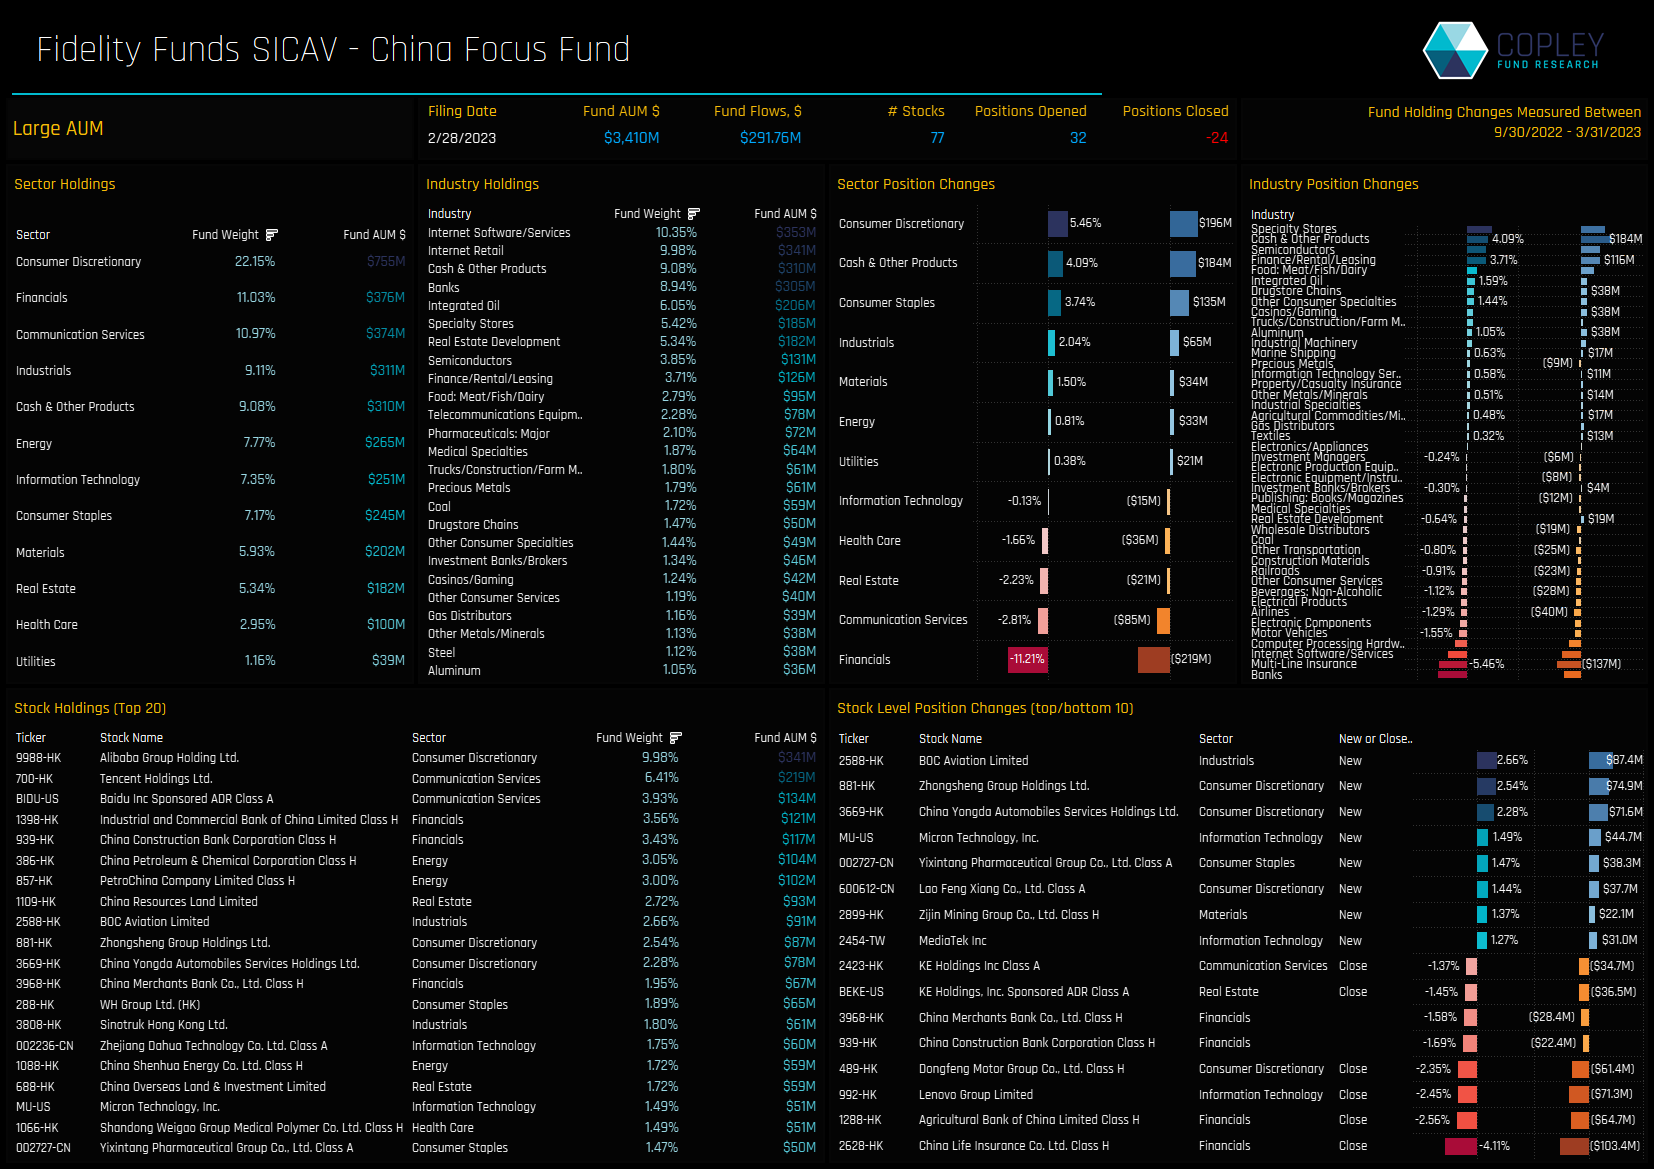
Fidelity Funds China Focus
One of the larger funds in our China analysis on an AUM basis, the fund saw inflows of +$291m over the last 6-months, increasing AUM to $3.4bn. Sector rebalancing was sizeable over the period, with a total $1.04bn of sector activity, directed once again to the Consumer Discretionary sector (+$196m), versus selling in Financial stocks (-$291m). The fund has a more balanced split of sector allocations, with Consumer Discretionary and Financials the key exposures.
The fund currently holds 77 companies, and over the last 6-months opened 32 new positions and closed 24. BOC Aviation was the largest opening position of +2.66%, slotting in as the 9th largest position in the portfolio. The big drop in Financial weights was mainly due to closures in China Life Insurance and Agricultural Bank of China. The fund is heavily reliant on Alibaba, Tencent and Baidu, which collectively account for a fifth of total allocations.
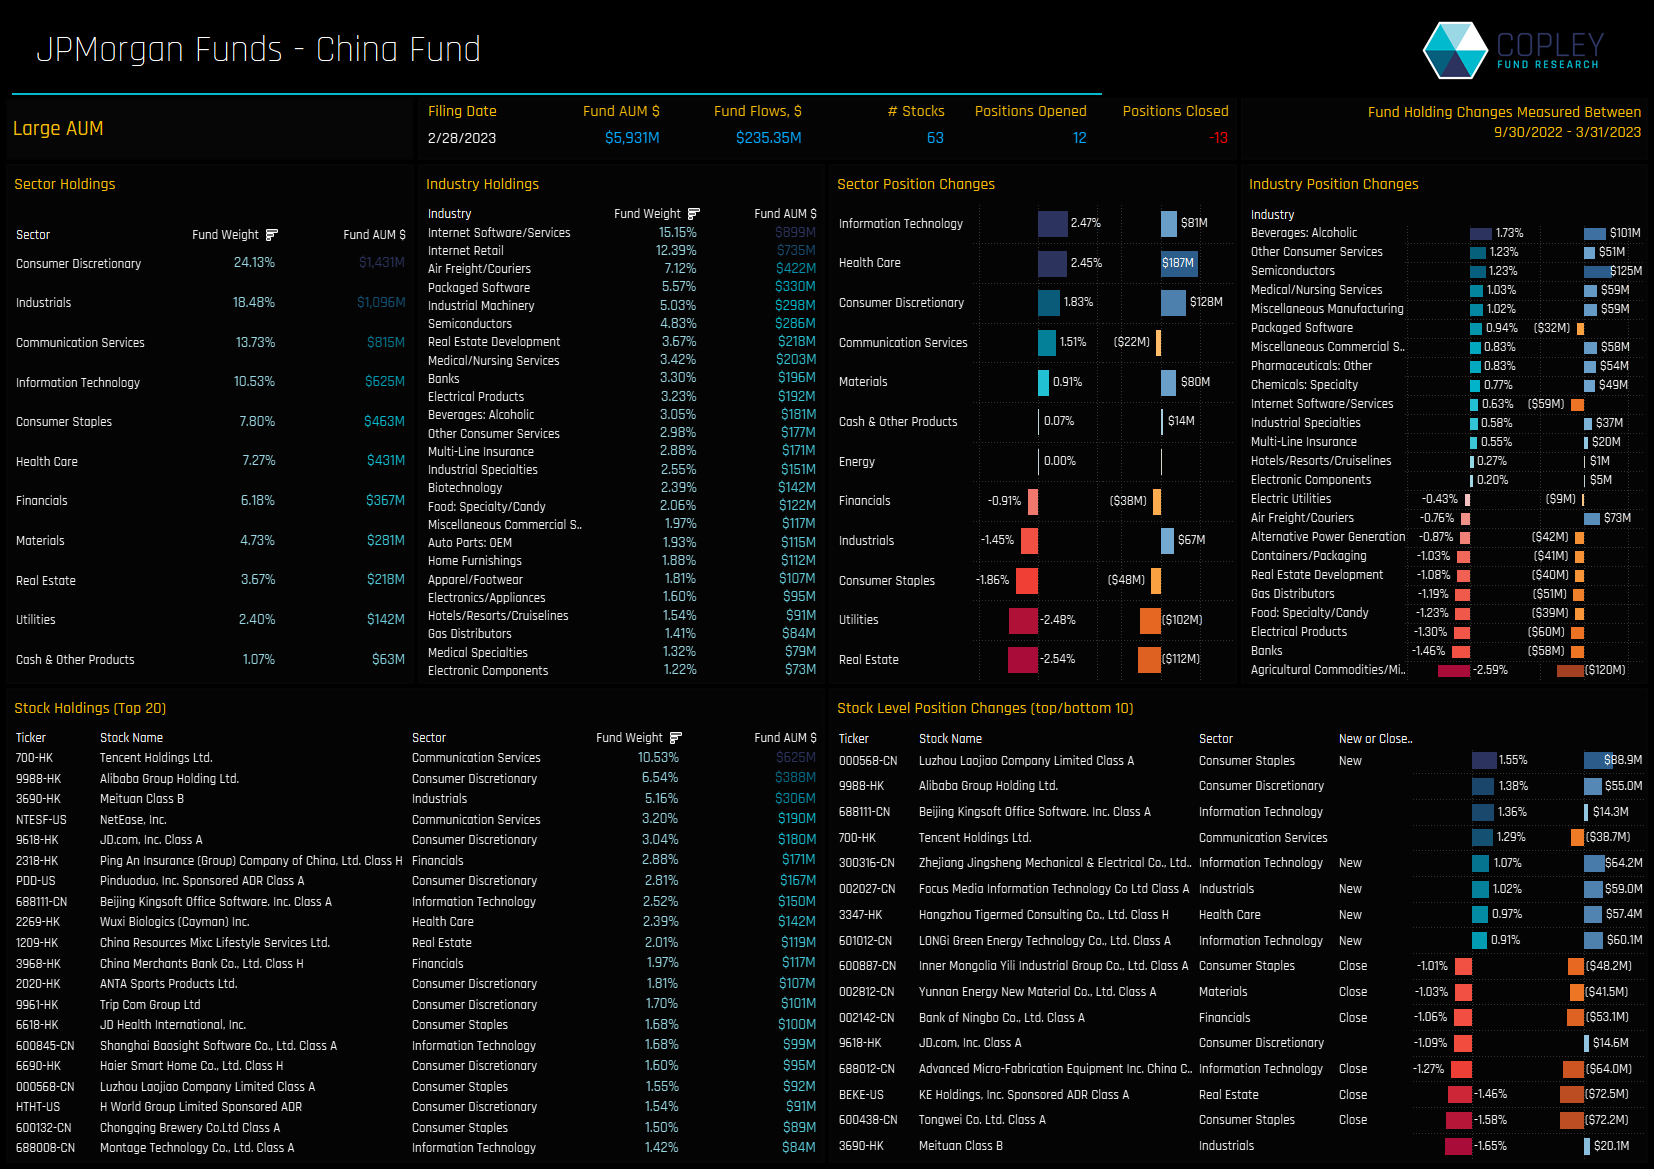
JP Morgan China Fund
The fund’s recent sector rotation was more moderate on a percentage weight basis, but the size of the fund means that USD flows were significant. Buying over the last 6-months was focused in Technology, Health Care and Consumer Discretionary and selling in Real Estate and Utilities. On an industry level, Internet Software/Services and Internet Retail account for 27.54% of total fund allocations.
Over the last 6-months the fund opened 12 new positions, led by Luzhou Laojiao (+1.55%) and Zhejiang Jingsheng Mechanical (+1.07%), whilst increasing exposure to Alibaba Group Holdings. Closures were led by Tongwei (-1.58%) and KE Holdings (-1.46%) in addition to reduced exposure in Meituan. The 63 stock portfolio is headed by Tencent Holdings and Alibaba.
257 Active China Funds, AUM $108bn
China Active Funds Ownership Reports
Please click on the links below for the full data reports on MSCI China and China A-Share active fund ownership.
For more analysis, data or information on active investor positioning in your market, please get in touch with me on steven.holden@copleyfundresearch.com


