Asia Ex-Japan Fund Positioning Analysis, April 2023
In this issue:
Q1 Performance & Attribution
Malaysia: Can't Catch a Break
Taiwan Banks: Un-Investible?
Real Estate: Consolidating the Lows?
89 Active Asia Ex-Japan Funds, AUM $55bn
Q1 Performance & Attribution
The latest stats on performance and the drivers of performance for Q1 2023.
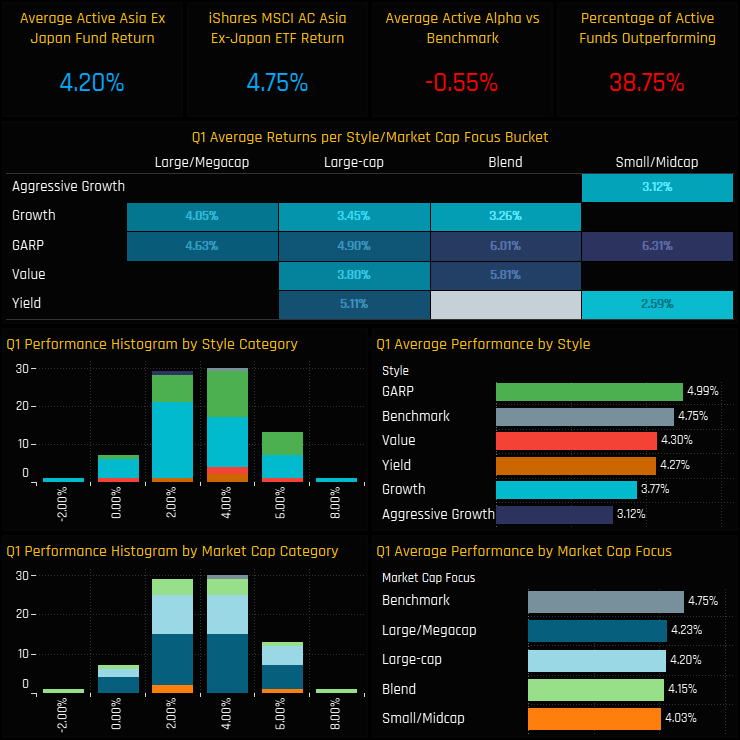
Active Asia Ex-Japan managers had a reasonable first quarter of 2023. Average returns of 4.2% were below the benchmark iShares AAXJ ETF by -0.55%, with 38.75% of funds outperforming. Returns were loosely correlated to Style, with GARP funds the only group to outperform the benchmark, whilst Growth and Aggressive Growth underperformed.
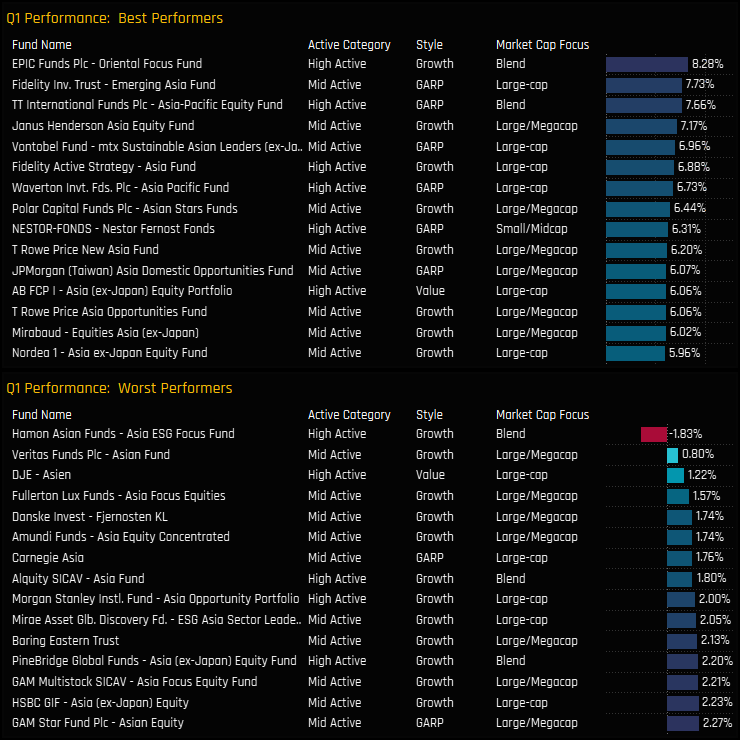
The range of returns was quite narrow on the quarter, with just over 10% separating the top and bottom performers. Most funds returned between 2% and 6% in Q1, though 4 funds achieved above 7% returns, led by EPIC Oriental Focus (8.3%) and Fidelity Emerging Asia (7.7%).
Portfolio Contribution
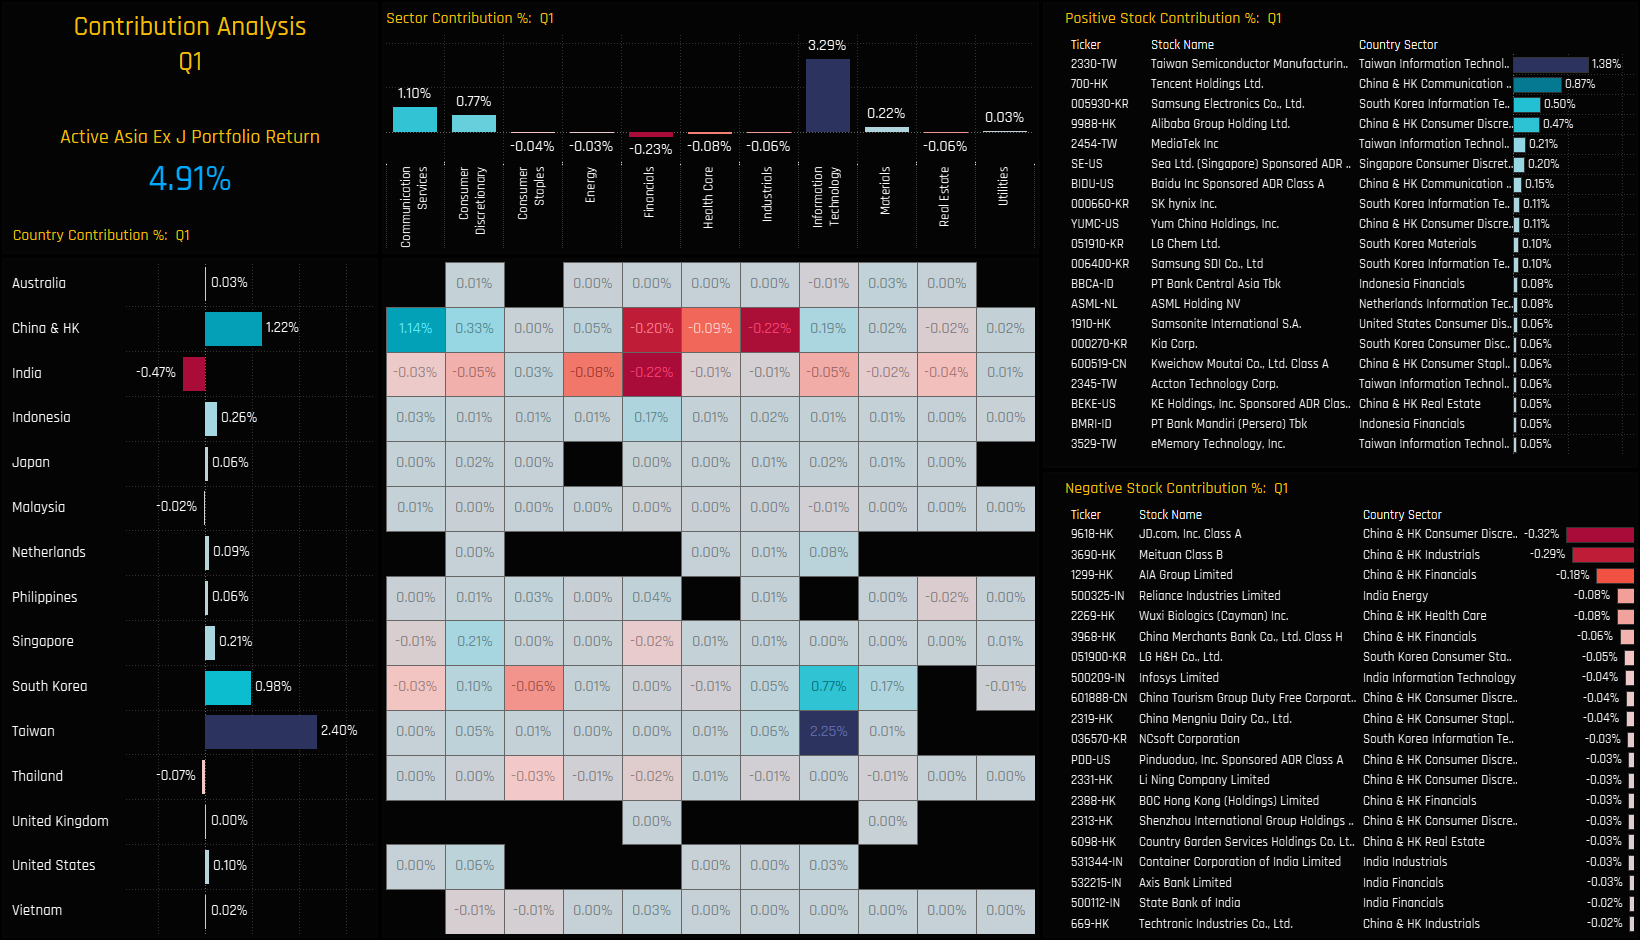
The drivers of returns on the quarter can be seen in the chart set below, which breaks down the performance of a portfolio based on the average holdings of the 89 active Asia Ex-Japan funds in our analysis. This theoretical portfolio returned 4.91% in Q1, driven by Taiwan exposure (+2.4%), China & HK (+1.2%) and South Korea (+0.98%). On a sector level, Information Technology contributed +3.29% to total returns, followed by Communication Services (1.1%) and Consumer Discretionary (+0.77%).
Drilling down a level further, costly country/sectors were Indian Financials (-0.22%), China & HK Industrials (-0.22%) and China & HK Financials (-0.20%). These losses were overshadowed by strong gains in Taiwan Tech (+2.25%), SK Tech (+0.77%) and China & HK Communication Services (+1.14%). The key stocks driving performance can be seen in the right hand charts below, led by TSMC (+1.38%), Tencent (+0.87%) and Samsung Electronics (+0.5%) on the positive side, and JD.Com (-0.32%), Meituan (-0.29%) and AIA Group (-0.18%) on the negative.
Portfolio Attribution
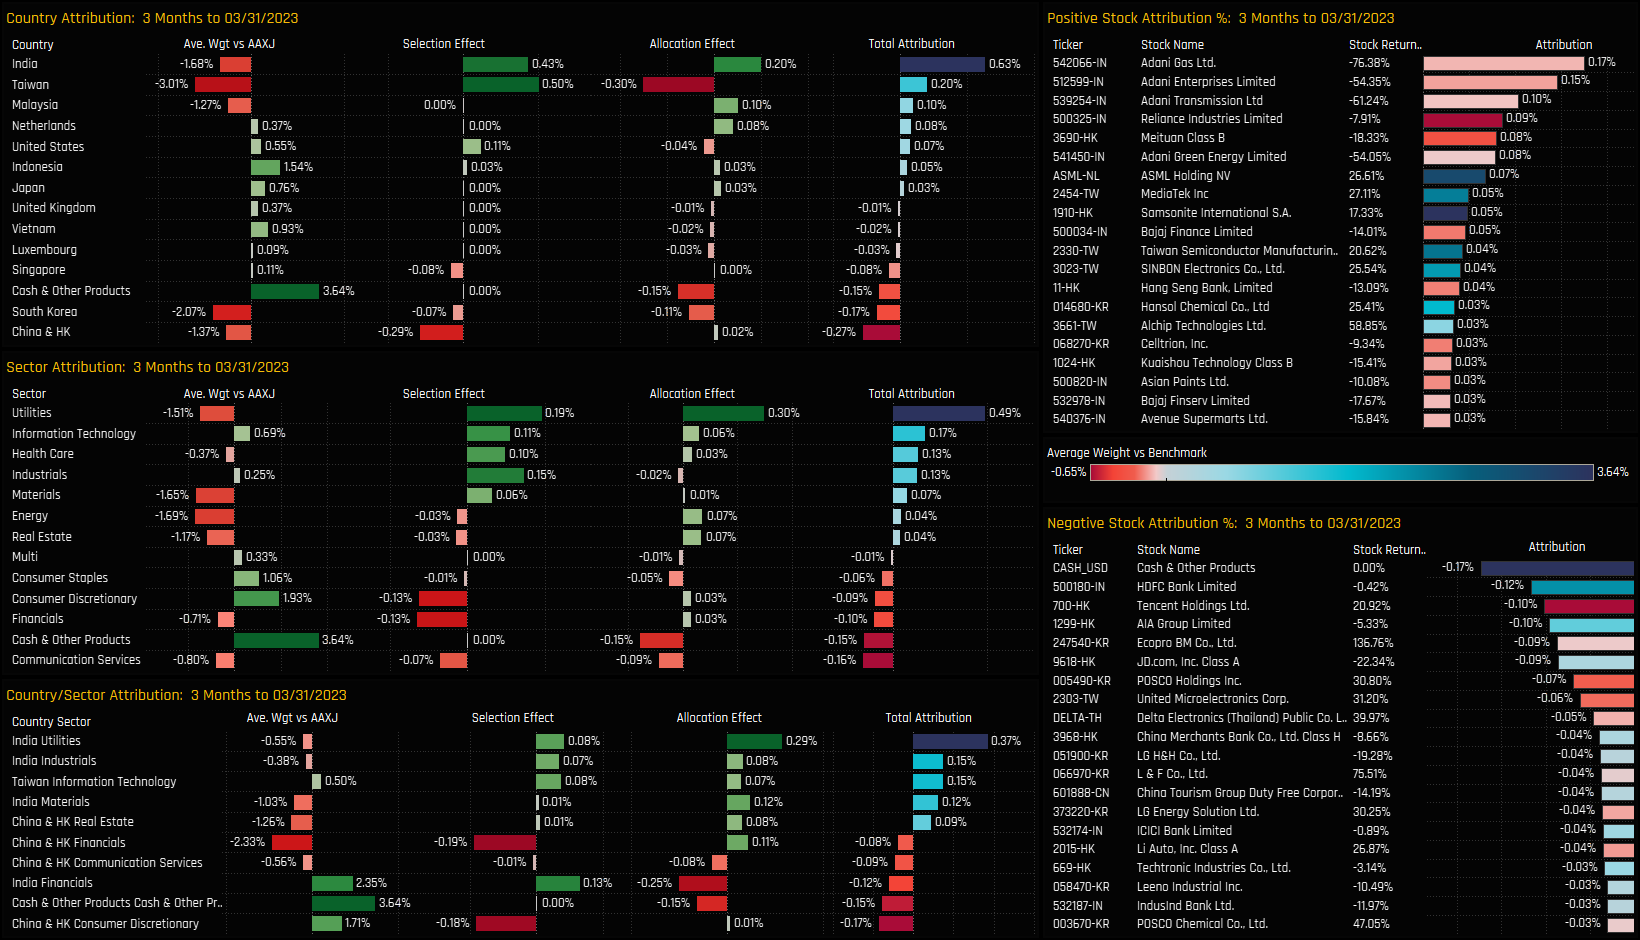
We perform attribution analysis on this portfolio versus a representation of the benchmark based on the iShares AC Asia Ex-Japan ETF. A summary of the key drivers of out/underperformance are documented below.
What worked:
Underweights in India, Malaysia, Utilities, Energy
Overweights in Tech, Consumer Discretionary, Indonesia
Stock selection in India, Taiwan, Utilities, Industrials
Underweights in the Adani Group of Companies, Reliance Industries, Meituan
Overweights in ASML Holdings, MediaTek, Samsonite International
What Didn’t:
Underweights in South Korea, Taiwan, Communication Services
Overweights in Cash, India Financials
Stock selection in the China & HK, Financials, Consumer DIscretionary
Underweights in Tencent HOldings, Ecopro BM, POSCO Holdings
Overweights in HDFC Bank, AIA Group, JD.Com
89 Active Asia Ex-Japan Funds, AUM $55bn
Malaysia: Can't Catch a Break
After a brief reprisal, Malaysian allocations make a move back towards the lows.
Time-Series & Country Activity
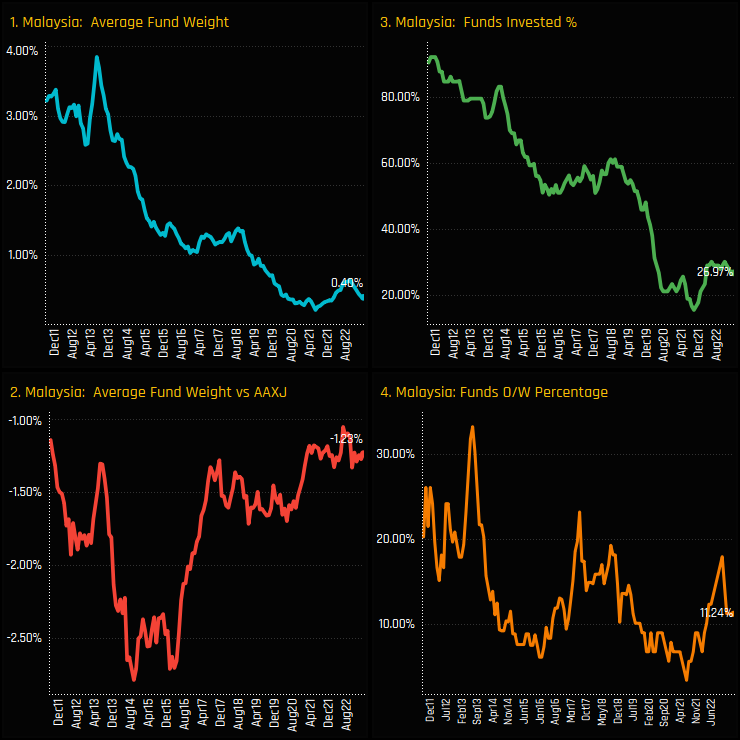
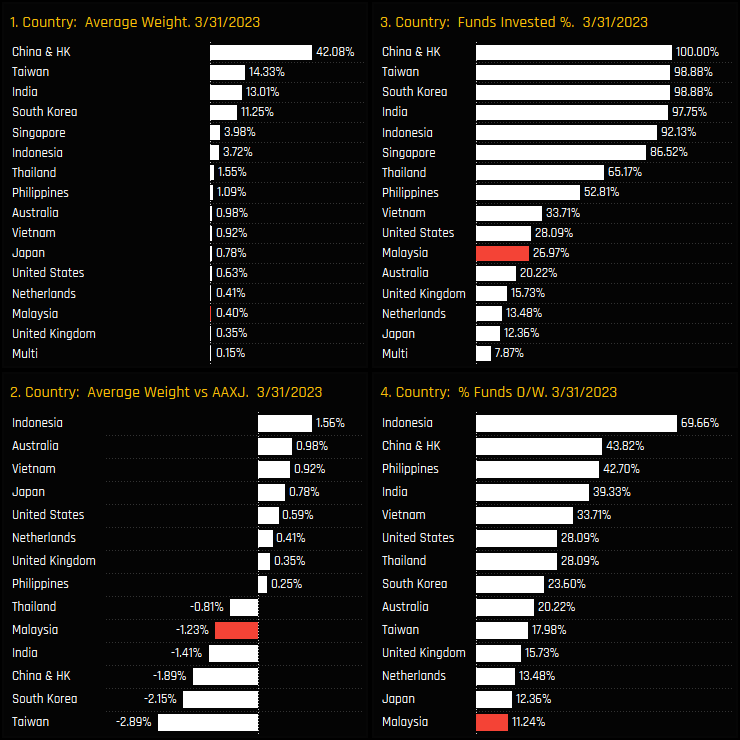
The brief rally in Malaysian allocations among active Asia Ex-Japan funds appears to be faltering. Malaysian fund exposure bottomed out in late 2021 as seen in charts 1 and 3 and started to reverse course, but since September of last year allocations have begun to drift lower again. Malaysia remains an unloved country, with just 27% of funds exposed and 11.2% positioned overweight.
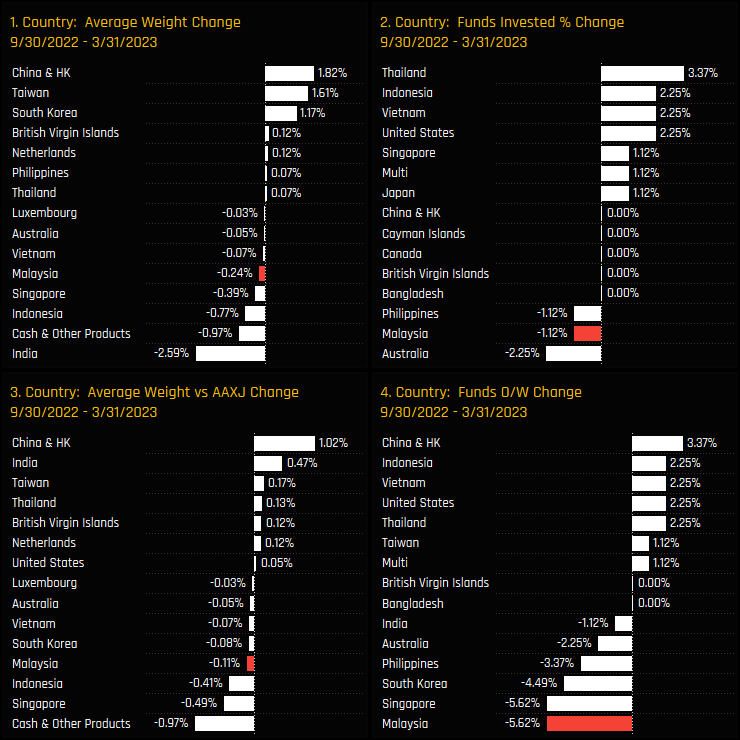
Versus country peers, we can see the renewed outward rotation in Malaysian stocks over the last 6-months. All measures of ownership declined, with -1.1% of funds closing exposure and -5.6% switching from overweight to underweight. Instead, the fellow ASEAN nations of Thailand, Indonesia and Vietnam saw fund allocations grow, whilst fund weights in China & HK, Taiwan and South Korea moved higher.
Fund Holdings and Activity
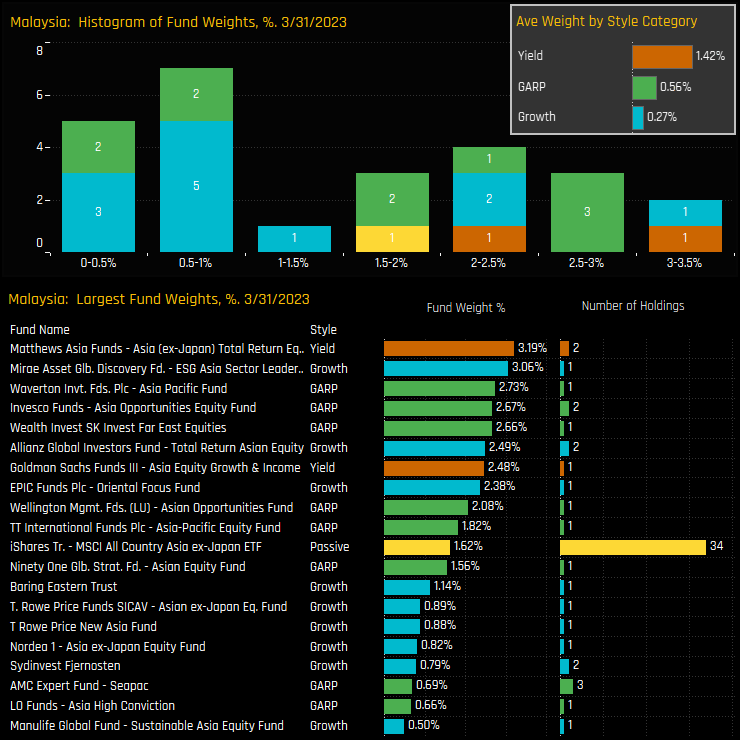
The fund level holdings picture is understandably thin. Of the 27% of funds who hold a position, most hold either 1 or 2 stocks compared to 34 in the benchmark iShares MSCI AC Asia Ex-Japan ETF. The small number of Yield funds in our Asia analysis are well allocated, with Matthews Asia Total Return the largest holder on 3.19%.
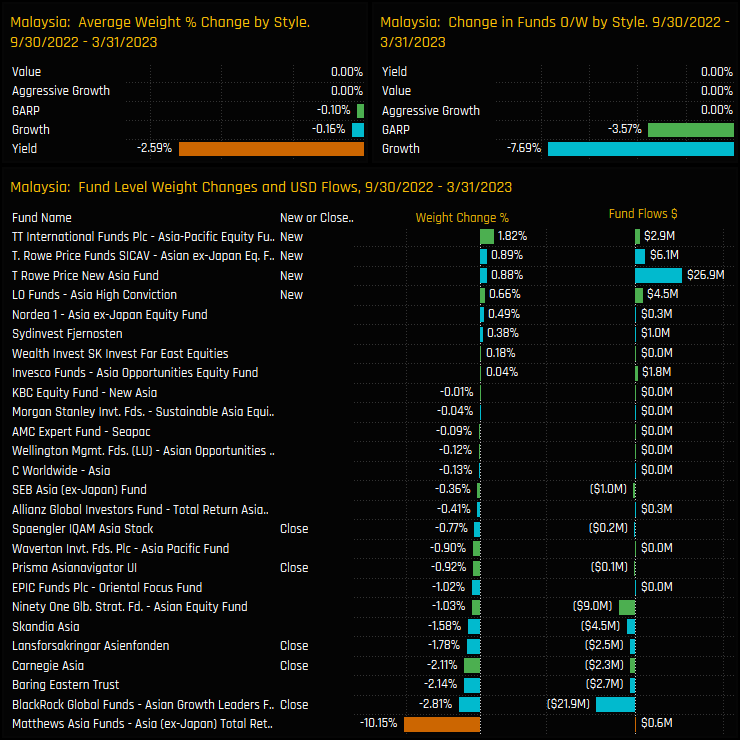
Fund activity over the last 6-months has seen some 2-way activity, but ultimately skewed to the sell side. TT International, T-Rowe Price and LO Funds opened exposure over the last 6-months, whilst BlackRock, Carnegie, Prisma and Spaengler were among the funds that closed out their Malaysian positions.
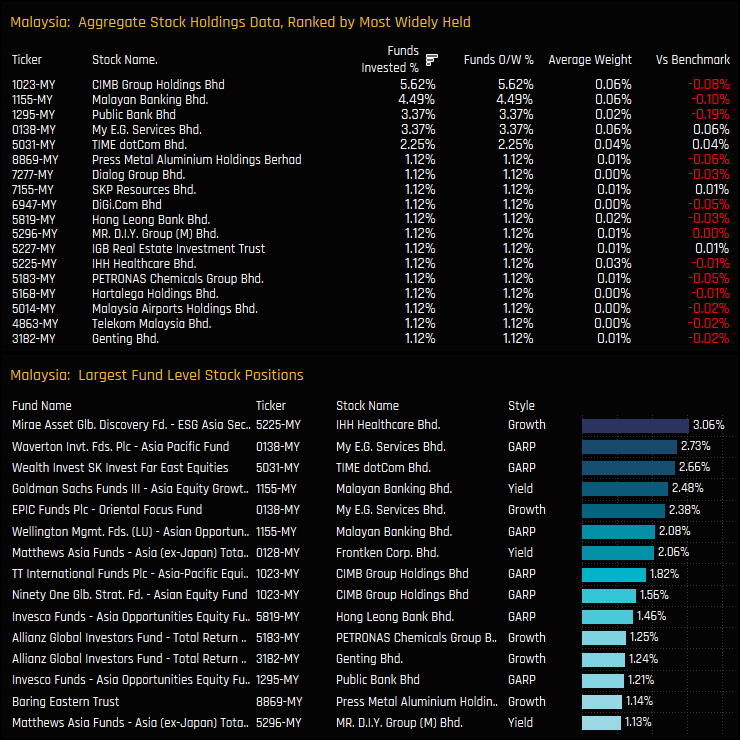
Stock Holdings & Activity
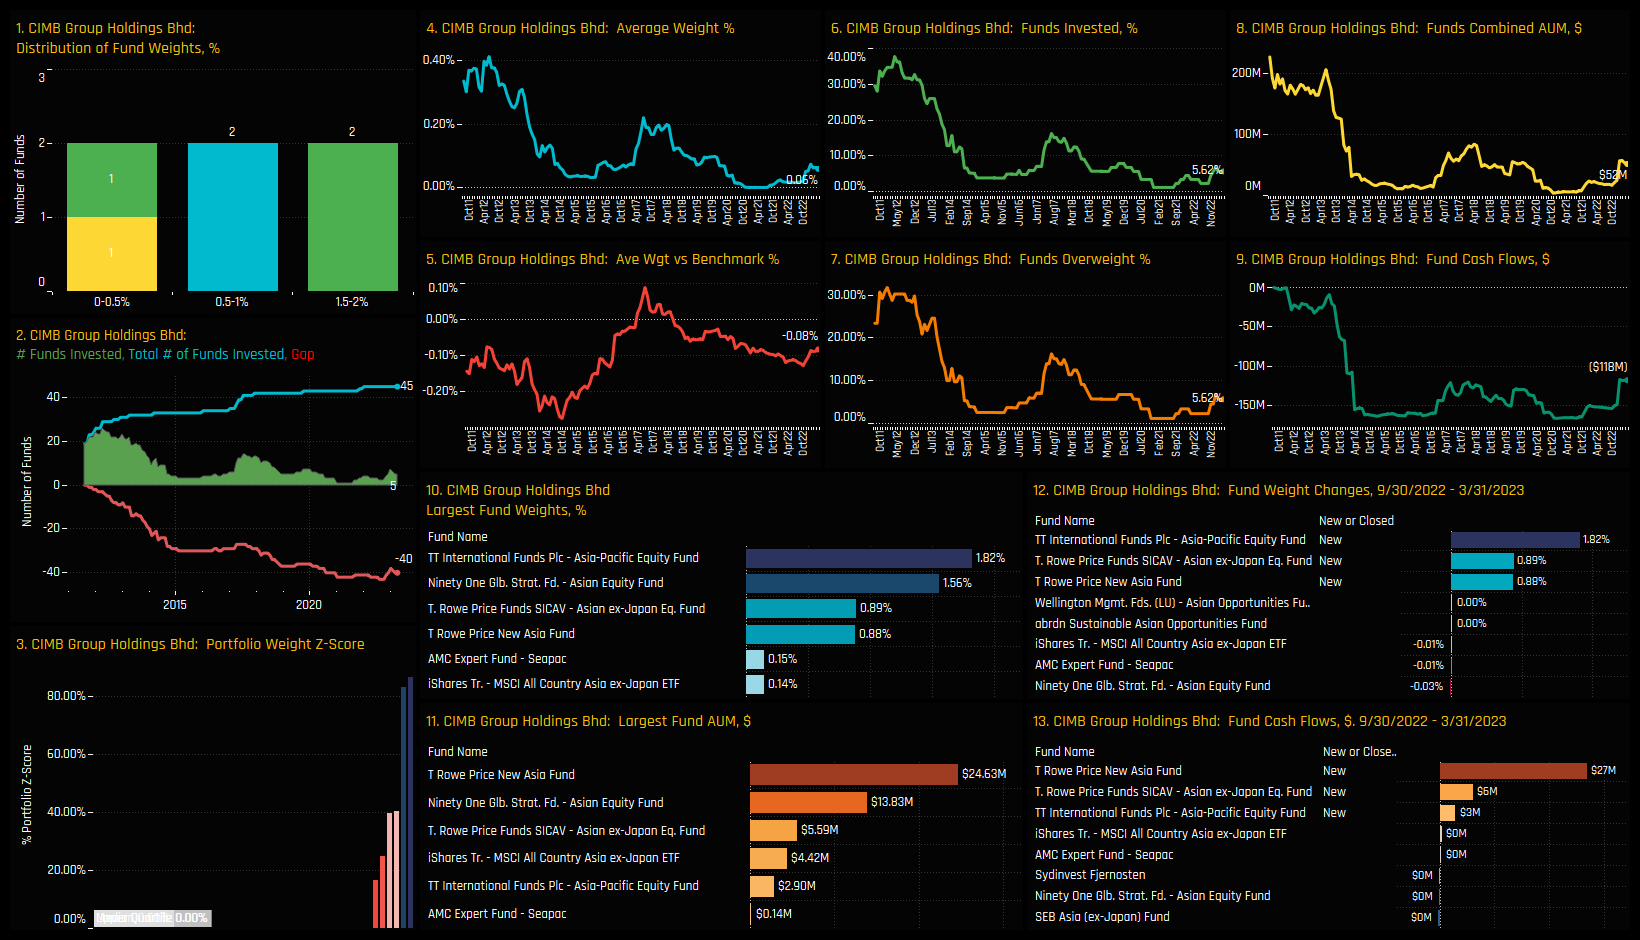
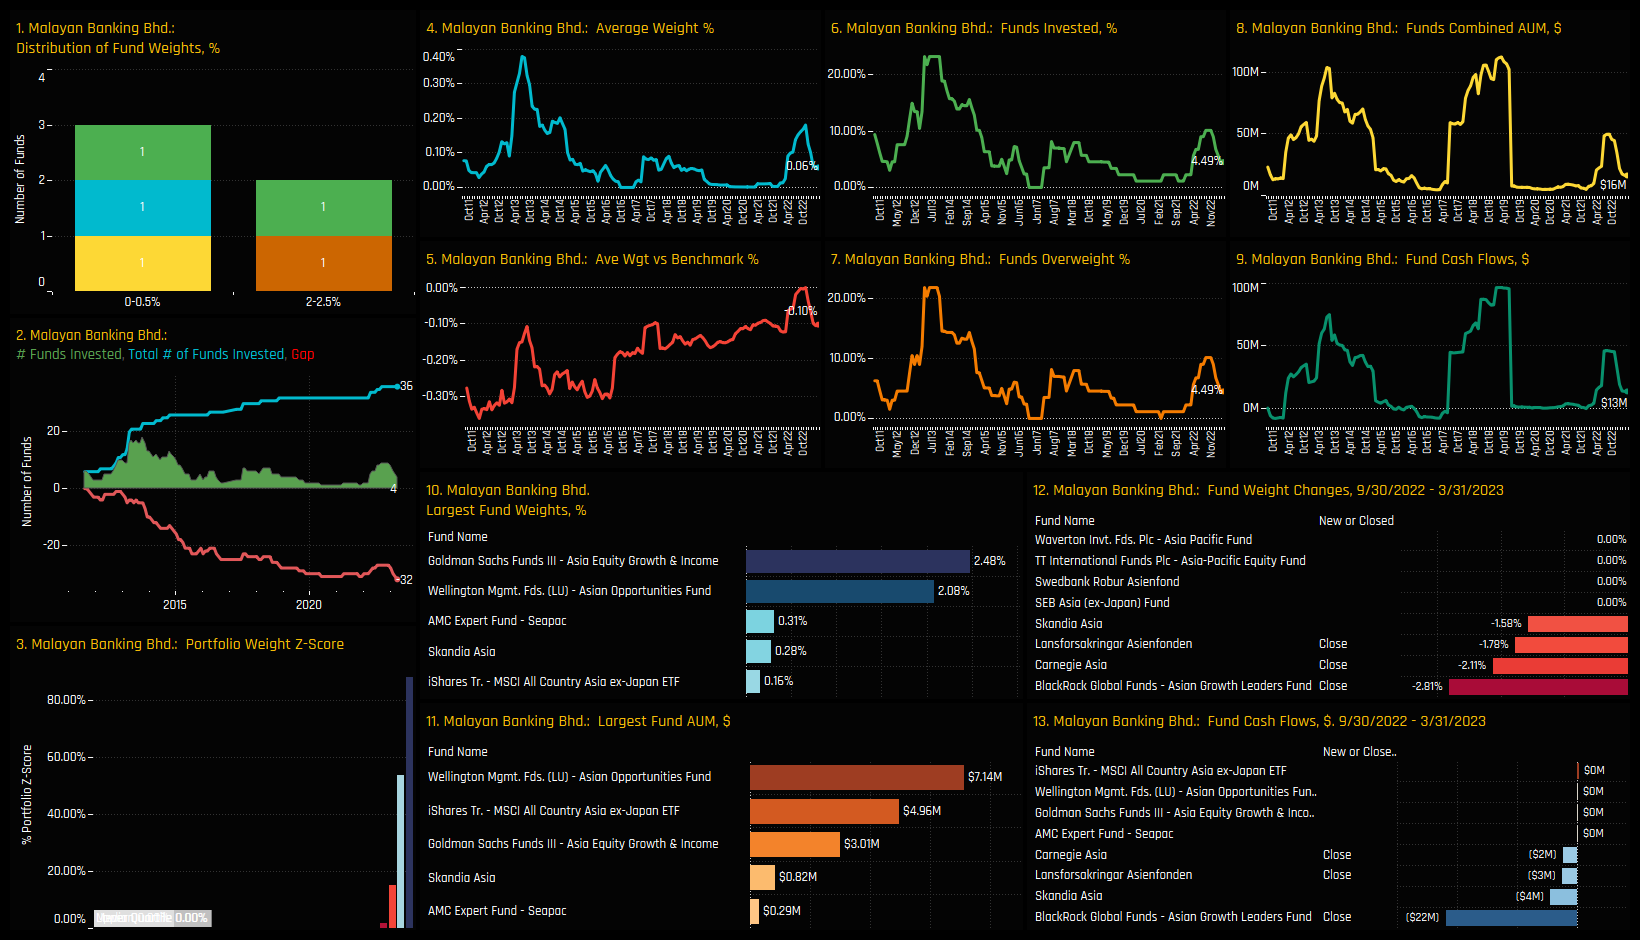
On a stock level, the preferred holdings are CIMB Group Holdings and Malayan Banking, though these are only owned by 5.6% and 4.5% of funds respectively. The majority of the Malaysian stocks are held by no more than 1 active fund and at net underweights compared to the benchmark index. Individual fund holdings top out at 3.06% for Mirae ESG Asia in IHH Healthcare.
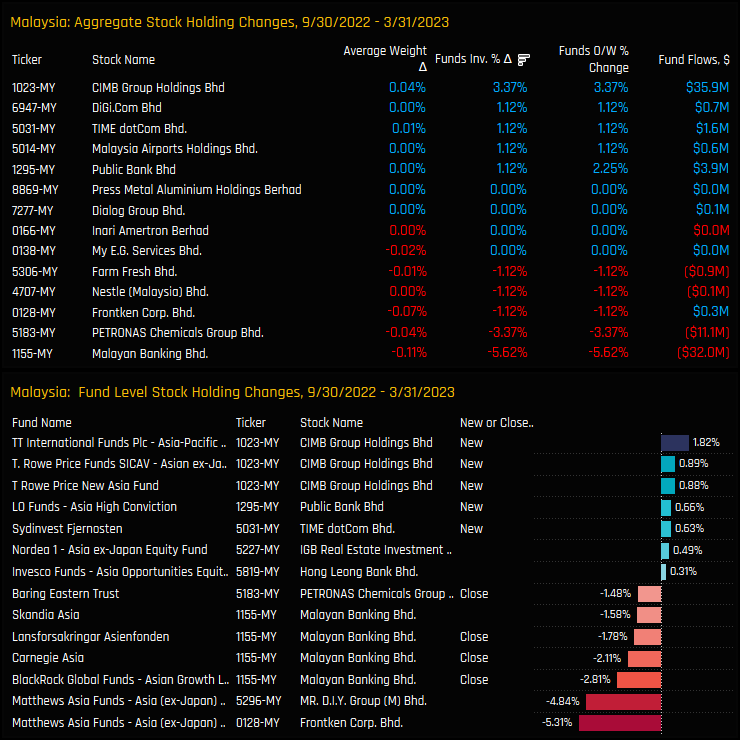
Stock level activity between 09/30/2022 and 03/31/2023 reflects the overall reduction in Malaysian exposure with -5.6% of funds closing their Malayan Banking exposure and -3.4% closing Petronas Chemicals positions. It wasn’t all negative though, with +3.4% of funds opening exposure to CIMB Group Holdings, led by TT International Asia Pacific (+1.82%) and T Rowe Price Asia Ex-Japan (+0.89%).
Conclusion and Links
The stalled recovery in Asia Ex-Japan fund exposure has pushed Malaysia further down the pecking order of country allocations. Malaysia is now the 14th largest country allocation on an average weight basis and the 11th most widely held. With only 27% of managers holding Malaysian exposure, this should provide some comfort to those choosing not to invest, but also give confidence to the contrarians out there who are holding a position.
Those avoiding Malaysia are really only at risk from the benchmark, with the iShares MSCI Asia Ex-Japan ETF allocating 1.23% to Malaysia across a wide spectrum of companies. The fact that 89% of active managers are comfortable running this underweight and 73% hold no exposure at all, infers that there are more compelling opportunities across the ASEAN region and Asia Ex-Japan right now.
For more data and analysis on positioning in Malaysia among active Asia Ex-Japan investors, please click on the link below. Scroll down for profiles on CIMB Group and Malayan Bank.
Asia Ex-Japan investors have all but closed out of their Taiwan Banks positions.
Time-Series Analysis & Peer Group Positioning
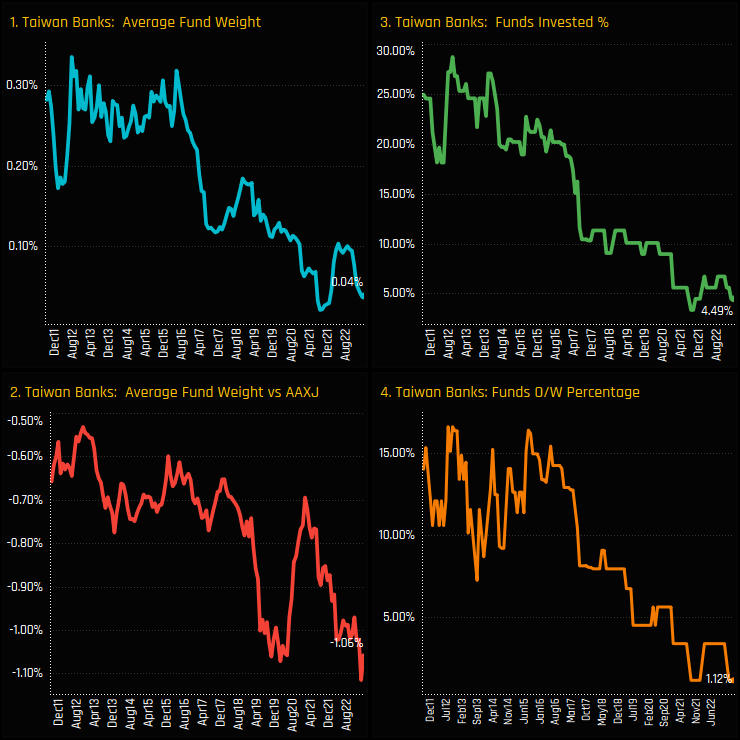
Exposure to the Taiwanese Banks sector has almost drifted to zero among active Asia Ex-Japan investors. The percentage of funds invested has fallen from over 25% to just 4.5% over the last decade, with average weights near all-time lows of 0.04%. This collapse in positioning has pushed net underweights to -1.06%, near the lowest on record, with a mere 1.1% of funds positioned overweight.
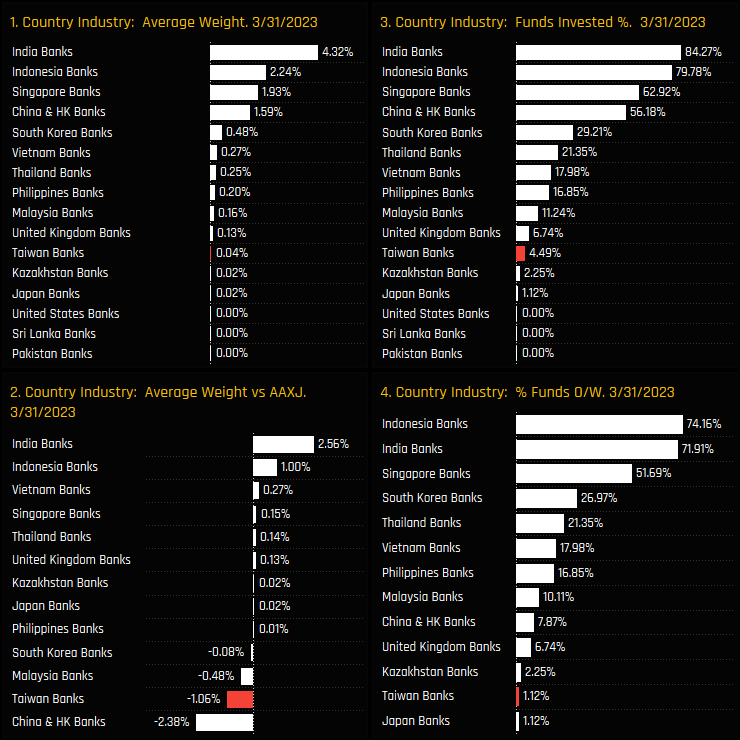
Taiwan Banks now stand as something of a rounding error among Banking peers, with Indian, Indonesian and Singaporean Banks the favoured exposures among Asia Ex-Japan active managers. Whilst exposure drifts to zero among active investors, passive funds are better allocated. In fact, this lack of exposure places Taiwan Banks as the 2nd largest Bank underweight after China & HK when compared to the iShares MSCI Asia Ex-Japan ETF.
Fund Holdings & Stock Exposure
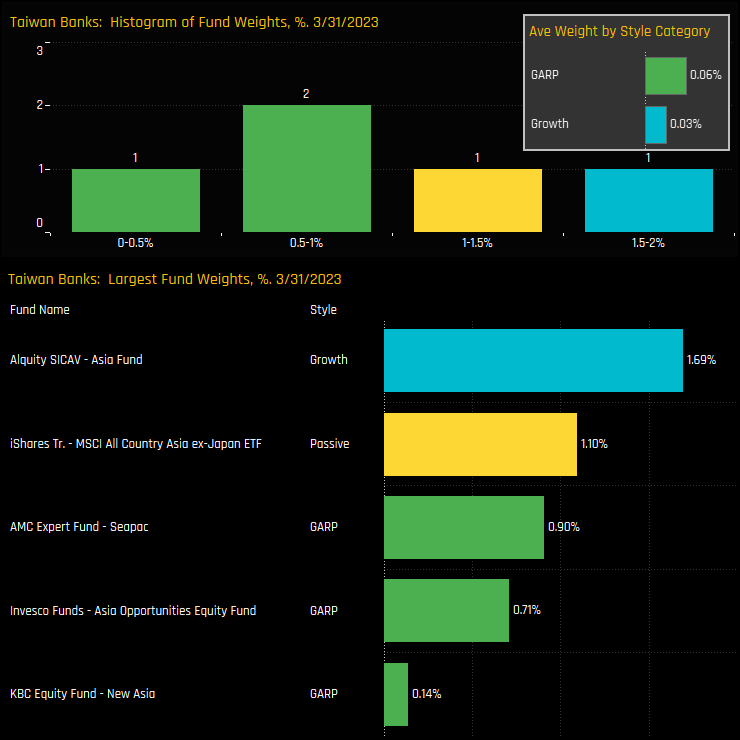
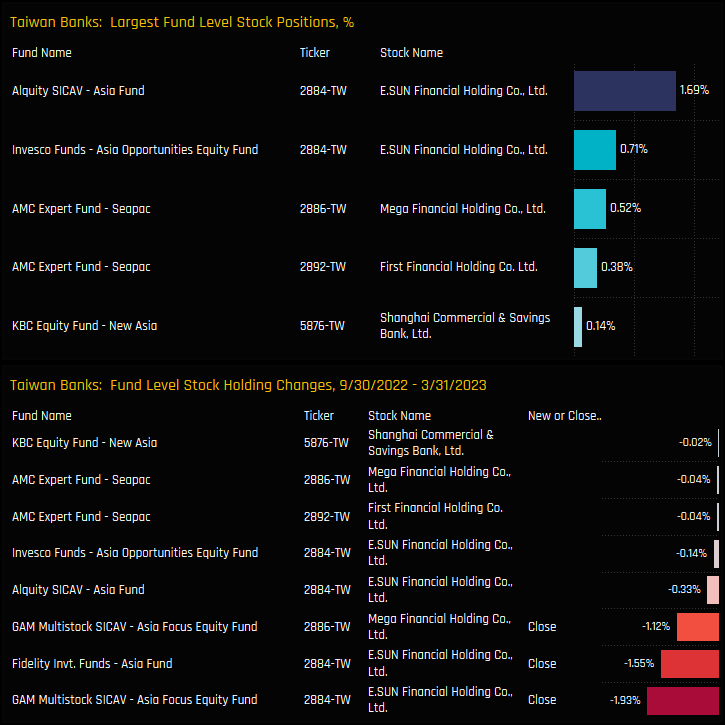
Such is the void of ownership in Taiwanese Banks that our fund holding charts are almost irrelevant. The fact is, only 4 funds in our analysis hold any exposure at all outside of the iShares Asia Ex-Japan ETF, with Alquity Asia Fund the only strategy to out-position the benchmark.
Similarly, aggregating stock ownership doesn’t really make any sense. Here are the entire set of Taiwan Bank positions across the 89 funds in our analysis. E.SUN Financials is held by 2 funds, the rest by just 1. Activity over the last 6-months saw Fidelity and GAM close positions in E.SUN Financial and Mega Financial Holding Co.
Conclusions & Links
With holdings almost non-existent, there’s a limit to the analysis we can actually do on Taiwan Banks. It seems that active Asia Ex-Japan managers are very comfortable avoiding the sector completely, despite the Asia Ex-Japan benchmark being fairly well allocated with a 1.1% weight.
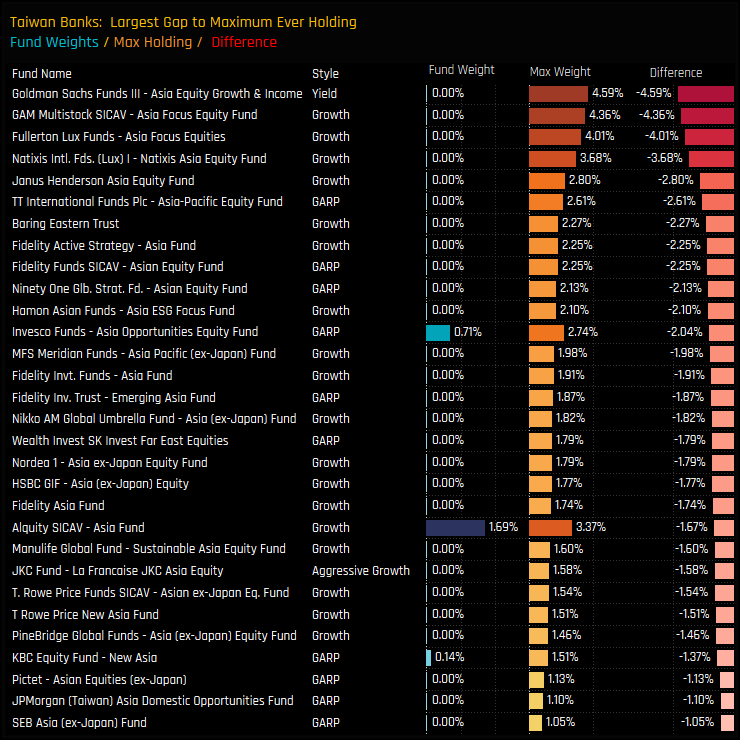
The one thing we can say is that ‘it wasn’t always this way’. The chart to the right shows a list of the funds with the largest gap to their maximum holding weights in the Taiwan Banking sector. Whilst it has never been a marquee holding among active managers, the list shows that top funds from across the region have had exposure in the past.
At the moment, it would seem that Taiwan Banks are simply un-investible to active managers in the Asia Ex-Japan region. For exposure to be this non-existent shows a level of consensus rarely seen in a sector that represents such a weight in the benchmark index. With that in mind, it might make sense for investors to consider potential catalysts that could improve the investment picture for Banks in Taiwan. There will be a clear first mover advantage for those that do.
Please click on the link below for an extended data report on Taiwan Banks
A new report that breaks down individual holding weights, AUM and activity across regions, countries and sectors.
Time-Series & Sector Positioning
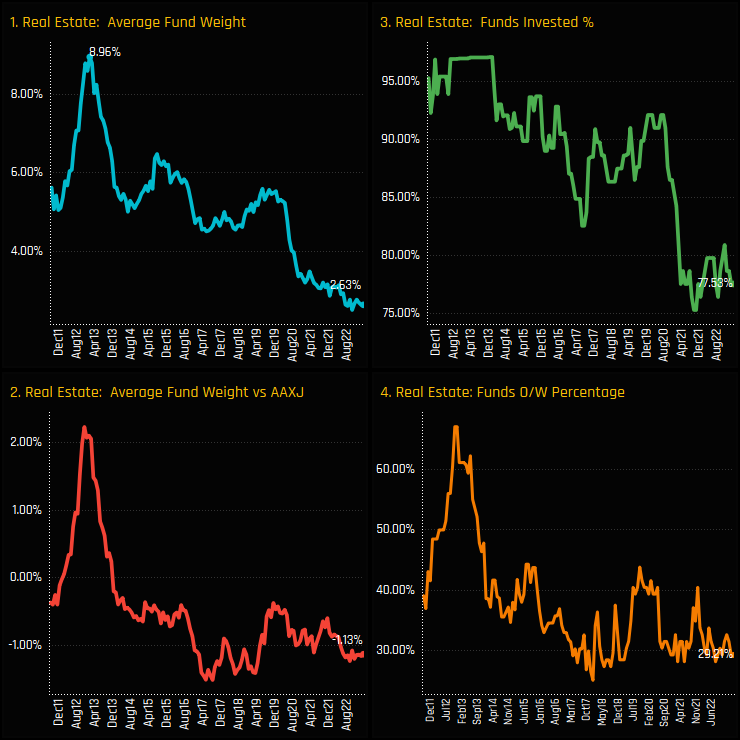
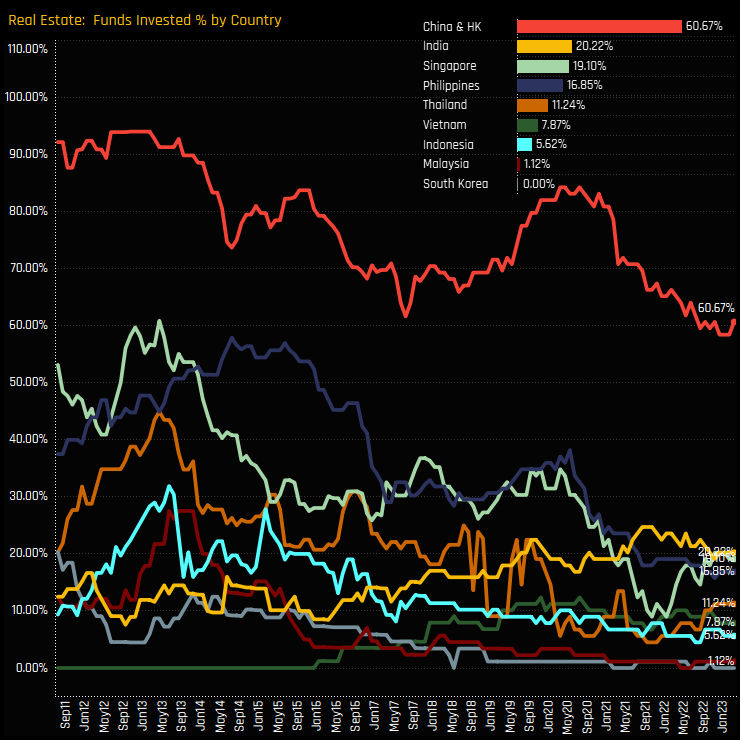
Fund exposure in the Real Estate sector is hovering around the lows. Average weights of just 2.6% mark the culmination of a 10-year decline in portfolio weights from the highs of 8.96% in early 2013 (ch1). The sector has gone from near full ownership a decade ago to just 77.5% of funds today, with the big drop occurring through the latter part of 2020 (ch3). Active funds have been running a net underweight in Real Estate for the best part of the last decade (ch2), with today’s 29.2% of funds overweight near the lowest on record (ch4).
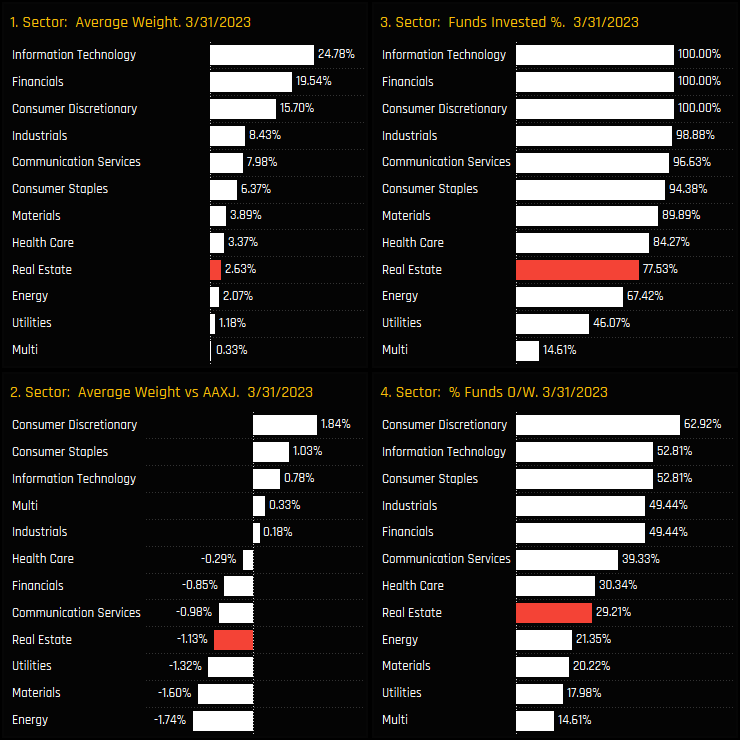
Real Estate now stands as the 3rd lowest sector holding among managers, beating both Energy and Utilities on both an average weight and funds invested basis (ch1&3). Despite these low levels of exposure, current positioning in Real Estate is not without risks, with active managers running a net underweight of -1.15% compared to the iShares AC Asia Ex-Japan ETF, the 4th largest country underweight after Energy, Materials and Utilities.
Fund Holdings & Activity
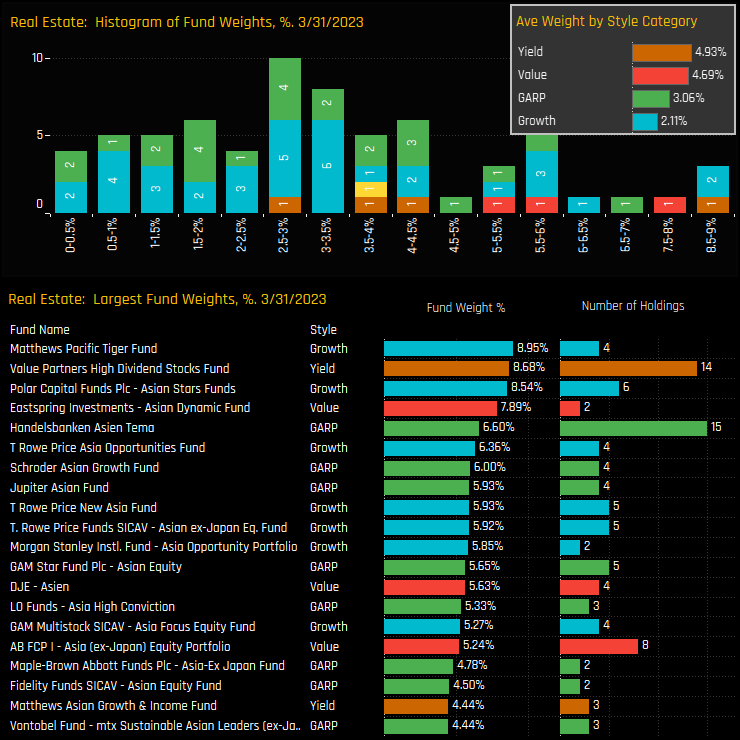
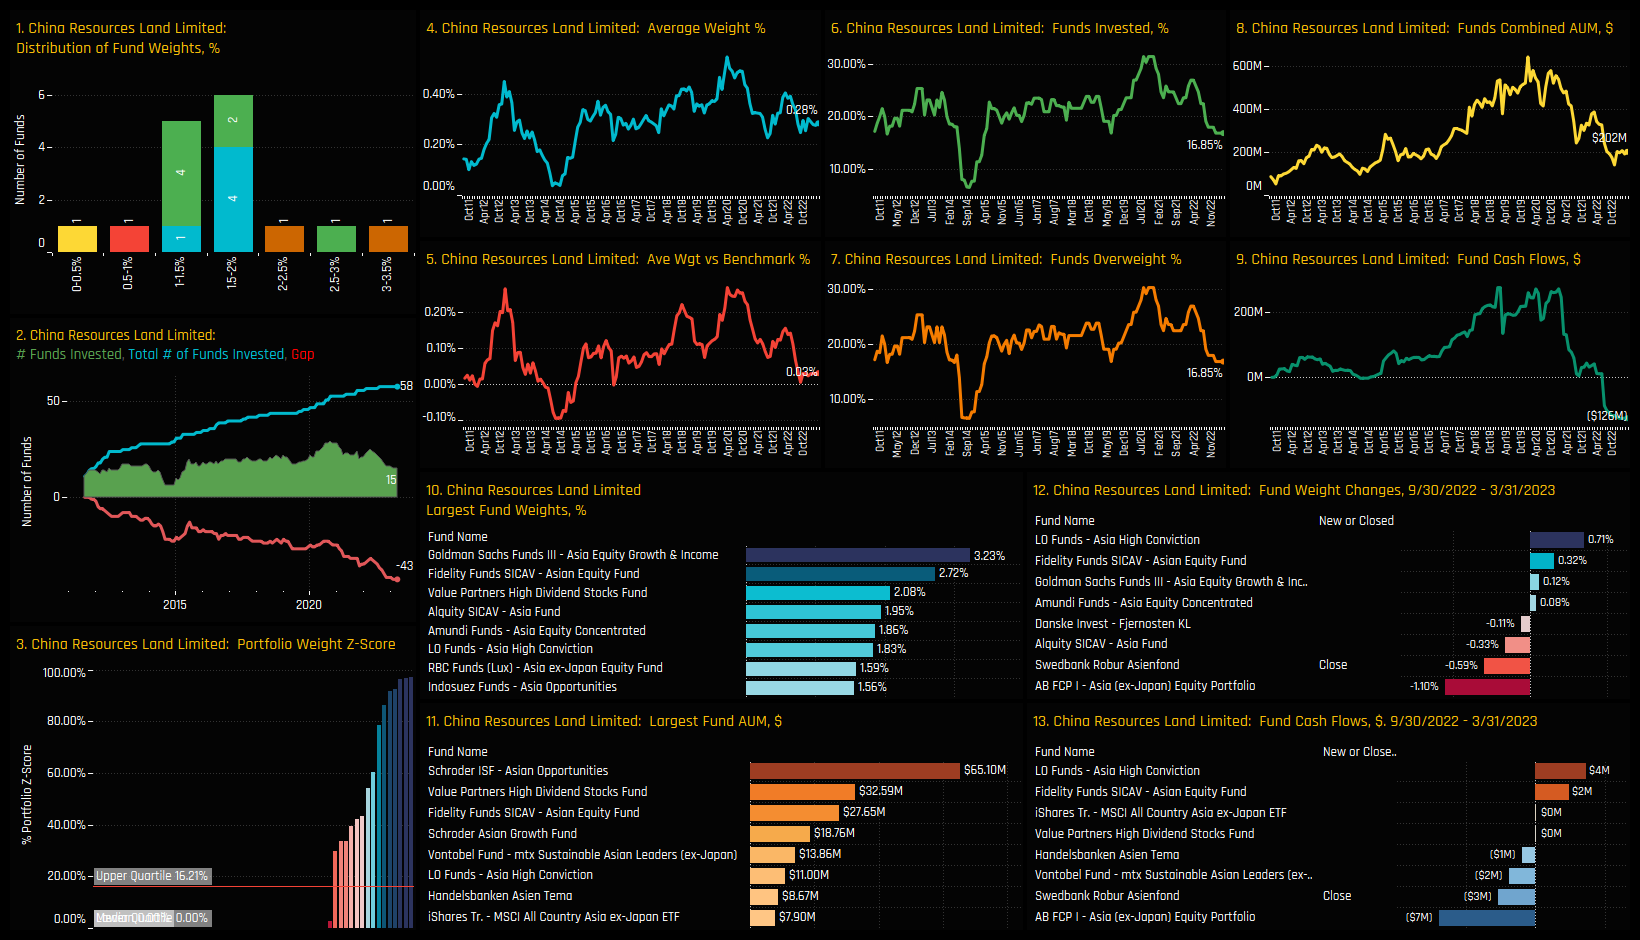
The distribution of fund holdings in the Real Estate sector is shown in the top chart below, and highlights a majority of funds holding less than a 4.5% allocation. The long tail to the upside concludes at 8.95% with the Matthews Pacific Tiger Fund. Allocations are correlated to Style, with Value and Yield managers more heavily allocated than their Growth peers.
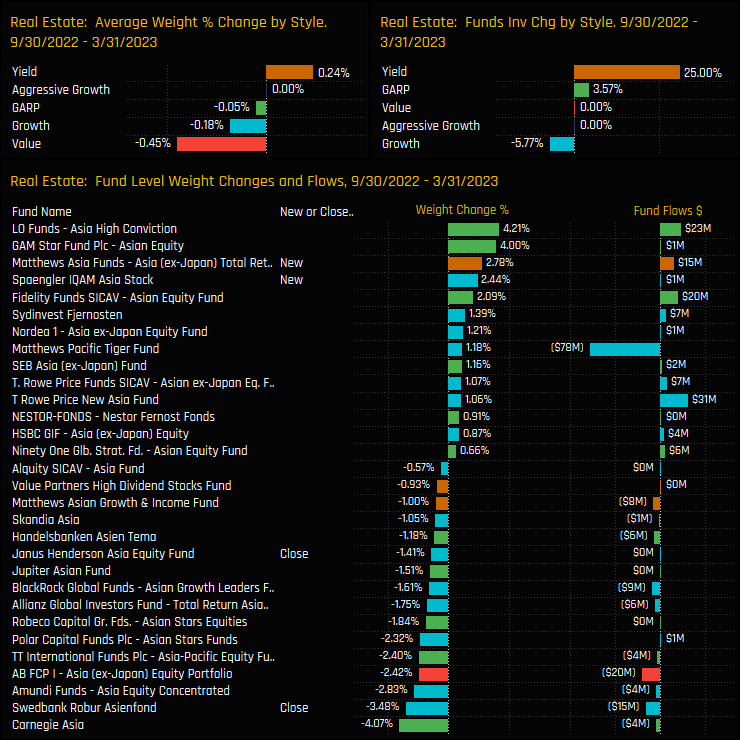
Activity on a fund level between 09/30/2022 and 03/31/2023 was reasonably well balanced. Closures from Swedbank Robur (-3.5%) and Janus Henderson (-1.4%) were offset by openings from Matthews Asia Total Return (+2.8%) and Spaengler IQAM Asia Stock (+2.4%).
Stock Holdings & Activity
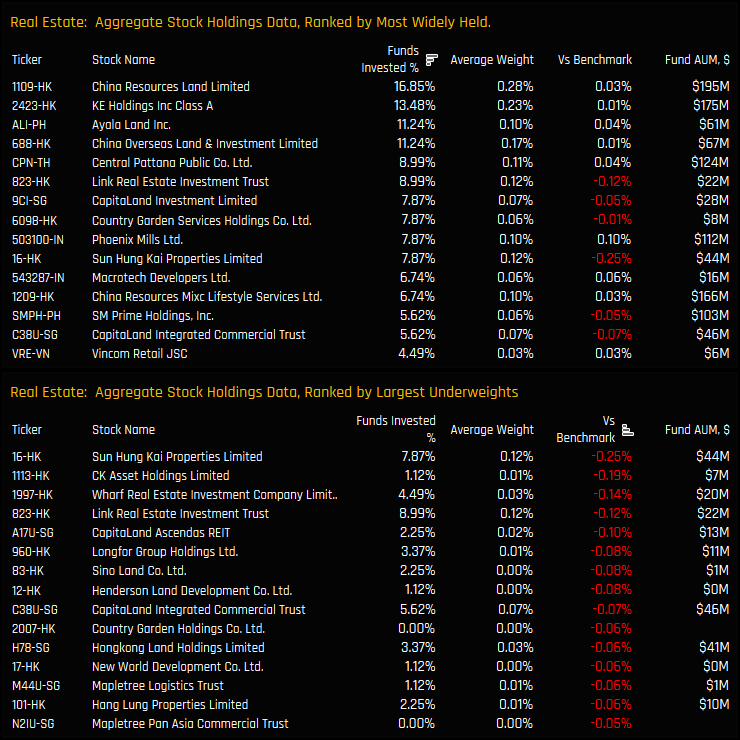
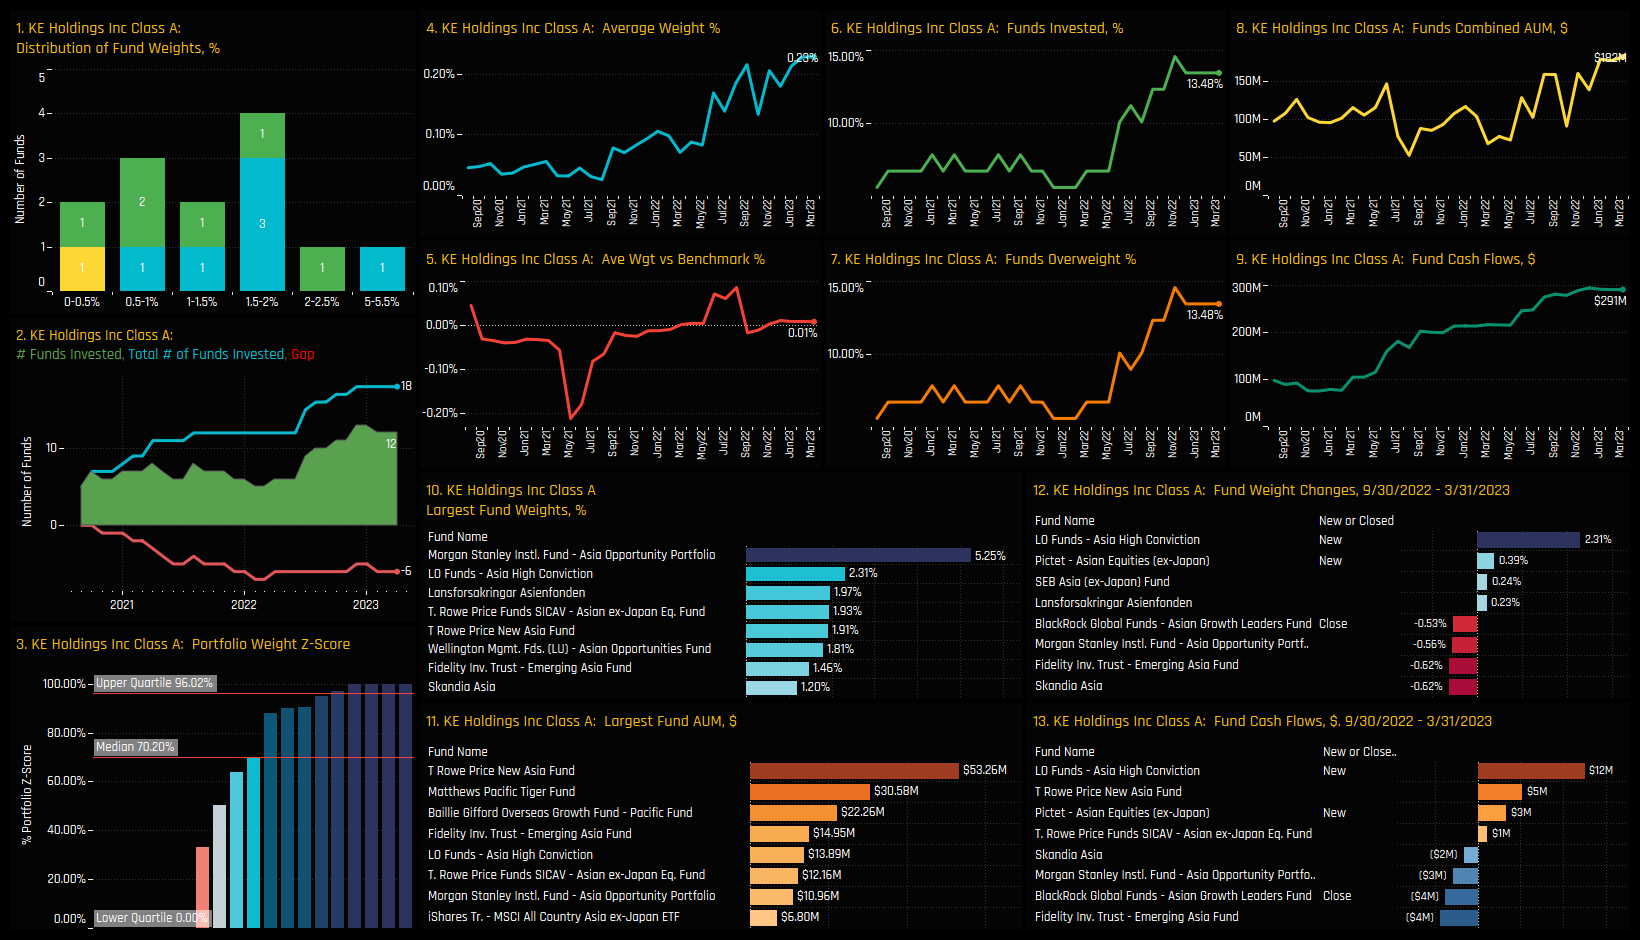
Aggregate stock holdings are headed by China Resources Land and KE Holdings, which are owned by 16.9% and 13.5% of the funds in our analysis respectively. The companies driving the net underweight in the bottom chart are led by Sun Hung Kai Properties and the almost universally avoided CK Asset Holdings Limited.
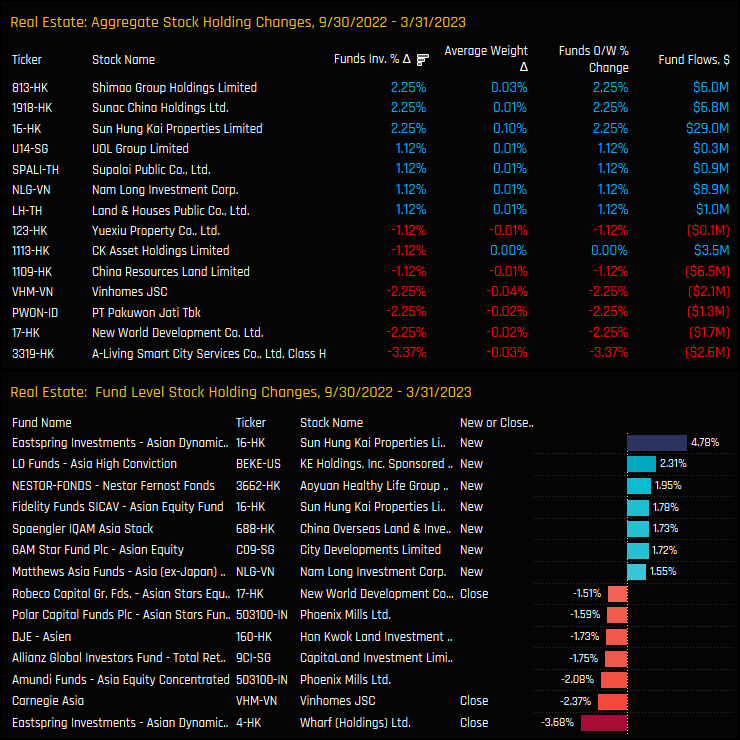
Stock activity over the last 6-months has been well balanced with a marginal skew to the sell-side. Net opening positions in Shimao Group Holdings and Sunac China Holdings were offset by net closures in A-Living Smart City Services and New World Development. Eastspring’s new +4.78% position in Sun Hung Kai Properties is the stand out.
Conclusion & Links
The chart to the right helps identify the country drivers behind the long-term decline in Real Estate exposure. It shows the percentage of funds invested in each country in the Real Estate sector since 2011. China & HK Real Estate is the most widely held country group, but also one that has witnessed a steady decline over the last decade. This trend is mirrored across The Philippines, Singapore, Indonesia, and Thailand. India appears a little more stable and has risen to the 2nd most widely held country group in the sector, but is still only owned by 20.2% of managers.
It’s perhaps best to classify the current ownership picture as one of consolidation. The severe declines that occurred through 2020 have stalled, and fund activity seems more balanced, albeit without a positive skew that suggest a resurgence to form.
For a more detailed look at Asia Ex-Japan fund positioning in the Real Estate sector, click on the link below. Scroll down for stock profiles on China Resources Land and KE Holdings
For more analysis, data or information on active investor positioning in your market, please get in touch with me on steven.holden@copleyfundresearch.com
Investor Positioning Report — Copley Fund Research Ltd · Last updated: July 2026 · Registered in England and Wales
1. Who we are
Copley Fund Research Ltd provides proprietary institutional fund intelligence to listed companies and investor relations professionals. These terms govern every purchase of an Investor Positioning Report. By completing a purchase you confirm you have read, understood, and agreed to these terms in full.
2. What you are purchasing
The Investor Positioning Report is a bespoke PDF report mapping the institutional fund universe around your stock. It covers current investors, past investors, competitor investors, and white space investors. Every report is built from scratch for the specific company ordered and is not a standardised or templated product.
3. Delivery and process
Following payment or invoice issuance, Copley Fund Research will contact you within one working day to agree your competitor set. Production begins once the competitor set is confirmed in writing. The completed report will be released to you within 48 hours of production starting, provided payment has been received in full; where payment is outstanding, the report will be withheld until payment clears. If the requested company falls outside our covered fund universes, or a competitor set cannot be agreed, Copley Fund Research will issue a full refund or cancel the outstanding invoice.
4. Competitor set agreement
The competitor set is agreed with you in writing prior to production, and the report is built to that agreed specification. Requests to amend the competitor set after delivery, based on a change of preference rather than an error, may be treated as a new order.
5. Refund policy
Because each report is produced individually for your company, orders are non-refundable once production has begun, except as set out in clauses 3 and 5a below. By purchasing, you agree not to dispute the charge with your card provider on the basis that the service was not as described, provided the report has been delivered to the agreed specification or corrected under clause 5a.
5a. Quality remedy
If a delivered report contains a material error caused by Copley Fund Research — for example, an incorrect company analysed, a competitor omitted from the agreed set, or content missing from the specification in clause 2 — Copley Fund Research will correct and redeliver the report at no additional charge, within a reasonable timeframe. This is your sole remedy for such errors.
6. Data and accuracy
All fund positioning data in the report reflects holdings as disclosed at the most recently available reporting date at the time of compilation. The timing of fund holdings disclosures is determined by regulatory requirements applicable to each fund and is outside the control of Copley Fund Research Ltd. This data may not reflect current fund positions. Copley Fund Research takes reasonable care to ensure accuracy but makes no warranty, express or implied, as to the completeness or current accuracy of the underlying data — though this does not affect the quality remedy in clause 5a for errors in how that data was analysed or presented. Past fund positioning is not indicative of future fund behaviour or investment decisions.
7. Not investment advice
The Investor Positioning Report is produced for investor relations intelligence purposes only. It does not constitute investment advice, financial advice, or a recommendation to buy, hold, or sell any security. The data reflects historical fund positioning and must not be relied upon as a prediction of future fund behaviour or investment decisions. Copley Fund Research Ltd is not authorised or regulated by the Financial Conduct Authority for the provision of investment advice.
8. Permitted use and confidentiality
The report is licensed for internal use by the purchasing organisation only. You may share it with employees and directors of your organisation. You may not: reproduce, redistribute, publish, or resell the report or any part of it; share it with any third party outside your organisation without prior written consent; use the fund or portfolio manager names contained in the report to approach those individuals on behalf of Copley Fund Research or in a manner that could damage Copley Fund Research's relationships with those funds; or use the data for any purpose other than your own investor relations strategy. The data, analysis, and methodology contained in the report are the intellectual property of Copley


