In this issue:
Q1 Performance & Attribution
Aerospace & Defense: Long-Term Decline
Personnel Services: Fund Ownership Highs
Oxford Instruments: Spike in Exposure
270 UK Equity Funds, AUM $179bn
Q1 Performance & Attribution
A look at Q1 performance and the drivers of performance among active UK Equity Funds
Performance
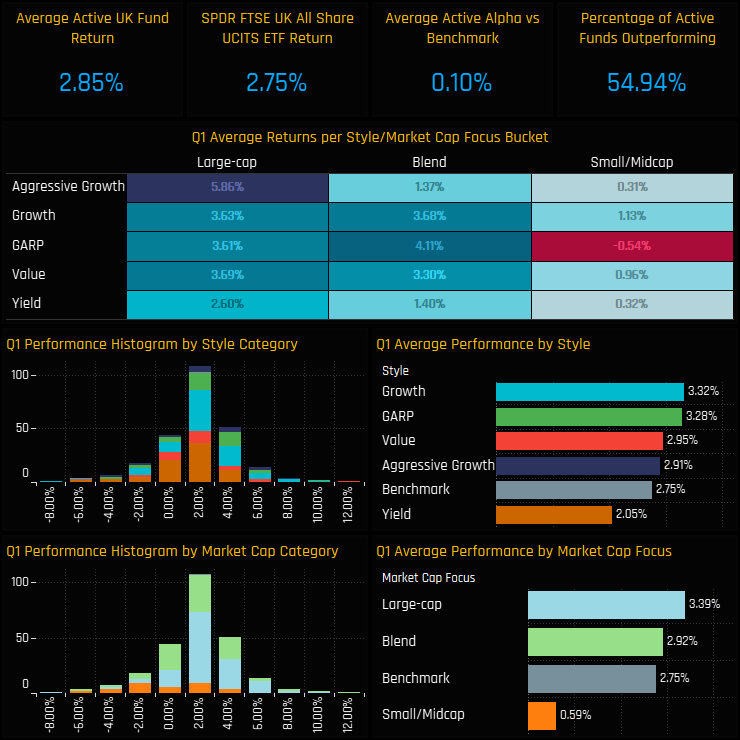
Active UK managers have had a decent start to 2023. Average returns of 2.85% outpaced the SPDR FTSE UK All Share ETF return of 2.75%, with 54.9% of funds outperforming. Performance was correlated to market cap focus, with Large-cap funds outperforming Small-cap by +2.8% on the quarter and the combination of Large-cap/Aggressive Growth the pinnacle at 5.86%.
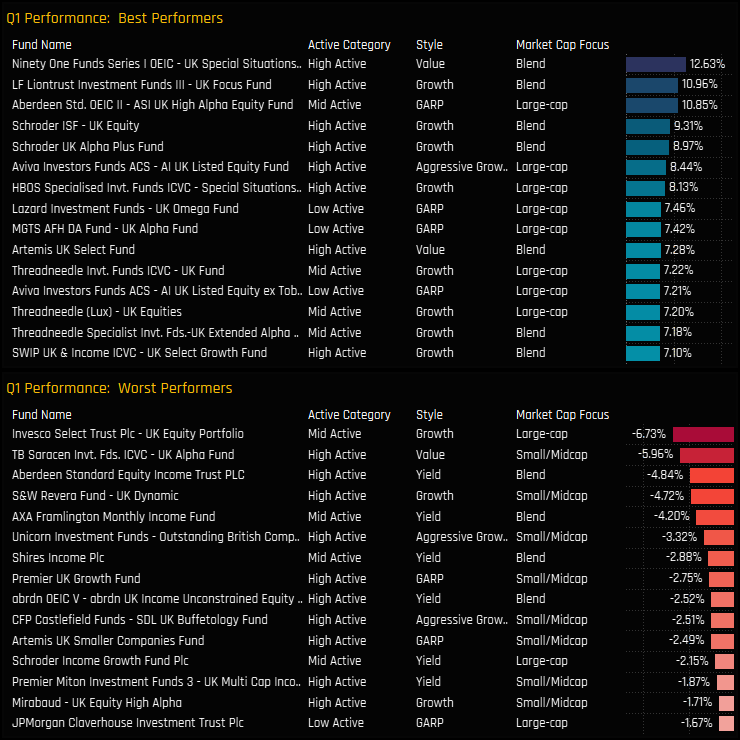
The range of returns was mainly contained between -2% and +6% on the quarter, but there were a small number of funds who fell either side of that. The outperformers were led by the Ninety One UK Special Situations fund (+12.63%) and LF Liontrust UK Focus (+10.96%), while Invesco UK Equity (-6.73%) and TB Saracen UK Alpha (-5.96%) brought up the rear.
Performance Contribution & Attribution
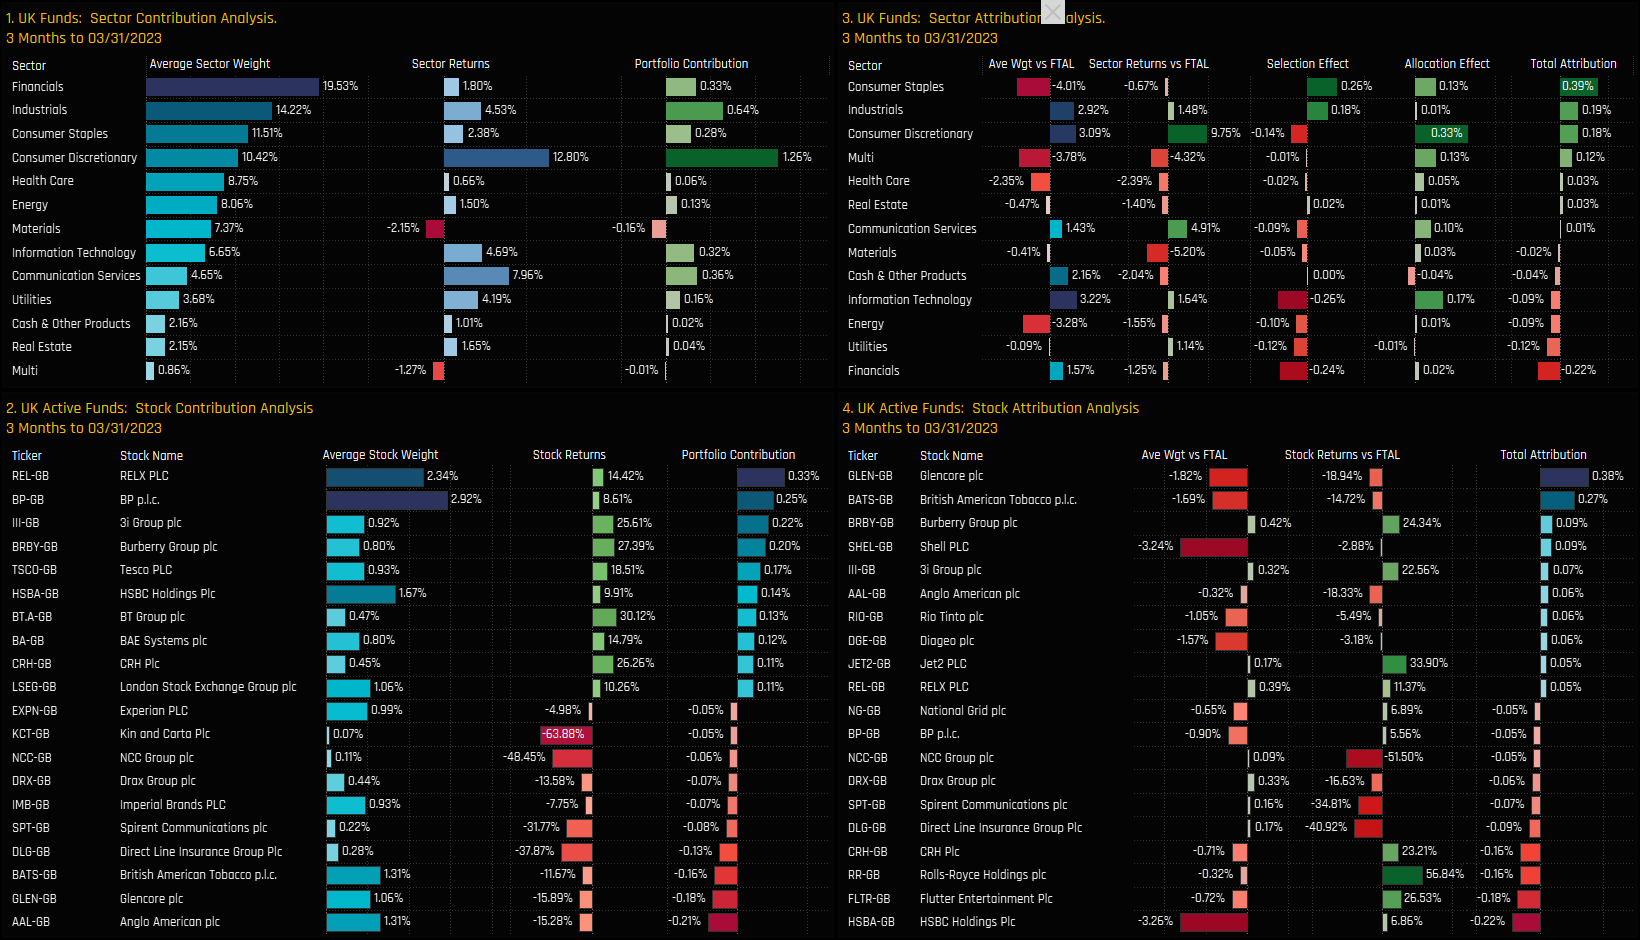
We perform attribution analysis on a portfolio based on the average allocations of the 270 active UK funds in our analysis, versus a representation of the benchmark based on the SPDRs FTSE All Share ETF.
The moderately positive returns among active managers were driven by strong performance in the Consumer Discretionary and Industrials sectors, which contributed +1.26% and +0.64% to Q1 returns respectively. Large weights in RELX and BP contributed the most on a stock level, whilst negative returns from Anglo American and Glencore dragged on quarterly performance.
From an attribution perspective, outperformance was down to underweights in Consumer Staples and overweights in Tech and Consumer Discretionary. Strong stock selection in Consumer Staples and Industrials was offset by poor selection in Financials and Technology. On a stock level, underweights in Glencore, British American Tobacco and Shell PLC performed well, whilst underweights in HSBC, Flutter Entertainment and Rolls Royce were costly to active UK managers on the quarter.
270 UK Equity Funds, AUM $179bn
Aerospace & Defense: Long-Term Decline
UK managers scale back allocations to lowest levels on record.
Time-Series & Industry Activity
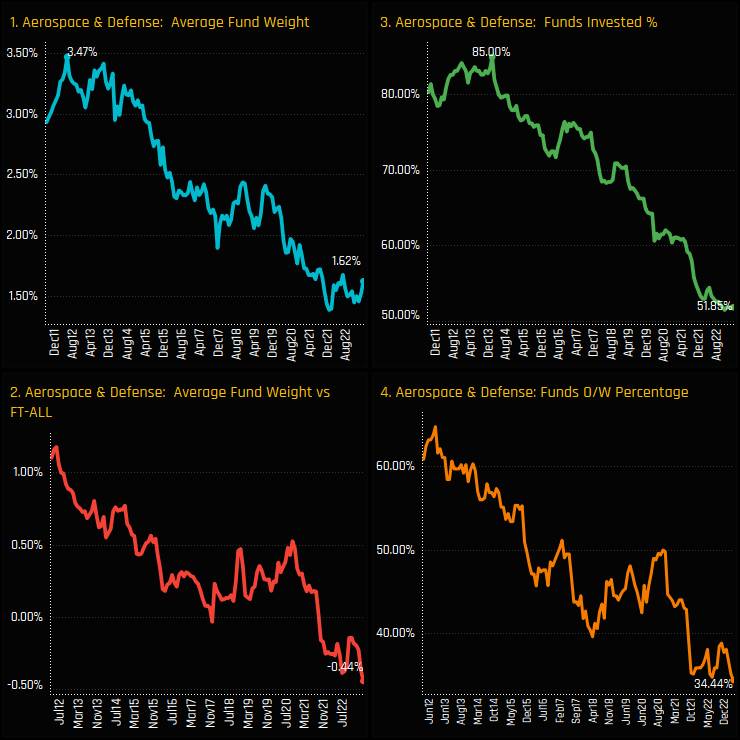
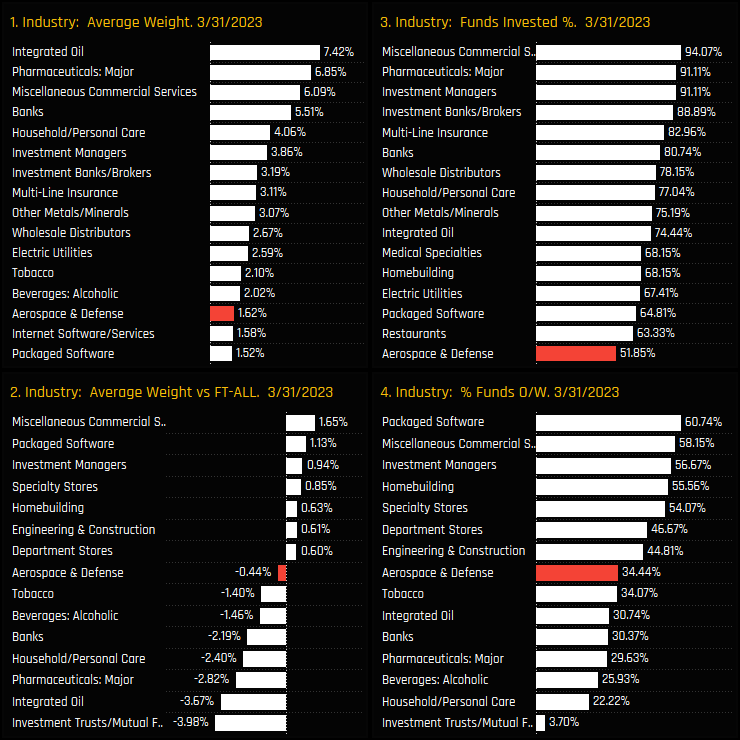
UK fund exposure in the Aerospace & Defense (A&D) industry group has been in near constant decline for the best part of the last decade. The percentage of funds with exposure to A&D stocks has fallen from a high of 85% in 2013 to just 51.8% today, with average weights more than halving over the same period. This has driven active UK funds to their lowest ever underweight of -0.44% compared to the SPDRs FTSE All Share ETF, with nearly two-thirds of the UK funds in our analysis positioned underweight the benchmark.
This long-term decline in ownership has moved A&D well down the pecking order of UK industry exposures. It is the 14th largest exposure on an average weight basis and the 27th most widely held, a reflection of the diminishing confidence that UK investors have in A&D to drive returns. Aerospace & Defense is a now minor underweight compared to the SPDRs FTSE All Share ETF, but not big enough to really concern the average active UK equity fund.
Fund Holdings & Activity
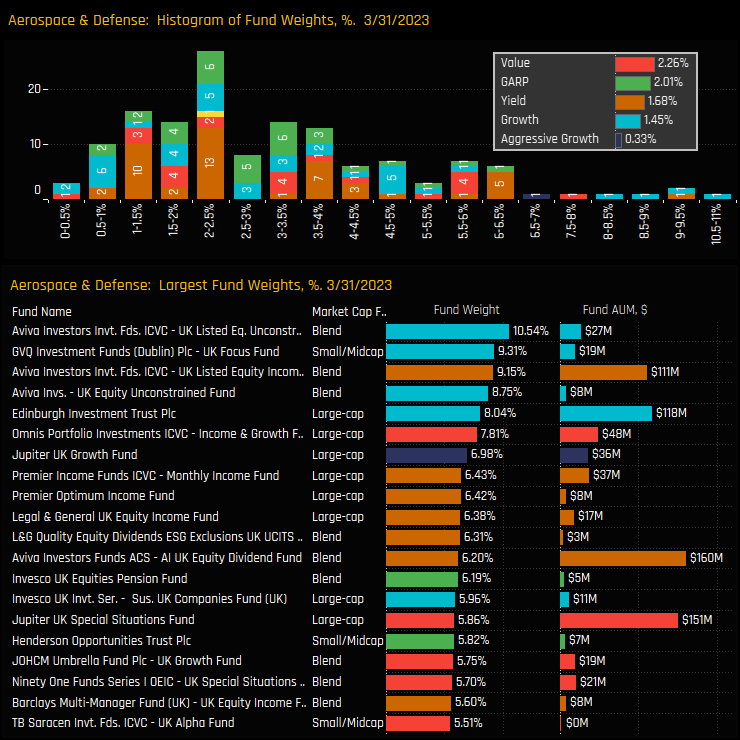
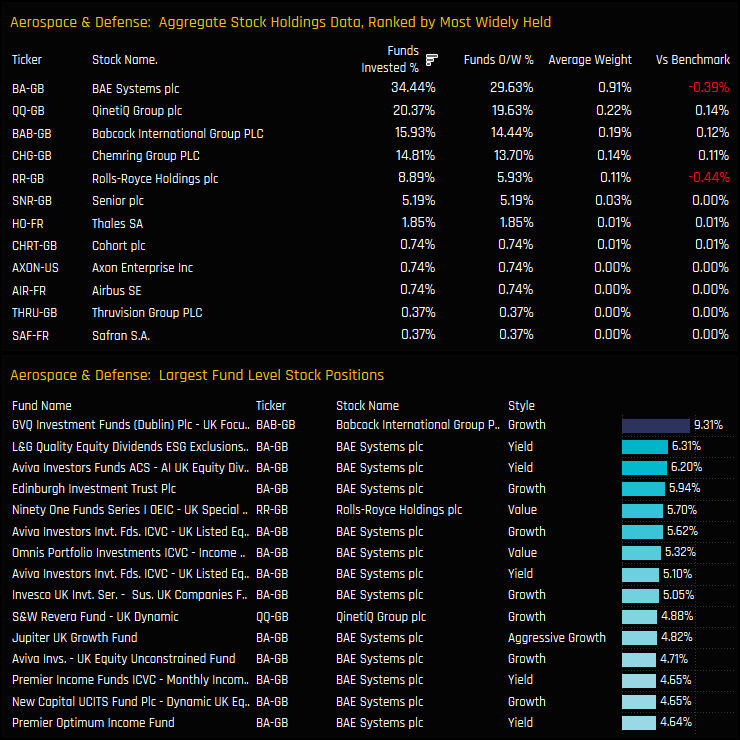
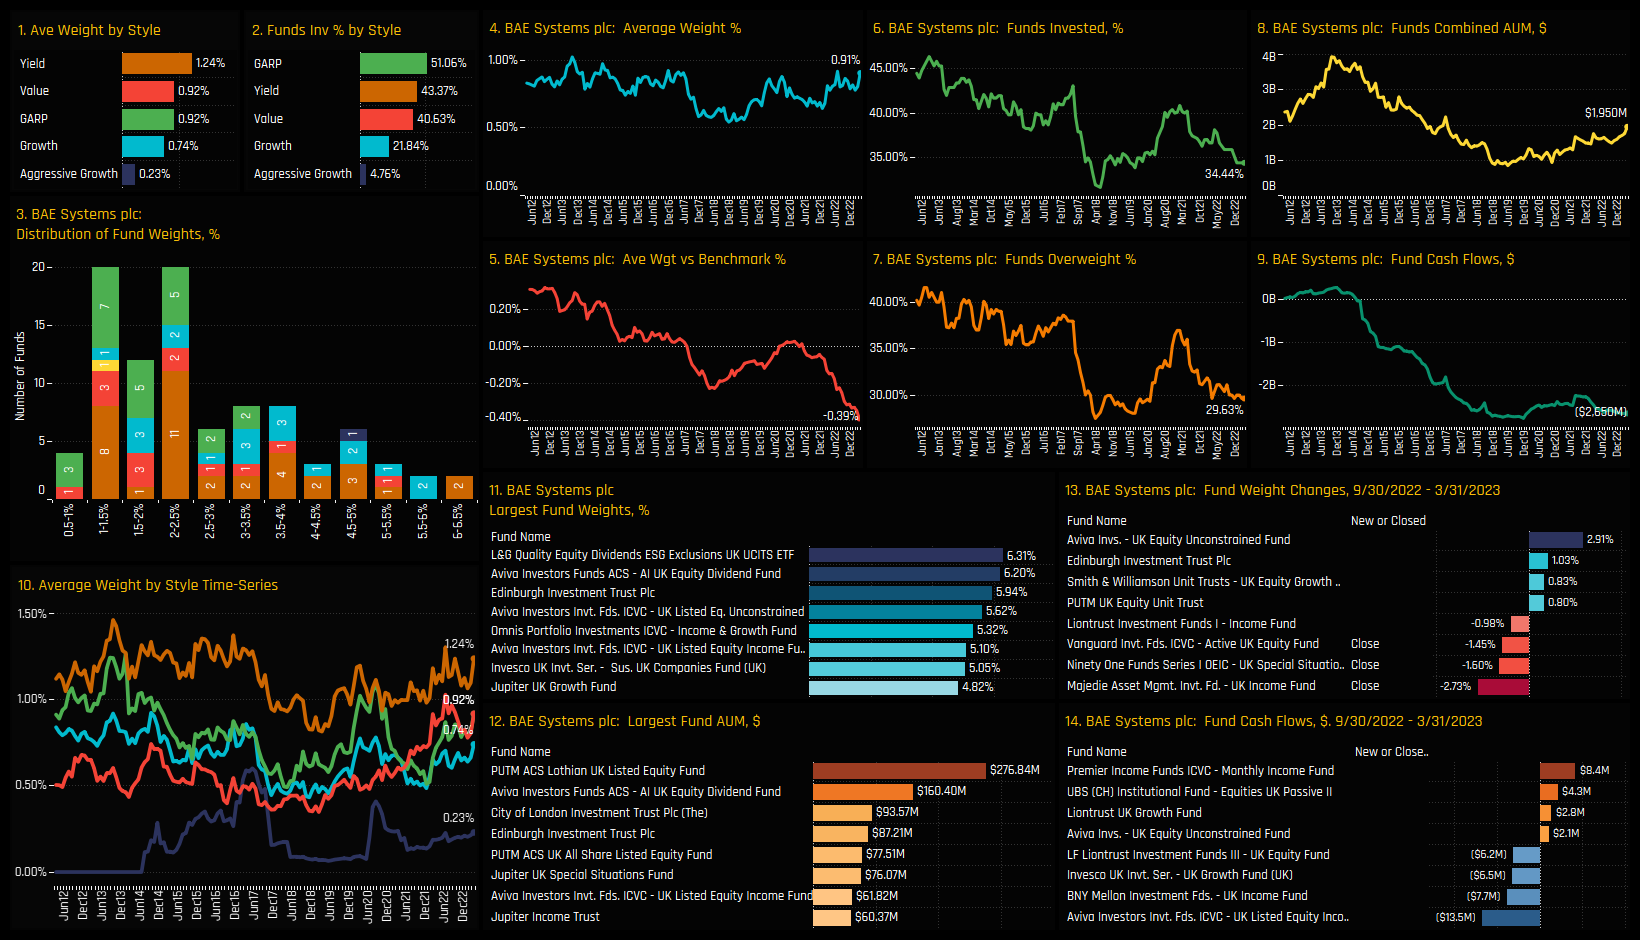
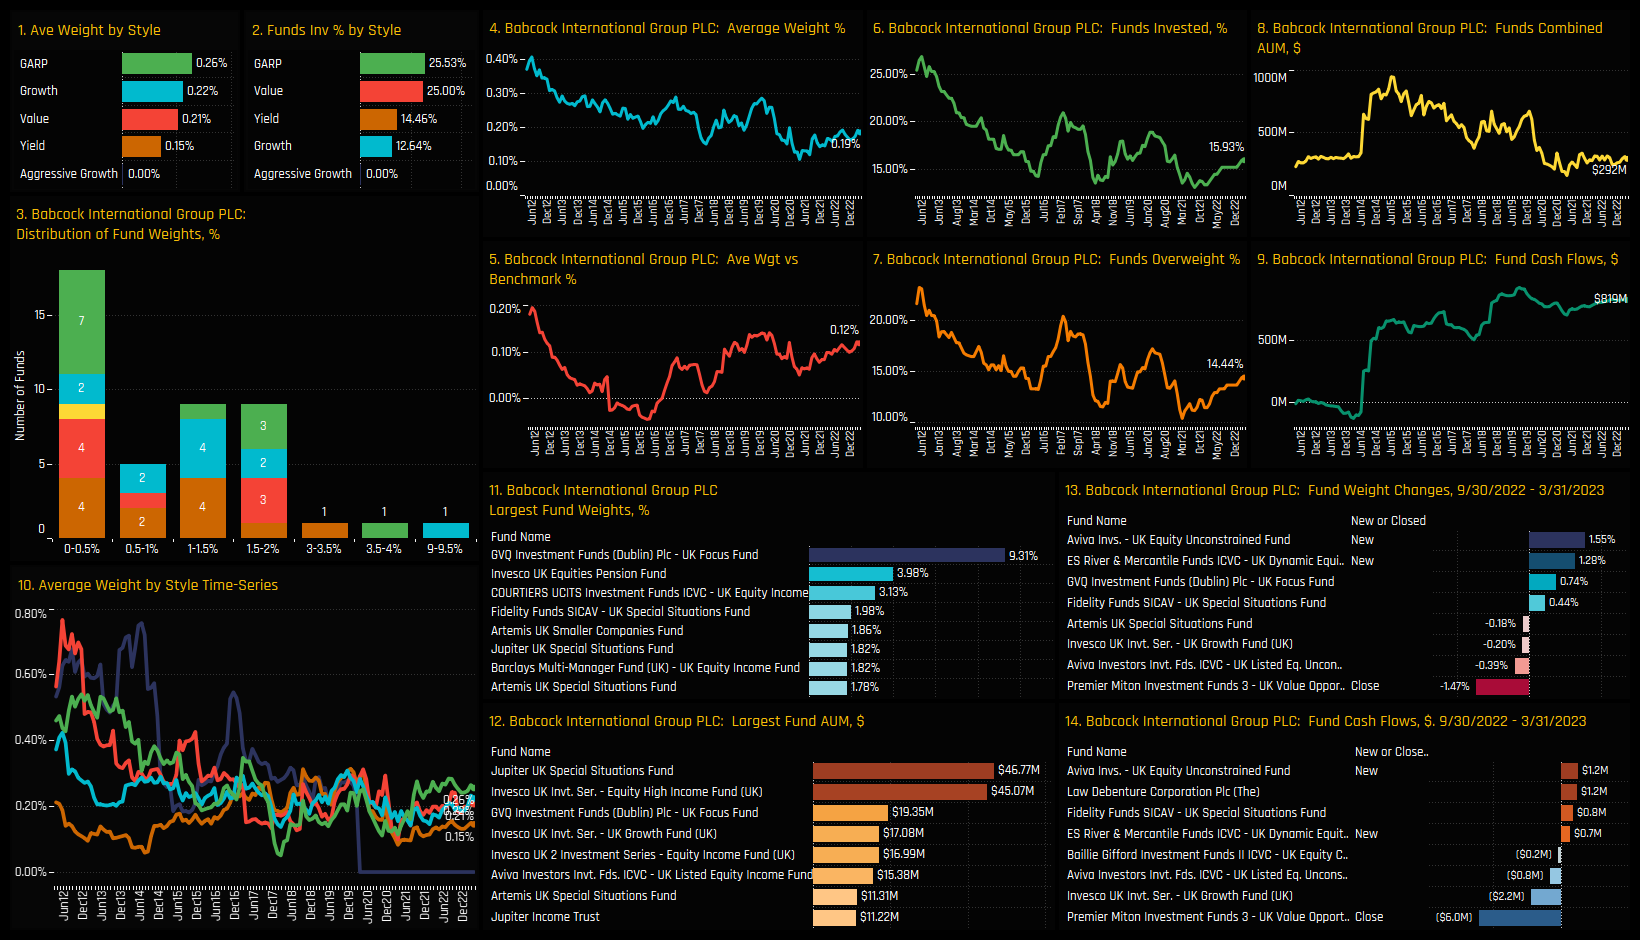
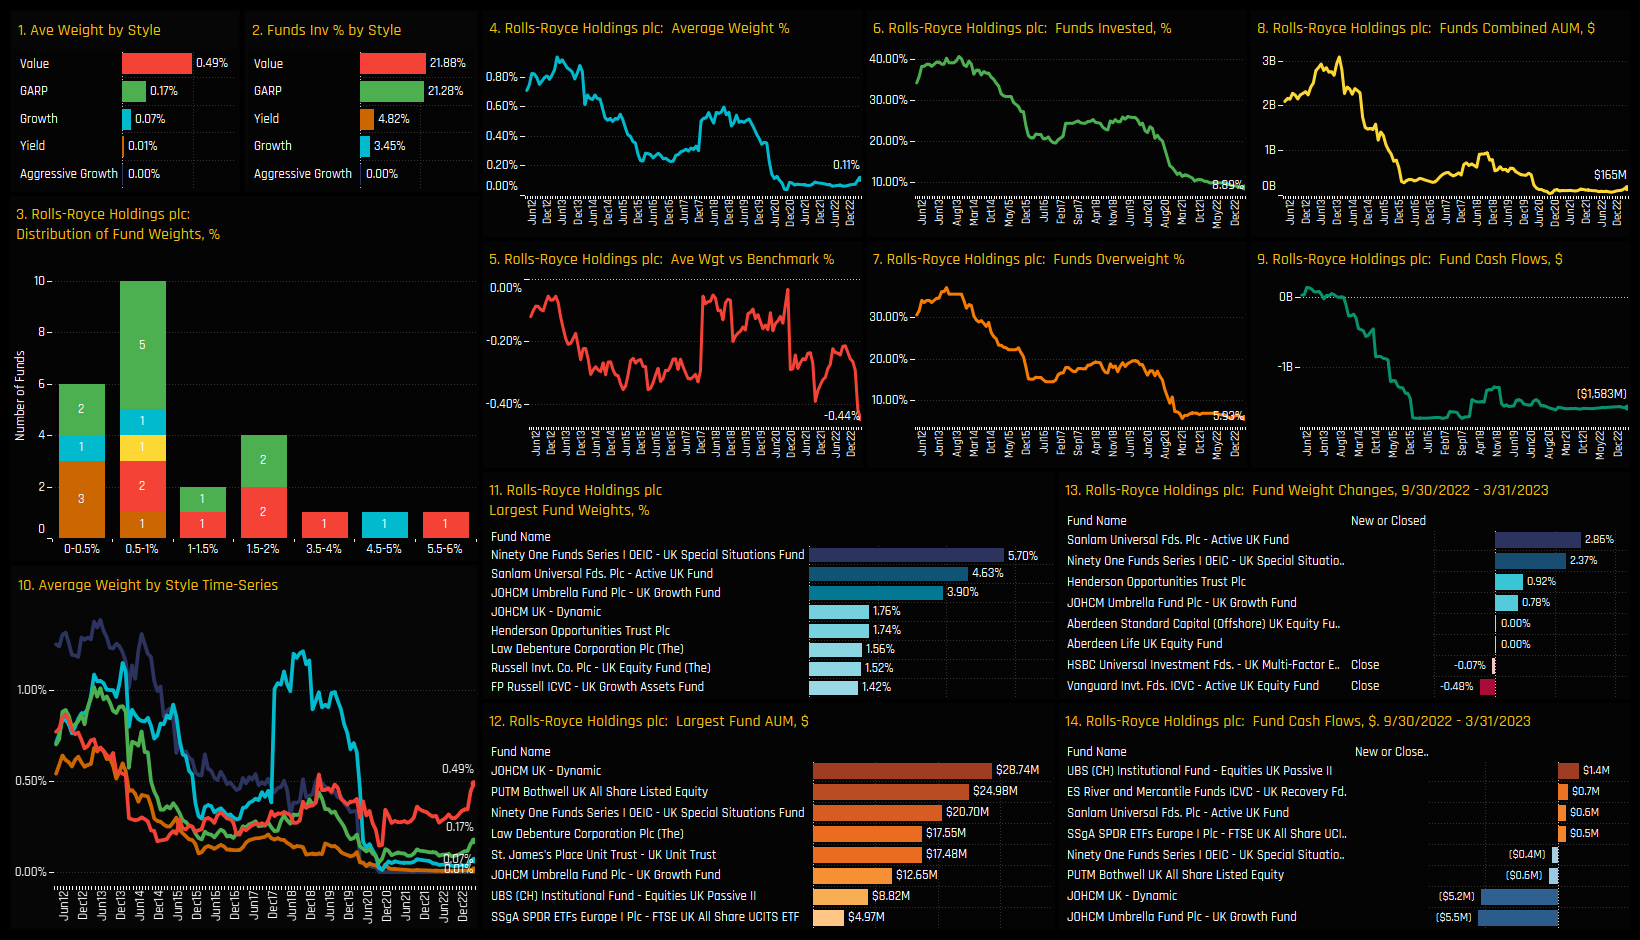
The histogram of portfolio holdings in the A&D industry group (top chart) shows a decent spread of fund weights ranging between 0.5% and 6%, with an extended tail to the right hand side. Top holders are the Growth strategies of Aviva UK Unconstrained (10.54%) and GVQ UK Focus (9.3%), though on average Value and GARP funds are the larger allocators (inset chart). Those that do have exposure, do so with some conviction.
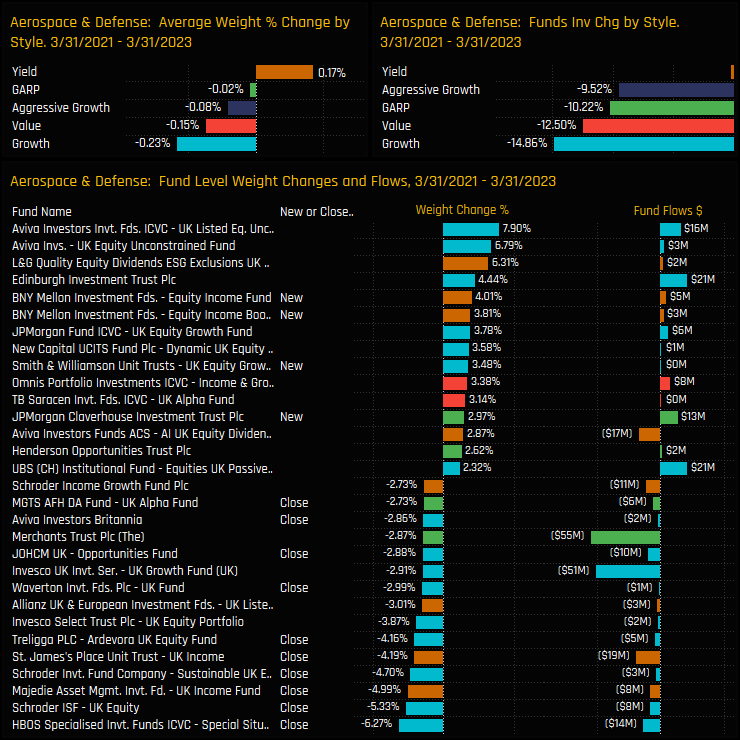
But there is no escaping the exodus among UK active funds over the last 2-years. Split by fund Style, 14.9% of the Growth funds in our UK analysis closed exposure between 03/31/2021 and 03/31/2023, in addition to 12.5% of Value funds and 10.2% of GARP funds. Only Yield managers stood their ground. On a fund level, HBOS UK Special Situations (-6.27%) and Schroders UK Equity (-5.33%) led the closures, which outnumbered openings by a factor of 4.
Stock Activity & Latest Holdings
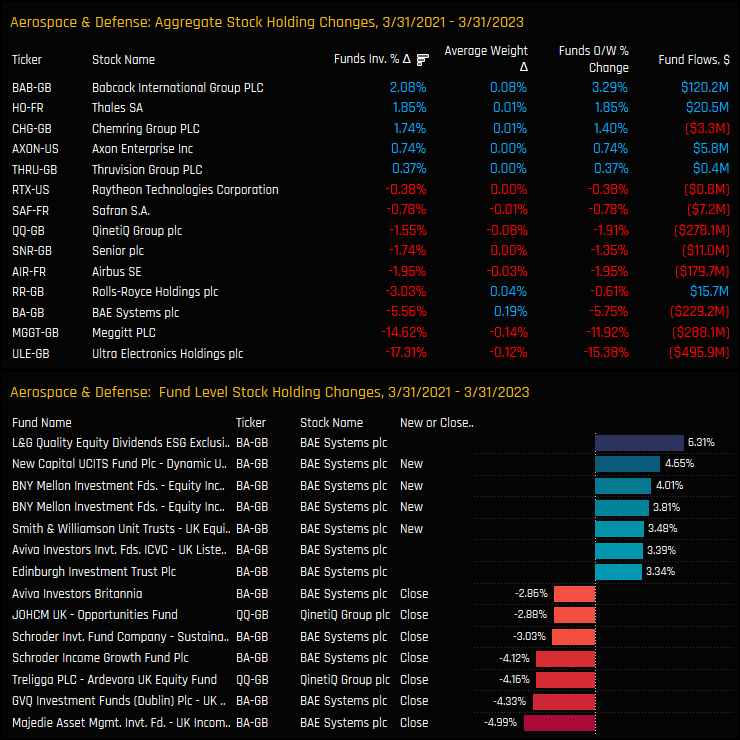
The aggregate changes in stock ownership between 03/31/2021 and 03/31/2023 are shown in the upper chart below. De-listings in Ultra Electronics and Meggitt PLC were behind much of the net decline in A&D ownership, but UK managers did not reallocate within the sector. The percentage of funds invested in BAE Systems, Rolls-Royce Holdings and out-of-benchmark Airbus SE also declined over the period. Increases were seen in Babcock International Group, Thales SA and Chemring Group but were not enough to offset the closures.
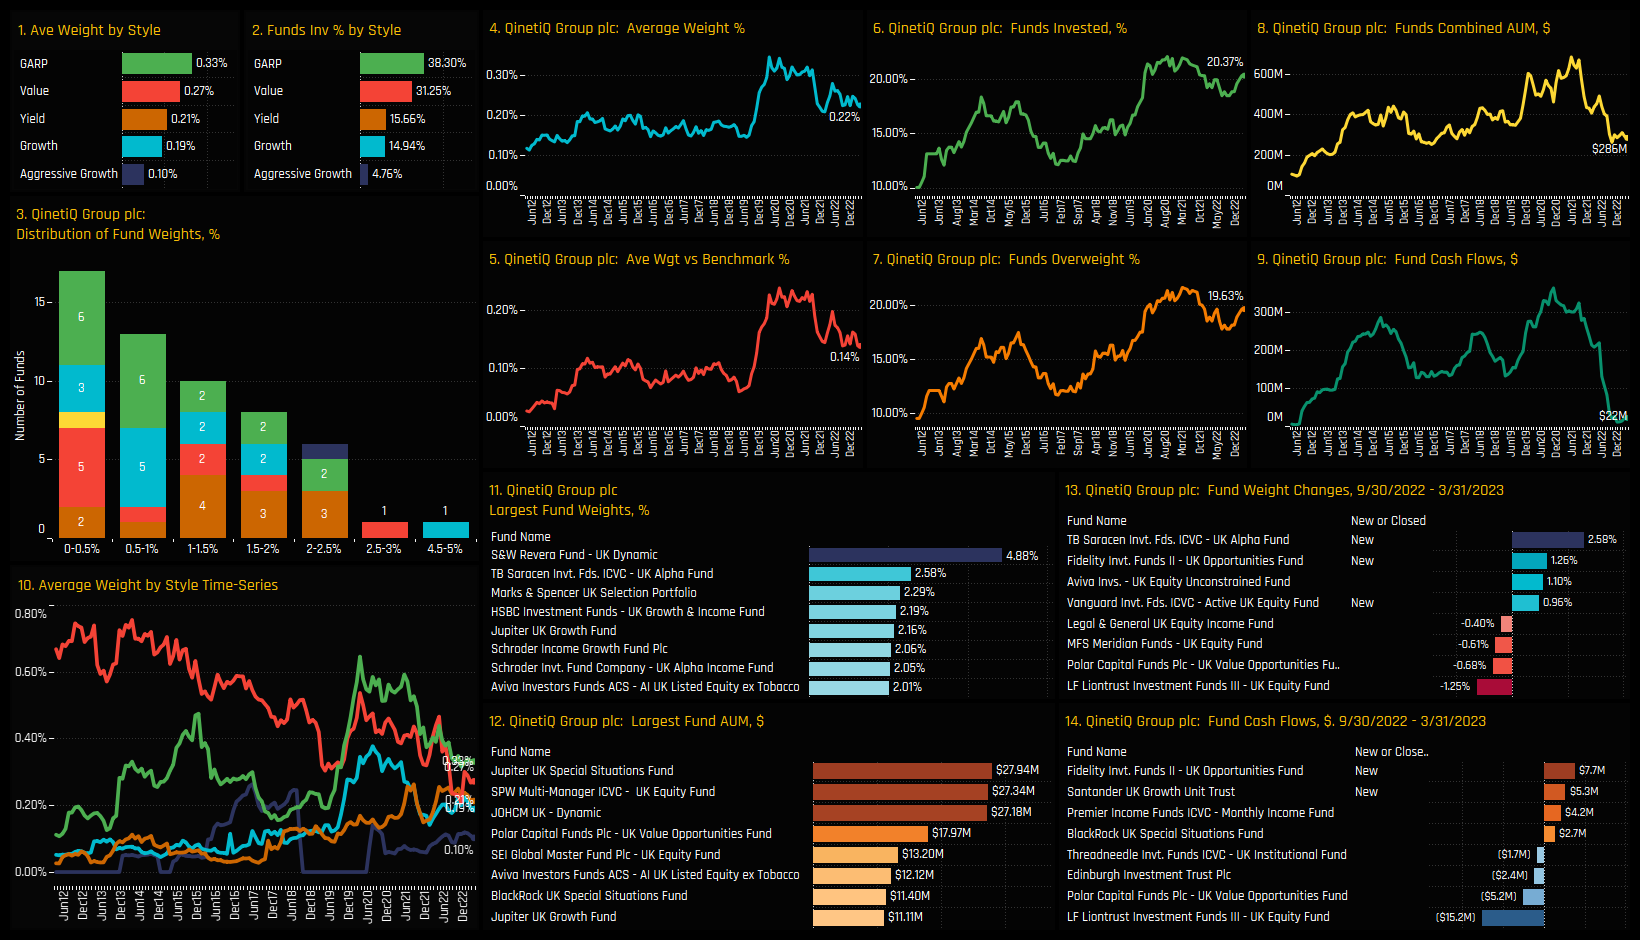
This activity leaves BAE Systems as the most widely held company in the A&D industry group, held by 34.4% of UK funds at an average weight of 0.91%. It also accounts for the majority of the high conviction holdings in the lower chart. QinetiQ Group, Babcock International Group and Chemring Group make up a second tier of companies that share similar ownership characteristics. The net A&D underweight is driven by BAE Systems and the lightly held Rolls-Royce Holdings.
Conclusions & Data Report
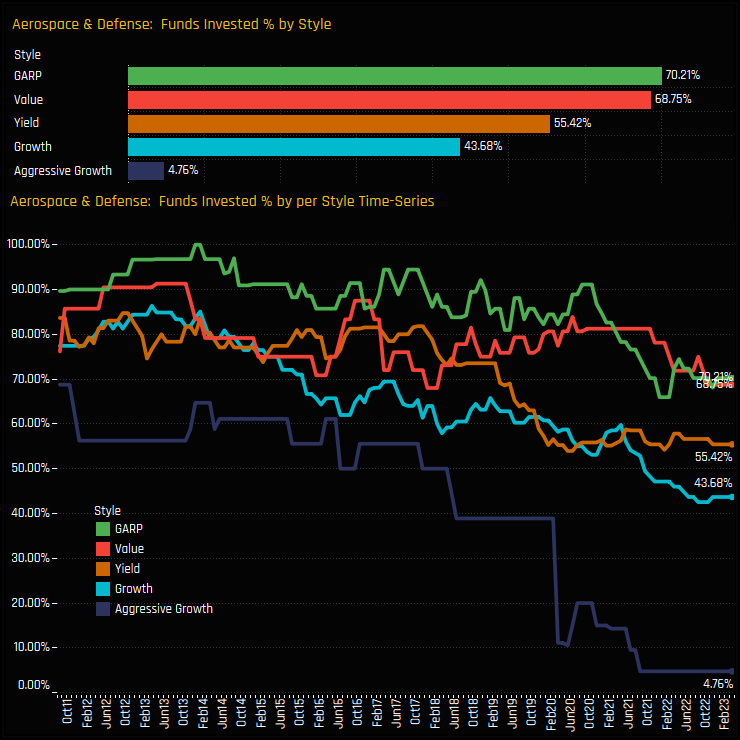
So Aerospace & Defense stocks are taking an ever diminishing share of the average UK active equity fund. The chart to the right shows the percentage of funds invested in the A&D industry group over time, split by fund style. The largest declines in exposure over the last decade were among Aggressive Growth and Growth managers, with the former group now almost completely absent from the investor base. GARP and Value funds are the major holders, though ownership levels for both groups, as well as for Yield investors sit near their lowest levels on record.
Whether we like it or not, active management is a relative game, with fund performance measured against both benchmarks and active peers. When active managers start exiting and benchmark weights start to dwindle, the risk of NOT holding exposure to a sector, industry or stock also starts to reduce. With almost half of the 270 active UK funds in our analysis now absent, Aerospace & Defense has become a non-essential holding and one that is becoming ever easier to avoid.
Click on the link below for an extended data report on UK fund exposure in the Aerospace & Defense industry group. Scroll down for stock profiles on BAE Systems, QinetiQ Group, Babcock International Group and Rolls-Royce Holdings.
Ownership levels hit new highs as active UK managers increase exposure.
Time-Series and Industry Activity
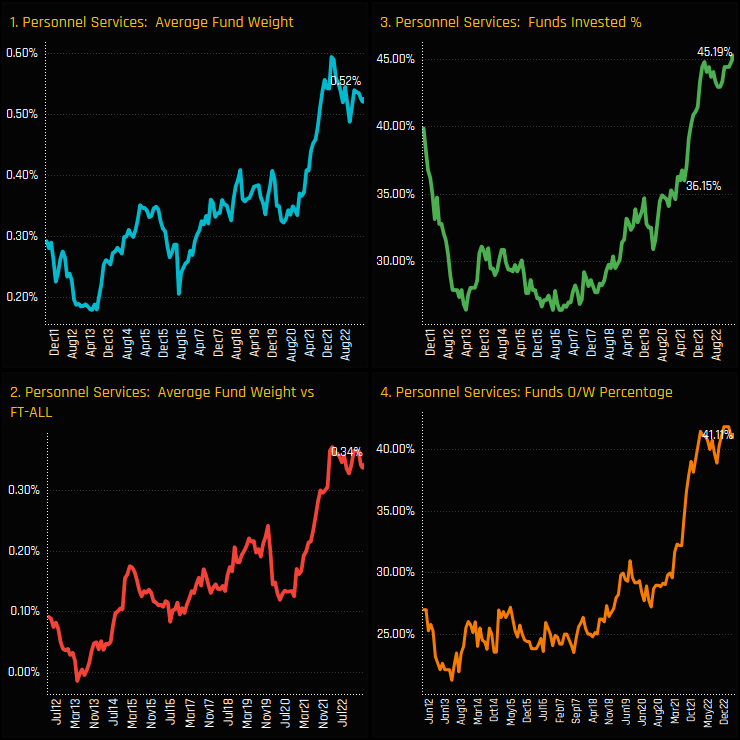
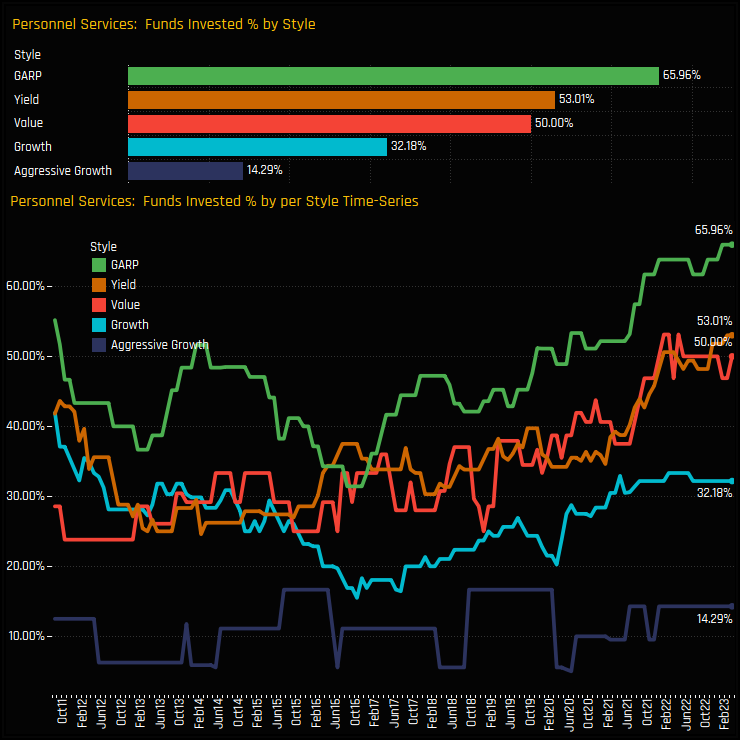
The percentage of UK funds with exposure to the Personnel Services industry group has hit fresh highs this month. Of the 270 funds in our UK analysis, a record 45.2% hold a position, with average weights of 0.52% at the higher end of the decade-long range. Despite over half of the fund population absent from the industry group, these levels represent an overweight of +0.34% on average, with nearly all of those who hold a position doing so at weights higher than the SPDRs FTSE All Share ETF.
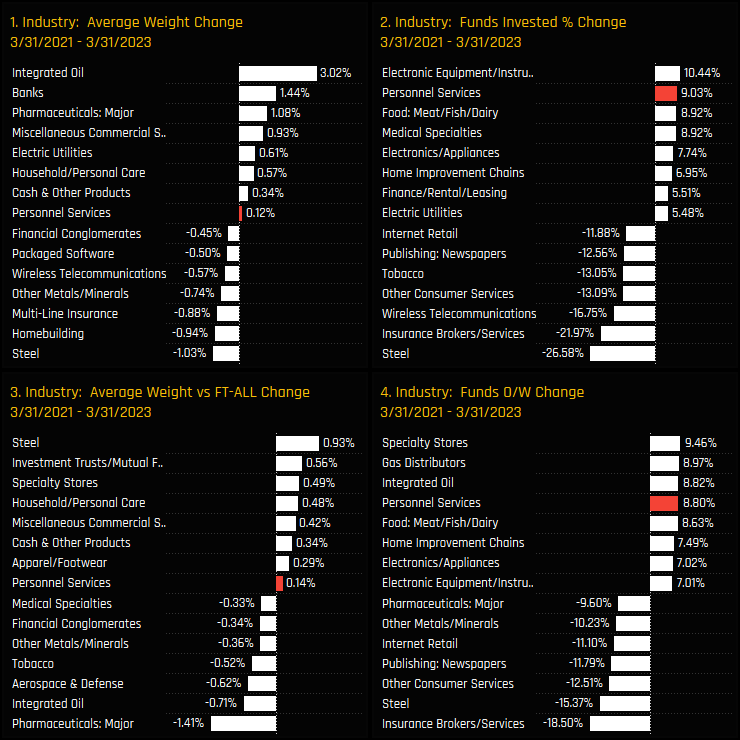
Over the past 2-years, Personnel Services stocks have been a key beneficiary of manager rotation. Integrated Oil and Banks saw the largest increases in average fund weights between 03/31/2021 and 03/31/2023 (ch1), but in terms of outright ownership, Personnel Services captured the 2nd largest increase in the percentage of funds invested after Electronic Equipment/Instruments (ch2). The fact that both absolute and relative measures of ownership all moved higher shows the active nature of the rotation.
Fund Activity and Stock Rotation
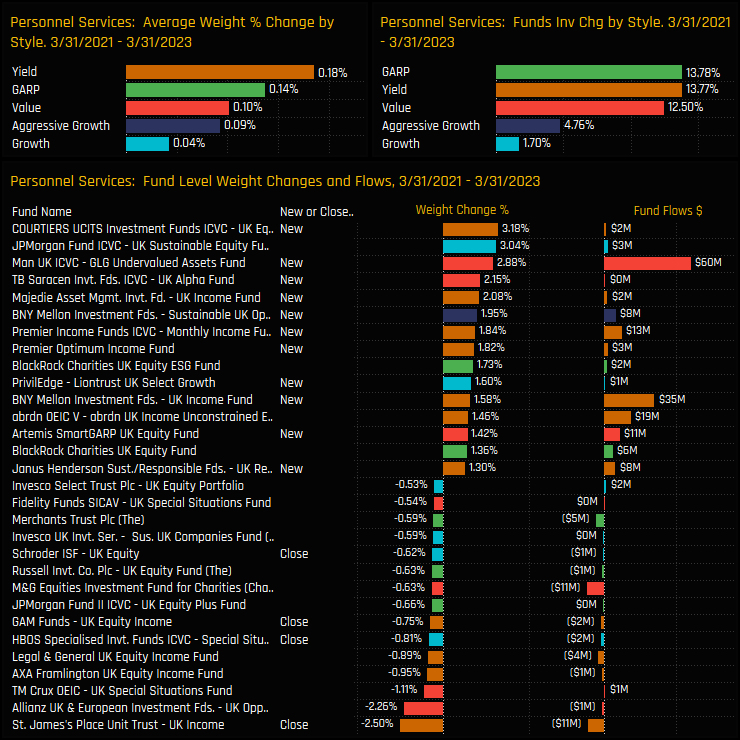
The fund activity underpinning this rotation is shown in the lower chart below. New positions outpaced closures by factor of 7, with weight increases led by Courtiers UK Equity (+3.2%) and JP Morgan UK Sustainable Equity (+3.04%). On a Style basis in the upper charts, Yield and GARP investors led the way, with an additional 13.8% of both groups adding exposure over the period.
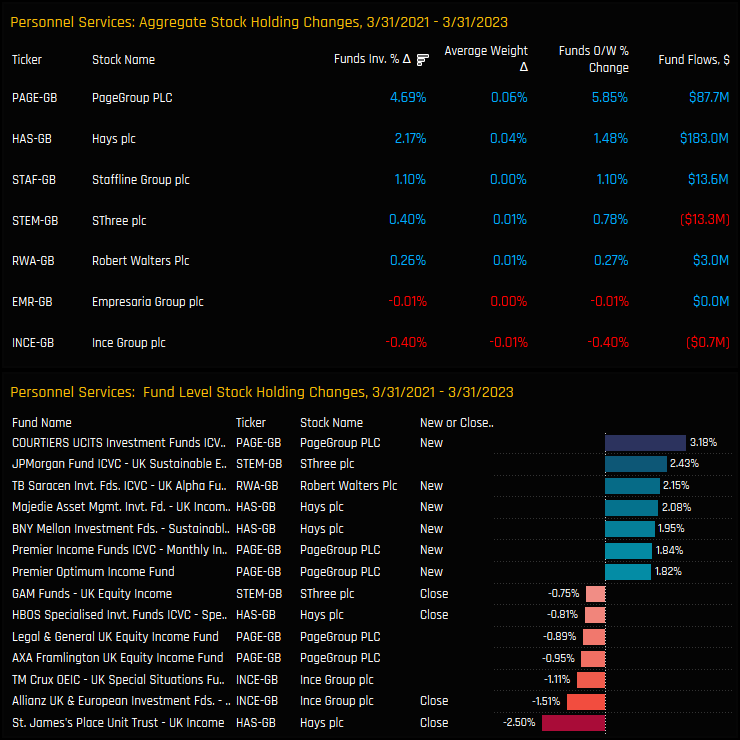
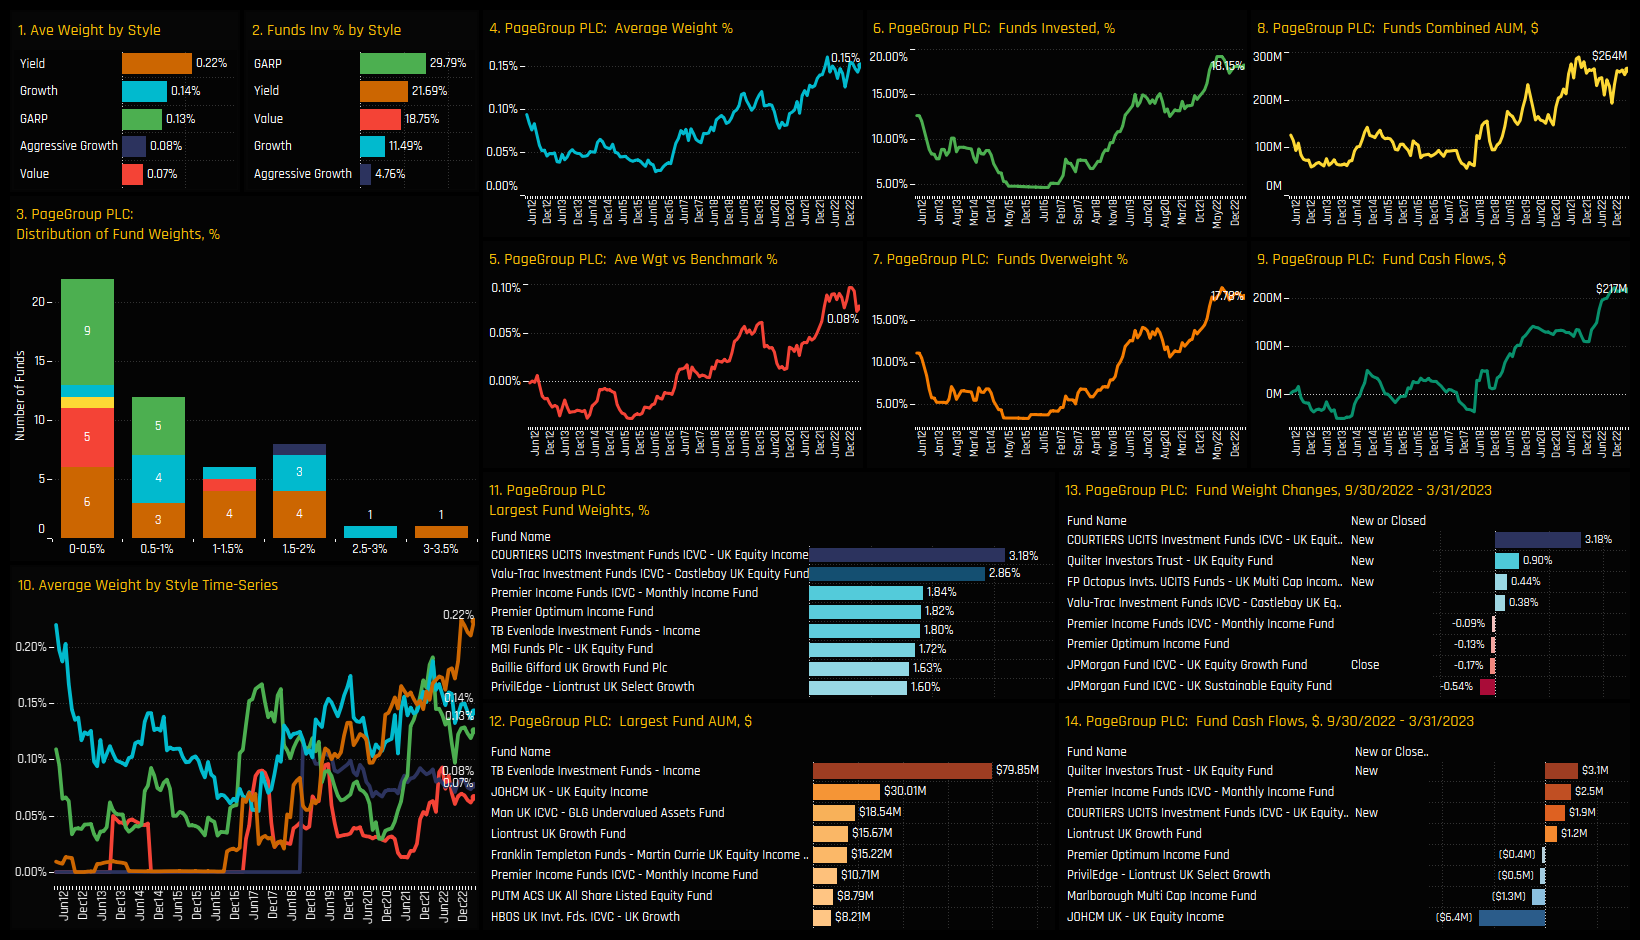
Drilling down to a stock level highlights the companies that have benefitted from this rotation. The top chart shows the aggregate changes in stock ownership between 03/31/2021 and 03/31/2023. PageGroup PLC and Hays PLC have led the charge, with the percentage of funds invested rising by +4.7% and 2.2% respectively following a combined $270m of fund inflows.
Latest Fund Holdings & Stock Exposures
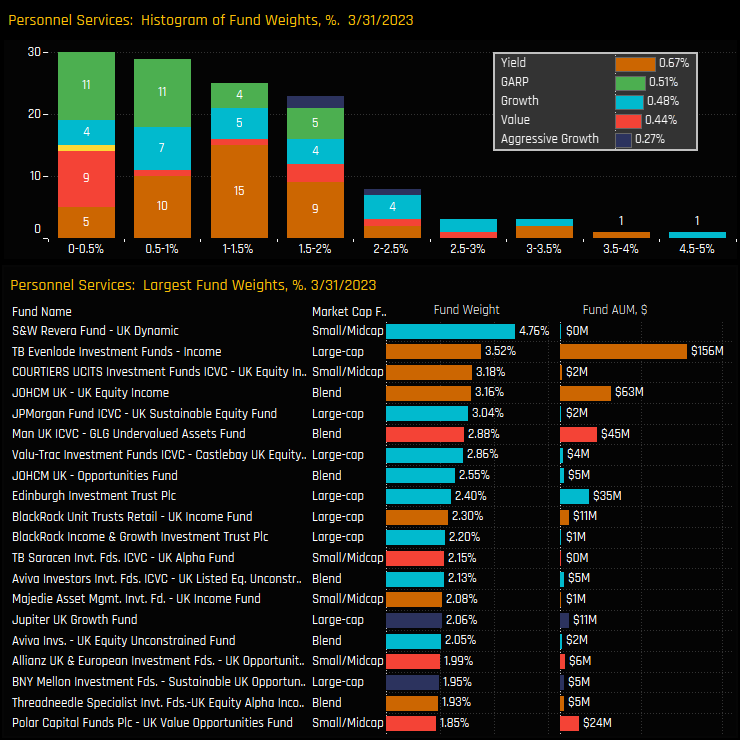
The histogram of the latest fund weights in the Personnel Services industry group is shown in the top chart below. The majority of funds hold a sub 2% allocation, with the small/midcap strategy of S&W Revera UK Dynamic topping the list with a 4.76% weight and leading a group of 16 funds with a >2% allocation. Overall though, the Personnel Services industry group remains a small allocation for the majority.
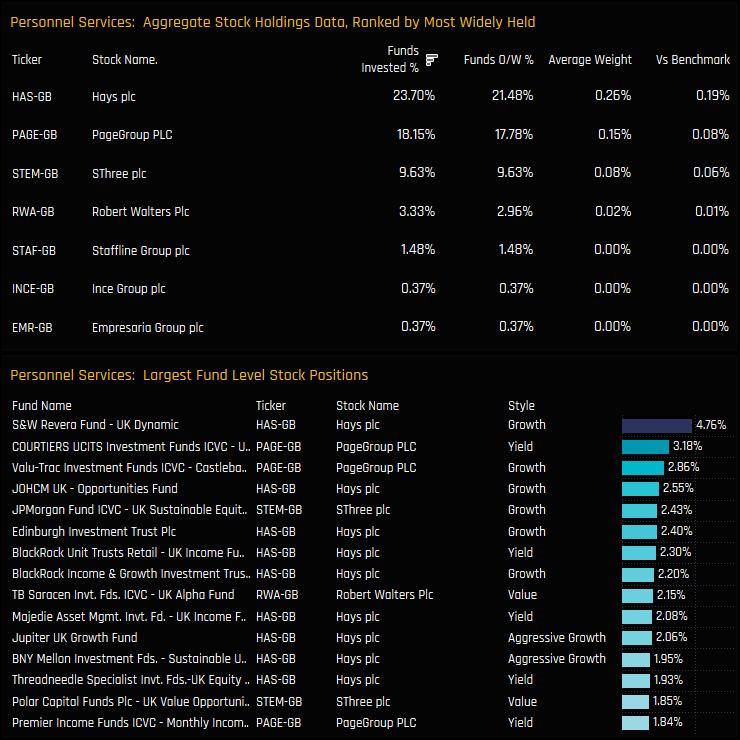
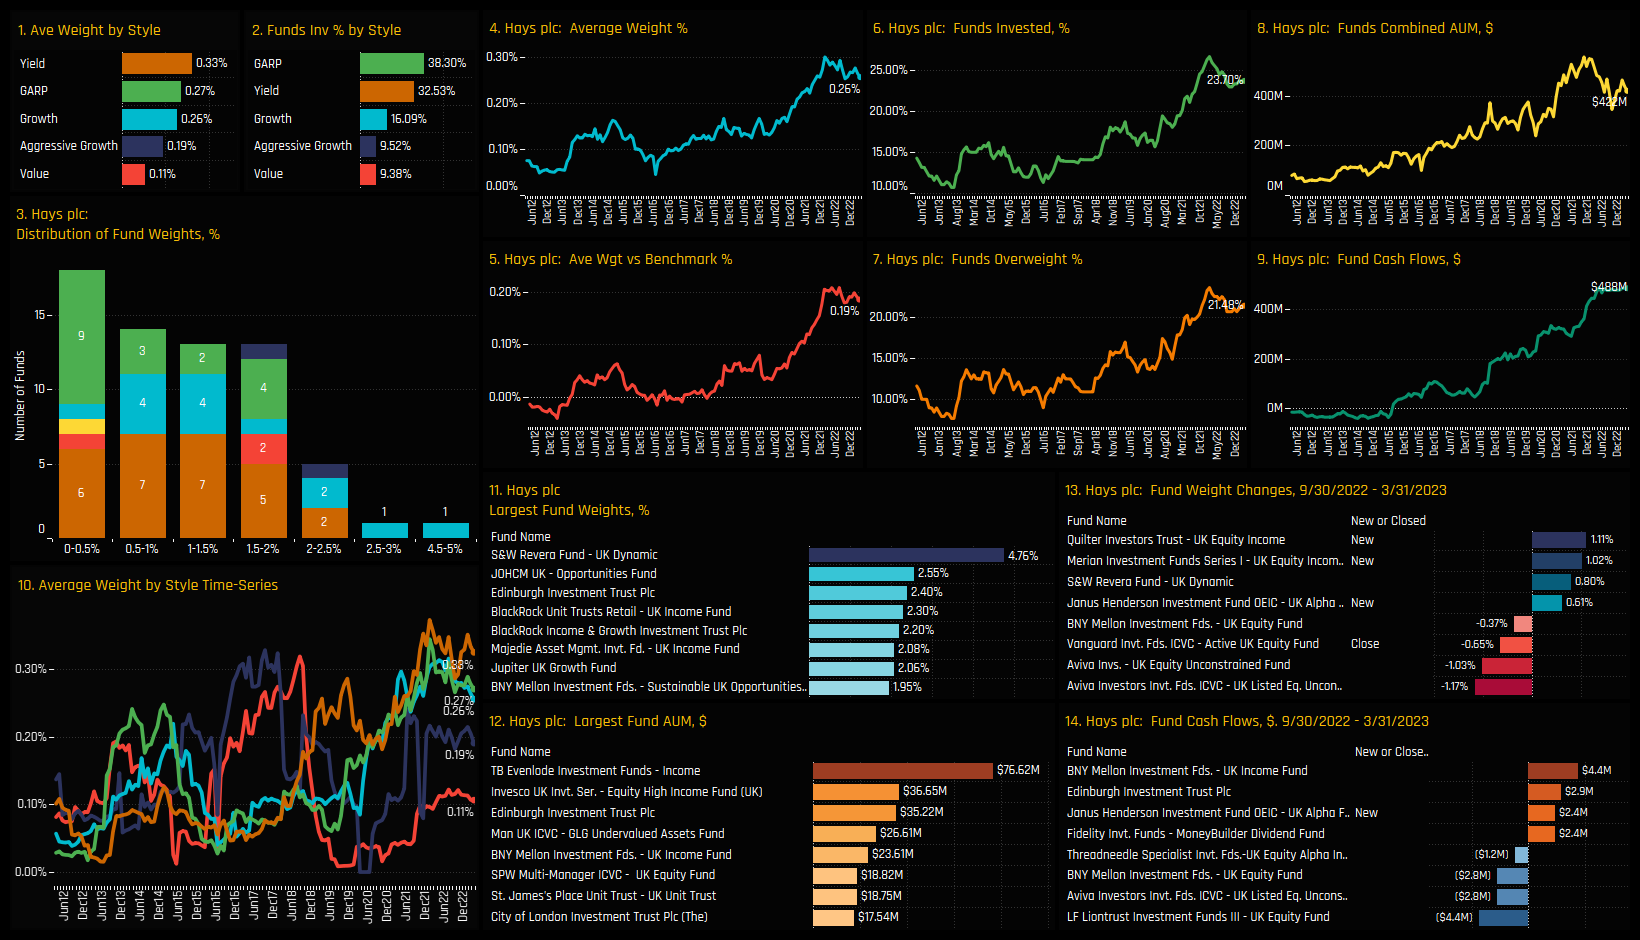
Stock ownership in the Personnel Services industry group is confined to 8 companies. The most widely held are Hays PLC and PageGroup PLC, owned by 23.7% and 18.2% of the UK funds in our analysis, respectively. Of the high conviction individual fund positions in the bottom chart, Hays PLC is dominant, with S&W Revera, JOHCM and BlackRock among the key holders.
Conclusions & Links
Active UK Funds are raising their exposure to the Personnel Services Industry group. A record 45.2% of the funds in our analysis now have exposure following a 2-year bull-market in UK fund ownership.
From a Style perspective, GARP and Yield investors are at record levels of ownership (see chart opposite), but even Growth and Value investors have seen a shift in exposure and remain only slightly off the highs. Aggressive Growth funds are notably absent from the picture.
Despite the strong rotation in recent years, holding weights remain quite low, with most funds opting for a sub-2% weight. Compared to the FTSE All Share benchmark weight of just 0.18%, this does represent a decent sized overweight for the majority of holders. But with over half of the UK fund universe not invested at all, there is clearly room for ownership levels to move higher from here.
Click on the link below for an extended data report on UK fund positioning in the Personnel Services industry group. Scroll down for stock profiles on Hays PLC and PageGroup PLC.
Ownership levels hit new highs as active managers increase exposure.
Time-Series and Stock Activity
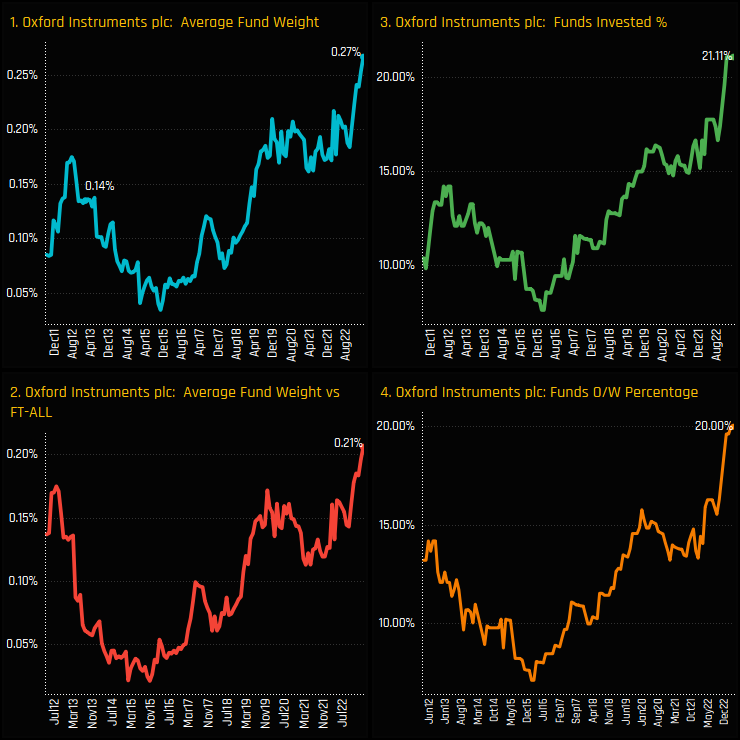
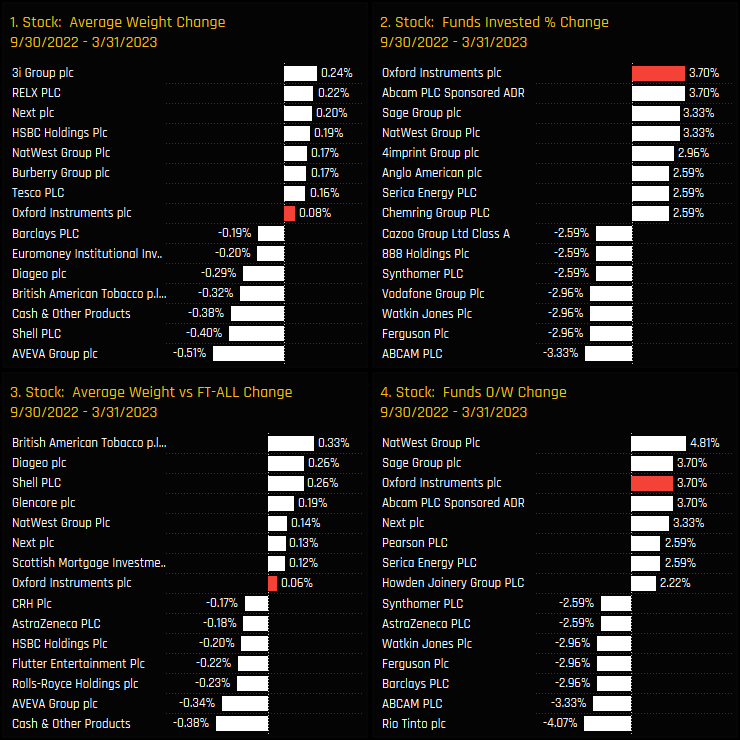
UK Fund ownership in Oxford Instruments has moved aggressively higher in recent months. After a surge of buying from September of last year onwards, all of our measures of fund ownership are at record levels, with 21.1% of funds now invested at an average weight of 0.27%. Almost all of the current holders are overweight at a net +0.21% above the SPDRs FTSE All Share ETF weight.
Oxford Instruments captured the largest increase in funds invested across the entire UK stock universe between 09/30/2022 and 03/31/2023. A further +3.7% of funds bought in to the stock, alongside similar increases in Sage Group and Natwest Group (see Natwest Group: Rising Up the Ranks). All measures of ownership, both absolute and relative to benchmark moved higher, such was the strength of the rotation.
Fund Activity & Latest Holdings
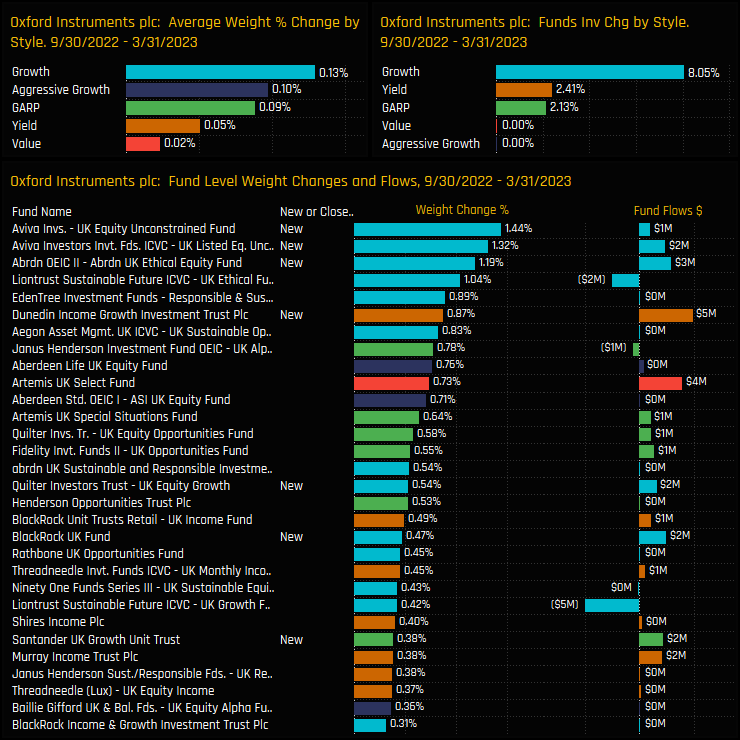
This active rotation was underpinned by widespread buying among selected UK equity funds, with not a single fund reducing their weight in Oxford Instruments over the last 6-months. Instead, 10 funds opened new exposure, led by Aviva UK Unconstrained (+1.44%) and Abrdn UK Ethical (+1.19%). On a Style basis, UK Growth funds were the most aggressive in adding exposure, with 8% of Growth managers buying in to the stock over the period.
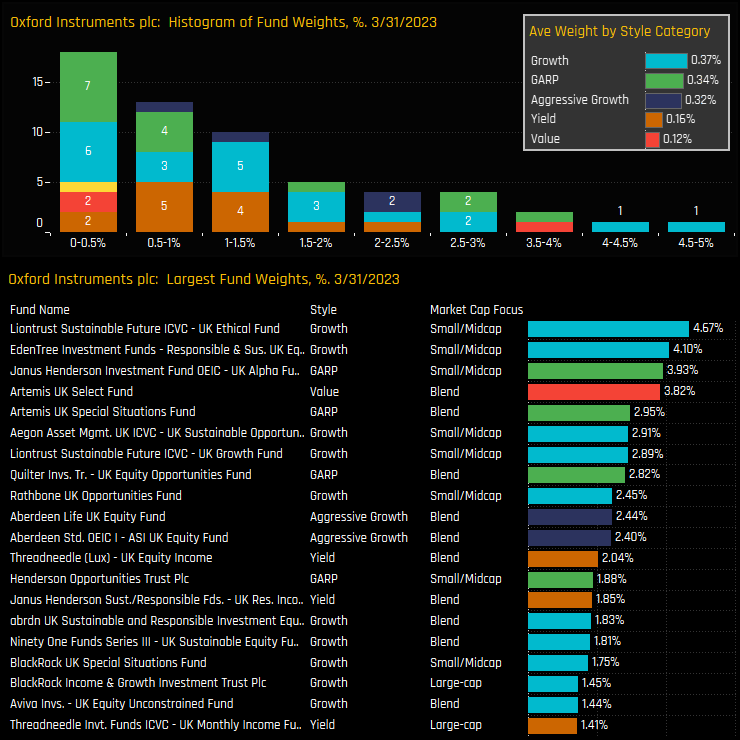
The latest snap of fund level exposure shows the majority of investors at weights below 1%, though there are those with a more bullish view. Liontrust UK Ethical (4.7%), EdenTree Responsible UK Equity (4.1%) and Janus Henderson UK Alpha (3.9%) lead a group of 12 funds with a >2% allocation. Most of the top holders are at the Small/Midcap or Blend end of the spectrum.
Conclusions & Links
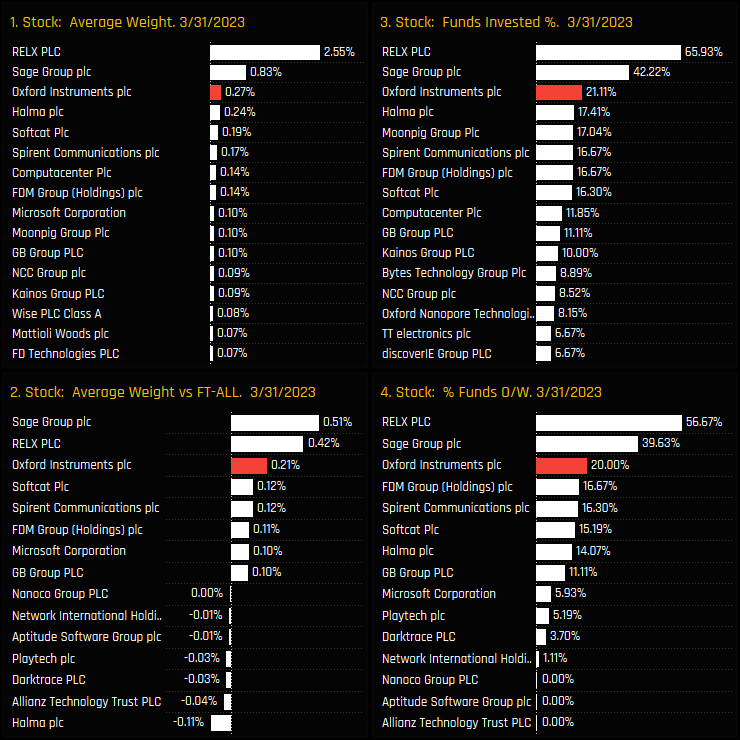
The recent spike in ownership has seen Oxford Instruments catch up to established peers in the Information Technology sector. It is now the 3rd most widely held Technology company in the UK and the 3rd largest overweight among Tech peers. RELX PLC and Sage Group remain the dominant holdings within the sector by quite a margin (see chart set opposite).
Oxford’s popularity among Small/Midcap and Blend funds is understandable given it’s market cap of ~$2bn. Among the 270 funds in our analysis, 31.5% of Small/Midcap and 27.2% of Blend funds are exposed, compared to just 14% of Large-Cap funds.
But if we couple the recent strong momentum with the fact that 78.9% of UK funds are still uninvested, it’s not difficult to see the potential for the ownership base to make further gains from here. It’s a stock that should be on every UK investor’s radar.
Click on the link below for the latest data report on UK fund positioning in Oxford Instruments.
For more analysis, data or information on active investor positioning in your market, please get in touch with me on steven.holden@copleyfundresearch.com
Investor Positioning Report — Copley Fund Research Ltd · Last updated: July 2026 · Registered in England and Wales
1. Who we are
Copley Fund Research Ltd provides proprietary institutional fund intelligence to listed companies and investor relations professionals. These terms govern every purchase of an Investor Positioning Report. By completing a purchase you confirm you have read, understood, and agreed to these terms in full.
2. What you are purchasing
The Investor Positioning Report is a bespoke PDF report mapping the institutional fund universe around your stock. It covers current investors, past investors, competitor investors, and white space investors. Every report is built from scratch for the specific company ordered and is not a standardised or templated product.
3. Delivery and process
Following payment or invoice issuance, Copley Fund Research will contact you within one working day to agree your competitor set. Production begins once the competitor set is confirmed in writing. The completed report will be released to you within 48 hours of production starting, provided payment has been received in full; where payment is outstanding, the report will be withheld until payment clears. If the requested company falls outside our covered fund universes, or a competitor set cannot be agreed, Copley Fund Research will issue a full refund or cancel the outstanding invoice.
4. Competitor set agreement
The competitor set is agreed with you in writing prior to production, and the report is built to that agreed specification. Requests to amend the competitor set after delivery, based on a change of preference rather than an error, may be treated as a new order.
5. Refund policy
Because each report is produced individually for your company, orders are non-refundable once production has begun, except as set out in clauses 3 and 5a below. By purchasing, you agree not to dispute the charge with your card provider on the basis that the service was not as described, provided the report has been delivered to the agreed specification or corrected under clause 5a.
5a. Quality remedy
If a delivered report contains a material error caused by Copley Fund Research — for example, an incorrect company analysed, a competitor omitted from the agreed set, or content missing from the specification in clause 2 — Copley Fund Research will correct and redeliver the report at no additional charge, within a reasonable timeframe. This is your sole remedy for such errors.
6. Data and accuracy
All fund positioning data in the report reflects holdings as disclosed at the most recently available reporting date at the time of compilation. The timing of fund holdings disclosures is determined by regulatory requirements applicable to each fund and is outside the control of Copley Fund Research Ltd. This data may not reflect current fund positions. Copley Fund Research takes reasonable care to ensure accuracy but makes no warranty, express or implied, as to the completeness or current accuracy of the underlying data — though this does not affect the quality remedy in clause 5a for errors in how that data was analysed or presented. Past fund positioning is not indicative of future fund behaviour or investment decisions.
7. Not investment advice
The Investor Positioning Report is produced for investor relations intelligence purposes only. It does not constitute investment advice, financial advice, or a recommendation to buy, hold, or sell any security. The data reflects historical fund positioning and must not be relied upon as a prediction of future fund behaviour or investment decisions. Copley Fund Research Ltd is not authorised or regulated by the Financial Conduct Authority for the provision of investment advice.
8. Permitted use and confidentiality
The report is licensed for internal use by the purchasing organisation only. You may share it with employees and directors of your organisation. You may not: reproduce, redistribute, publish, or resell the report or any part of it; share it with any third party outside your organisation without prior written consent; use the fund or portfolio manager names contained in the report to approach those individuals on behalf of Copley Fund Research or in a manner that could damage Copley Fund Research's relationships with those funds; or use the data for any purpose other than your own investor relations strategy. The data, analysis, and methodology contained in the report are the intellectual property of Copley


