In this issue:
MSCI China. Casinos/Gaming: Early Stage Recovery
China A-Shares. Telecommunications Equipment Decline
Greater China. Alibaba: Fighting Back
118 Active MSCI China Funds, AUM $37.5bn
Casinos/Gaming: Early Stage Recovery
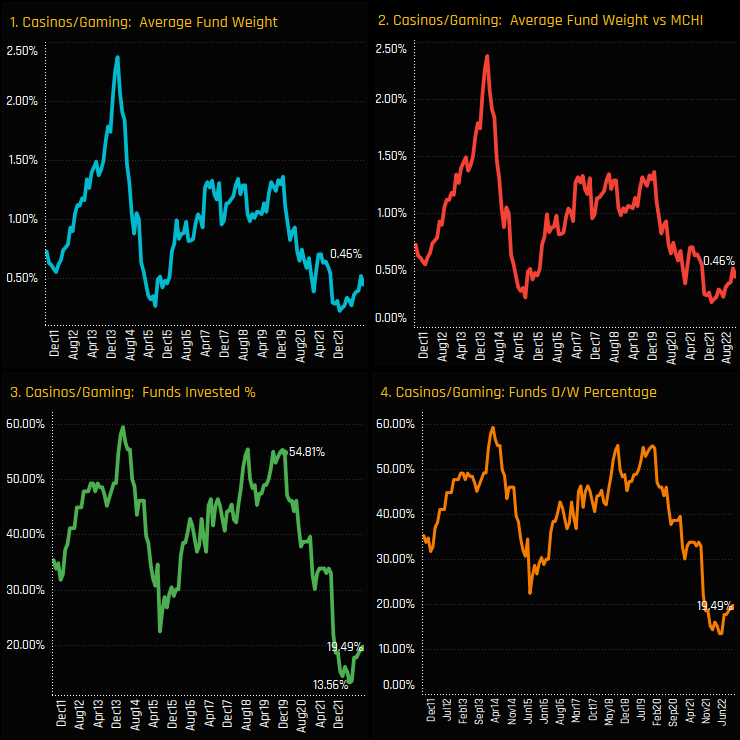
Ownership levels in China Casino & Gaming stocks are creeping off their all-time lows. In the face of obvious struggles from a locked-down China, the percentage of funds invested in Casino stocks plummeted from a late 2019 high of 54.8% to a low of 13.6% in April of this year (ch3). Since that low, all measures of ownership have moved higher, though we remain at the bottom end of the decade-long range.
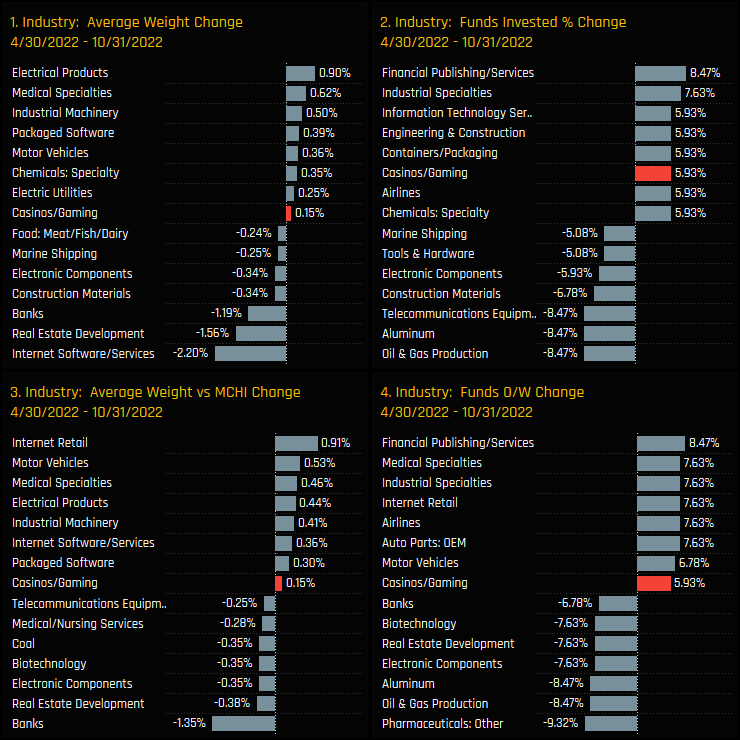
The below charts highlight the change in industry level ownership among the 118 MSCI China funds in our analysis between 04/30/2022 and 10/31/2022. They highlight a positive rotation in to the Casino/Gaming industry group over the period, with all 4 measures of ownership moving higher and among the most positive versus peers. Of particular note is the increase in the percentage of funds invested, bettered only by Industrial Specialties and Financial Publishing/Services.
Fund Holdings & Style Analysis
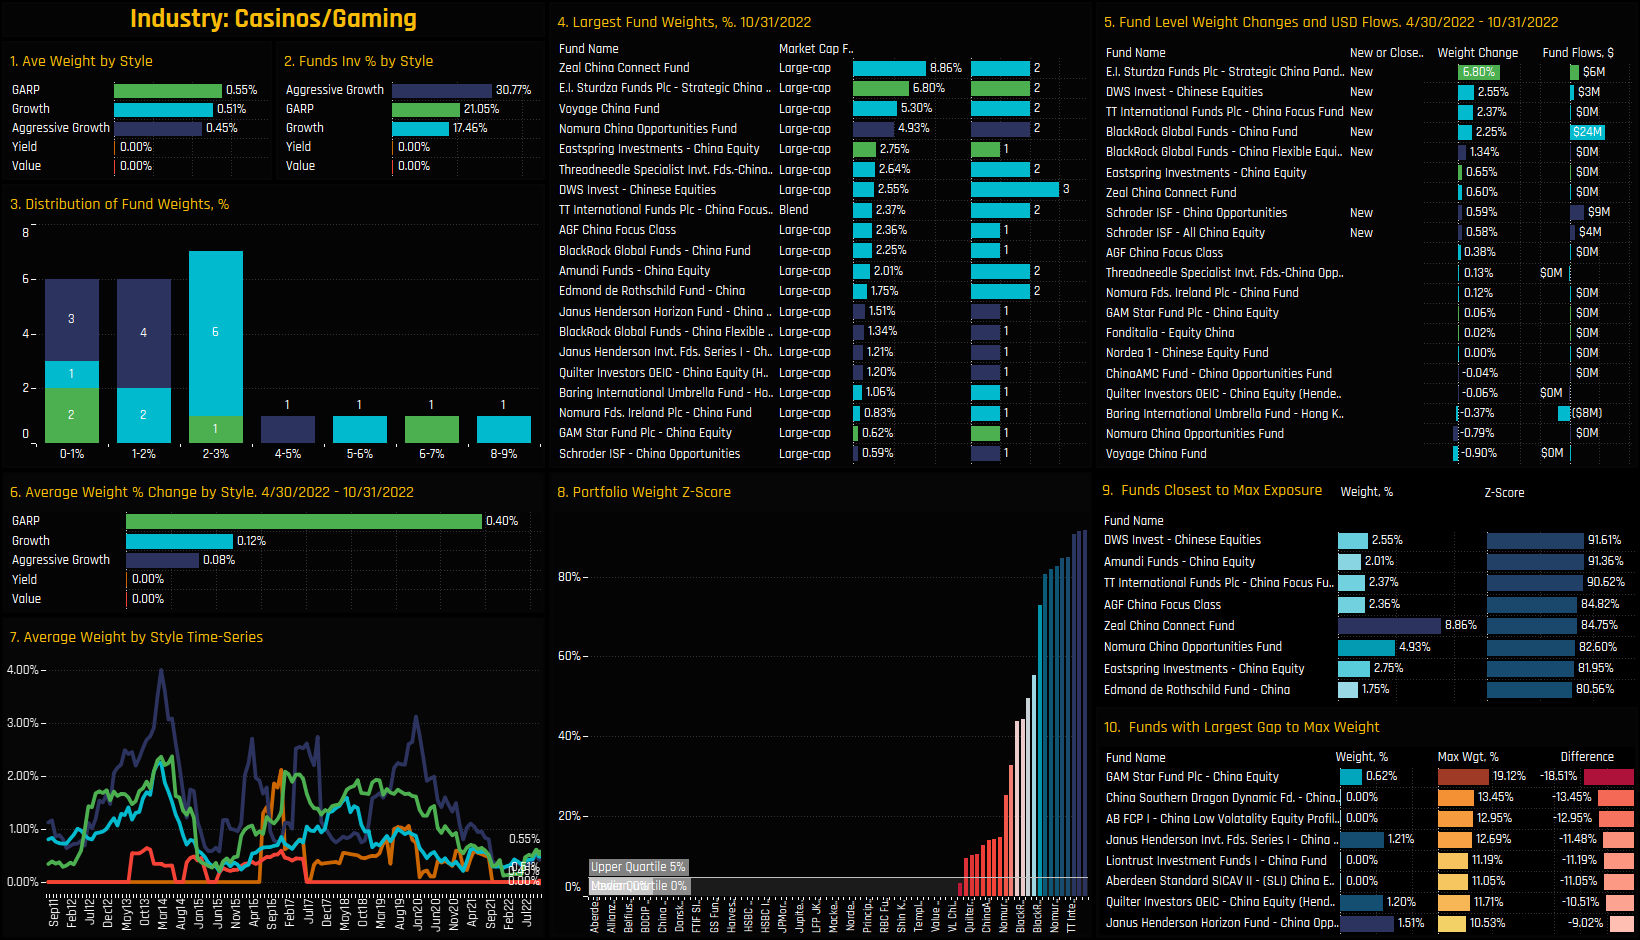
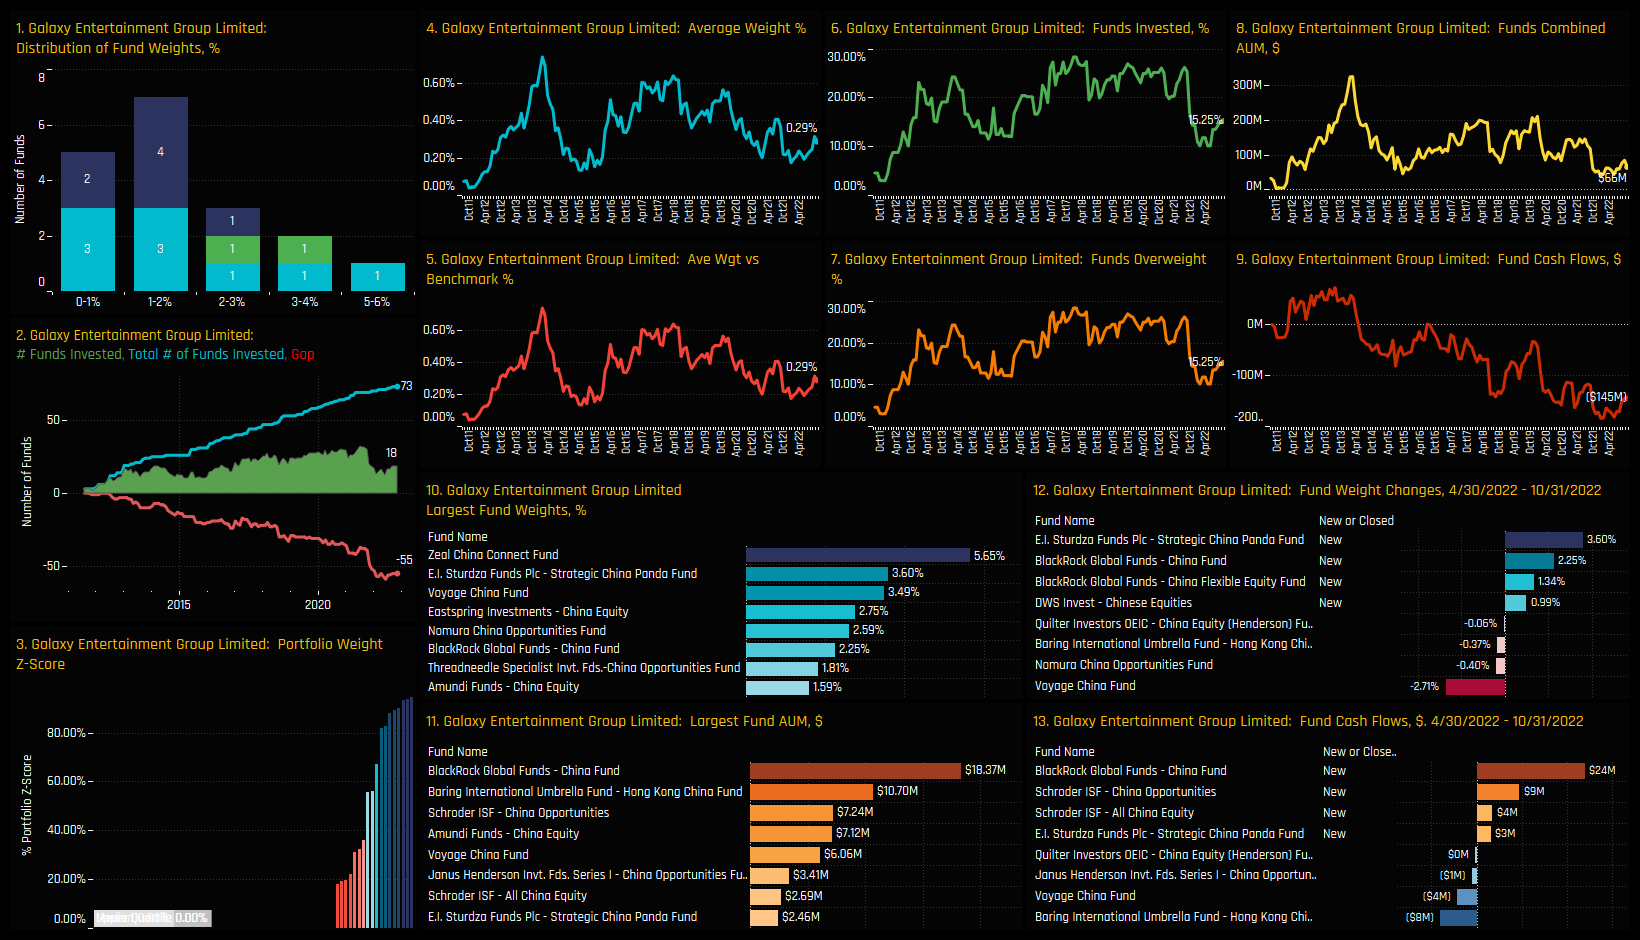
The charts below provide granular detail on the make-up of Casino/Gaming positioning among MSCI China active funds. Chart 3 shows the distribution of fund weights, with the main cluster below 3% and just 4 strategies above that. Top holders in Chart 4 are dominated by GARP and Growth investors, led by Zeal China Connect (8.86%), E.I Sturdza Strategic China (6.8%) and Voyage China (5.3%). Driving ownership levels higher over the last 6-months were new positions from E.I Sturdza (+6.8%), DWS Chinese Equities (2.55%) and TT International China Focus (2.37%).
Chart 7 shows the long term trends in Casino/Gaming weights split by Style, with Aggressive Growth funds cutting back exposure the most since the highs of 2019. Chart 8 shows the portfolio Z-Score for the Casino/Gaming industry group for each fund in our analysis. Each bar represents a fund, with a score of 100% indicating today’s weight is the highest on record for that fund, and 0% the lowest. The current crop of top holders are very much the ‘first movers’, with the majority of funds still at their lowest allocations in over a decade.
Stock Holdings & Activity
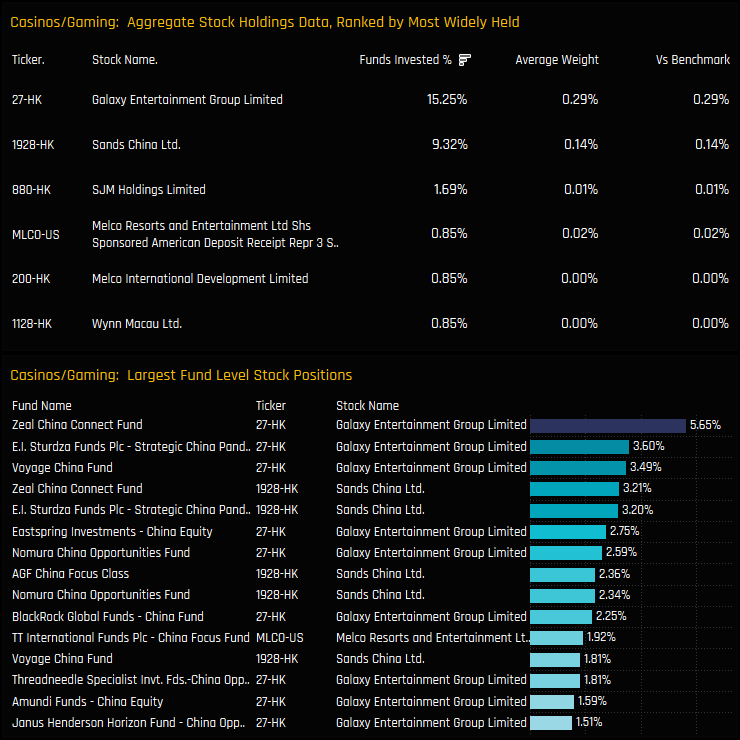
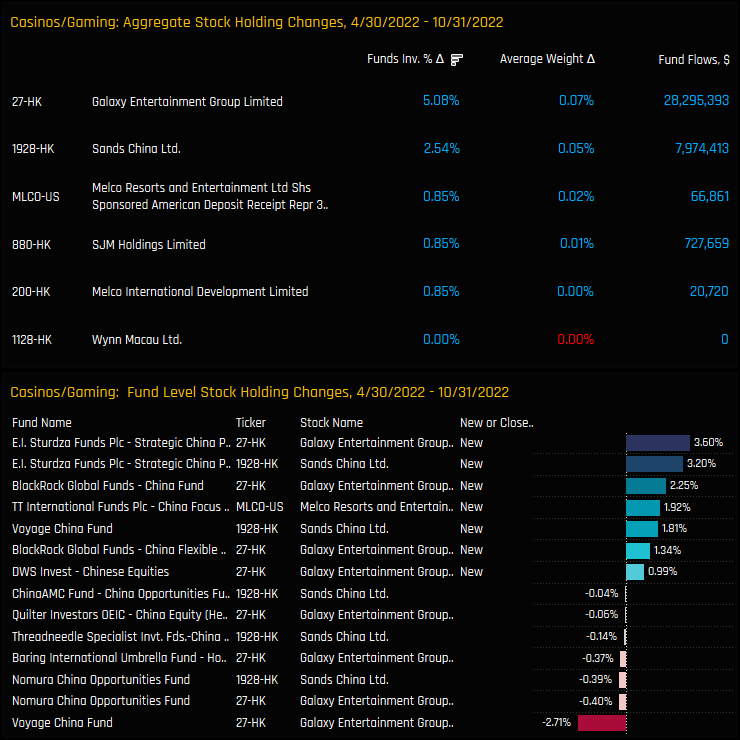
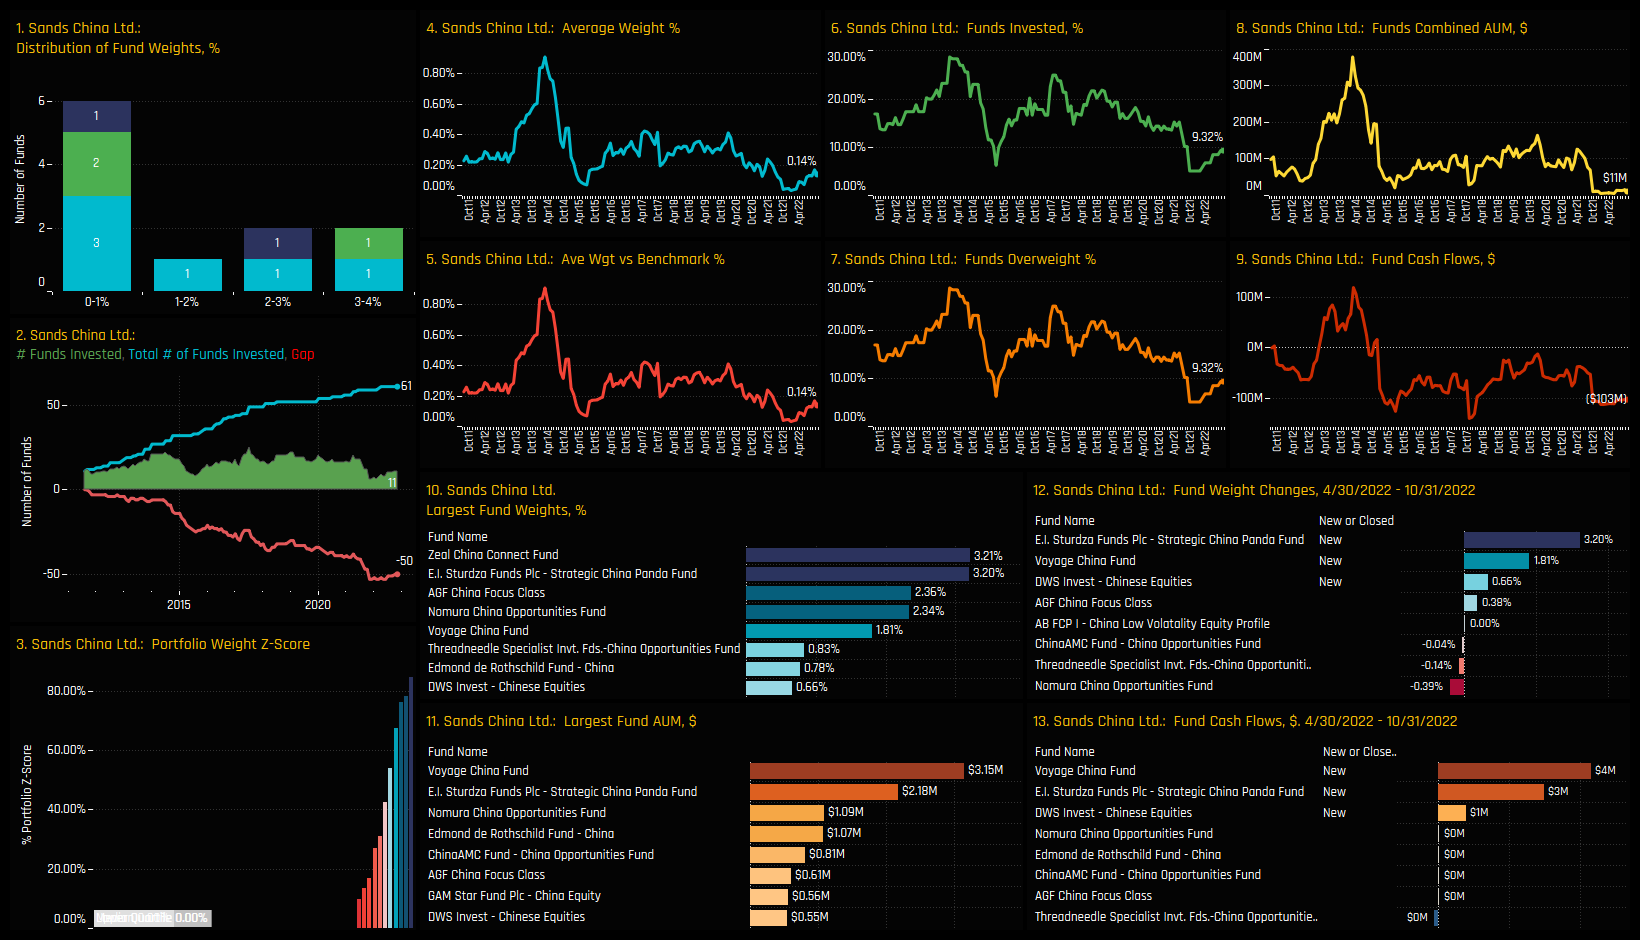
Of the 6 stocks that make up investment in the China Casino/Gaming industry group, only Galaxy Entertainment Group and Sands China Ltd have found any kind of sizeable investment from active China investors. Galaxy Entertainment is the most widely held, owned by 15.25% of managers at an average weight of 0.29%. High conviction positions are led by Zeal China Connect and E.I Sturdza in Galaxy Entertainment Group.
Changes in stock ownership over the last 6-months have been positive. A further +5.08% of funds bought in to Galaxy Entertainment Group Limited and +2.54% in to Sands China. There was not a single closure of any stock holding within the industry group over the period.
Conclusions & Data Report
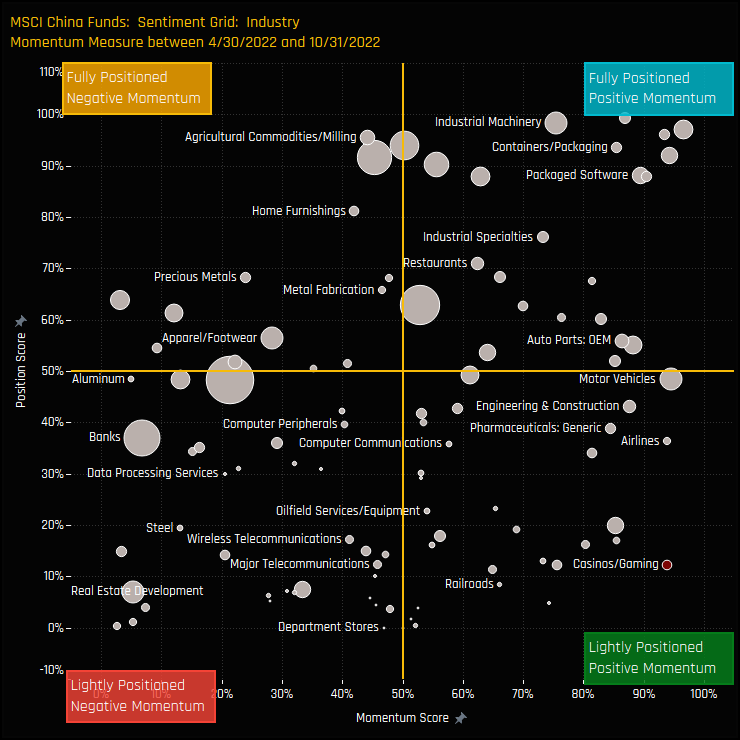
It’s early days, but sentiment is improving towards China’s Casino/Gaming industry group. The sentiment grid opposite shows where current positioning in each industry group sits versus its own history going back to 2011 on a scale of 0-100% (y-axis), against a measure of fund activity for each industry between 04/30/2022 and 10/31/2022 (x-axis). Casinos/Gaming sits in the bottom-right quadrant, indicative of near record low positioning but strong manager rotation.
Today’s small crop of holders are very much going against the grain, with the majority of active China investors maintaining no exposure at this point. There is clearly massive scope for investment levels to increase from here.
Please click on the link below for an extended data report on the Casinos/Gaming sector among China active equity funds. Scroll down for ownership profiles on Galaxy Entertainment Group and Sands China Ltd and for more analysis on China fund positioning.
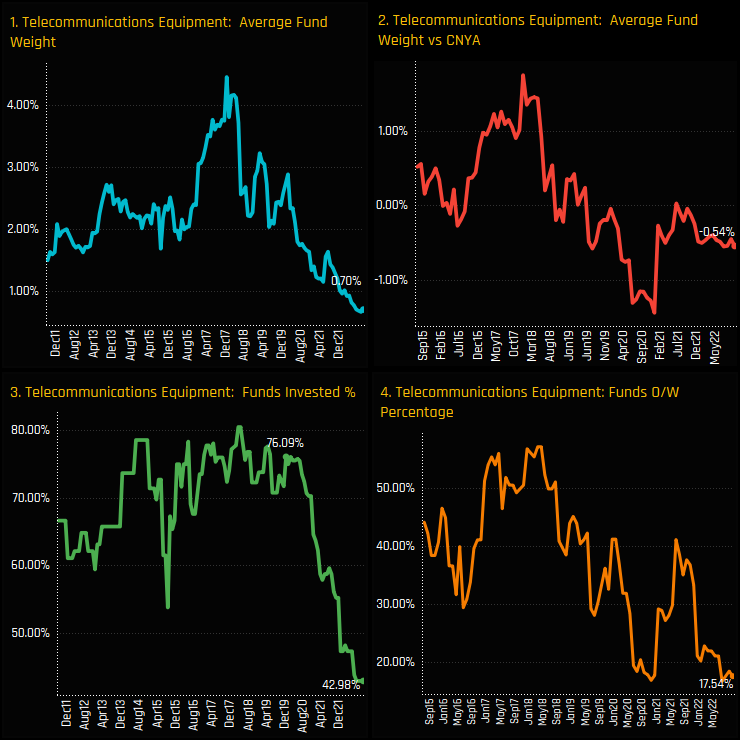
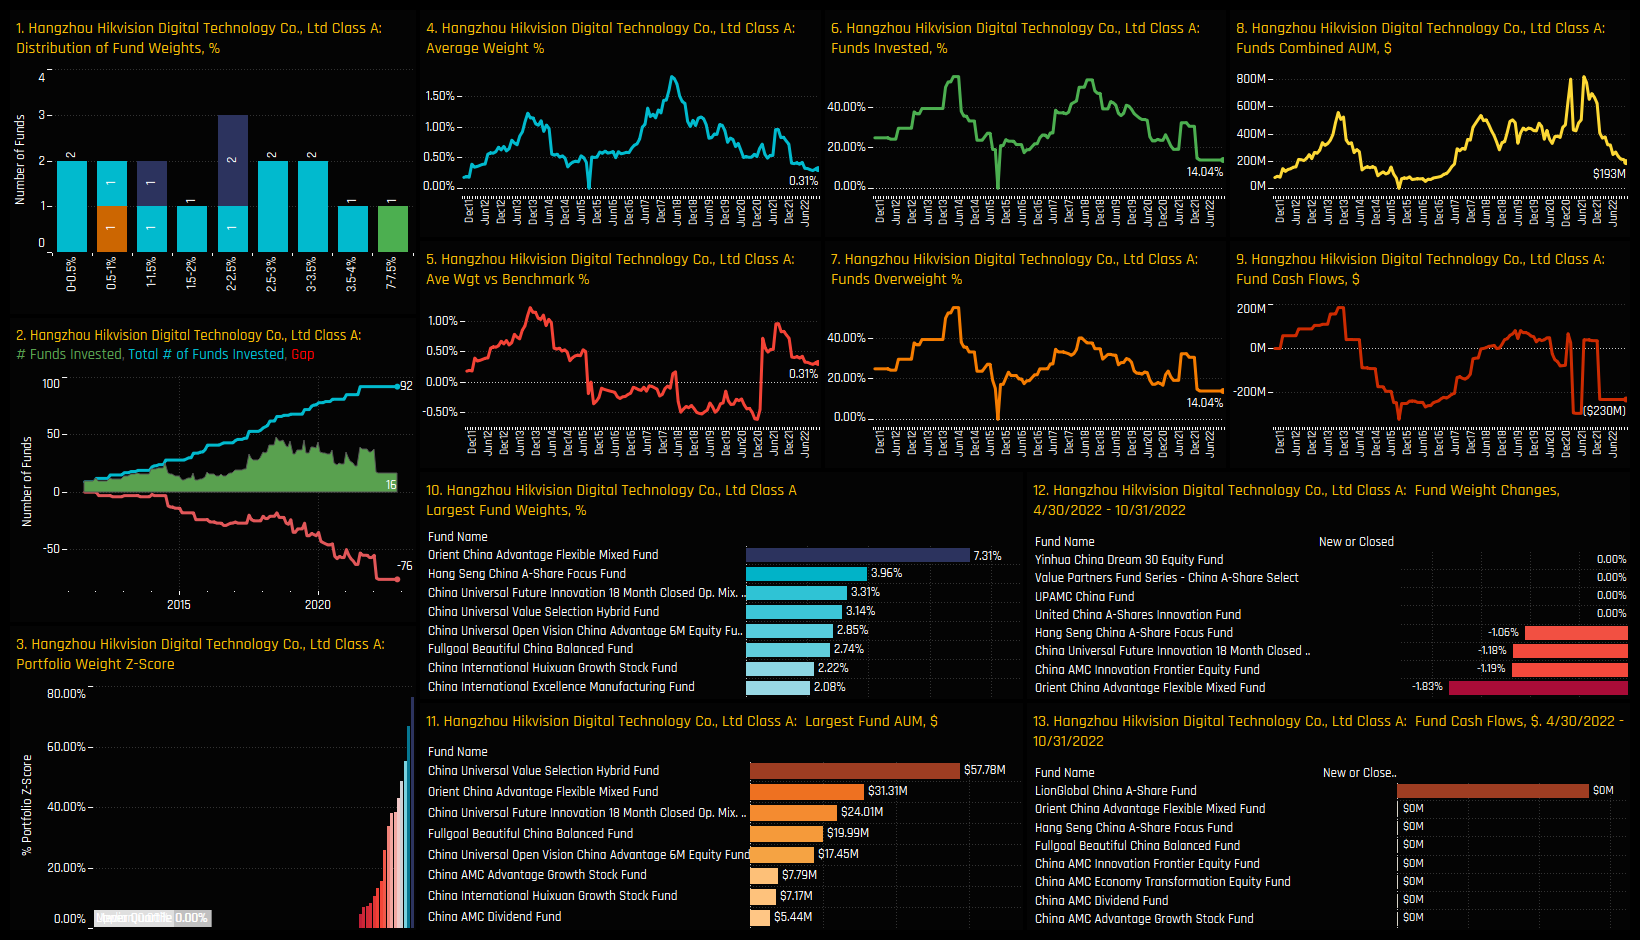
Fund allocations in the A-Share Telecommunications Equipment sector have fallen to new all-time lows this month. Outright ownership in the sector hit a low of 43% of funds invested this month (ch3), with just 17.4% overweight the iShares CNYA ETF (ch4). From a once significant weight of over 4% back in 2017, average holding weights have fallen to just 0.70%.
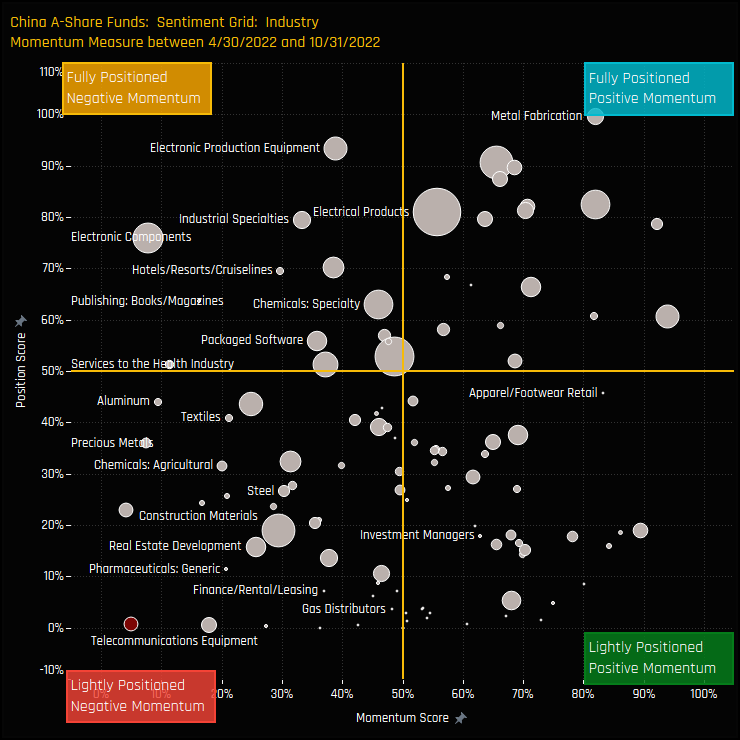
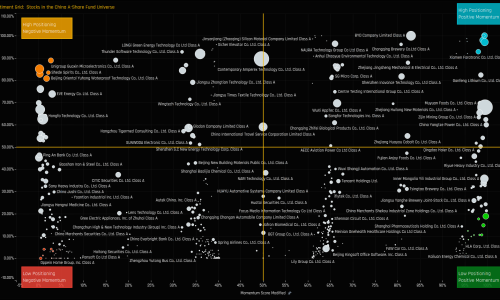
The sentiment grid below shows where current positioning in each industry sits versus its own history going back to 2011 on a scale of 0-100% (y-axis), against a measure of fund activity for each industry between 04/30/2022 and 10/31/2022 (x-axis). Telco Equipment is as far to the bottom-left hand corner as it gets. Sentiment is the worst among every industry group in the A-Share universe.
Fund Holdings & Activity
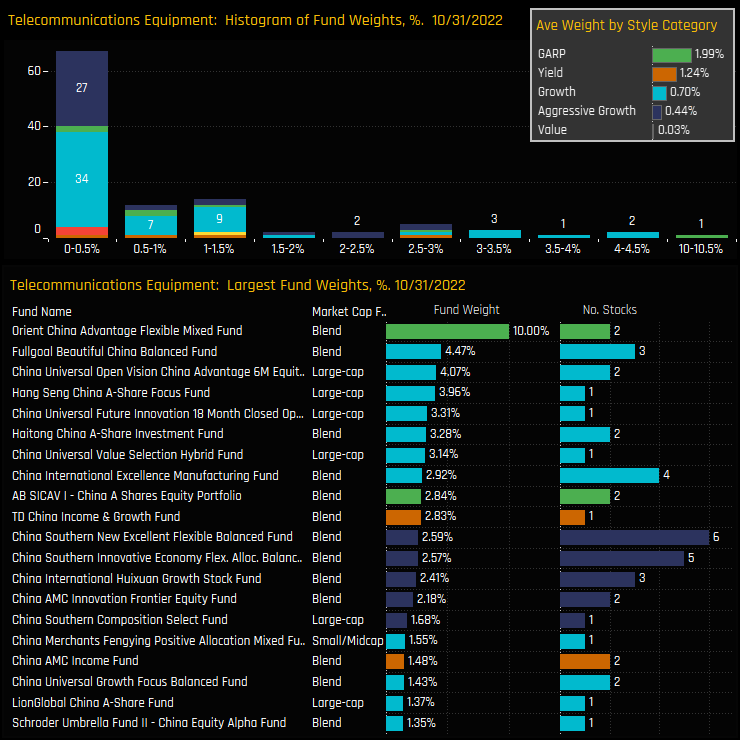
Of the 43% of managers who have exposure to the sector, most hold less than a 0.5% weight, with an extended right-side tail that is bumping up the averages. On a Style basis, GARP investors are the most heavily allocated, though again bumped higher by Orient China Advantage’s 10% allocation.
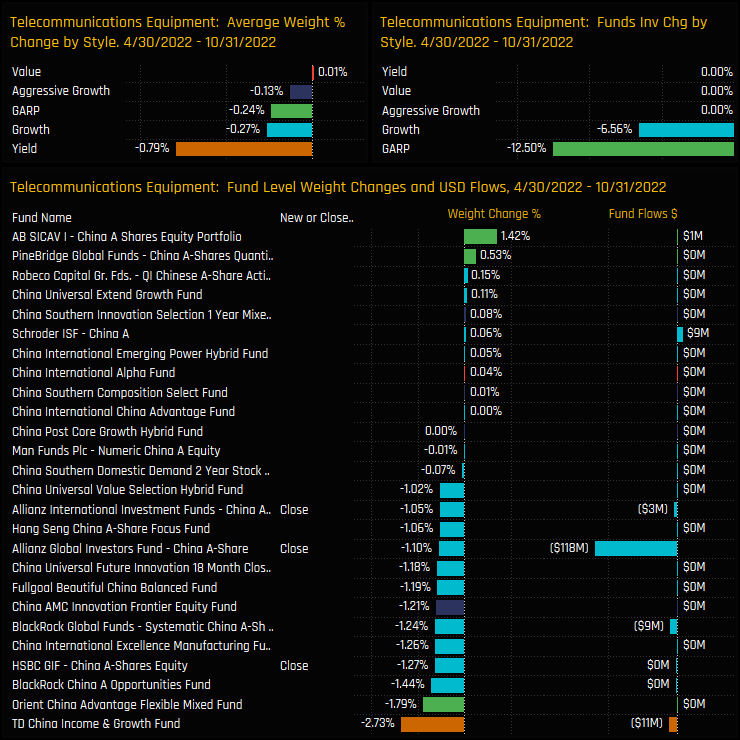
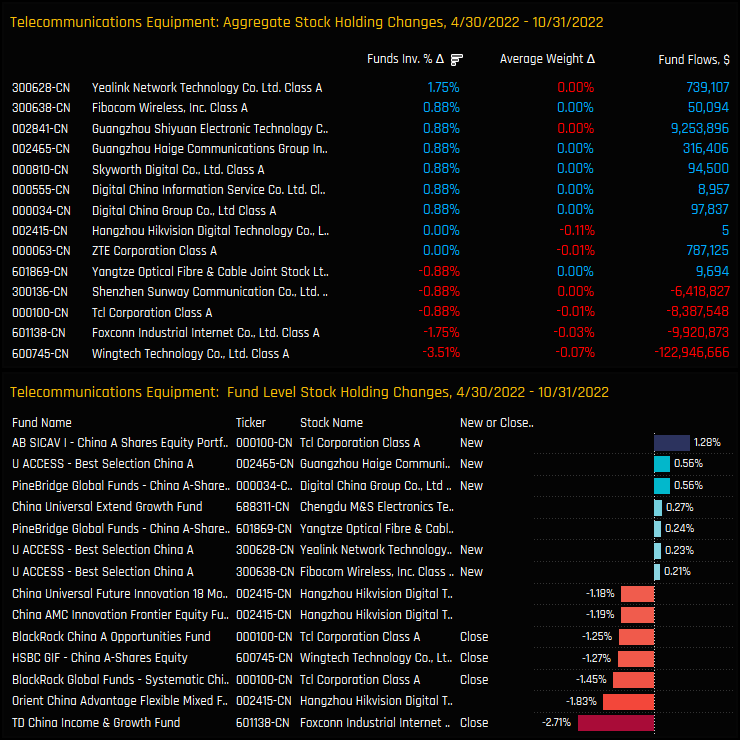
There were no position openings in the sector over the last 6-months, but multiple closures from a number of GARP and Growth funds, led by HSBC A-Share Equity (-1.27%) and Alliance Bernstein China A-Share (-1.10%).
Stock Holdings & Activity
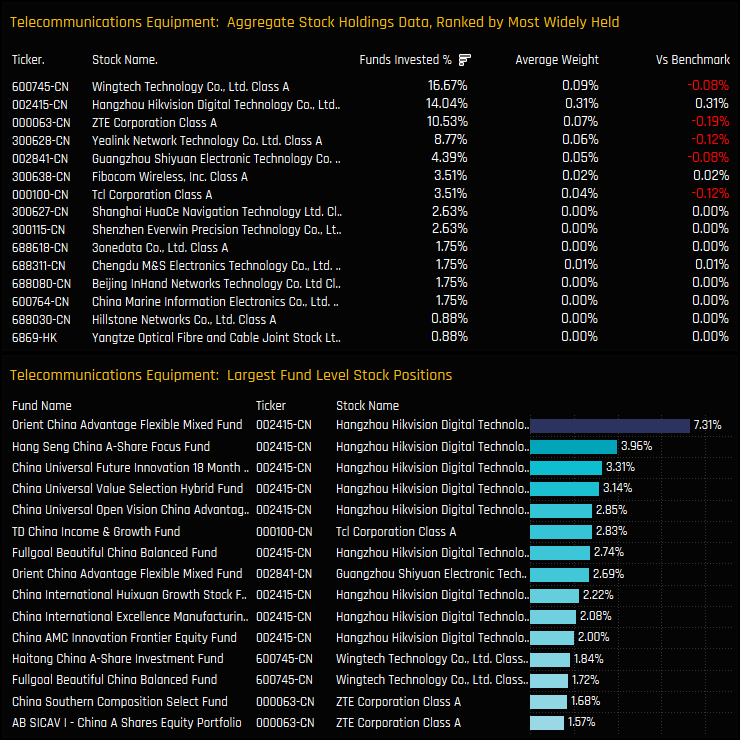
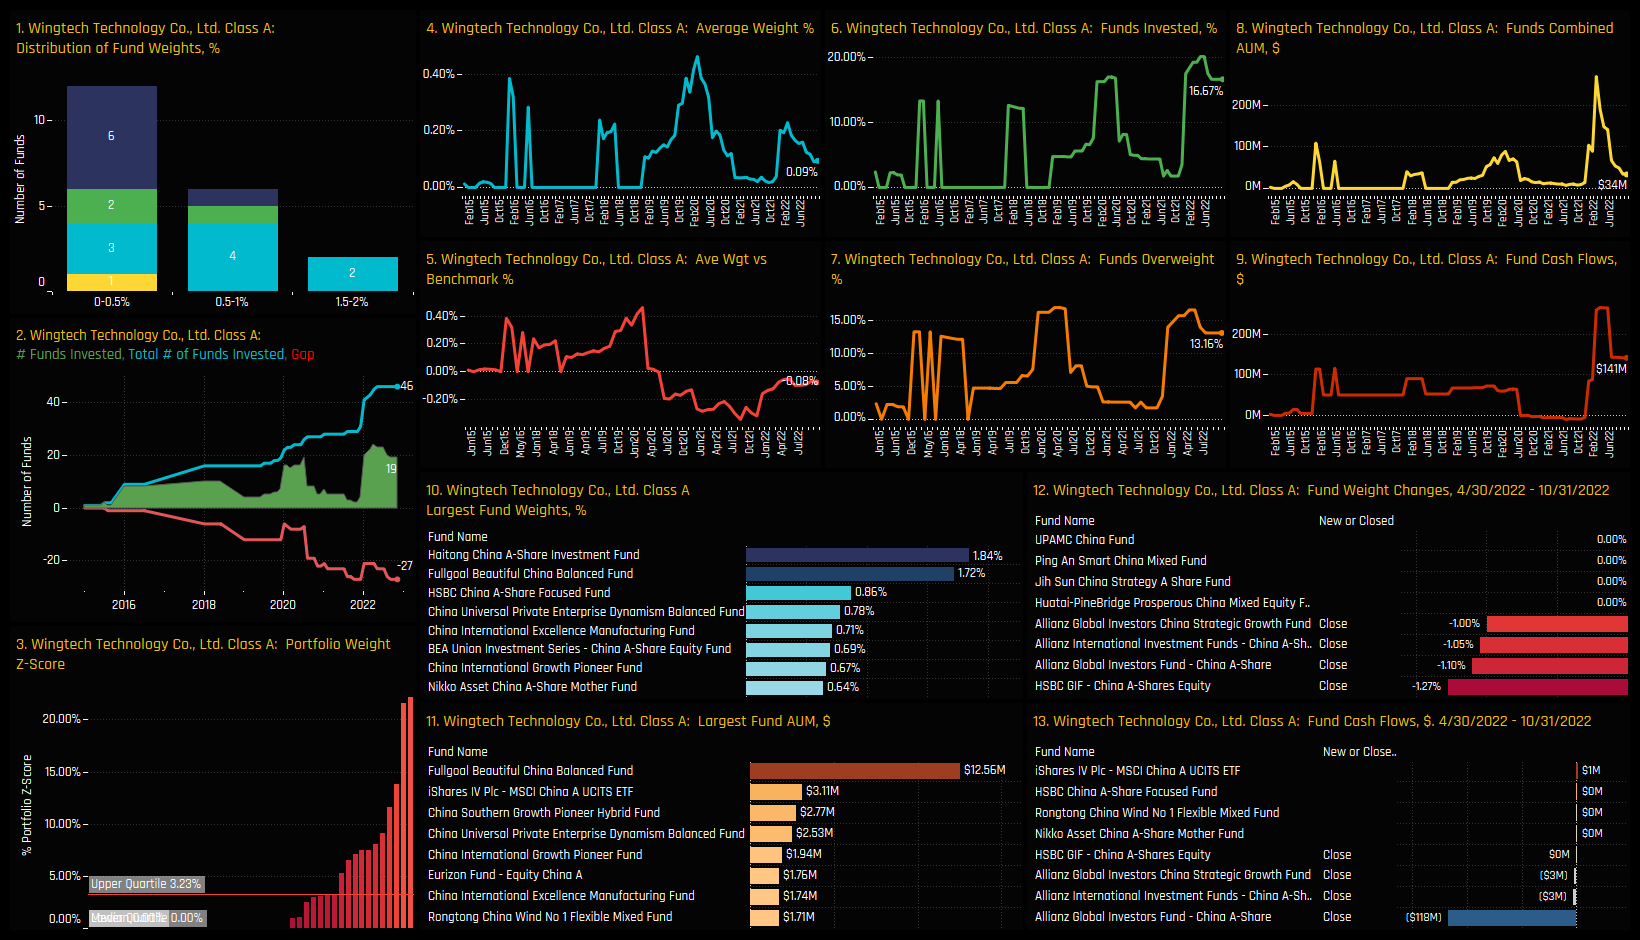
On a stock level, Hangzhou Hikvision Digital Technology is the conviction holding, owned by 14.04% of managers at an average weight of 0.31%, whilst dominating the list of high conviction holdings. Wingtech Technology Co is held by more of the A-Share funds in our analysis, but weights are much smaller in magnitude. Underweights are led by ZTE Corporation, Yealink Network Technology and Tcl Corporation.
Activity between 04/30/2022 and 10/31/2022 was skewed to the sell-side, with -3.51% of funds closing exposure to Wingtech Technology Co and -1.75% to Foxconn Industrial Internet Co. On a fund level, managers were active in Tcl Corporation, with AB China A-Shares Equity opening exposure as BlackRock Systematic China and China A Opportunities both closed.
Conclusions & Data Report
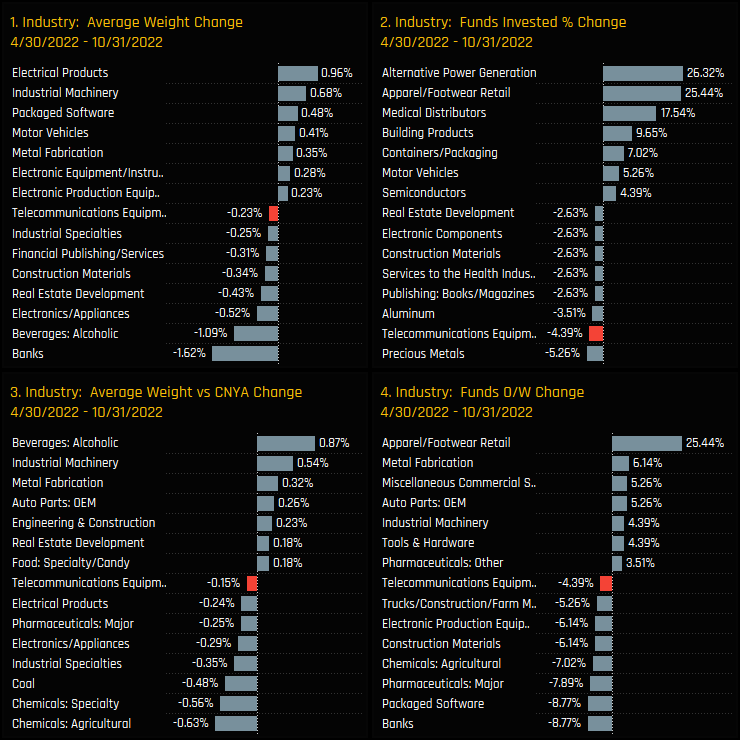
The chart to the right shows the industry level ownership changes for A-Share funds over the last 6-months. A-Share investors continue to scale back allocations in Telecommunications Equipment stocks in preference to other industries, most notably Metal Fabrication, Motor Vehicles and Industrial Machinery. Underweight, underowned and with sentiment at rock bottom, China A-Share managers seem fairly convinced of future underperformance.
Please click on the link below for an extended data report on the Telecommunications Equipment sector among China A-Share active equity funds. Scroll down for ownership profiles on Hangzhou Hikvision Digital Technology and Wingtech Technology Co and for more analysis on China fund positioning.
Stock Profile: Hangzhou Hikvision Digital Technology
Stock Profile: Wingtech Technology Co
45 Active Greater China Funds, AUM $13bn
Alibaba: Fighting Back
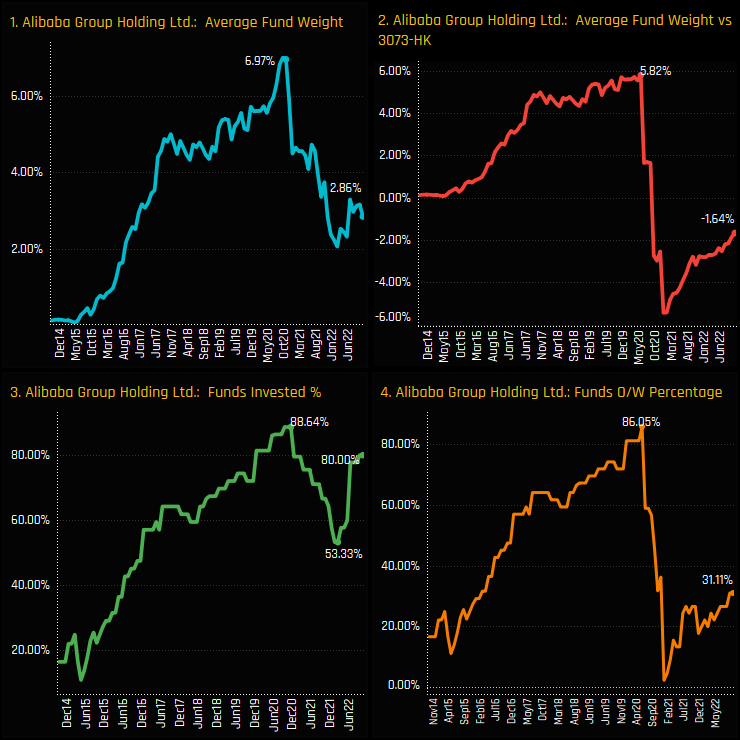
Ownership in Alibaba Group Holdings is on the rise among active Greater China managers. Peaking in October 2020 at 88.6% of funds invested, the subsequent Tech crackdown saw investors cut exposure, bottoming out at just 53.3% of funds invested in February of this year. The stock price falling below $100 appeared to be a catalyst for active Greater China managers to buy back in, with a sharp intake of new exposure in the proceeding months.
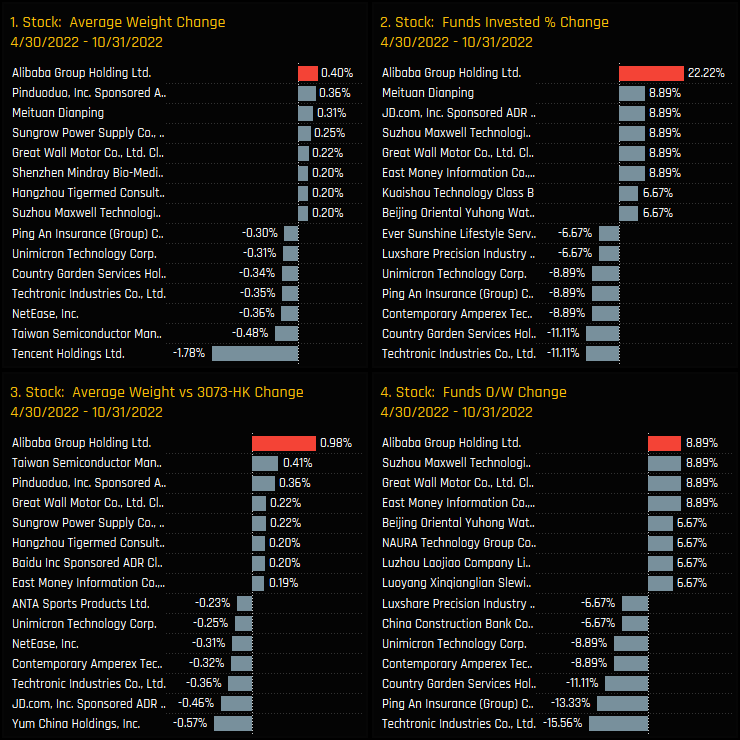
Measuring stock activity over the last 6-months confirms this heavy rotation in to Alibaba. Across our 4 ownership metrics, Alibaba has captured the largest increases in both absolute and relative to benchmark positioning among Greater China peers. Of particular note is the increase in the percentage of funds invested of +22.2% and the decrease in underweight of +0.98%. This is an aggressive active rotation.
Peer Group Positioning
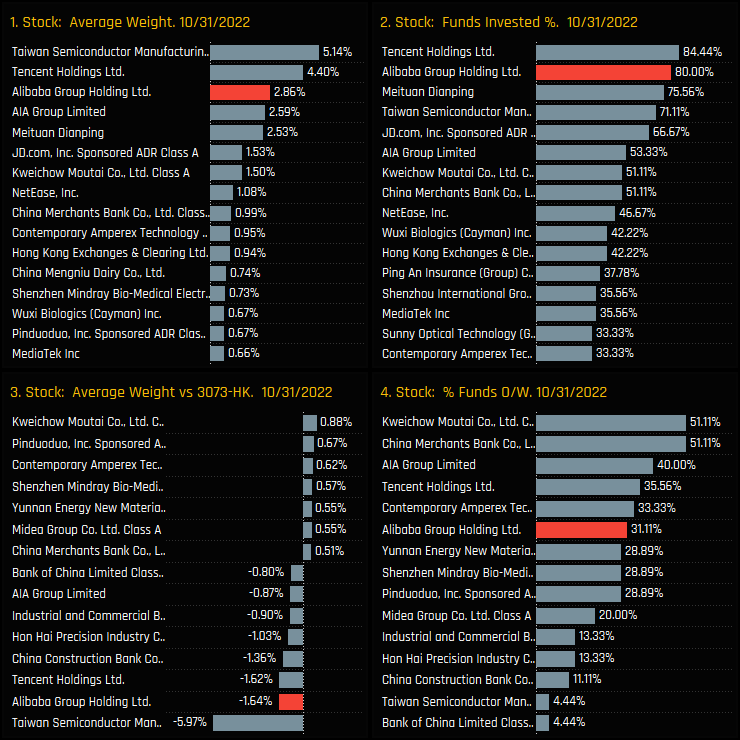
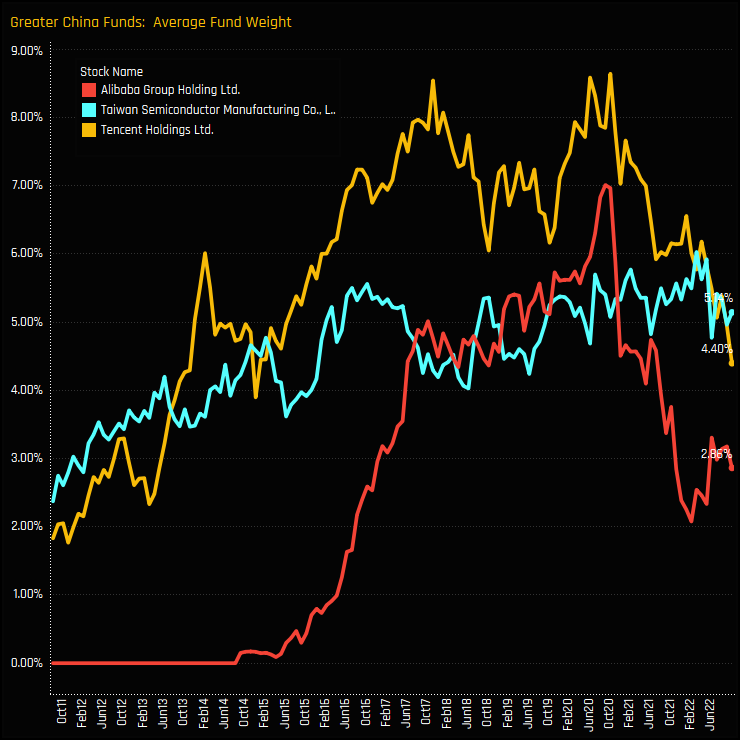
Despite this rotation, Alibaba is well behind both TSMC and Tencent Holdings on an average weight basis (ch1), though is more widely held than TSMC (ch2). Versus the benchmark, Alibaba is the 2nd largest underweight after TSMC, offsetting overweights in Kweichow Moutai, Pinduoduo and Contemporary Amperex Technology (ch3).
The time-series of average fund weights for the top 3 stocks highlights the fall from grace of both Tencent and Alibaba since October 2020, with TSMC taking the top spot just this month.
Fund Holdings & Activity
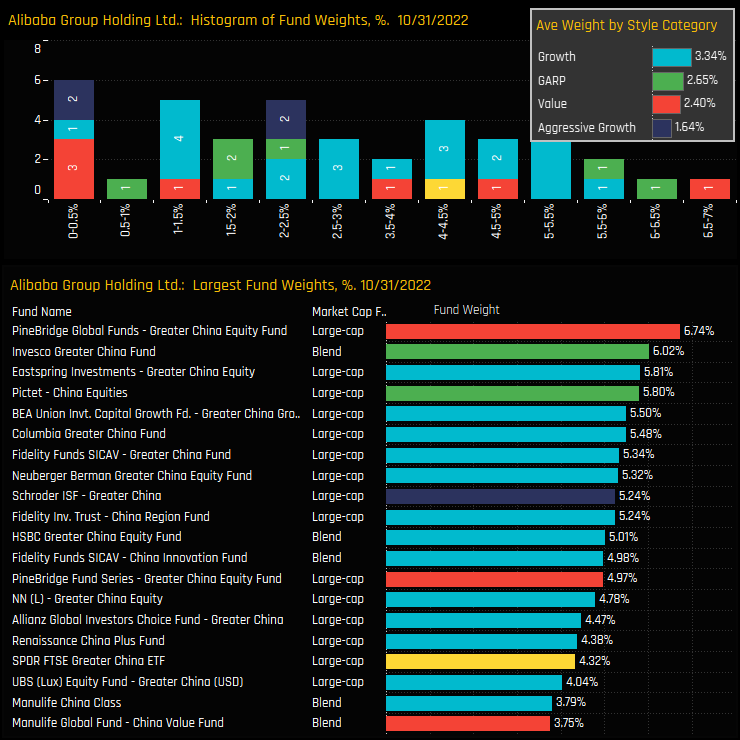
Individual fund holdings in Alibaba are spread over a wide range, with no specific peak in the distribution. The difference between the average Growth fund weight (3.34%) and the average Aggressive Fund weight (1.64%) is stark, whilst GARP and Value funds are similarly allocated at 2.65% and 2.4% respectively.
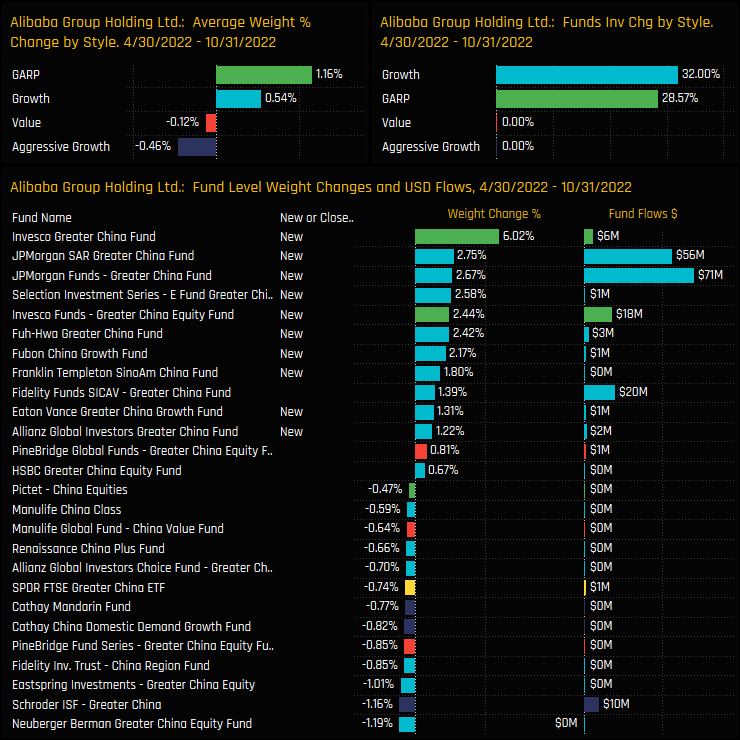
The funds behind the Alibaba rotation are shown in the table below and dominated by Growth and GARP investors. New positions from Invesco Greater China (+6.02%), JP Morgan Greater China (+2.75%)and E Fund Greater China (+2.58%) head a total of 10 funds opening exposure to the name between 04/30/2022 and 10/31/2022.
Conclusions & Data Report
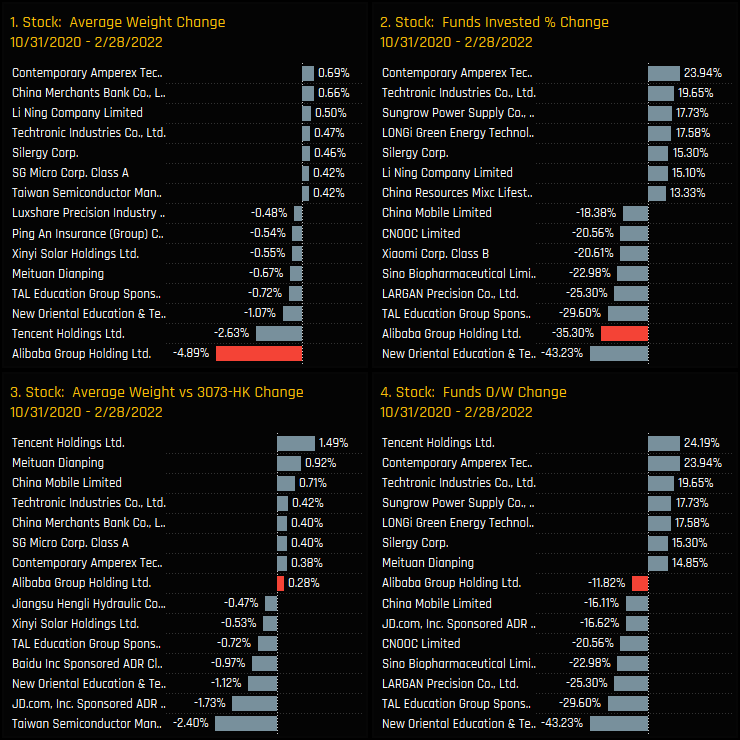
There appears to be a strong desire among active Greater China investors to re-engage with Alibaba Group Holdings at these levels. It has certainly suffered more than most during the China sell-off. The chart to the right shows the stock ownership changes from the peak in October 2020 to the trough in February 2022 – Greater China managers exited Alibaba en-mass. It may take time to return to previous highs, if indeed we ever get there, but the path to redemption has started.
Please click on the link below for an extended data report on Alibaba Group Holdings among Greater China active equity funds. Scroll down for links to the latest fund positioning reports for our active China fund universes.
For more analysis, data or information on active investor positioning in your market, please get in touch with me on steven.holden@copleyfundresearch.com


