Asia Ex-Japan Fund Positioning Analysis, November 2022
In this issue:
Asia Ex-Japan Sector Rotation
Oil Refining/Marketing All-Time Highs
Singapore Telecommunications: Demand Surge
92 Active Asia Ex-Japan Funds, AUM $49.5bn
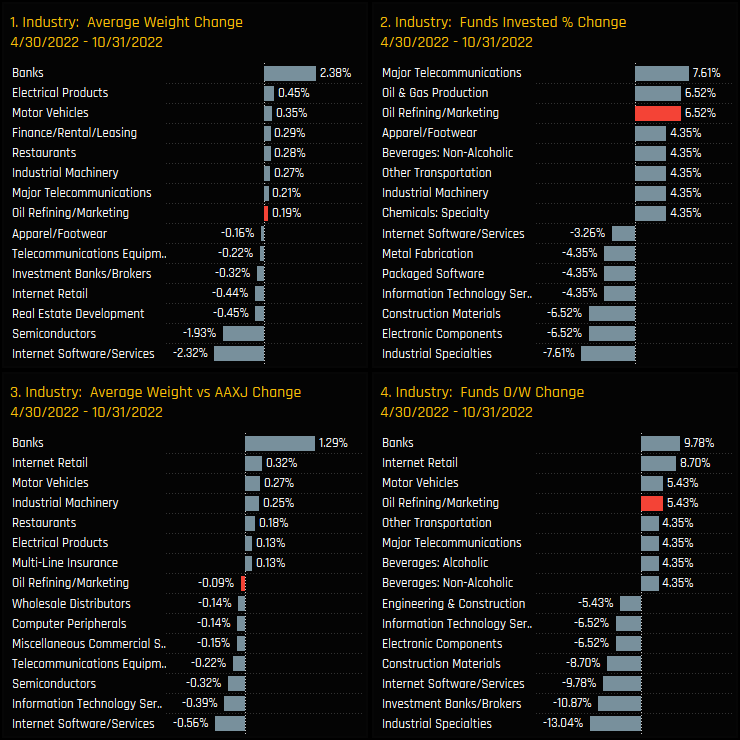
Sector Rotation
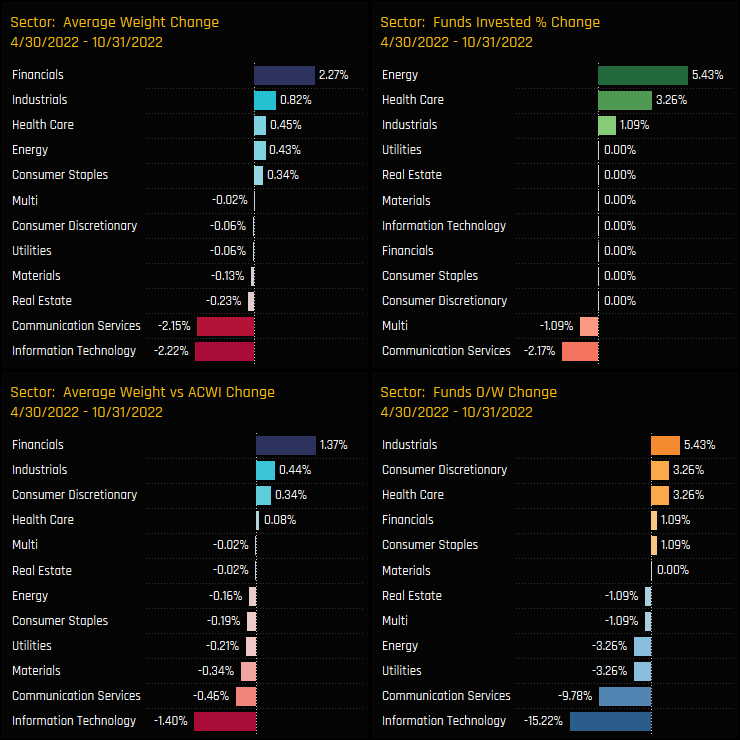
The make-up of sector positioning among active Asia Ex-Japan investors is changing. Over a period of just 6-months, average weights in the Communication Services and Information Technology sectors have fallen by a combined -4.37%, with weights relative to benchmark falling by a combined -1.86%. Instead, Asia Ex-Japan managers have increased weights in Financials and Industrials, with smaller gains seen in Energy, Health Care and Consumer Staples.
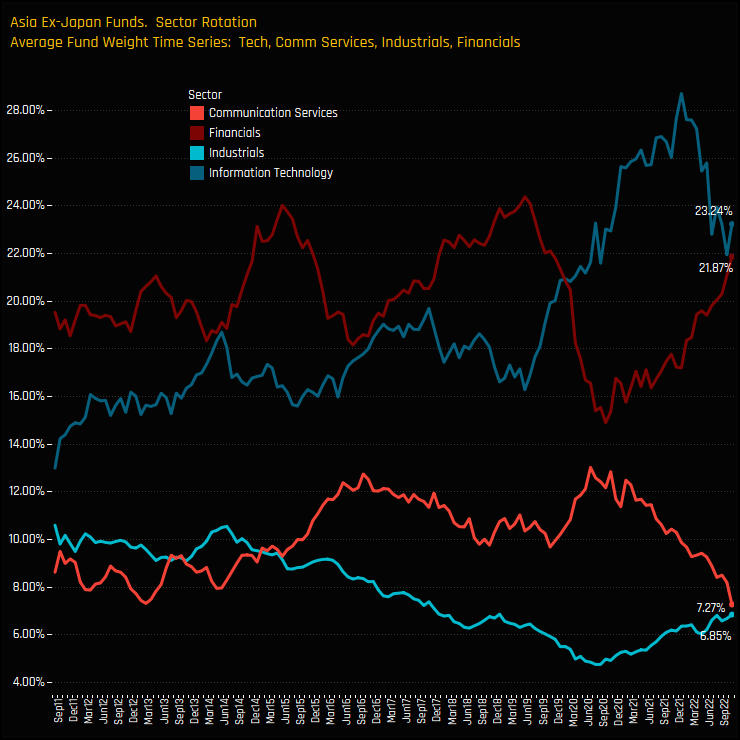
The longer term allocations for the 4 sectors at the forefront of this rotation are shown in the chart below. It shows a reverse correlation between Information Technology and Financials, with both vying for top spot over the last decade and a switch in leadership around the time of the COVID-19 pandemic. Industrials and Communication Services share a similar relationship, with the long-term decline in Industrials starting to reverse as Communication Services allocations take a severe decline.
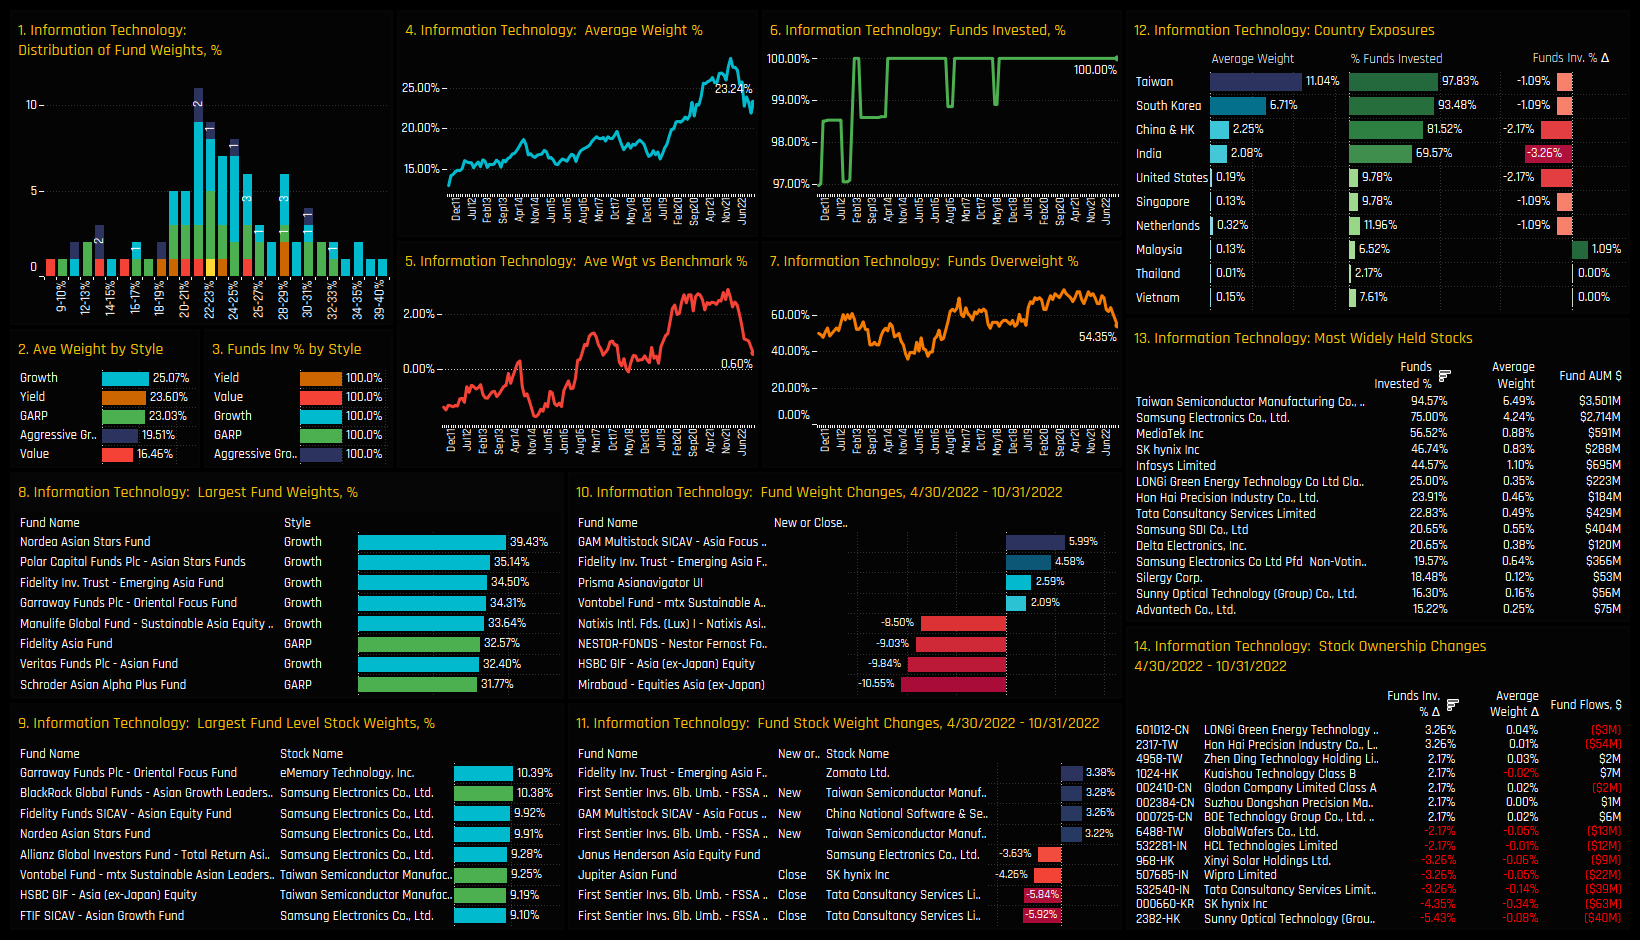
Information Technology
The charts below provide granular detail on the make-up of Information Technology positioning among Asia Ex-Japan active funds. The majority of funds hold between 20%-26% in the Tech sector (ch1), with a right-sided skew that features the Growth led funds of Nordea Asian Stars (39.43%), Polar Capital Asian Stars (35.14%) and Fidelity Emerging Asia (34.5%). The average allocation has fallen from a high of 28.7% at the end of last year to 23.24% today, with the overweight dropping from +2.91% to +0.6% over the same period.
Chart 12 shows the latest country allocations within the Tech sector and the changes in funds invested between 04/30/2022 and 10/31/2022. The decline has been led by Indian and China Tech, with -3.26% and -2.17% of funds closing exposure respectively. Taiwan Tech dominates the sector with nearly twice the allocation of South Korea. On a stock level, closures in Sunny Optical Technology, SK Hynix and Tata Consultancy Services were some of the key drivers behind the Tech decline.
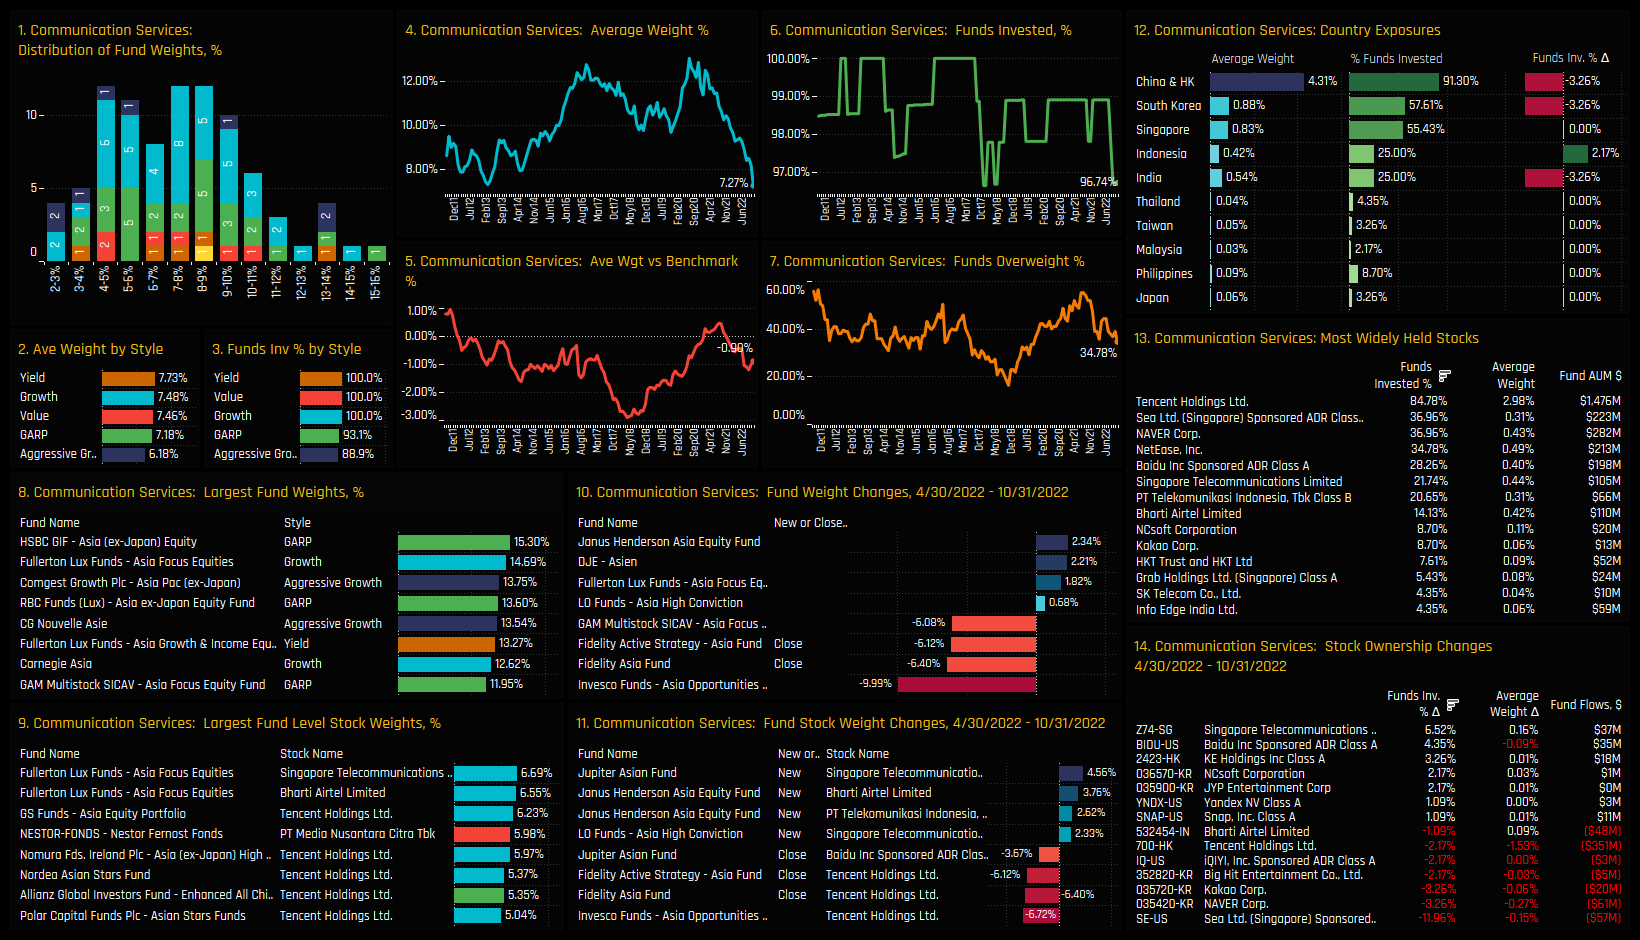
Communication Services
Average fund weights in the Communication Services sector are at their lowest levels since our records begin in 2011. Fund weights in the sector are clustered around the 4%-10% level and are led by Yield, Growth and Value funds. Significant weight reductions from Invesco Asia Opportunities (-9.99%) and outright closures from Fidelity Asia (-6.4%) contributed to the declines. China & HK dominates the holdings picture, though 3.26% of funds closed out exposure over the last 6-months.
Tencent remains the dominant holding by some margin, held by 85% of managers at an average weight of 2.98%. The recent declines were led by Sea Ltd as 11.96% of managers closed positions, alongside Kakao Corp (-3.26%) and Naver Corp (-3.26%). It wasn’t all one-way traffic though, with Singapore Telecommunications and Baidu Inc attracting investment from a further 6.5% and 4.35% of funds respectively over the last 6-months.
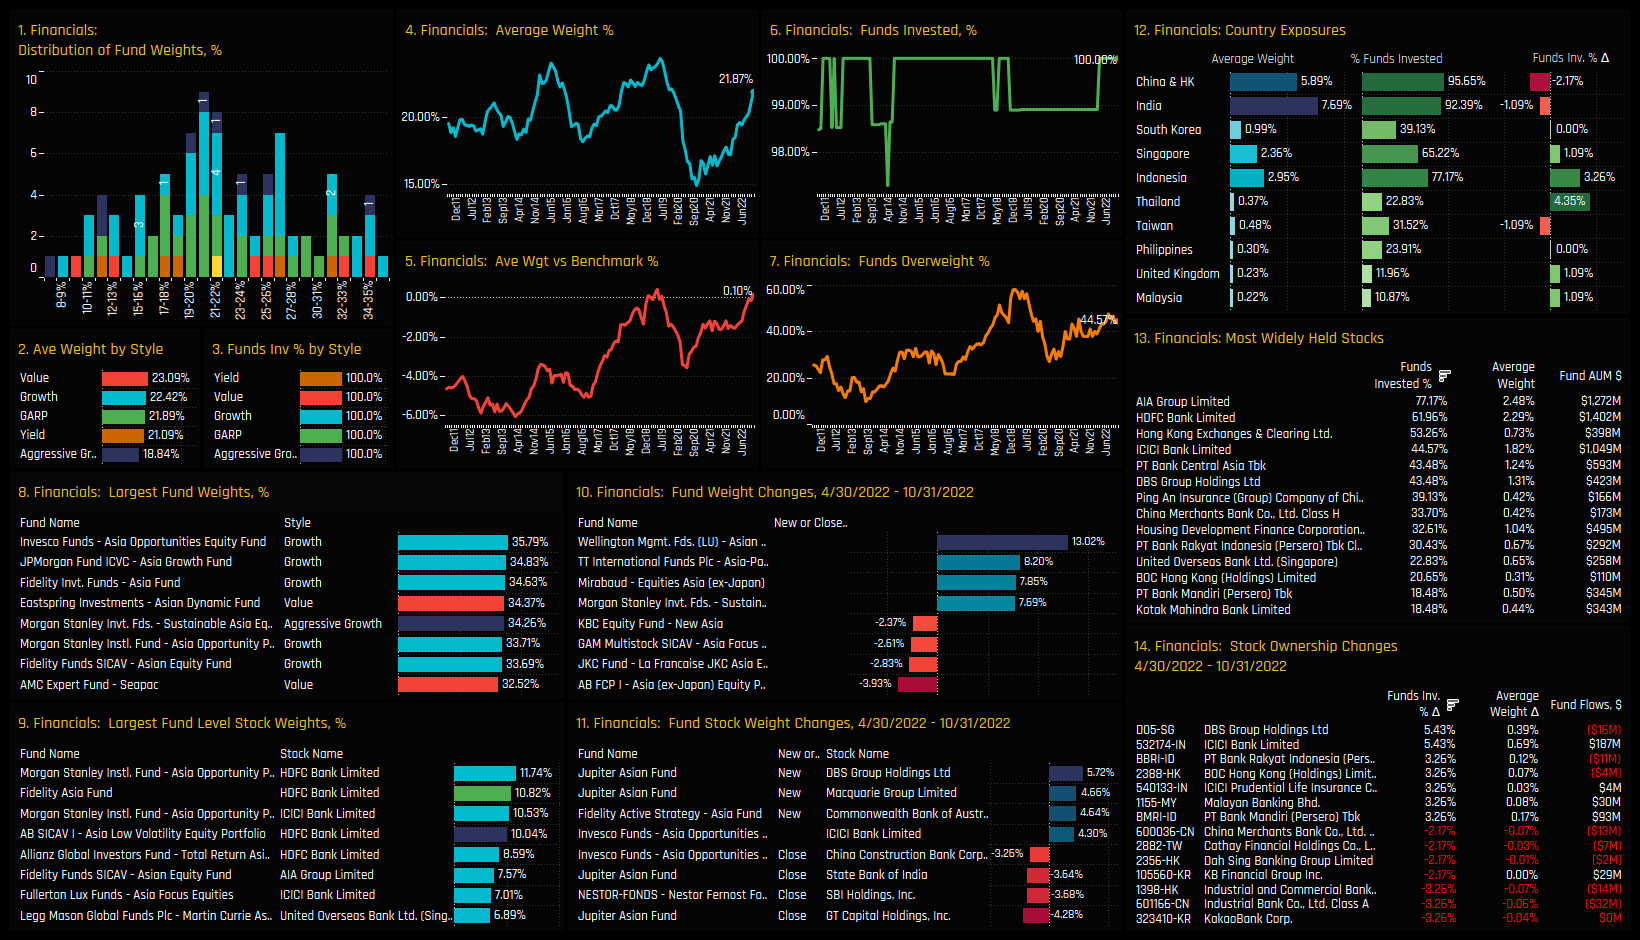
Financials
Asia Ex-Japan managers keep on increasing exposure to the Financials sector. Average weights are back towards the top end of the range at 21.9%, with managers switching from a net underweight of -1.4% at the start of the year to overweight +0.1% today. Top allocators are Invesco Asia Opportunity on 35.8% and JP Morgan Asia Growth on 34.8%, with the majority of Asia Ex-Japan funds holding between 17% and 27%.
On a country level, China and India dominate but the recent rotation has come from Thailand and Indonesian Financial stocks, with +4.35% and +3.26% of funds opening positions over the last 6-months respectively. AIA Group and HDFC Bank are the most favoured stocks in the sector, held by 77.2% and 62% of funds respectively. Stocks driving allocations higher were led by DBS Group, ICICI Bank and PT Bank Rakyat.
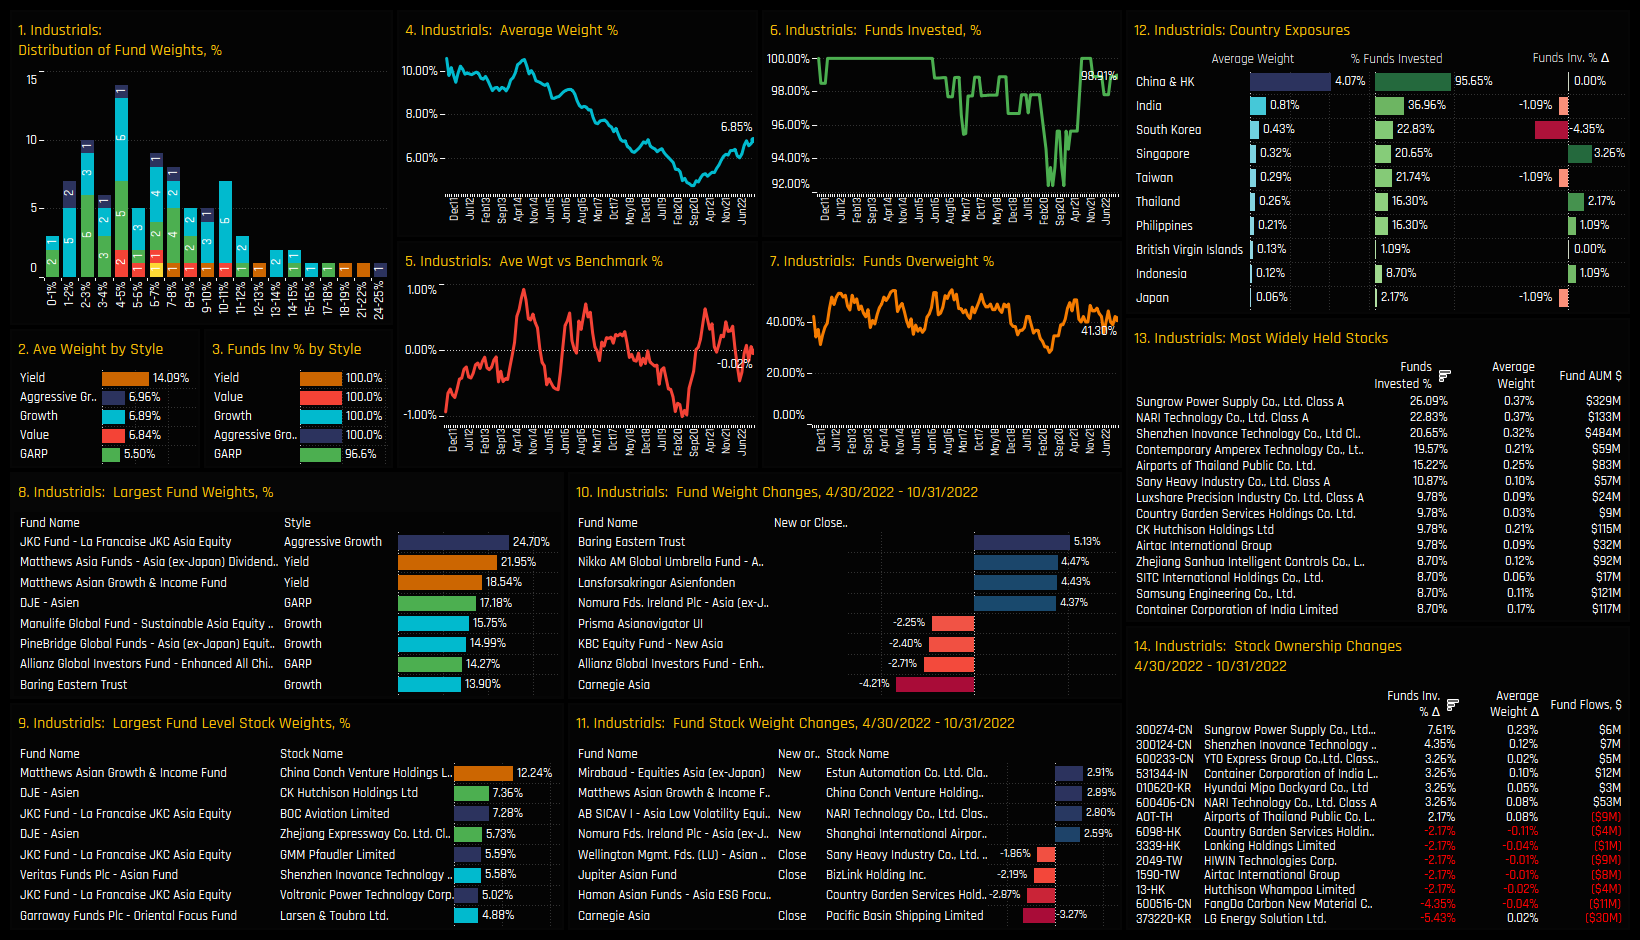
Industrials
The long-term structural decline in Industrials allocations lasted from early 2014 to late 2020, with average weights falling from over 10% to just 4.8% over that period. Since then, Asia Ex-Japan managers have re-engaged with the sector, with the current average holding weight of 6.85% the highest since Dec 18. The majority of funds hold less than the benchmark 6.87% weight, but an extended tail to the upside, led by JKC Asia Equity (24.7%) and Matthews Asia Ex-Japan Dividend Fund (21.95%) skews the averages higher.
Activity over the last 6-months has been skewed to the buy-side, but not exclusively so within the sector. Increases in ownership in Singapore, Philippines and Thailand Industrials were offset by a large decline South Korean Industrials exposure. On a stock level, the trio of Sungrow Power Supply, NARI Technology and Shenzhen Inovance Technology are the most widely held stocks and saw good increases in ownership over the period. Active managers scaled back holdings in LG Energy Solutions and FangDo Carbon New Materials.
Conclusions & Data Reports
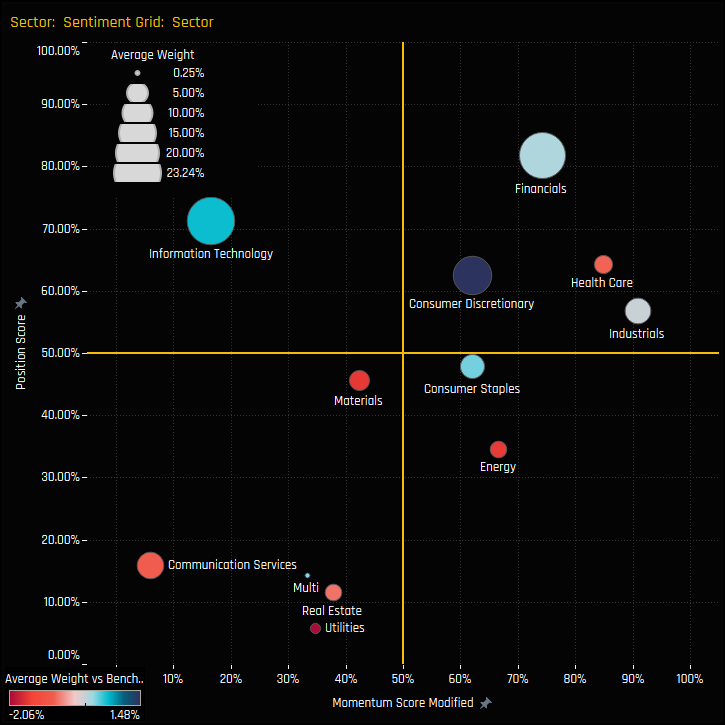
The sentiment grid to the right shows where current positioning in each sector sits versus its own history going back to 2011 on a scale of 0-100% (y-axis), against a measure of fund activity for each sector between 04/30/2022 and 10/31/2022 (x-axis). Of the 4 sectors analysed above, Communication Services is out on it’s own, suffering the heaviest fund rotation and near it’s lowest ebb in terms of positioning. Financials are at the opposite end of the spectrum, approaching all-time high allocations with continued strong growth in ownership over the last 6-months. We might expect the pace of rotation to slow in both sectors as positioning approaches the extremes at either end.
For Tech and Industrials the positioning picture is more interesting. Despite the recent reversal, Technology allocations are still towards the top-end of the 10-year range, with allocations back at the same levels as before the COVID-19 technology spike. This may act as some kind of support, but make no mistake that Technology is still the largest allocation in Asia Ex-Japan portfolios at 23.24% and an overweight for the majority, so there is still considerable room for other sectors to take market share. Finally Industrials, which despite their continued grind higher remain a minor allocation in Asia Ex-Japan portfolios. The opportunity set appears narrow, with only 3 stocks held by more than 20% of managers and China & HK accounting for 60% of total allocations. This may prohibited further ownership growth unless we see real leadership emerge from one of the more popular holdings.
Please click on the links below for extended data reports on the Tech, Communication Services, Financials and Industrials sectors.
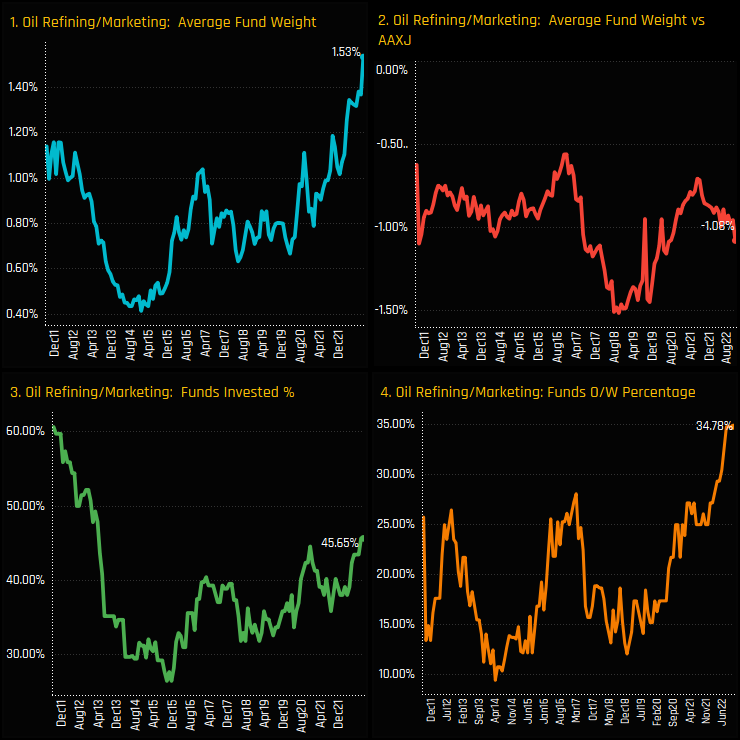
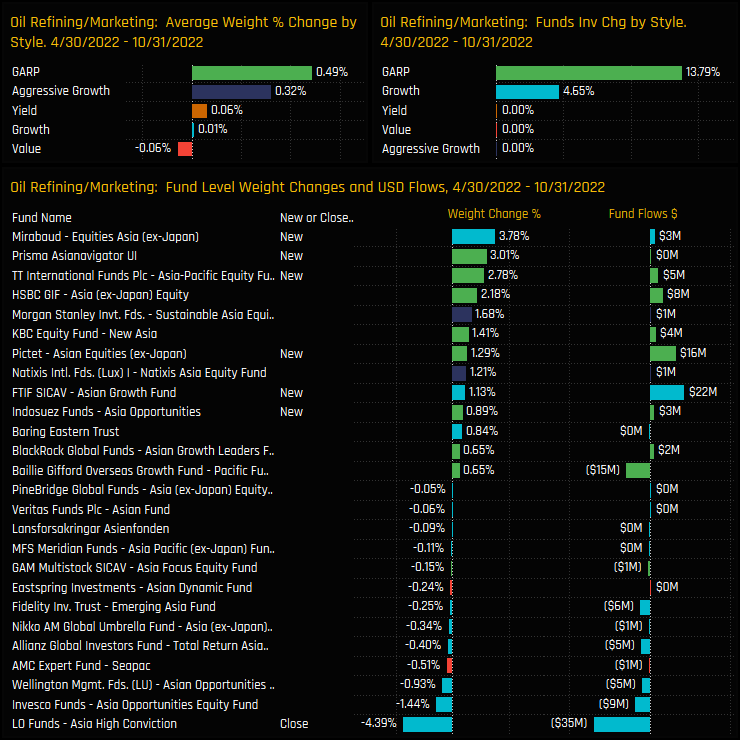
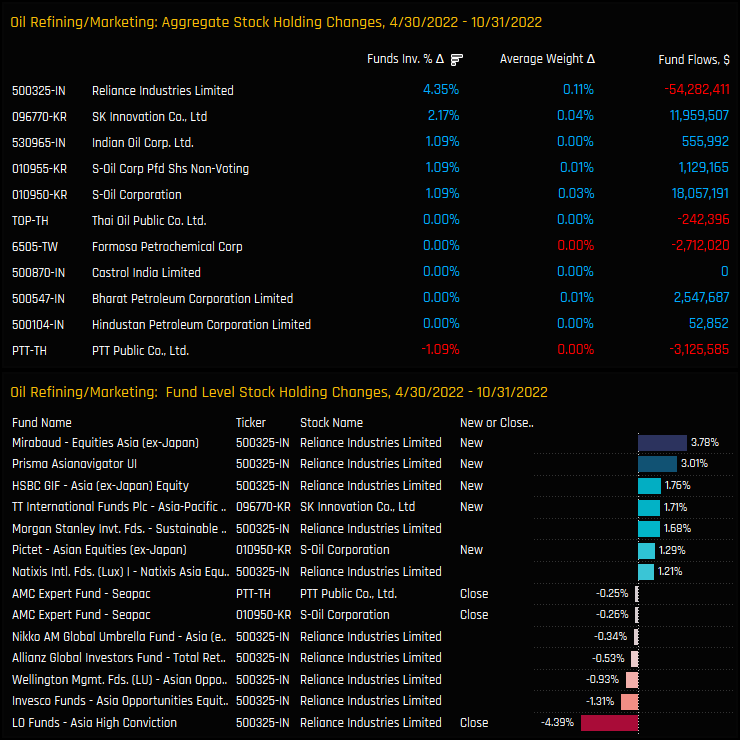
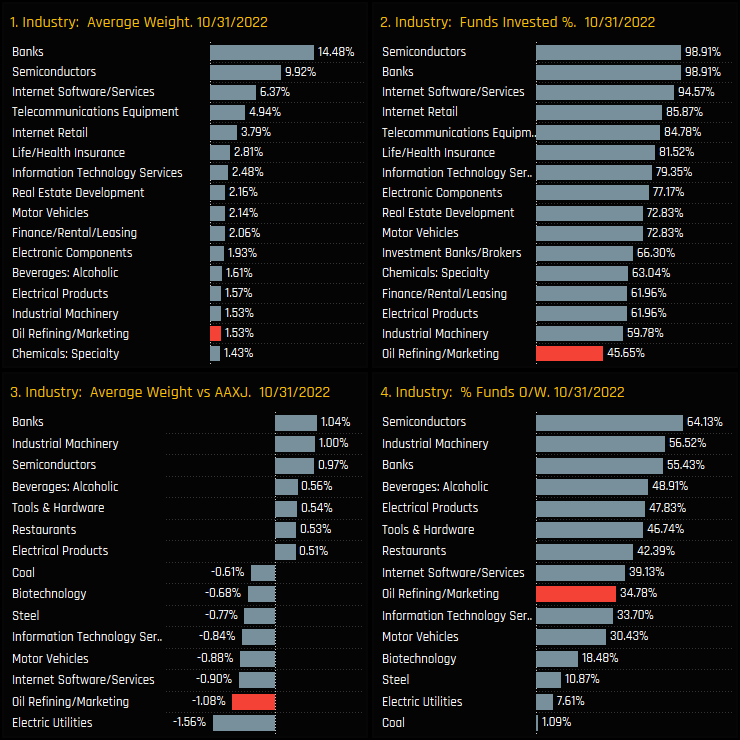
Fund allocations in the Oil Refining/Marketing industry group have soared to new all-time highs this month. Average fund weights hit a new peak of 1.53%, the percentage of funds overweight increased to a record 34.78% and the percentage of funds invested to a 9-year high of 45.65%. This lack of investment from 55% of managers leaves Asia Ex-Japan managers underweight the benchmark iShares AAXJ ETF by -1.08%, on average.
The rotation in to the Oil Refining/Marketing industry group has been among the strongest in the Asia Ex-Japan universe over the last 6-months. The increase in the percentage of funds invested was 2nd highest at +6.52%, with +5.43% moving to overweight. Despite this active rotation, industry outperformance also fueled increases in benchmark weights, pushing managers further underweight by -0.09% on average over the period.
Fund Holdings & Activity
The rotation was driven by GARP and Growth investors, with Mirabaud, Prisma and TT International adding new positions between 04/30/2022 and 10/31/2022. LO Funds were the only fund to close, with the balance of activity heavily skewed to the buy side.
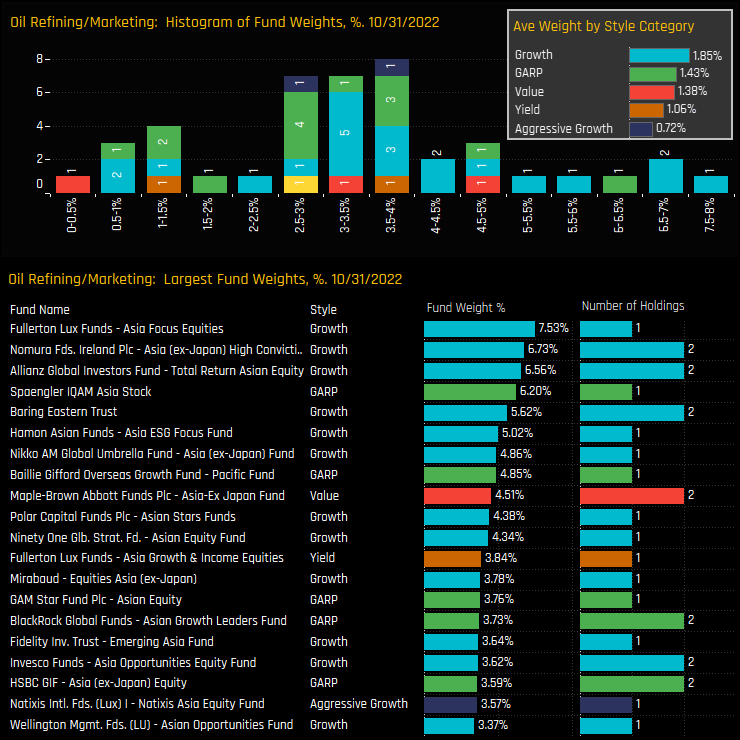
This leaves holders in the sector widely distributed, from a low of 0.4% to a high of 7.53% by Fullerton’s Asia Focus Fund. Again, Growth and GARP investors are the key holders, with most strategies holding only 1 or 2 stocks compared to the 9 held in the benchmark index.
Stock Holdings & Activity
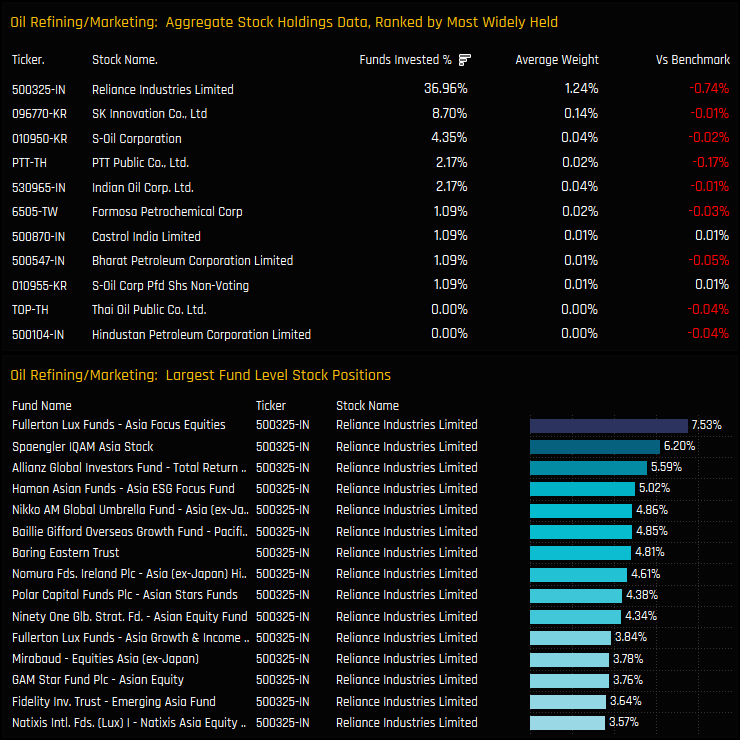
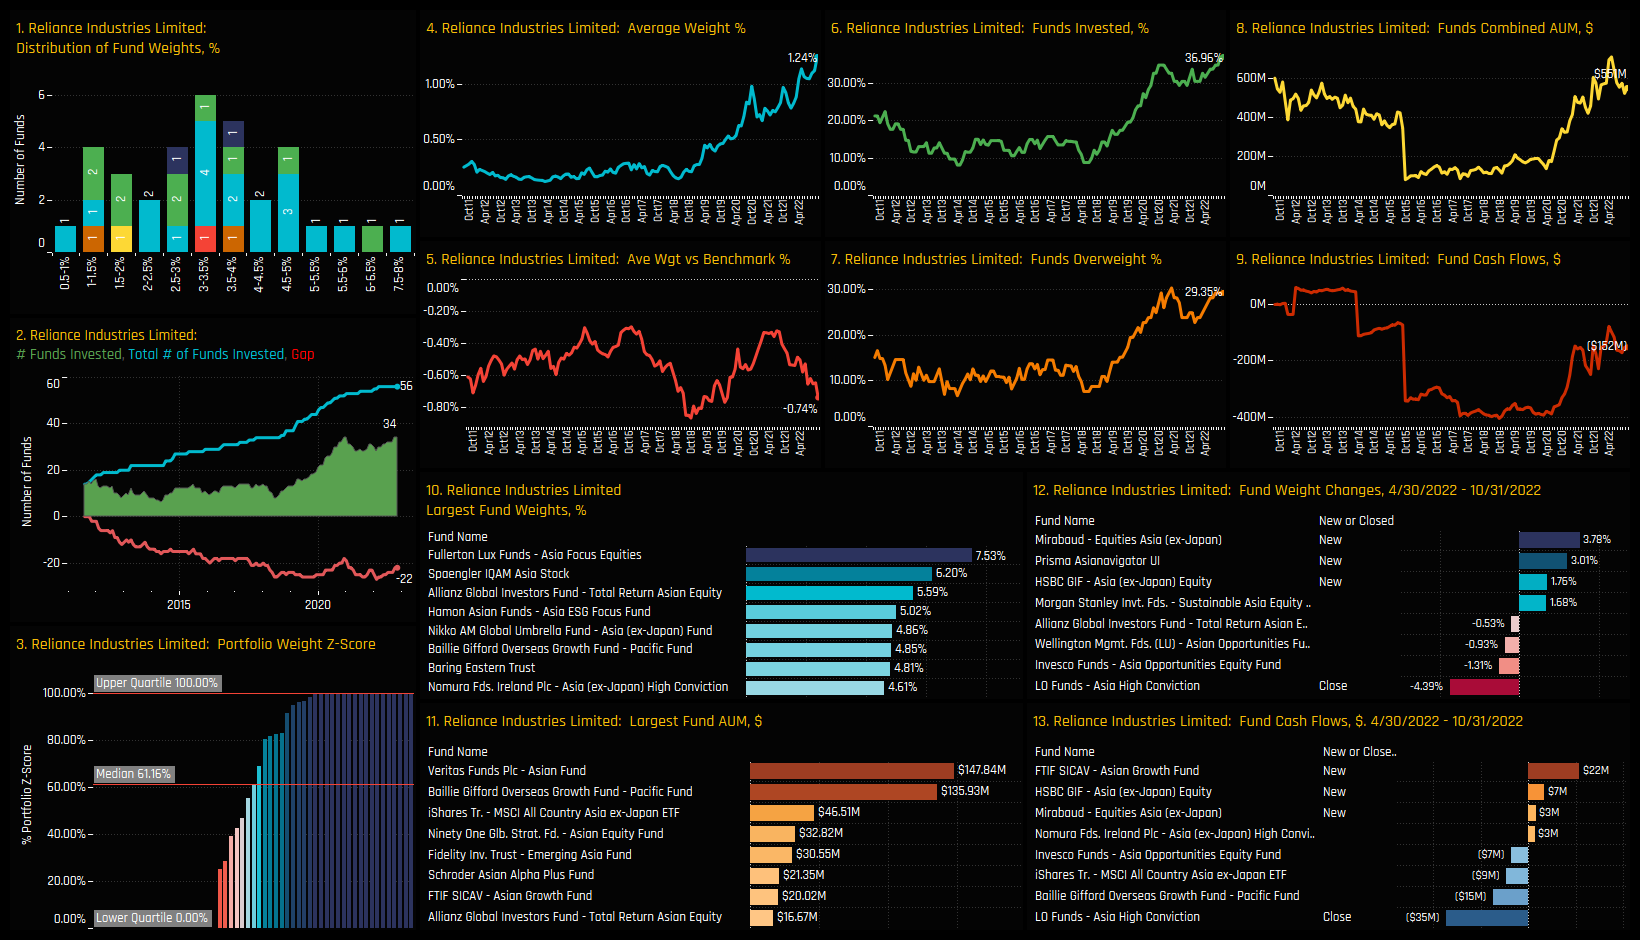
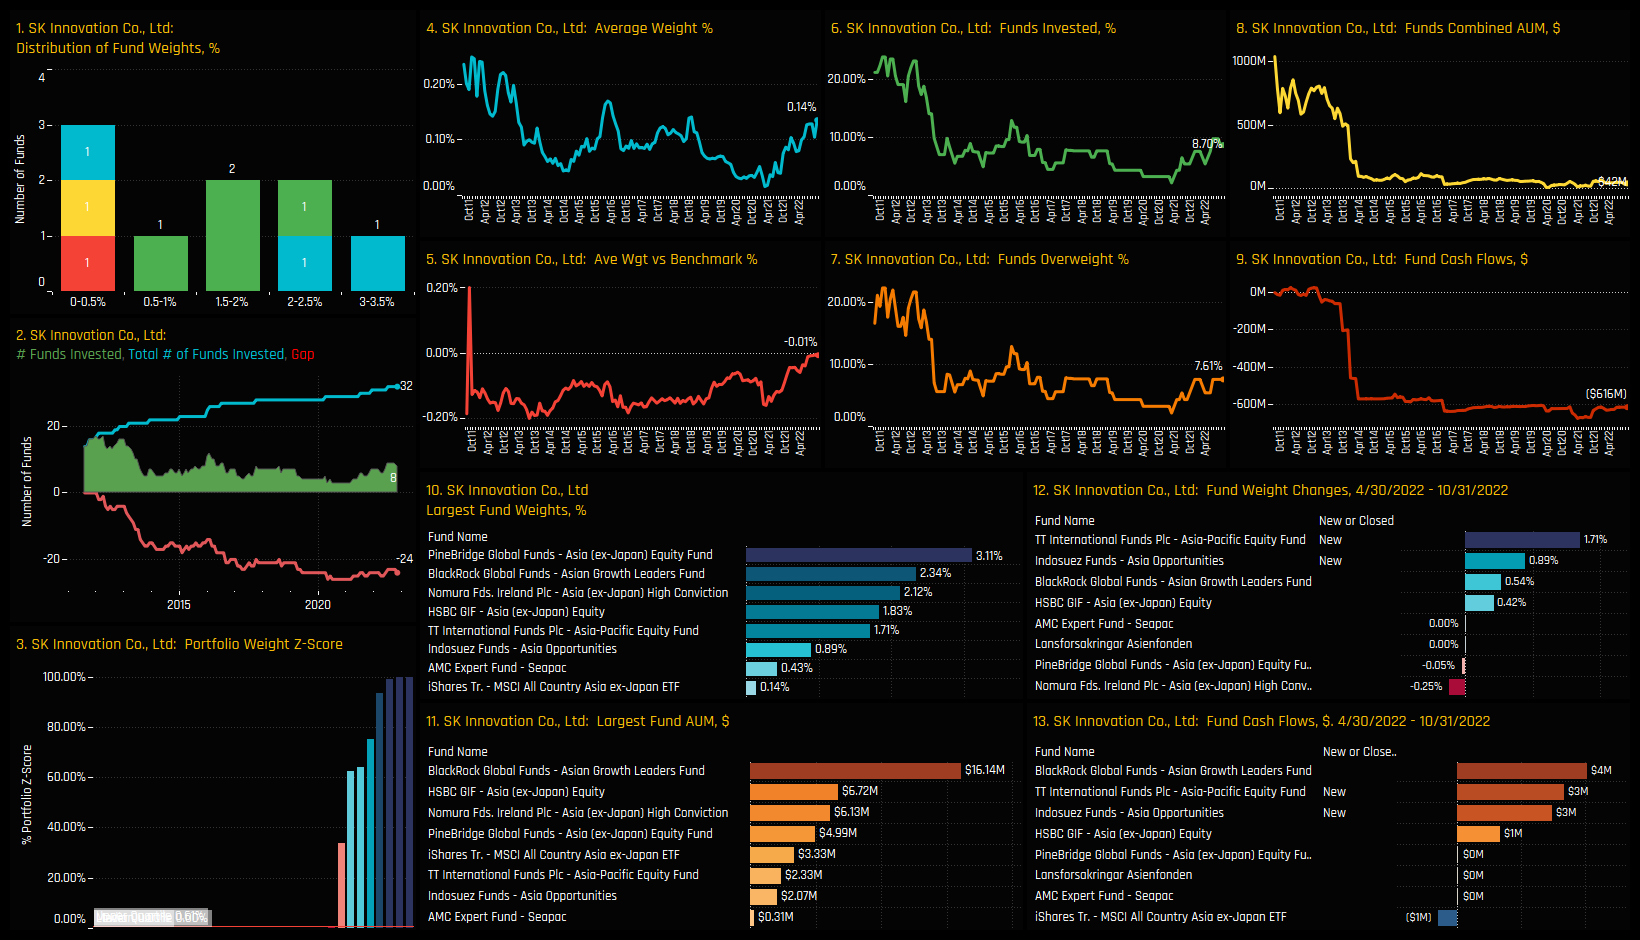
On a stock level, Reliance Industries Limited is the conviction holding, owned by 36.96% of managers at an average weight of 1.24%. It dominates the list of high conviction holdings, led by Fullerton Asia Focus (7.53%) and Spaengler IQAM Asia (6.20%). After that, SK Innovation Co is a distant second and S-Oil Corporation an even more distant third – these are fringe holdings at best.
Activity between 04/30/2022 and 10/31/2022 was skewed to the buy-side, with +4.35% of funds adding exposure to Reliance Industries Limited, led by Mirabaud Equities Asia (+3.78%) and Prisma Asianavigator (+3.01%). Ownership increases were also seen in SK Innovation Co, Indian Oil Corp and S-Oil Corporation.
Conclusions & Data Report
Continued buying among Asia Ex-Japan investors has pushed allocations in the Oil Refining/Marketing sector to record highs. Though largely confined to Reliance Industries Limited, opening positions from TT International in SK Innovation Co and Pictet Asia in S-Oil Corporation proves there is some depth to the sector.
As the 2nd largest industry group underweight in the Asia Ex-Japan Universe (see chart right) and a rising number of active Asia Ex-Japan funds buying in to the sector, the 55% of investors choosing to avoid exposure at this point may have cause to reconsider.
Please click on the link below for the extended data reports on the Oil Refining/Marketing Industry Group, and scroll down for ownership profiles on Reliance Industries Limited and SK Innovation.
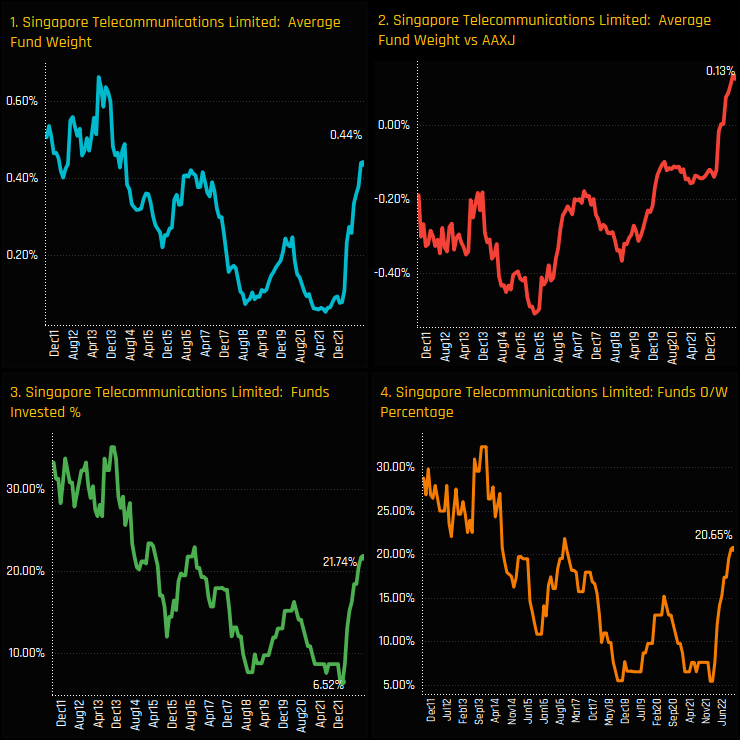
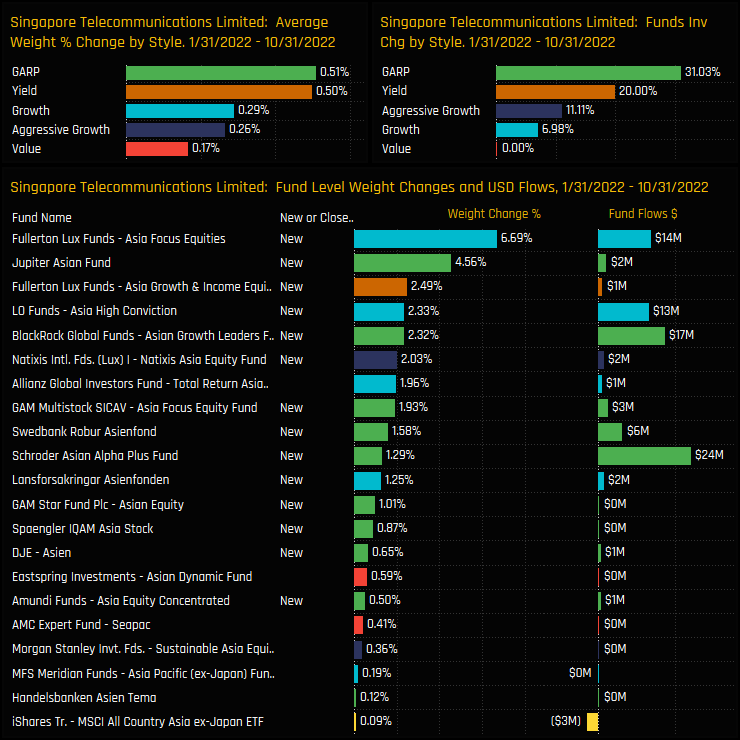
Sentiment in Singapore Telecommunications among Asia Ex-Japan funds has taken a dramatic shift to the upside. From a low of just 6.5% of funds invested in January 2022, a surge of buying has pushed ownership levels to 21.7%, levels not seen since late 2016. Commensurate with this buying spree, average weights have hit an 8-year high of 0.44%, switching Singtel from a net underweight to a net overweight in the process.
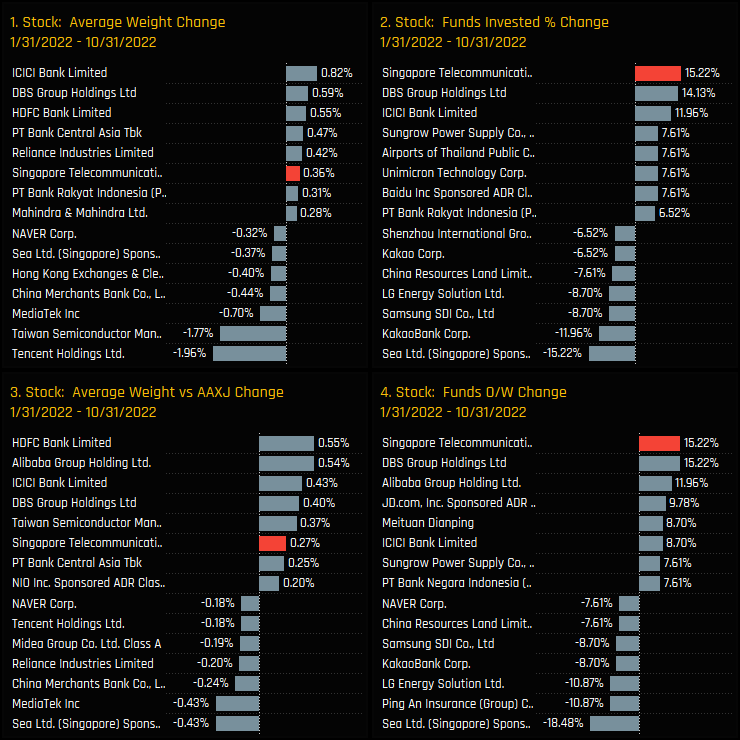
Between the lows of 01/31/2022 and 10/31/2022, Singapore Telecommunications captured the largest increase in ownership among any stock in the Asia Ex-Japan universe, marginally beating fellow country peer DBS group Holdings. Investors rotated out of Sea Limited, KakaoBank Corp and Samsung SDI Co.
Peer Group Positioning
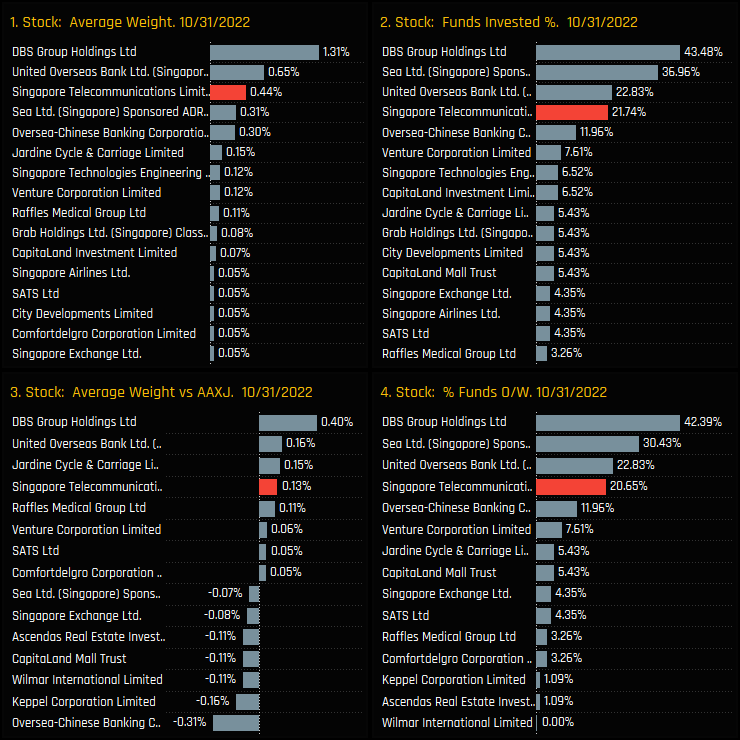
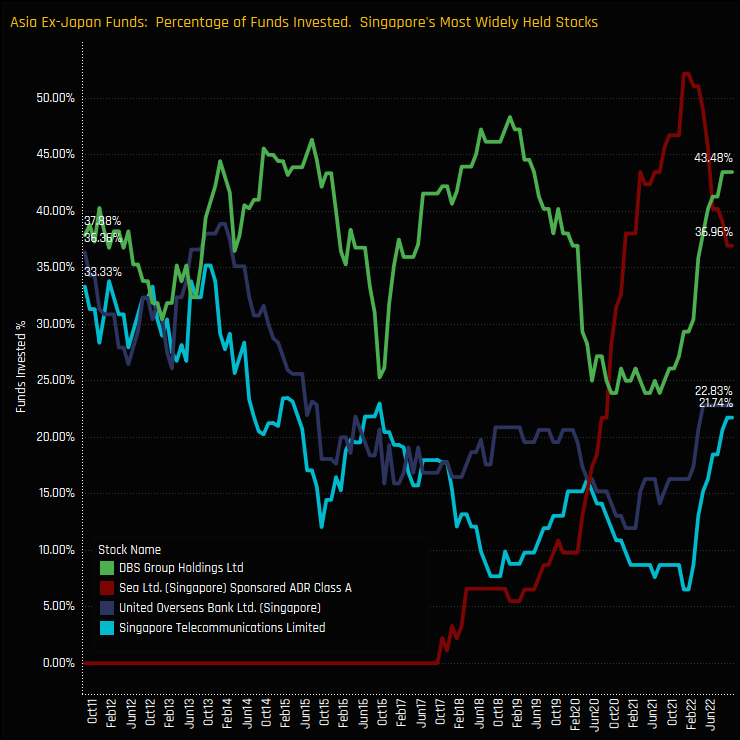
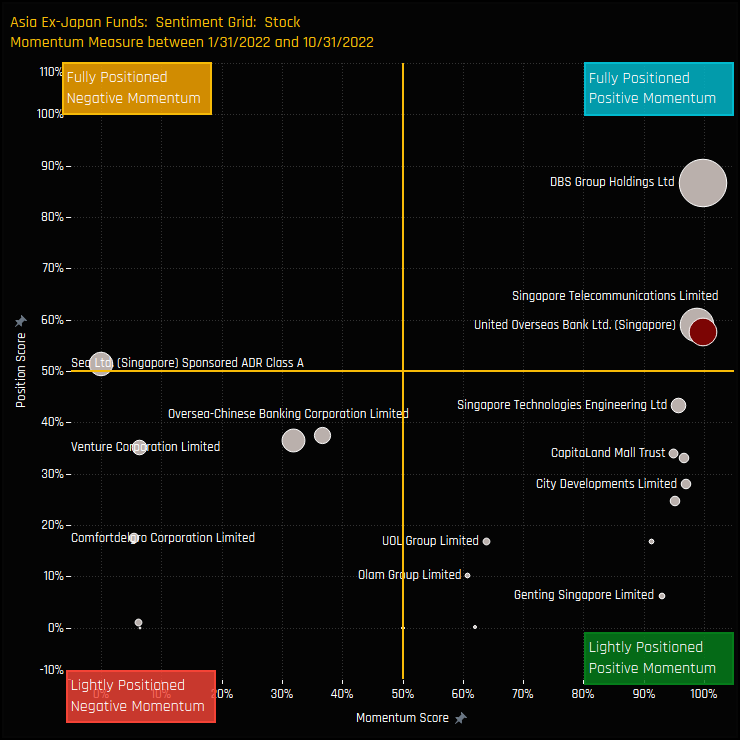
The charts below show our ownership statistics for Singapore stocks among Asia Ex-Japan investors. Singapore Telecommunications is the 4th most widely held stock in Singapore, well behind DBS Group Holdings and Sea Limited and more aligned with United Overseas Bank across it’s key ownership metrics.
The below chart shows the time-series of the percentage of funds invested in each of the 4 most widely held stocks in Singapore. Ownership levels in Singapore Telecommunications have diverged from DBS Group Holdings over the past decade, but both have seen ownership levels rise over the course of 2022. This has been at the expense of Sea Limited, with the remarkable rise in ownership since 2020 peaking at the start of the year and trending lower.
Fund Holdings & Activity
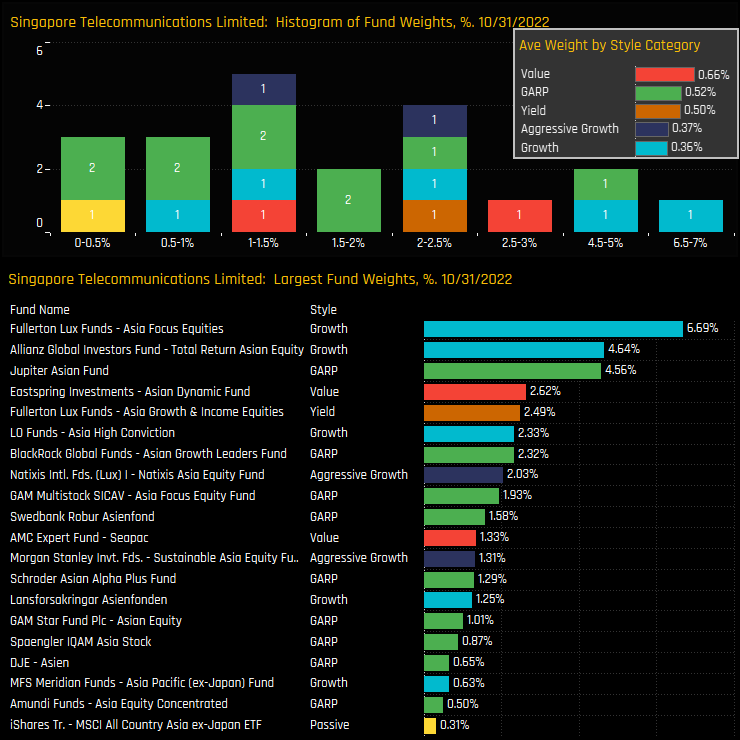
High conviction holders are led by the Growth funds of Fullerton Asia Focus (6.69%) and Allianz Global Asian Equity (4.64%). On a Style basis, all investor types have some skin the game, though there is a bias to the Value end of the spectrum.
The funds behind the SingTel rotation are shown in the table below. New positions from Fullerton Asia Focus (+6.69%), Jupiter Asian Fund (+4.56%) and Fullerton Asia Growth & Income (+2.49%) head a total of 14 funds opening exposure to the name between 01/31/2022 and 10/31/2022.
Conclusions & Data Report
Singapore Telecommunications has seen a remarkable rise in ownership among Asia Ex-Japan investors this year. The truth is though, Singtel is not alone, with the recent rally in ownership part of a broader rotation into key Singaporean stocks. On a country level, these increases are masked by a significant reduction in Sea Limited exposure among Asia Ex-Japan investors.
The sentiment grid to the right highlights this well. It shows where current positioning in each stock in Singapore sits versus its own history going back to 2011 on a scale of 0-100% (y-axis), against a measure of fund activity for each stock between 04/30/2022 and 10/31/2022 (x-axis). It shows a cluster of stocks on the far right-hand side of the grid, indicative of positive rotation by managers. These are offset by extreme negative rotation in Sea Limited, which is still owned by a significant number of Asia Ex-Japan active funds.
There was a point late last year when Sea Limited accounted for over 40% of the total Singapore allocation among Asia Ex-Japan investors. That’s now down to under 10%, perhaps a better reflection of the opportunities that lie within SE Asia’s 6th largest economy.
Please click on the link below for an extended data report on Singapore Telecommunications among active Asia Ex-Japan equity funds. Scroll down for a link to the latest fund positioning report for our active Asia Ex-Japan fund universe.
For more analysis, data or information on active investor positioning in your market, please get in touch with me on steven.holden@copleyfundresearch.com


