Investment levels among the thousands of stocks in the investible China universe differ greatly. Some stocks are widely owned, others largely avoided with ownership levels changing every month. We combine current and historical positioning against shorter-term manager activity to get a handle on where sentiment lies for every stock in the China A-Share universe. We highlight 8 stocks at the extreme ends of their own positioning ranges whilst also seeing large changes in fund ownership.
The Sentiment Grid
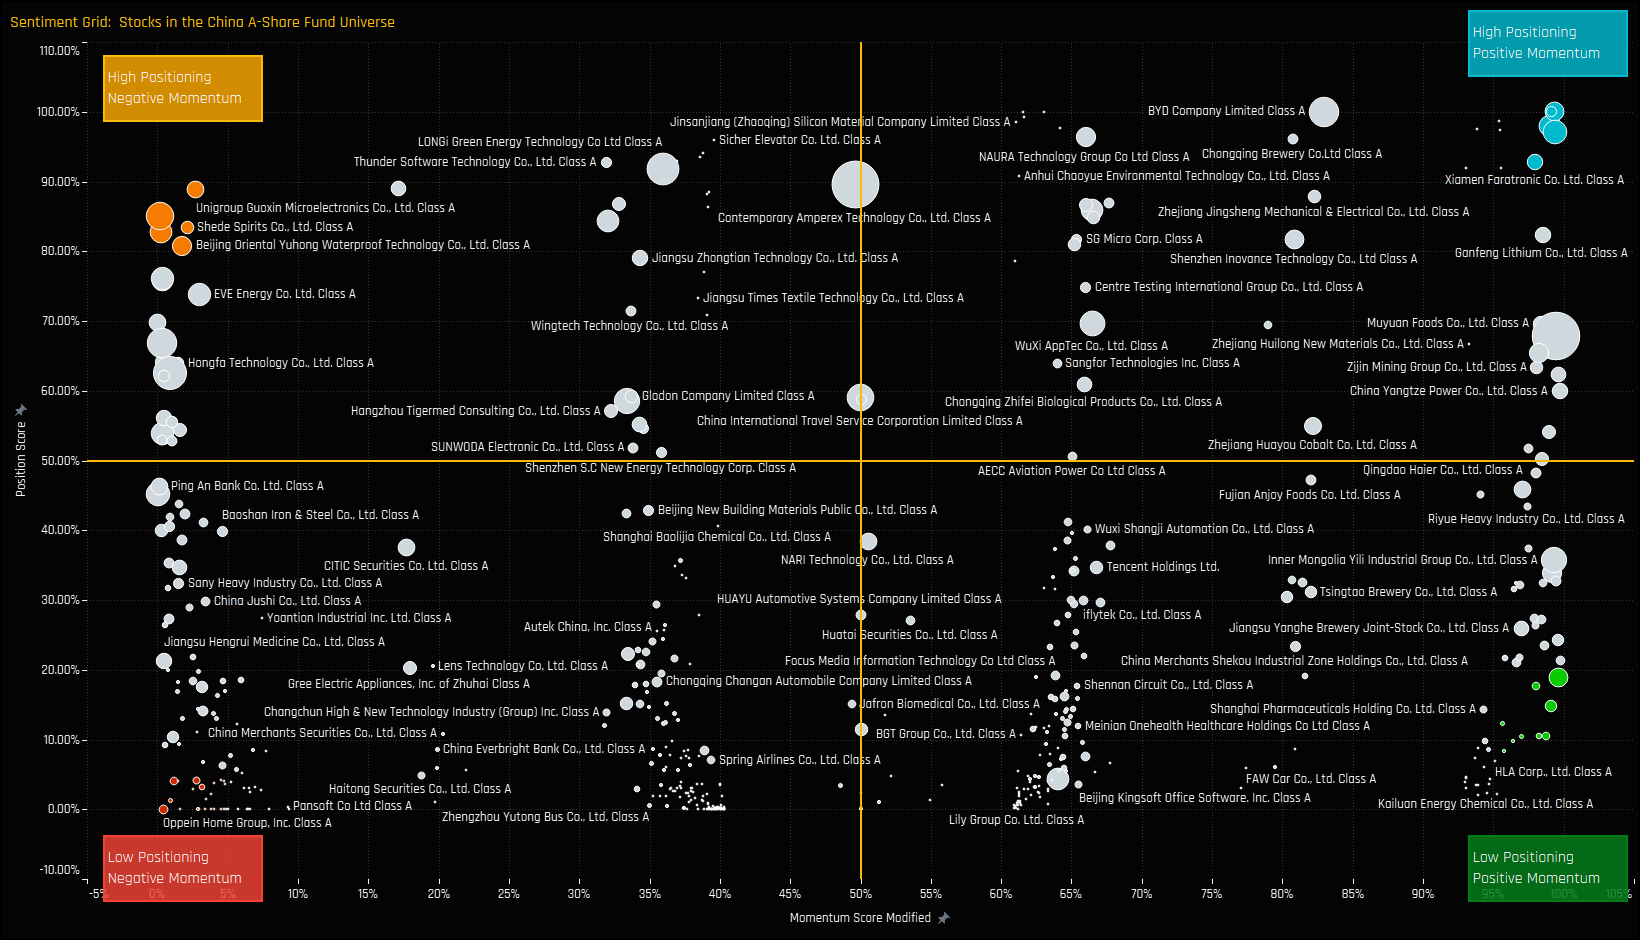
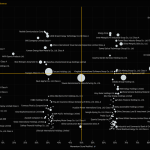
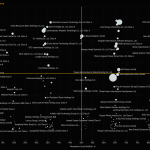
The Sentiment Grid below is designed to visualize the interplay between current fund positioning, long-term fund positioning and shorter-term fund manager activity for all stocks in the China A-Share universe. The Y-axis shows the ‘Position Score’, a measure of current positioning in each stock compared to history going back to 2011 on a scale of 0-100%. It takes in to account the percentage of funds invested in each stock versus history, the average fund weight versus history and the percentage of funds overweight the benchmark versus history. The higher the number, the more heavily a stock is owned by active China managers compared to its own history.
The X-Axis shows the ‘Momentum Score’, a measure of fund manager activity for each stock between 01/31/2022 and 07/31/2022 on a scale of 0% (maximum negative activity) to 100% (maximum positive activity). The Momentum Score takes in to account the change in the percentage of funds invested in each stock over the period, the change in average weight and the change in the percentage of funds overweight. The chart also highlights the companies at the extreme ends of each quadrant by colour, which will shall explore in more detail below.
Extreme Stocks
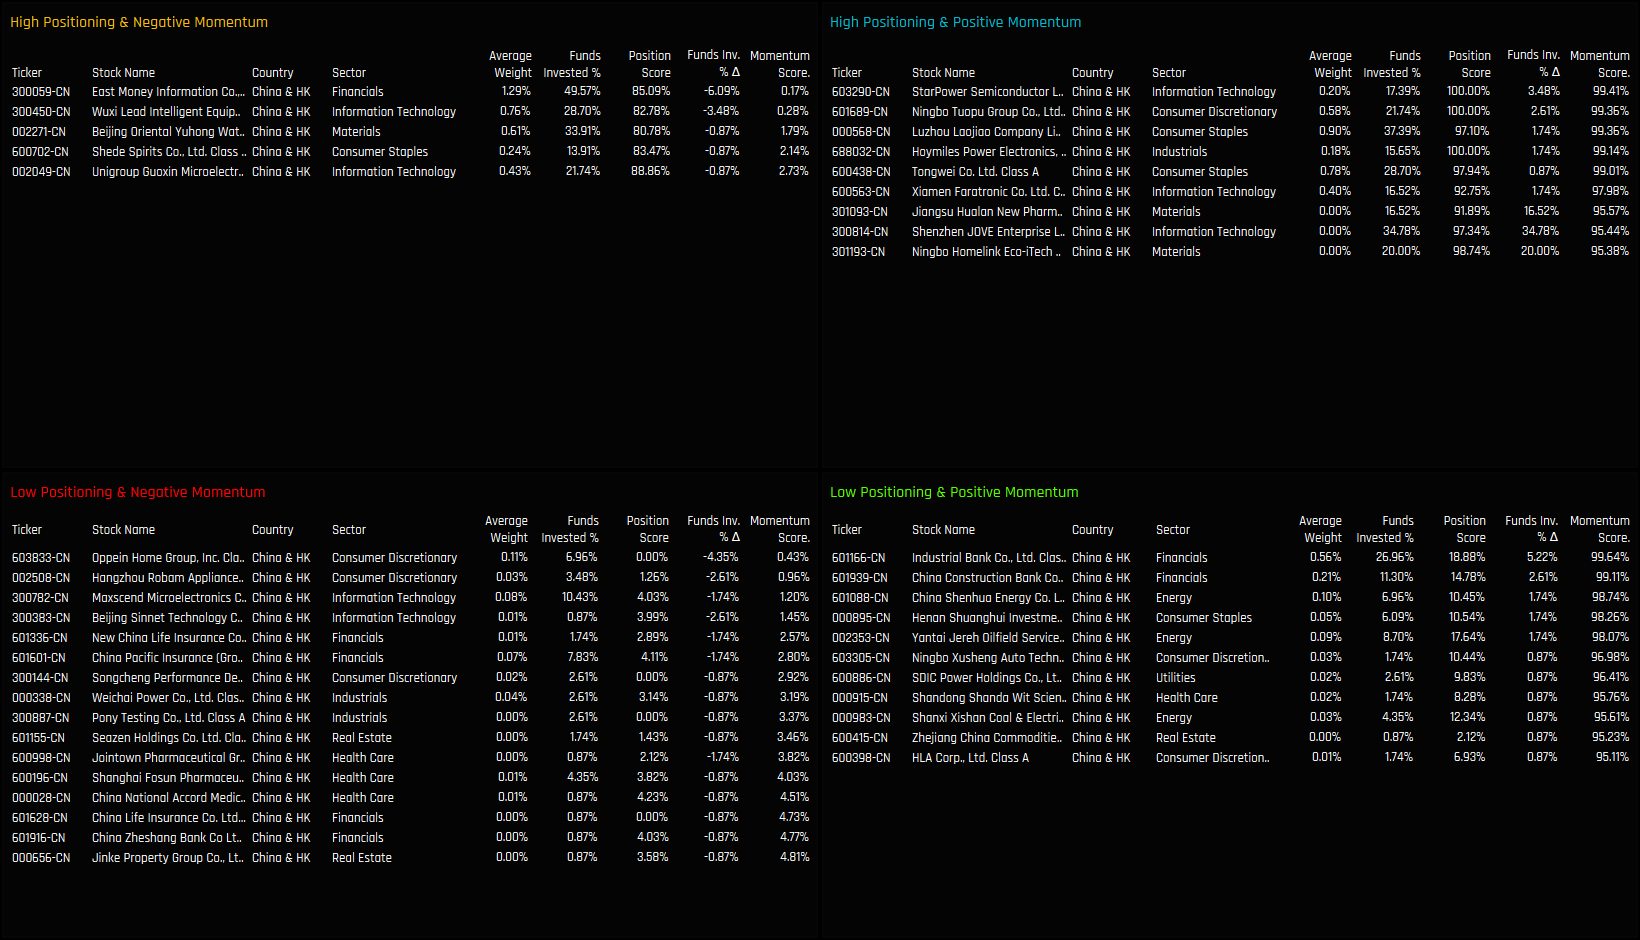
The tables below list the stocks in the extreme corners of each quadrant. The screening methodology is as follows:
High Positioning & Negative Momentum: Position Score > 80%. Momentum Score < 5%
High Positioning & Positive Momentum: Position Score > 90%. Momentum Score > 95%
Extreme Stocks
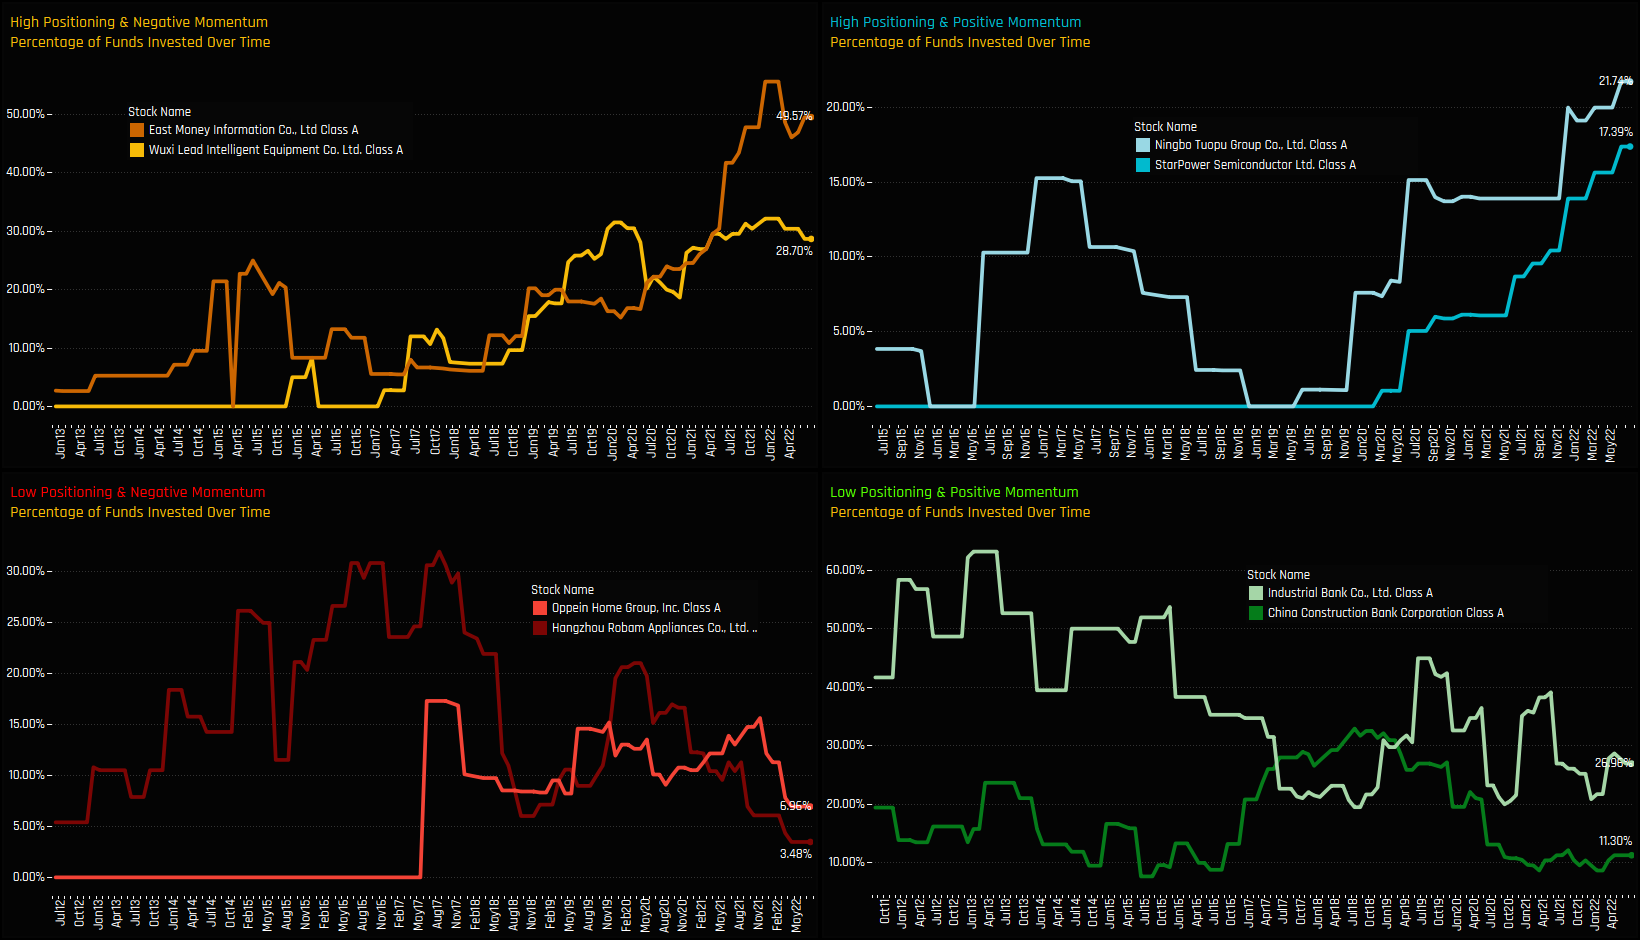
The charts below track the percentage of active funds invested in each of the top 2 stocks across the 4 categories. It’s another way to visualize how the Sentiment Grid works. For example, in the top left-hand chart below, both East Money Information Co and Wuxi Lead Intelligent Equipment are towards the higher end of their historical ownership ranges, yet more recently that trend has started to reverse from the peak.
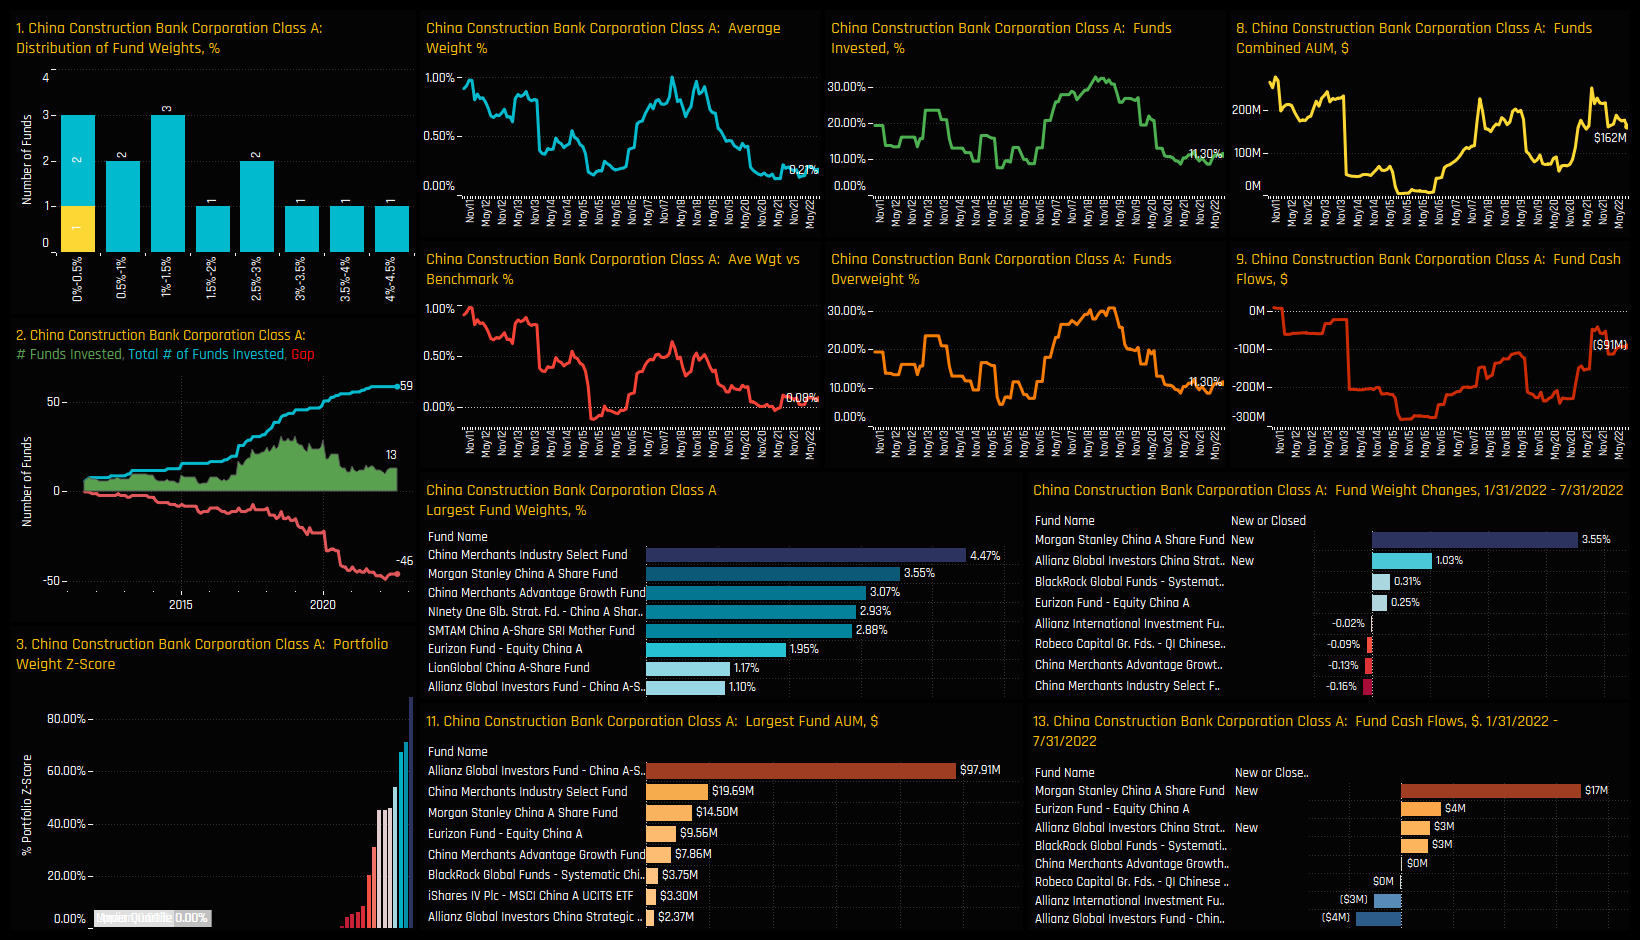
In the opposite case (bottom right), both Industrial Bank Co and China Construction Bank are at the bottom of their historical ownership ranges, but both have started to climb from the lows. In the charts that follow we provide more detailed profiles of each of the 8 stocks at the extreme corners of our Sentiment Grid.
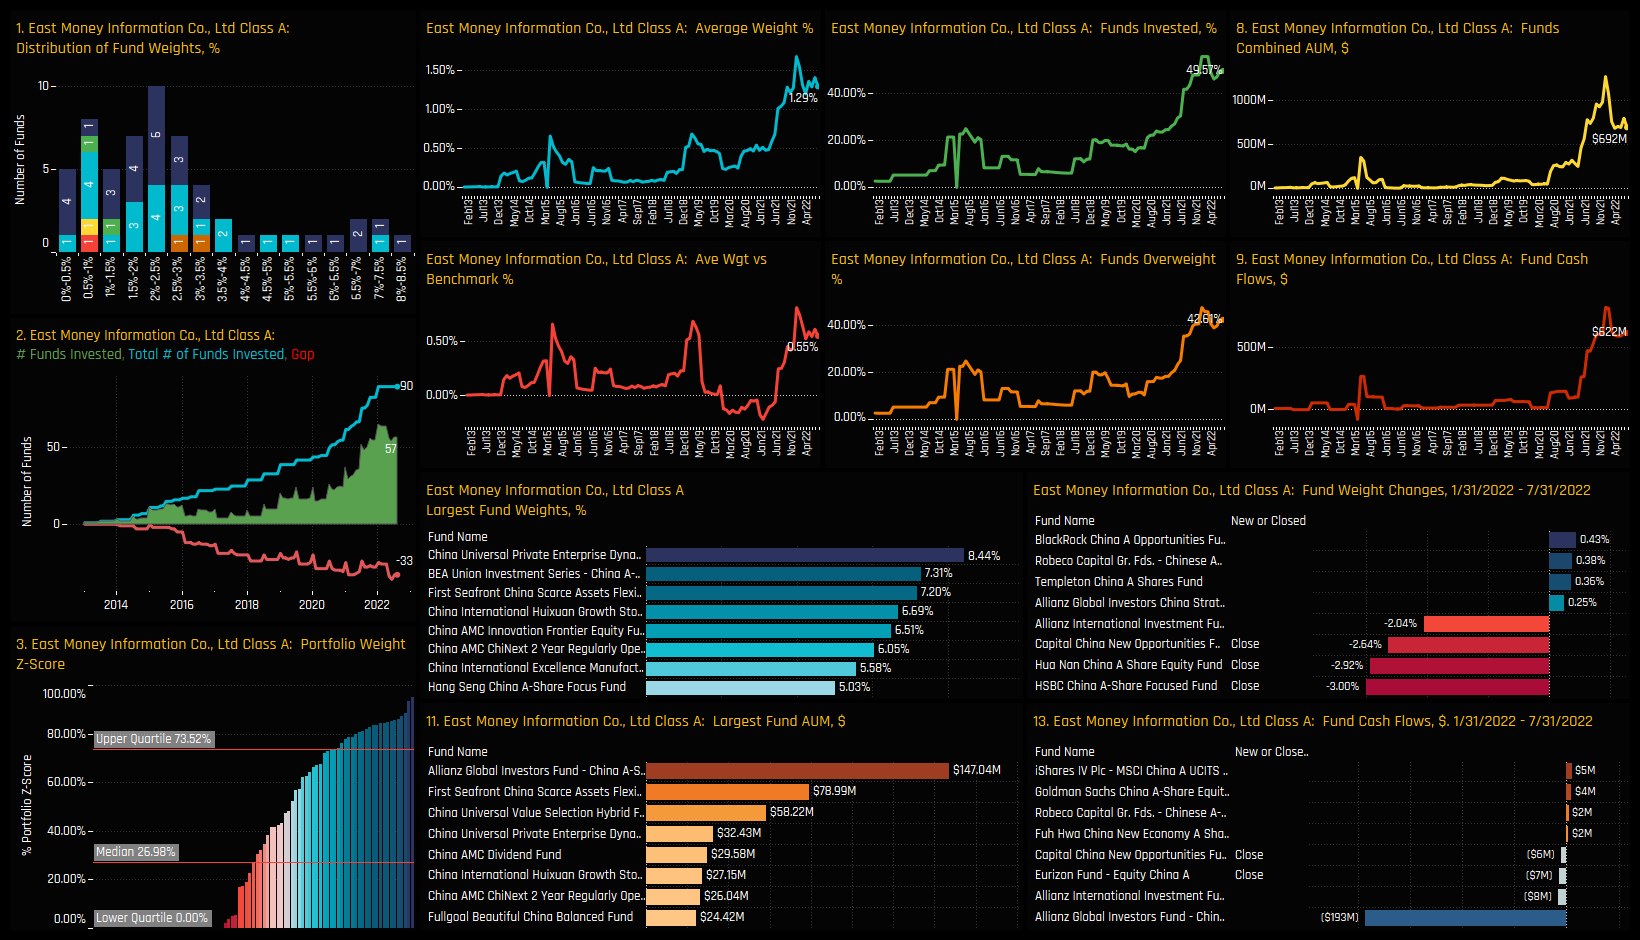
High Positioning, Negative Momentum: East Money Information Ltd Class A
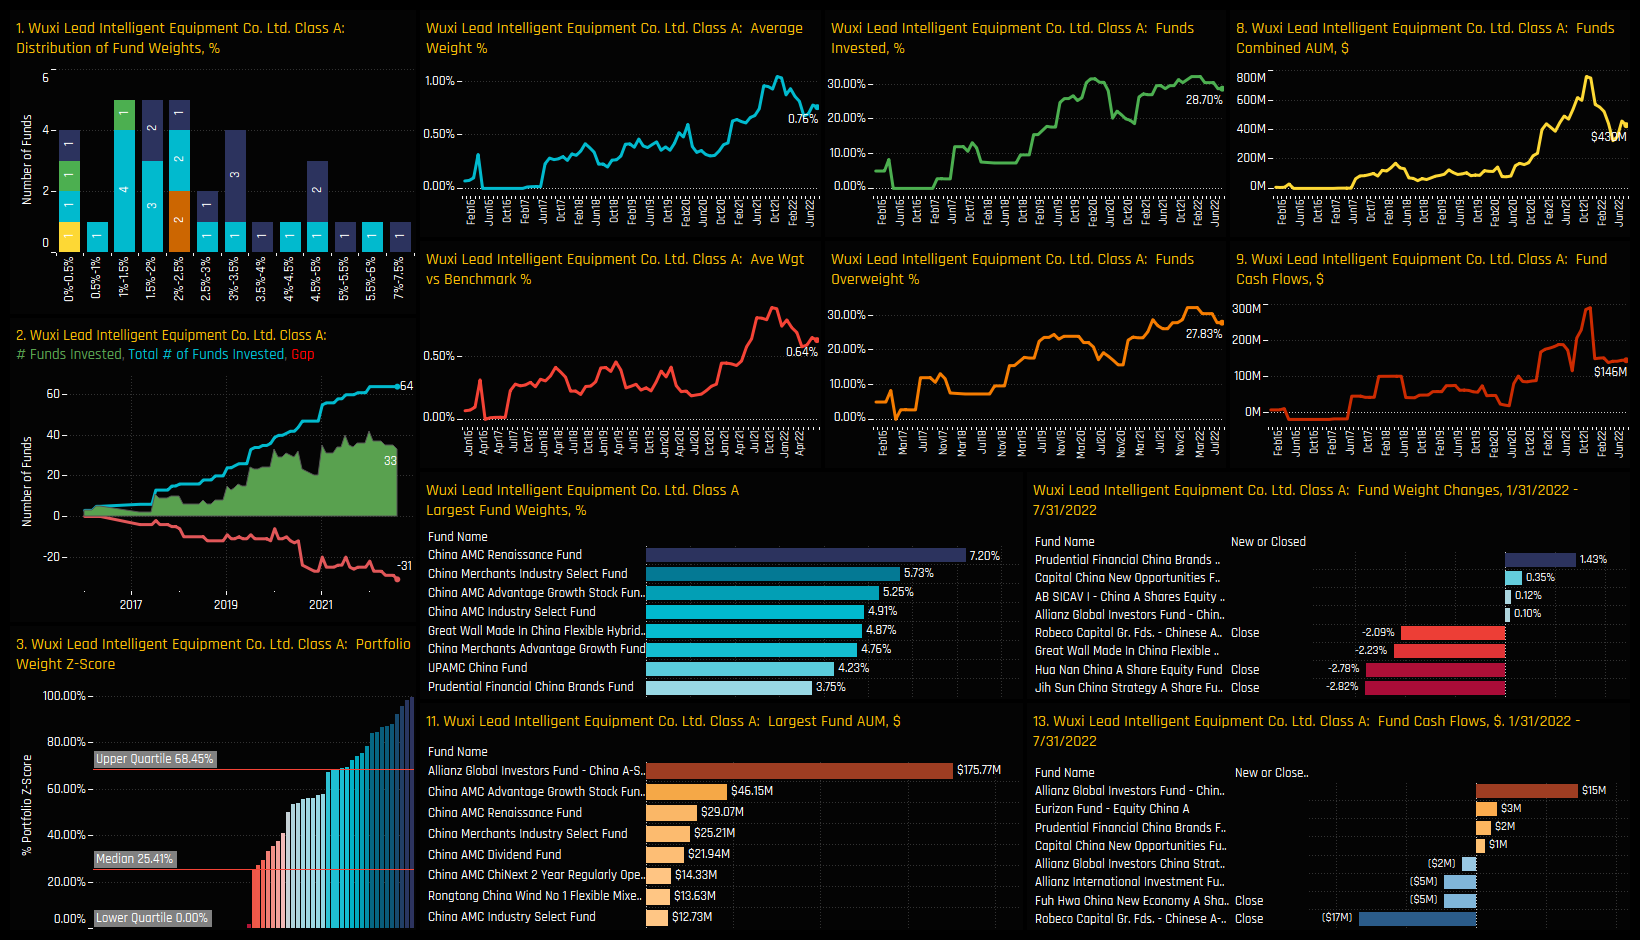
High Positioning, Negative Momentum: Wuxi Lead Intelligence Co Ltd Class A
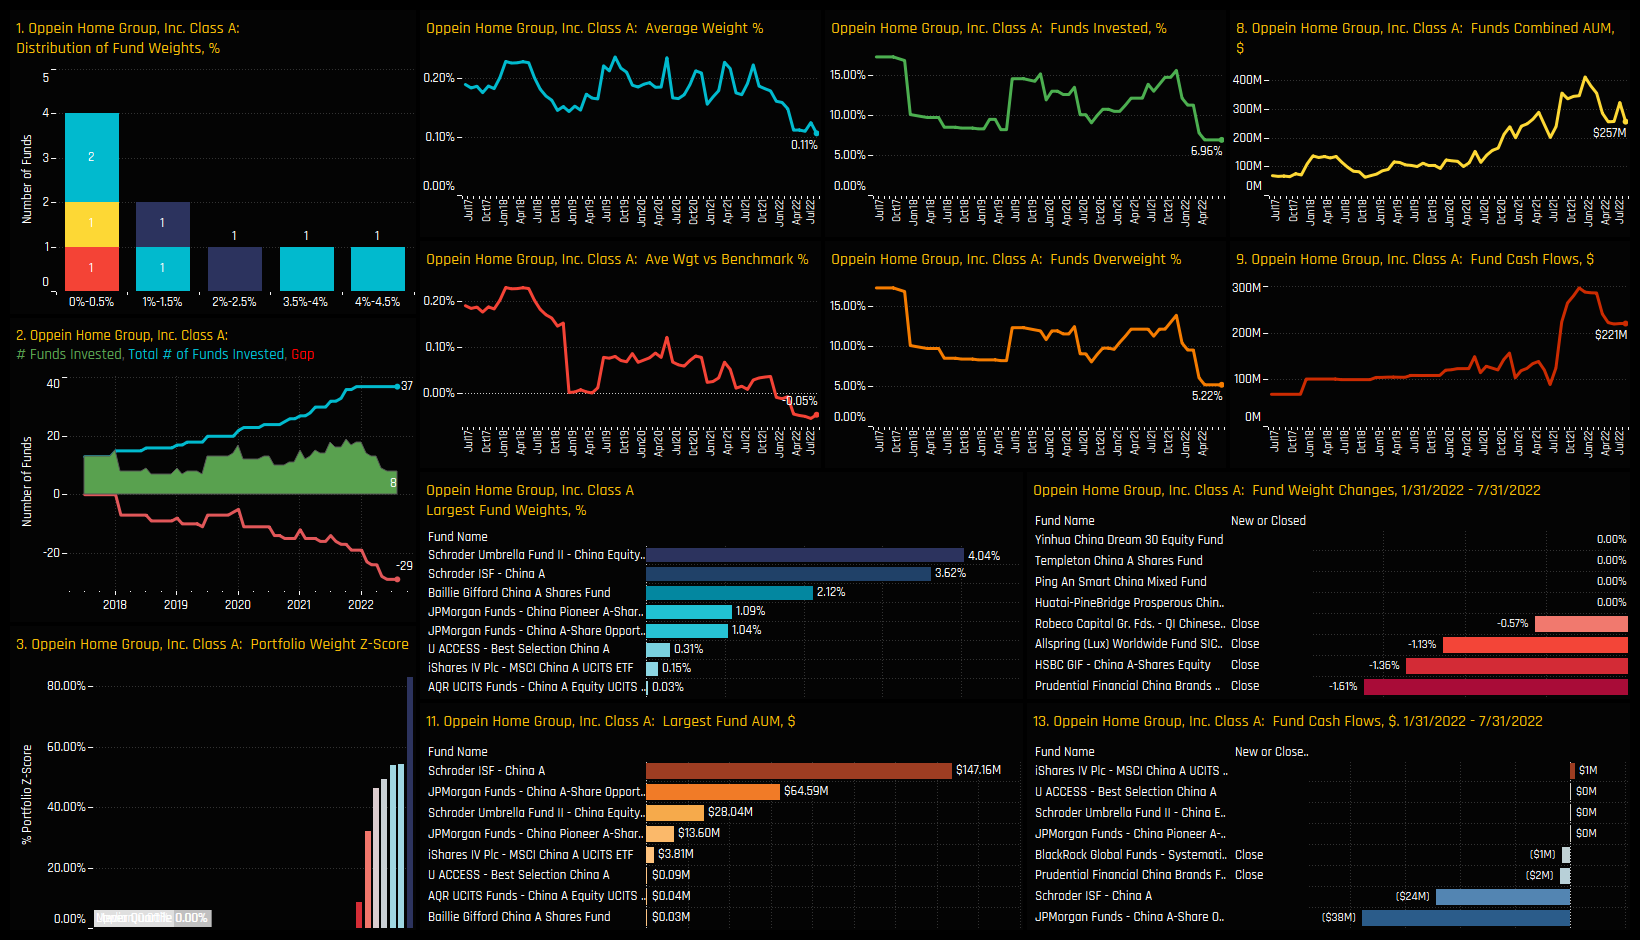
Low Positioning, Negative Momentum: Oppein Home Group Inc Class A
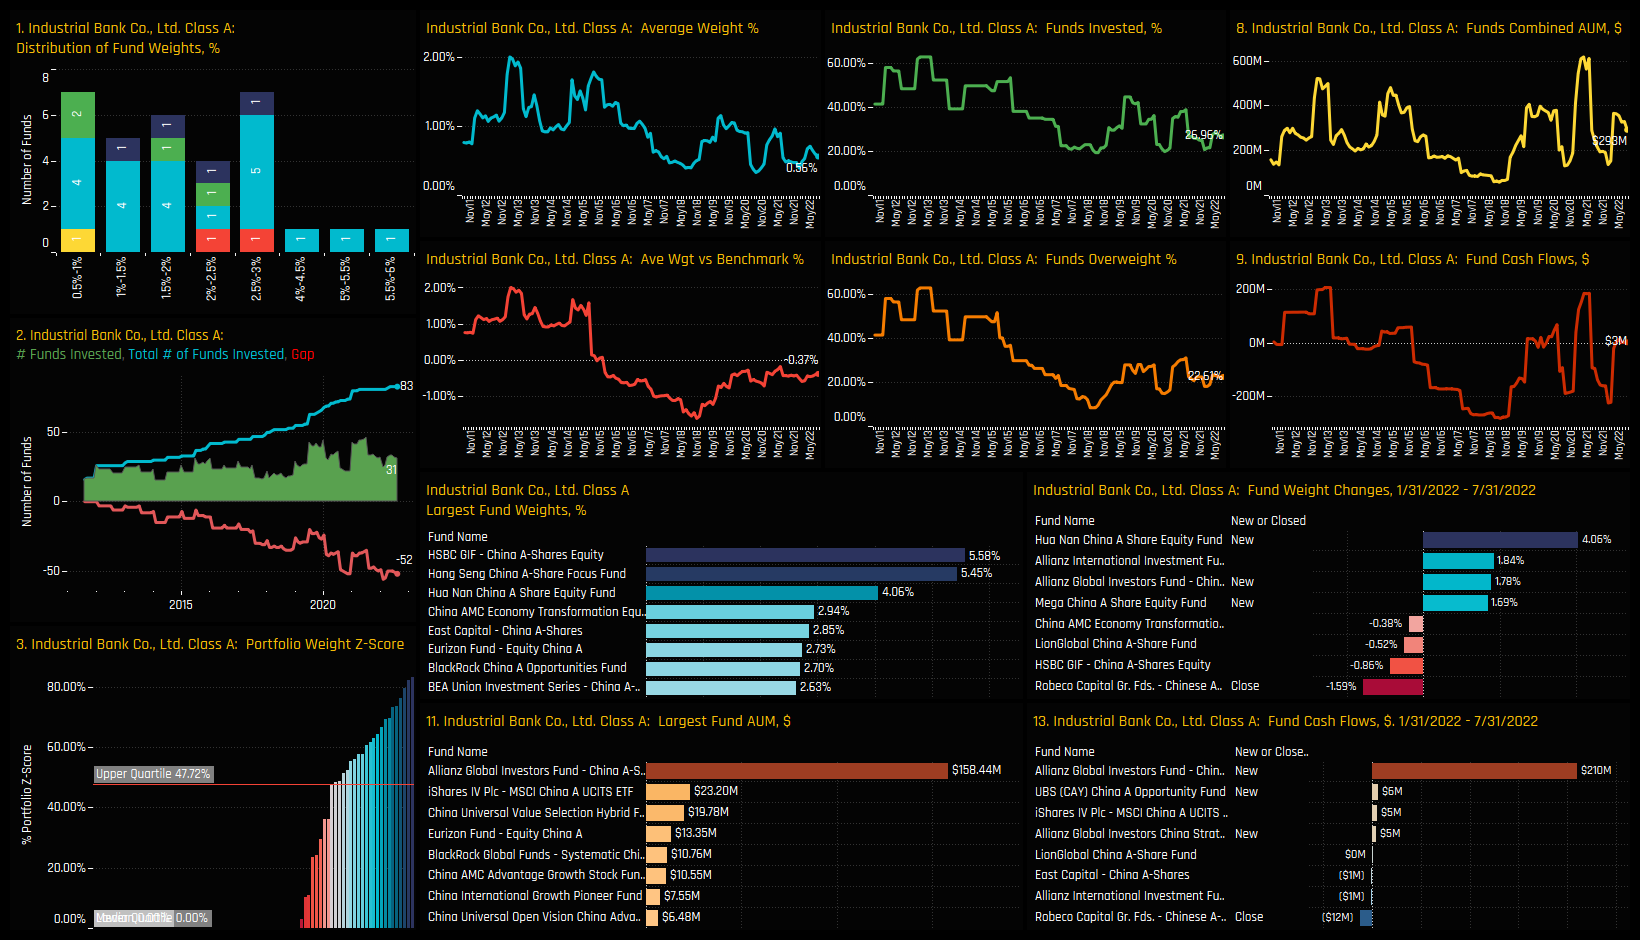
Low Positioning, Positive Momentum: Industrial Bank Co Ltd
Low Positioning, Positive Momentum: China Construction Bank Corporation Class A
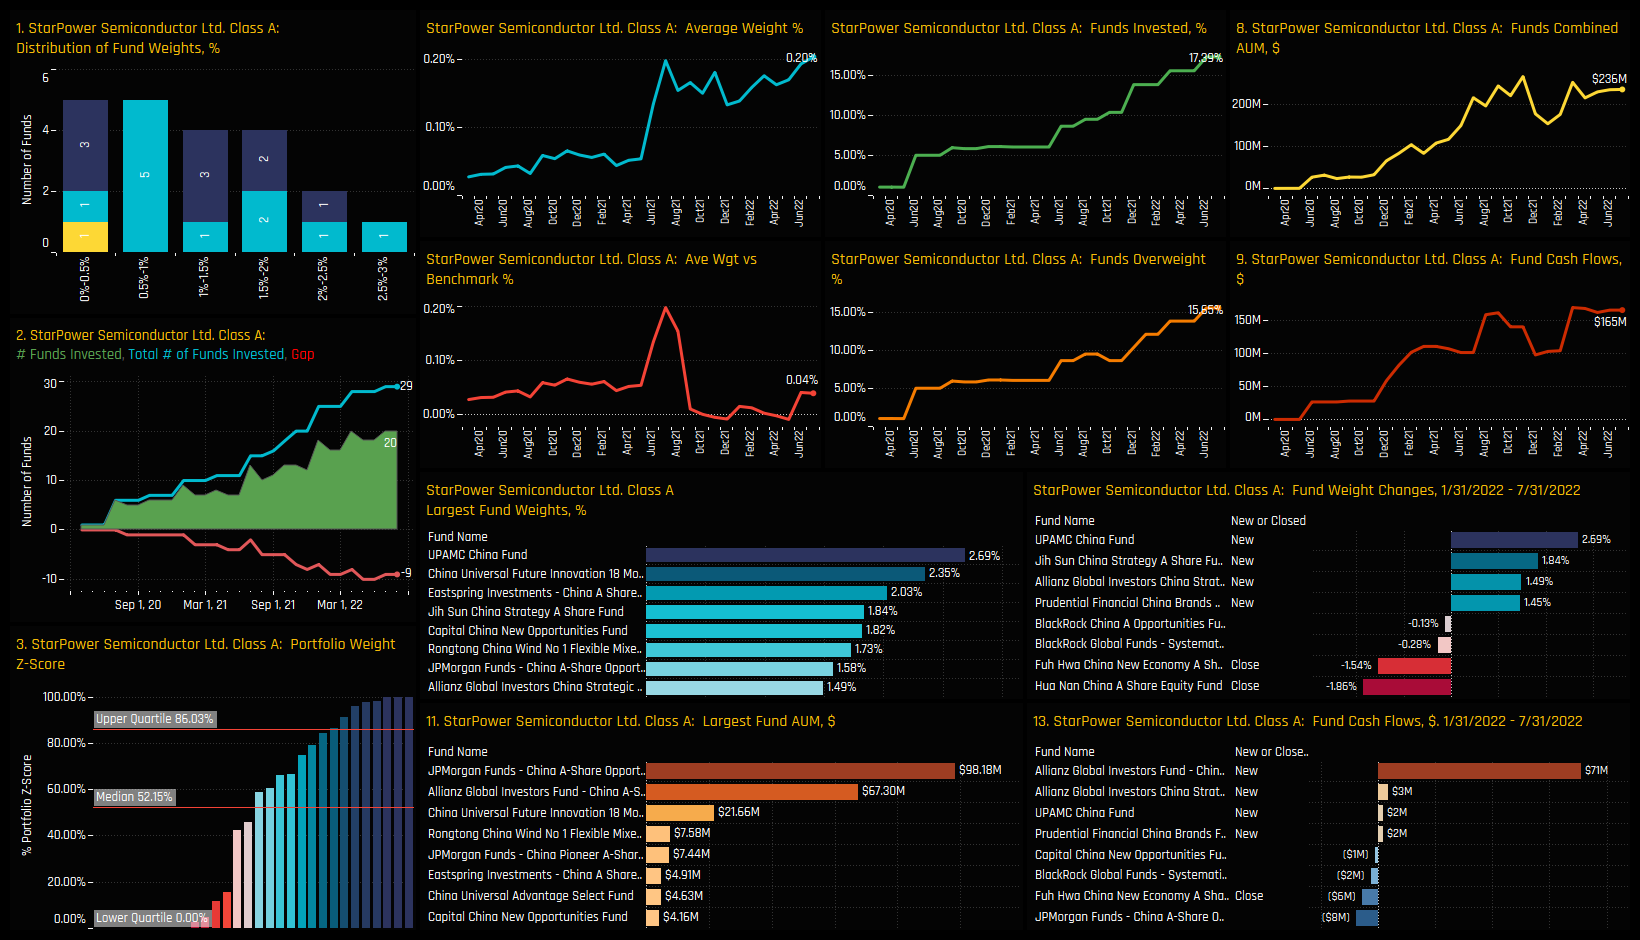
High Positioning, Positive Momentum: StarPower Semiconductor Ltd
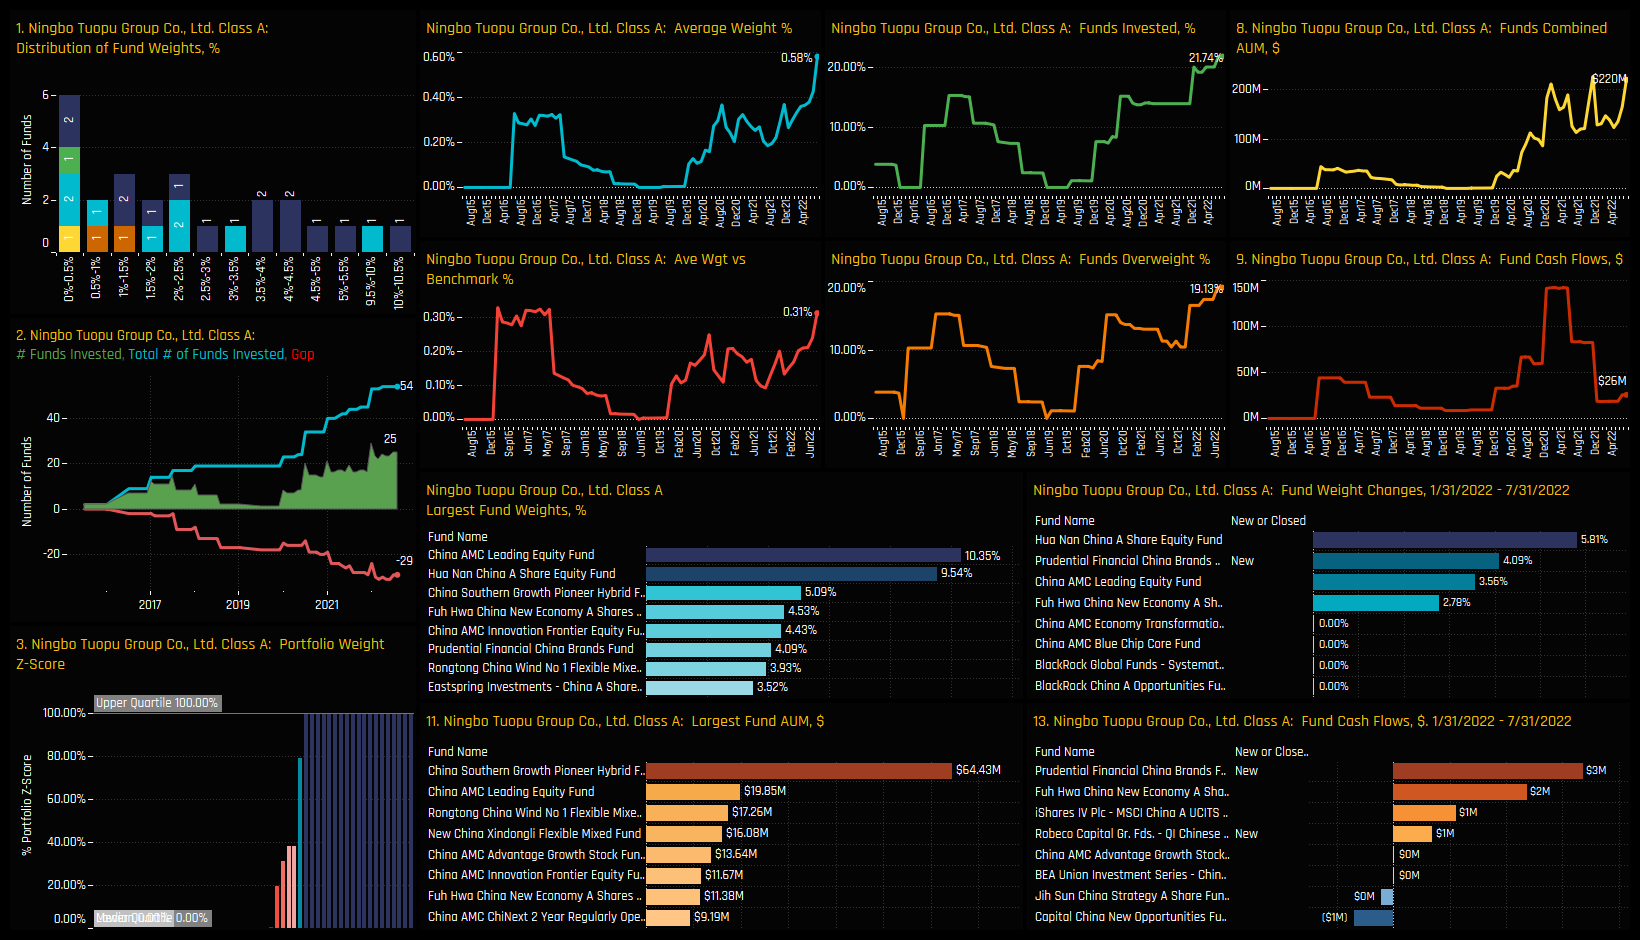
High Positioning, Positive Momentum: Ningbo Tuopu Group Co
For more analysis, data or information on active investor positioning in your market, please get in touch with me on steven.holden@copleyfundresearch.com


