Global Funds: 2022 Performance & Attribution Report

359 Active GEM Funds, AUM $914bn.

2022 Performance & Attribution Report

In this report, we provide an overview of 2022 performance among the Global active funds in our analysis. We look at annual performance broken down by Style and Market Cap focus, together with longer-term analysis of active versus passive. We then identify the drivers behind 2022 performance based on the average active Global fund stock portfolio versus the SPDRs All Country World ETF.

Global equity managers had a year to forget in 2022, with the average active fund losing -19.46% over the last 12-months.  Returns were correlated to Style, with Yield and Value funds outperforming their Growth and Aggressive Growth peers, and on a Market Cap basis Large/Megacap Funds underperforming Small/Midcap.  Versus the benchmark, managers faired better with just under half outperforming and average returns -1.09% lower, which after adjusting for fees is largely in line.

The top and bottom performers on the year are listed below.  Only Jupiter’s Global Value Fund posted positive returns on the year, with the top 20 dominated by Value and Yield strategies.  


Returns by Style & Market Cap Focus

The grid below shows the top 3 and bottom 3 performers in each Style and Market Cap bucket

Time-Series Active v Passive

Month on month performance versus the benchmark is shown below, with active Global managers underperforming in January and with more instances of under-performance than outperformance over the rest of the year.  Only December’s outperformance of +1.57% rescued managers from what might have been one of the worst years in over a decade.  

As it stands though, 2022 is the 3rd worst performing year over the last decade, with the benchmark performing more defensively as markets turned from 2021 onwards.  Global managers now trail the MSCI ACWI by -7.27% over the last 10-year period.

Performance by Style and Active Category

The charts below show the average annual performance (top) and cumulative performance (bottom) split by fund Style over the last decade.  Aggressive Growth funds still lead the way over 10-years with returns of 118%, though the gap to Value has narrowed over the last 2-years.  Global Yield managers have some way to go to catch up, despite being the best performers in 2022.

Fund performance split by active category provides some evidence that an active approach has paid dividends.  High Active funds (active shares >75%) and Mid Active (60% < active share < 75%) both outperformed Low Active Funds (active share <60%).  Although on average all Active groups underperformed the MSCI ACWI benchmark, this was achieved with the luxury of zero fees.

10-Year Performance Summary

Fund Performance Contribution

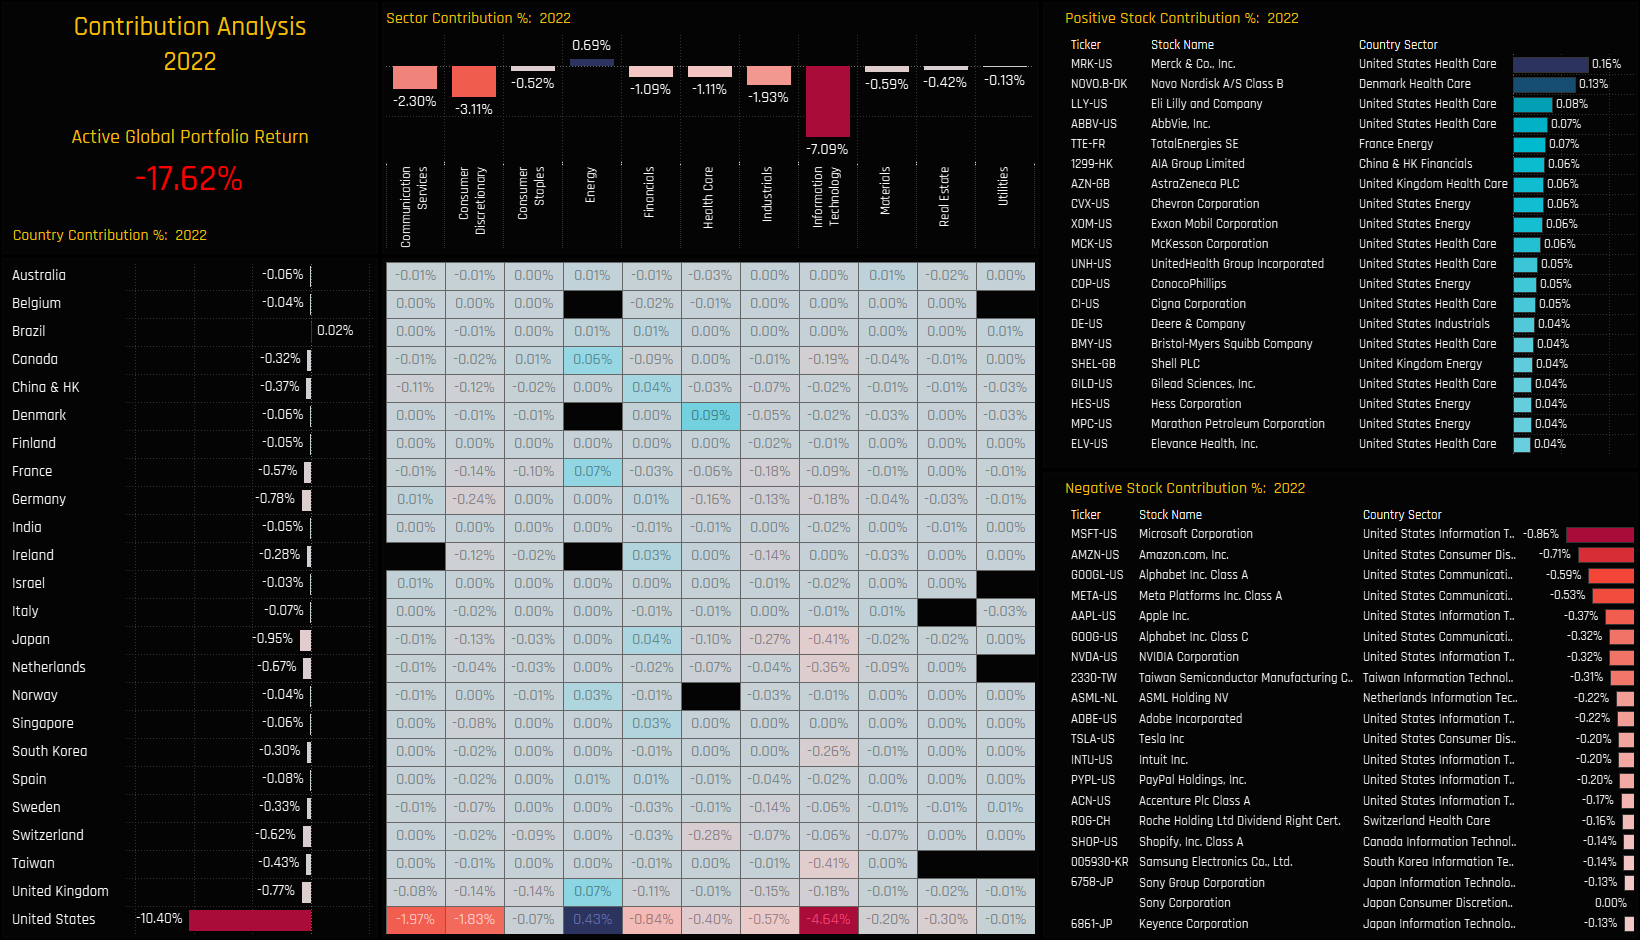
We now look at the drivers behind last year’s absolute and relative performance.  We do this by creating a portfolio based on the average allocations of the 359 active strategies in our analysis.  This theoretical portfolio, with no fees and based on monthly holding observations returned -17.62% on the year.  On a country level, -10.4% of that was driven by US holdings and a further -4.36% from the combined European nations.  On a sector level, all sectors except Energy produced negative returns on the year, led by Tech (-7.09%), Consumer Discretionary (-3.11%) and Communication Services (-2.30%).  On a stock level, the major stock winners came from the Health Care sector, led by Merck & Co, Novo Nordisk and Eli Lilli and Company, whilst US Megacap stocks provided a severe dent on yearly performance.

Portfolio Attribution

We measure the performance of this portfolio versus a representation of the benchmark based on the SPDRs MSCI All Country World ETF.  The portfolio underperformed by -0.29% in 2022, a summary of the key drivers are documented below.

What worked:  

  • Cash holdings, China & HK underweights, USA Underweights, UK Overweights
  • Health Care overweights, Discretionary underweights
  • Underweights in Telsa, Apple and Amazon
  • Overweights in Novo Nordisk, AIA Group, HDFC Bank

What didn’t:  

  • Australia underweights, UK Stock Selection, Brazil Underweights
  • Financials and Energy underweights
  • Overweights in Intuit, Atlassian Corp, Alphabet Class A.
  • Underweights in Exxon Mobile, Chevron Corporation, Berkshire Hathaway

For more analysis, data or information on active investor positioning, please get in touch with me on steven.holden@copleyfundresearch.com