Investment levels among the thousands of stocks in the investible Global universe differ greatly. Some stocks are widely owned, others largely avoided with ownership levels changing every month. We combine current and historical positioning against shorter-term manager activity to get a handle on where sentiment lies for every stock in our Global analysis. We highlight 8 stocks at the extreme ends of their own positioning ranges whilst also seeing significant changes in fund ownership.
The Sentiment Grid
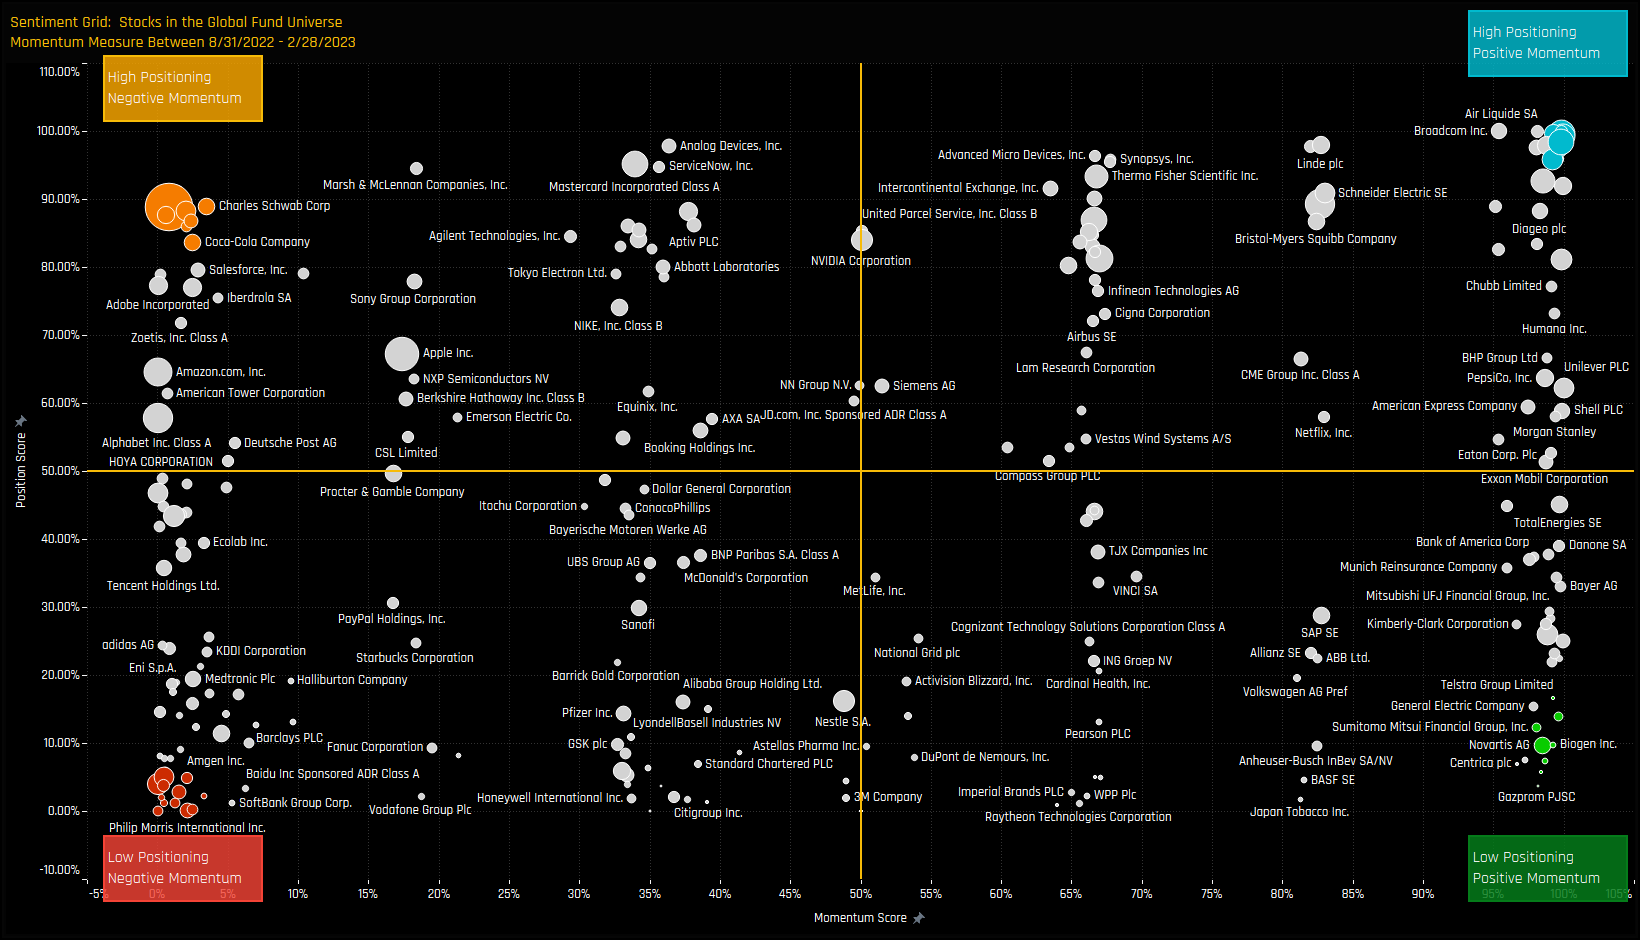
The Sentiment Grid below is designed to visualize the interplay between current fund positioning, long-term fund positioning and shorter-term fund manager activity for all stocks in the Global active fund universe. The Y-axis shows the ‘Position Score’, a measure of current positioning in each stock compared to its own history going back to 2012 on a scale of 0-100%. It takes in to account the percentage of funds invested in each stock versus history, the average fund weight versus history and the percentage of funds overweight the benchmark versus history. The higher the number, the more heavily a stock is owned by active Global managers compared to its own history.
The X-Axis shows the ‘Momentum Score’, a measure of fund manager activity for each stock between 08/31/2022 and 02/28/2023 on a scale of 0% (maximum negative activity) to 100% (maximum positive activity). The Momentum Score takes in to account the change in the percentage of funds invested in each stock over the period, the change in average weight and the change in the percentage of funds overweight. The chart also highlights the companies at the extreme ends of each quadrant by colour, which will shall explore in more detail below.
Extreme Stocks
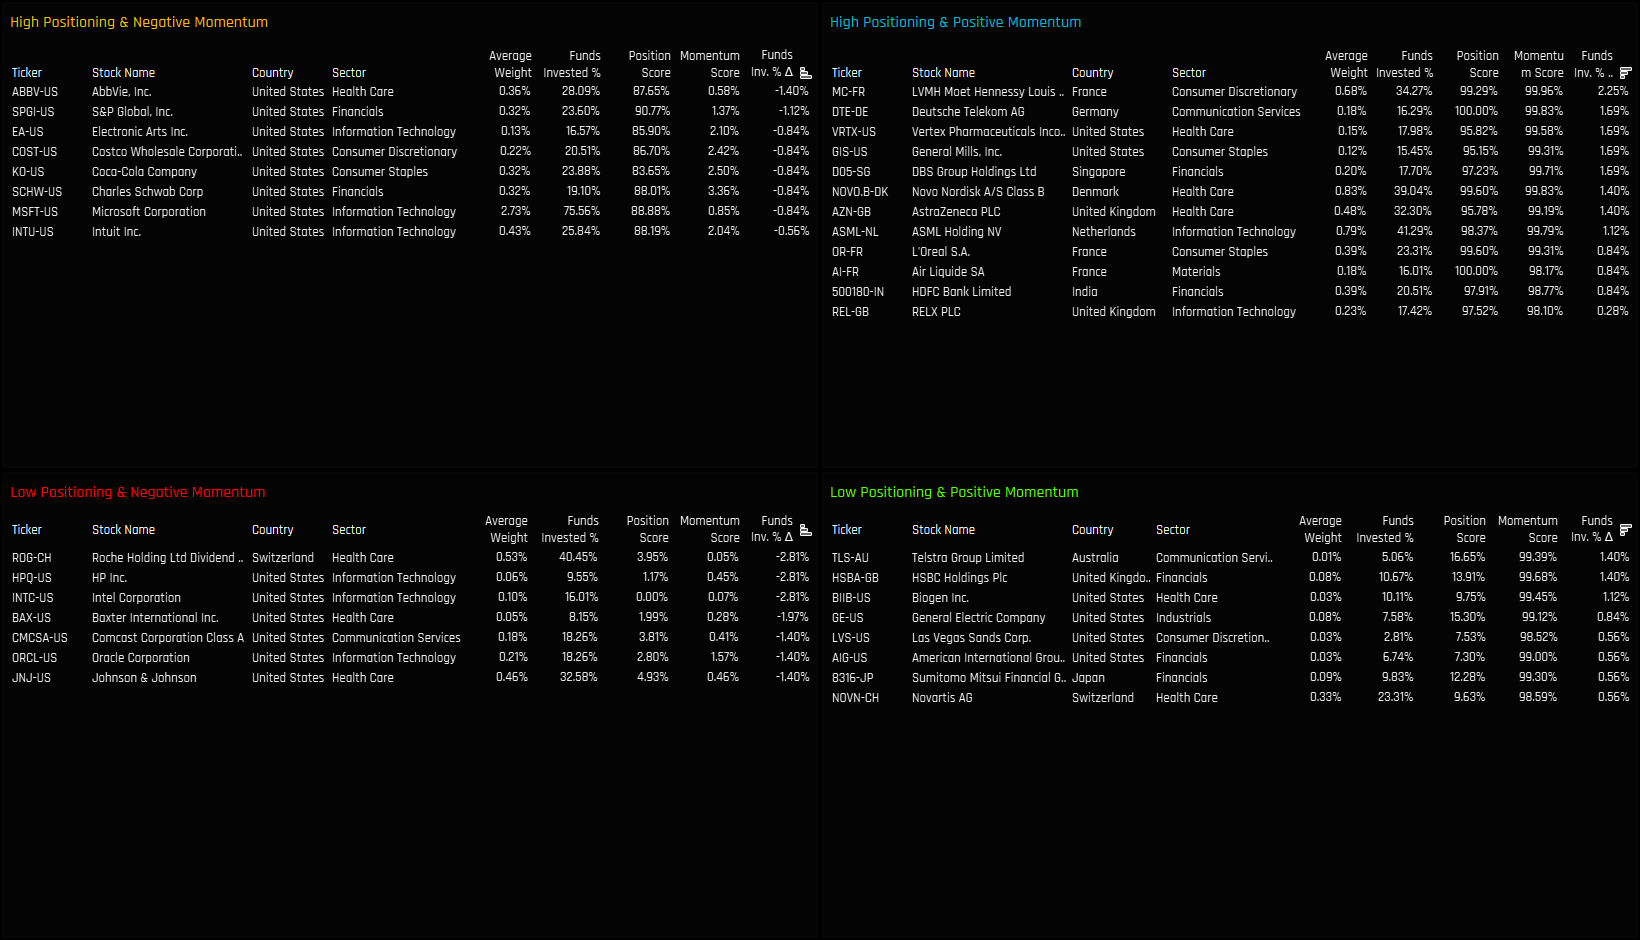
The tables below list the stocks in the extreme corners of each quadrant. The screening methodology is as follows:
High Positioning & Negative Momentum: Position Score > 80%. Momentum Score < 5%
High Positioning & Positive Momentum: Position Score > 95%. Momentum Score > 99%
Extreme Stocks
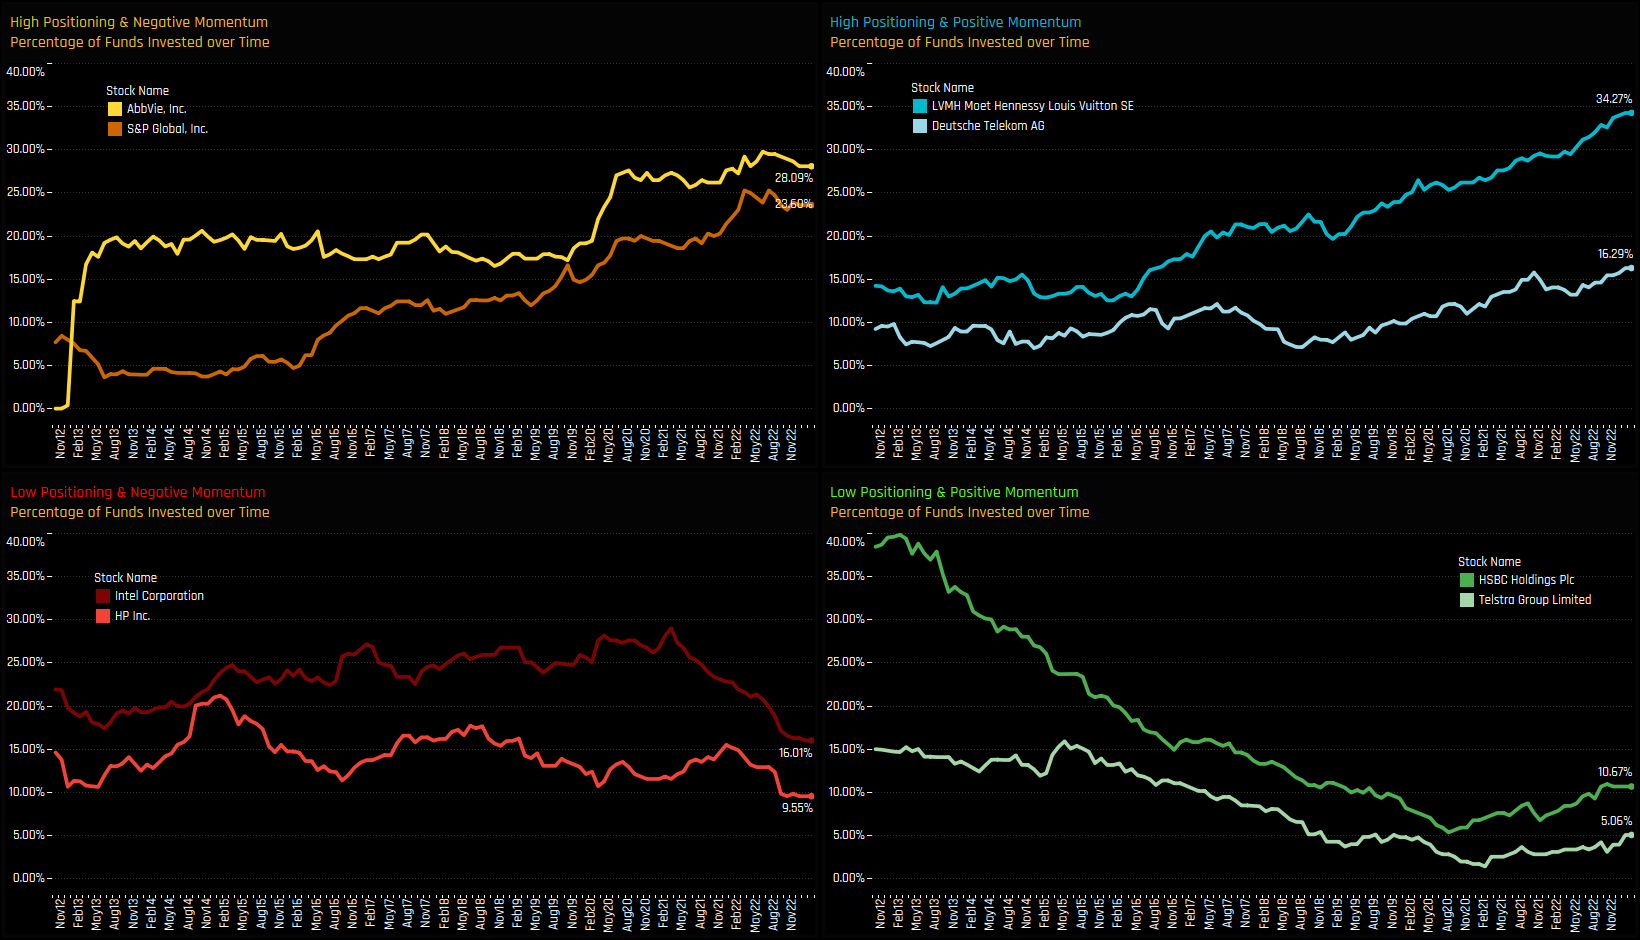
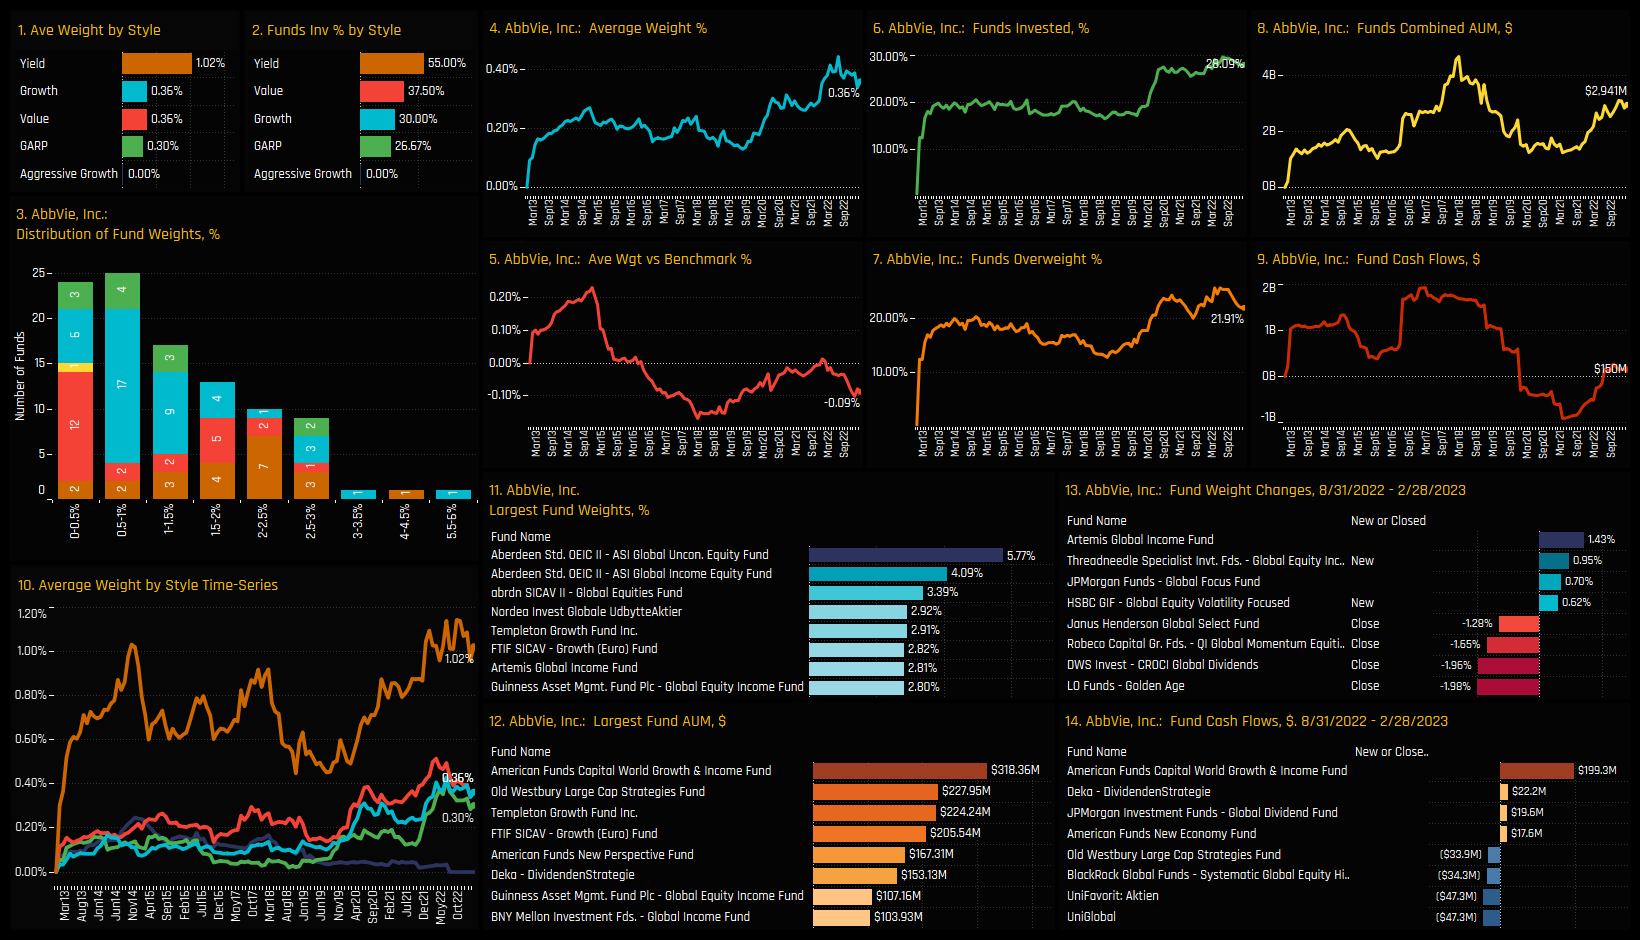
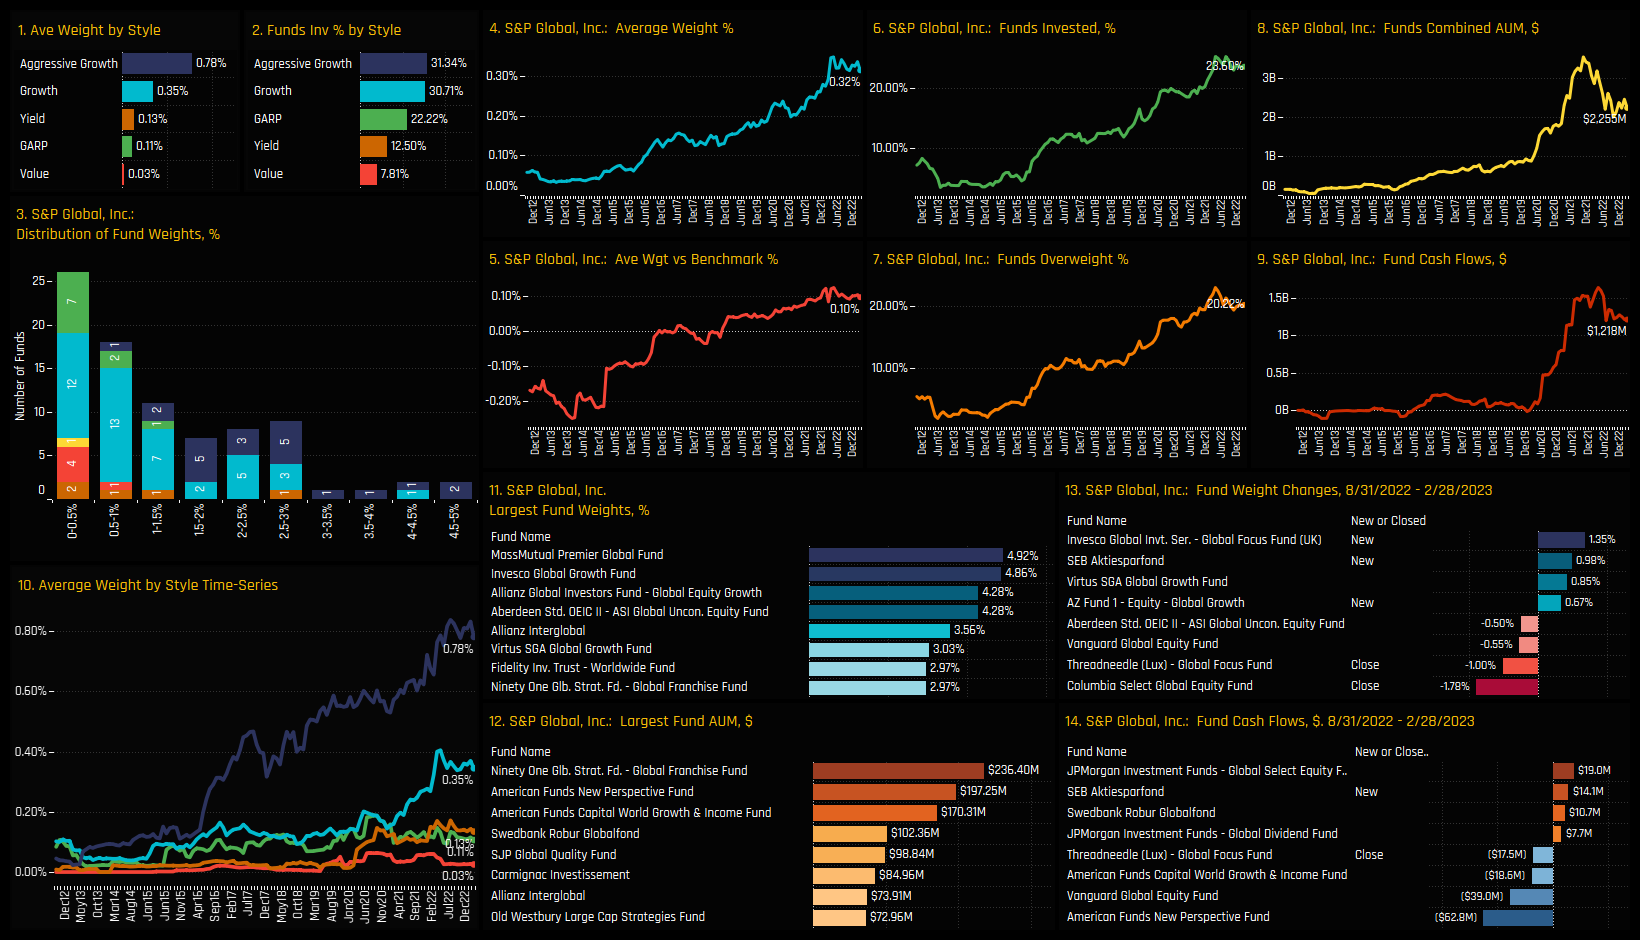
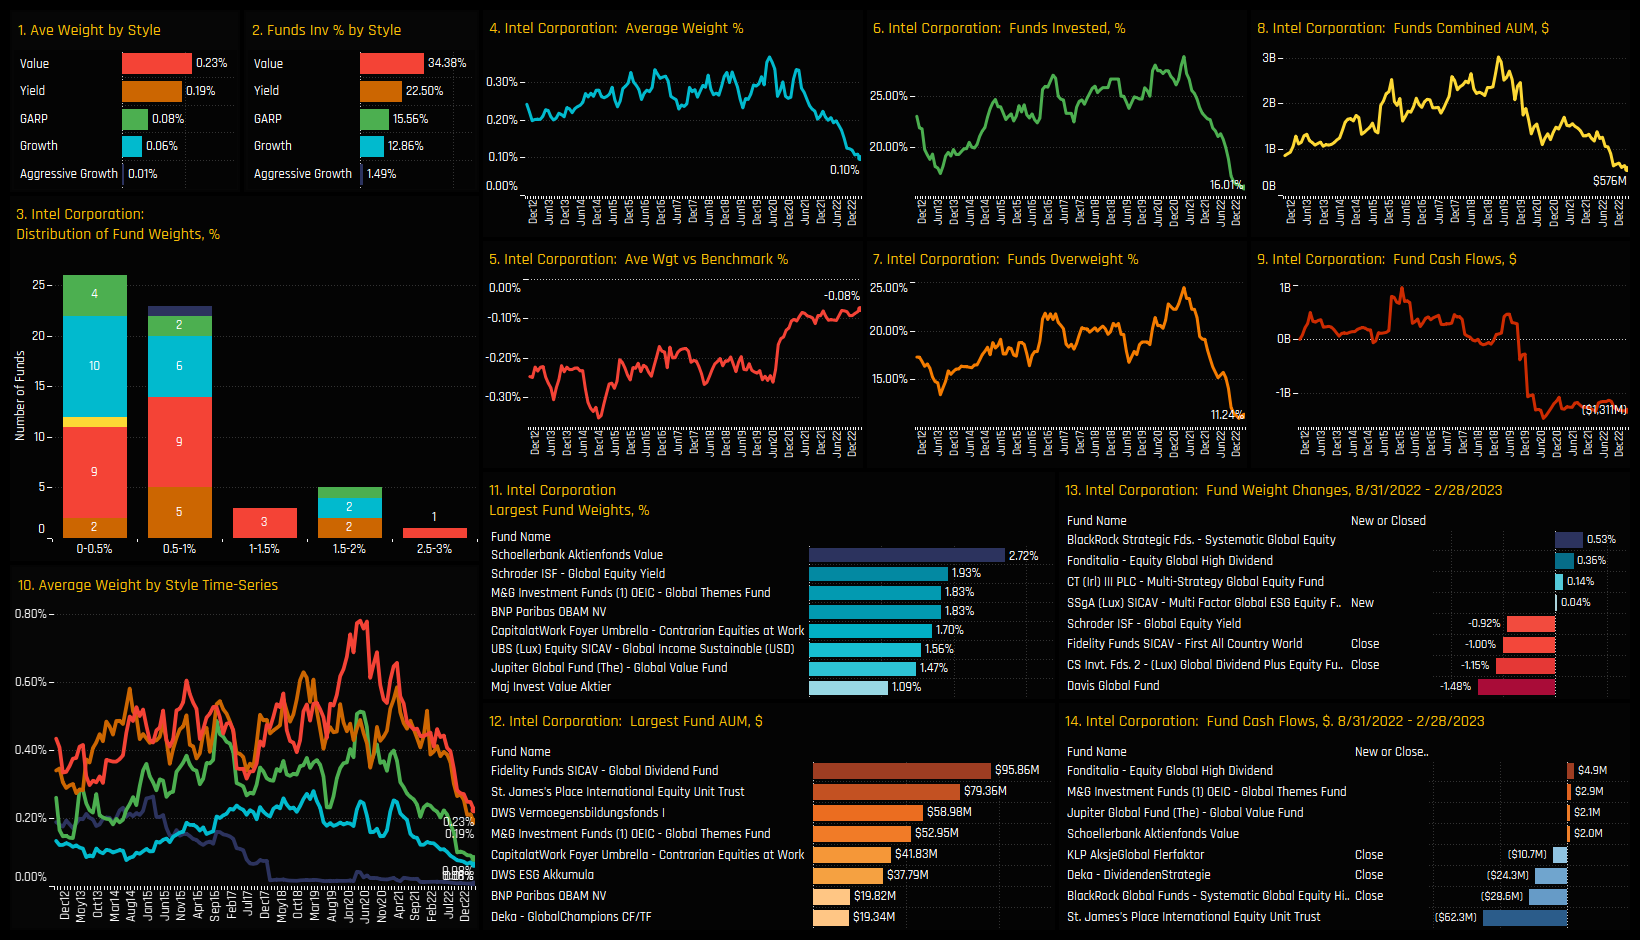
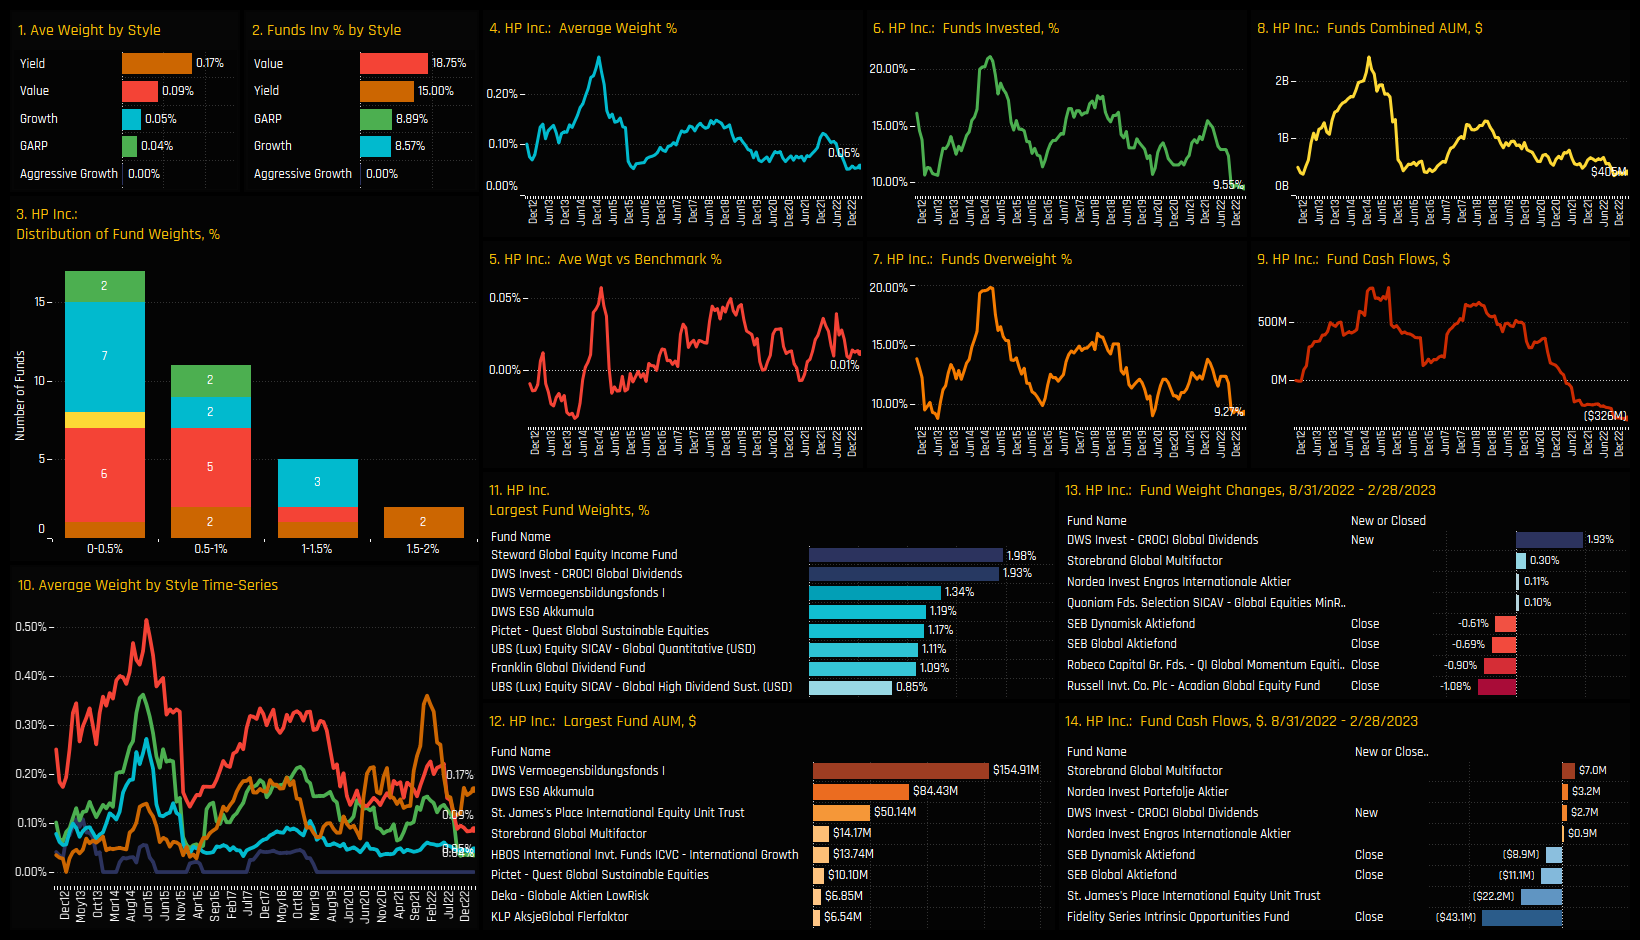
The charts below track the percentage of active funds invested in each of the top 2 stocks across the 4 categories. It’s another way to visualize how the Sentiment Grid works. For example, the top-left chart shows AbbVie Inc and S&P Global seeing fund ownership reversing from peak levels after sustained multi-year growth. In the bottom-left chart, both Intel Corporation and HP Inc have seen ownership levels drop to their lowest levels in the last decade after recent selling from active Global managers.
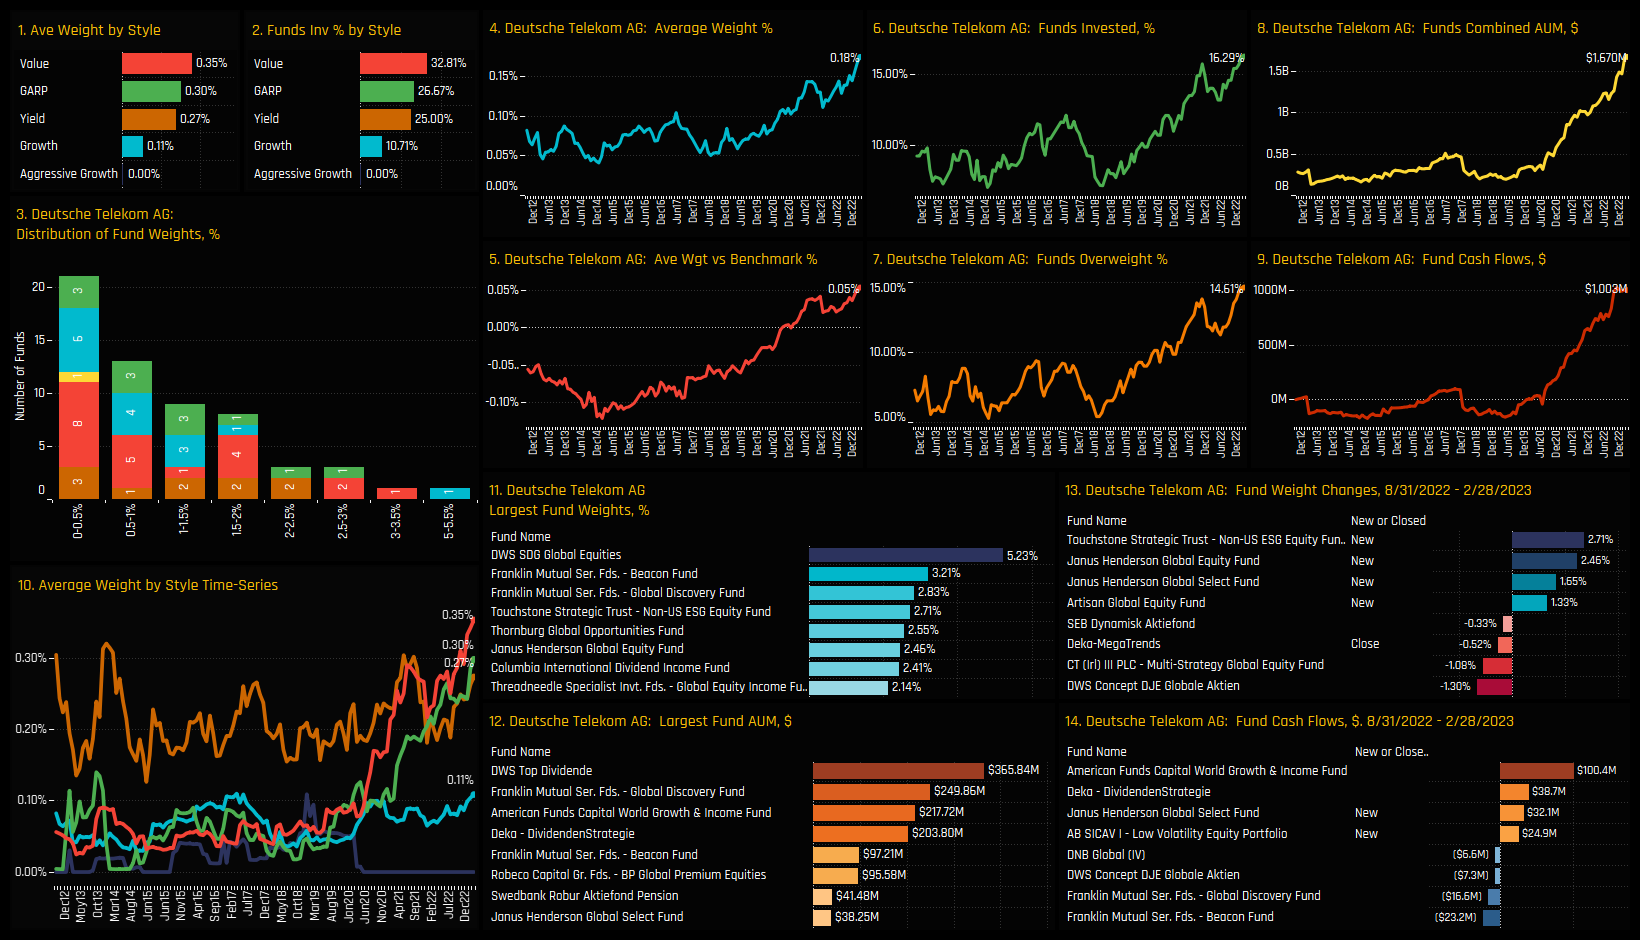
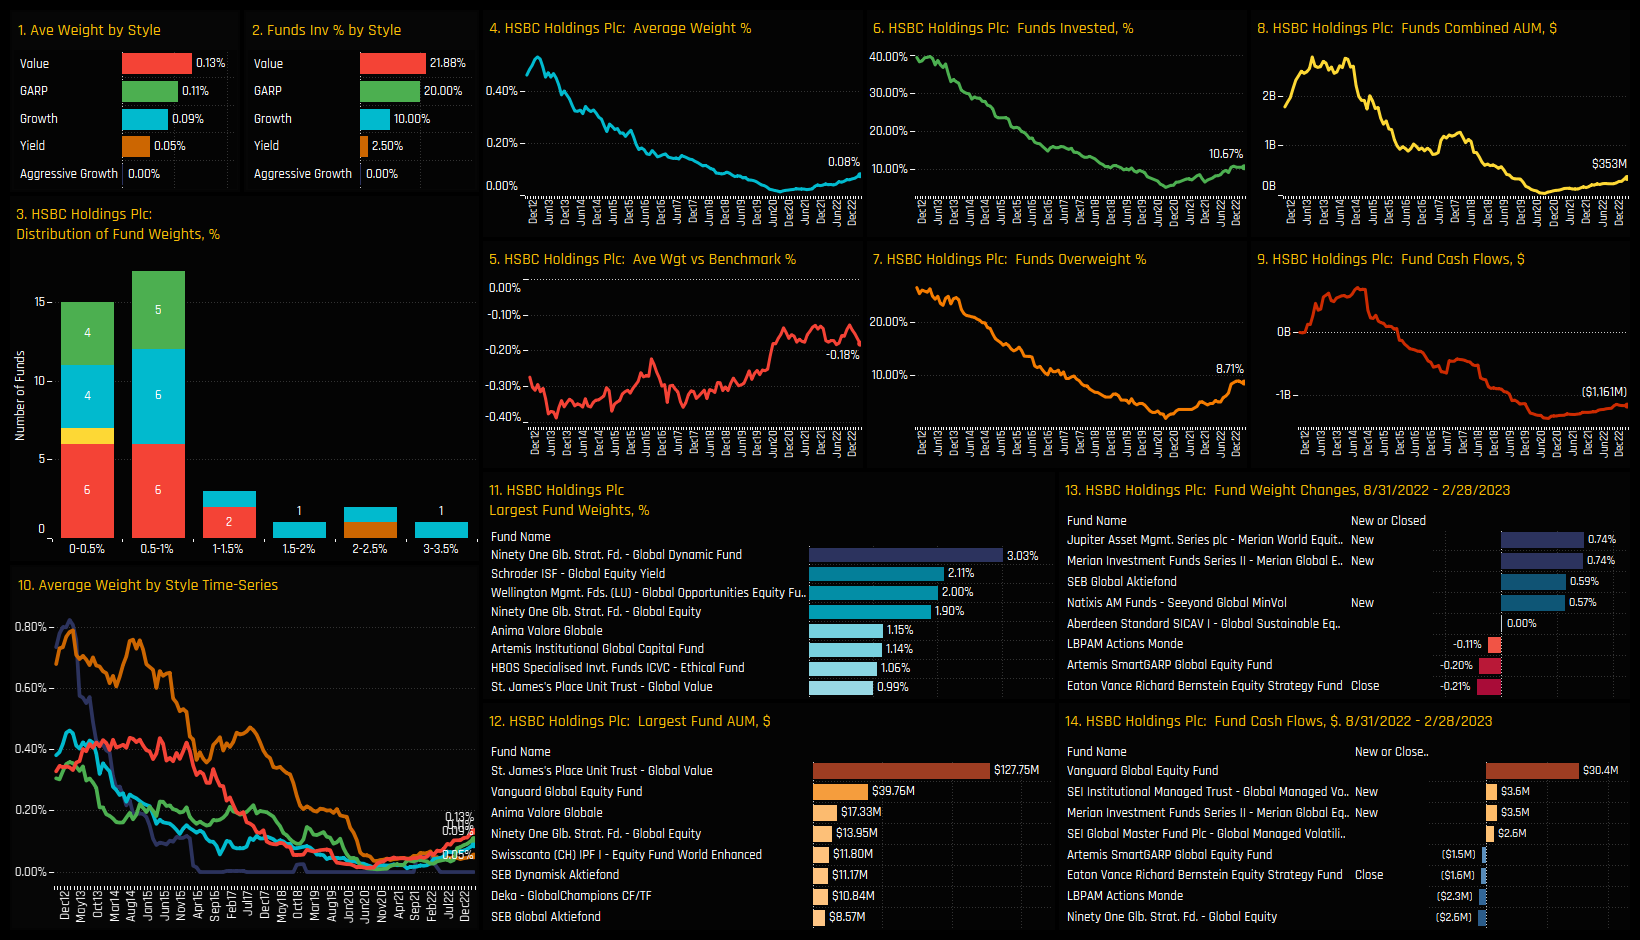
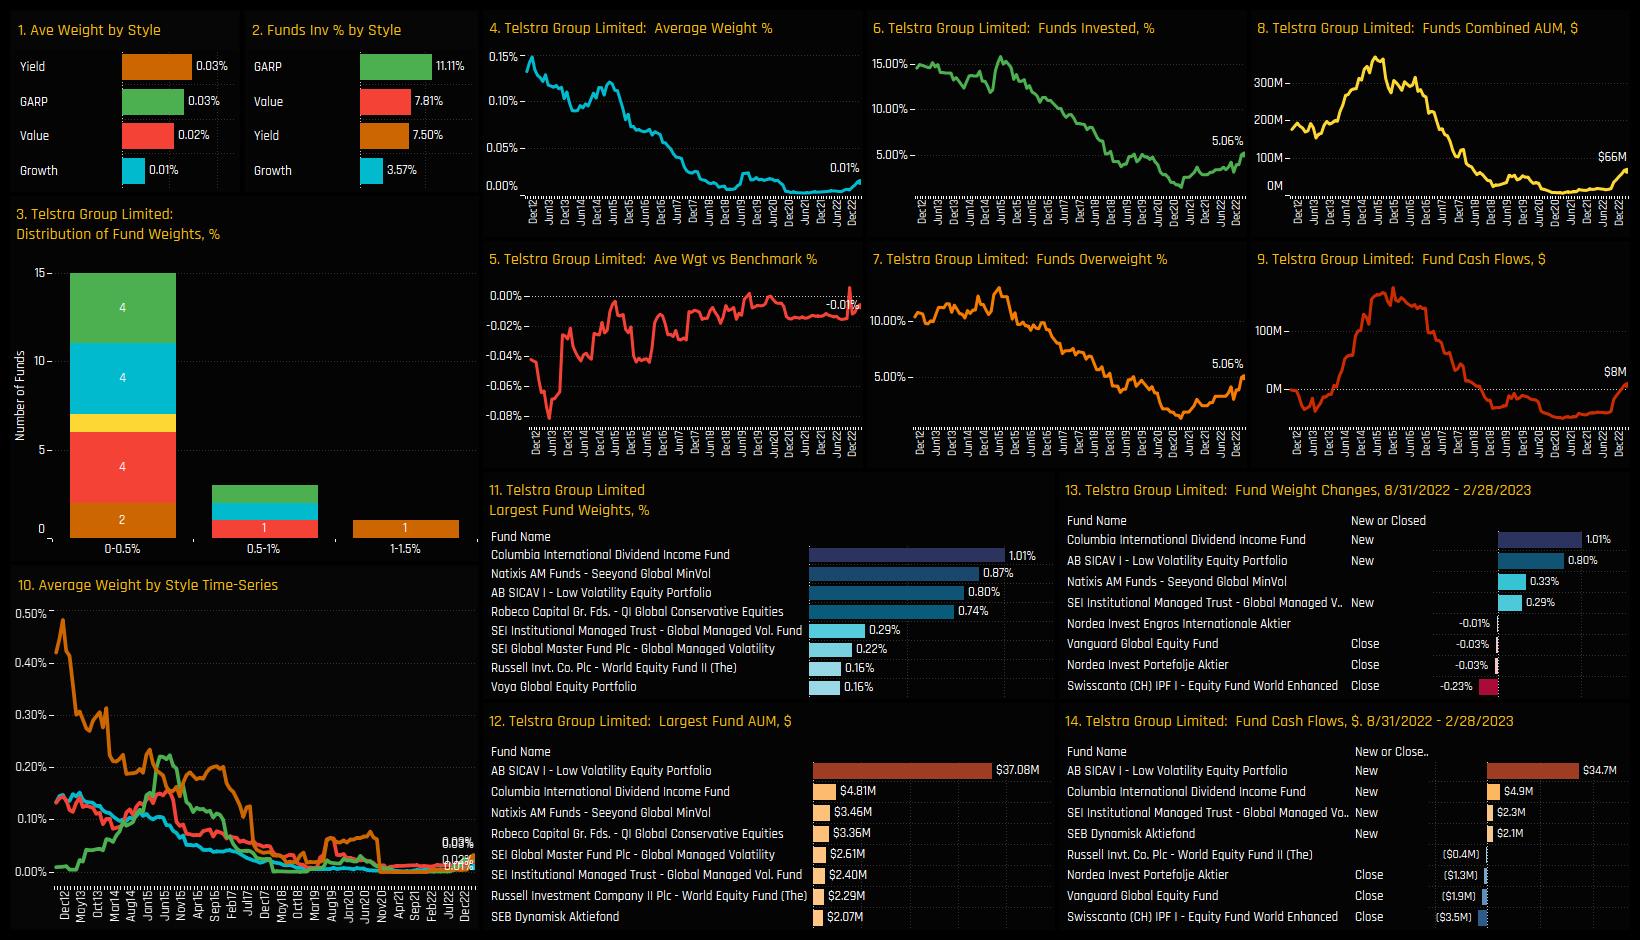
In the opposite case (bottom right), both HSBC Holdings Plc and Telstra Group Limited are at the bottom of their historical ownership ranges but both have started to climb from the lows. Top right shows LVMH and Deutsche Telekom at peak ownership after sustained increases in fund ownership in recent months. In the charts that follow we provide more detailed profiles of each of the 8 stocks at the extreme corners of our Sentiment Grid.
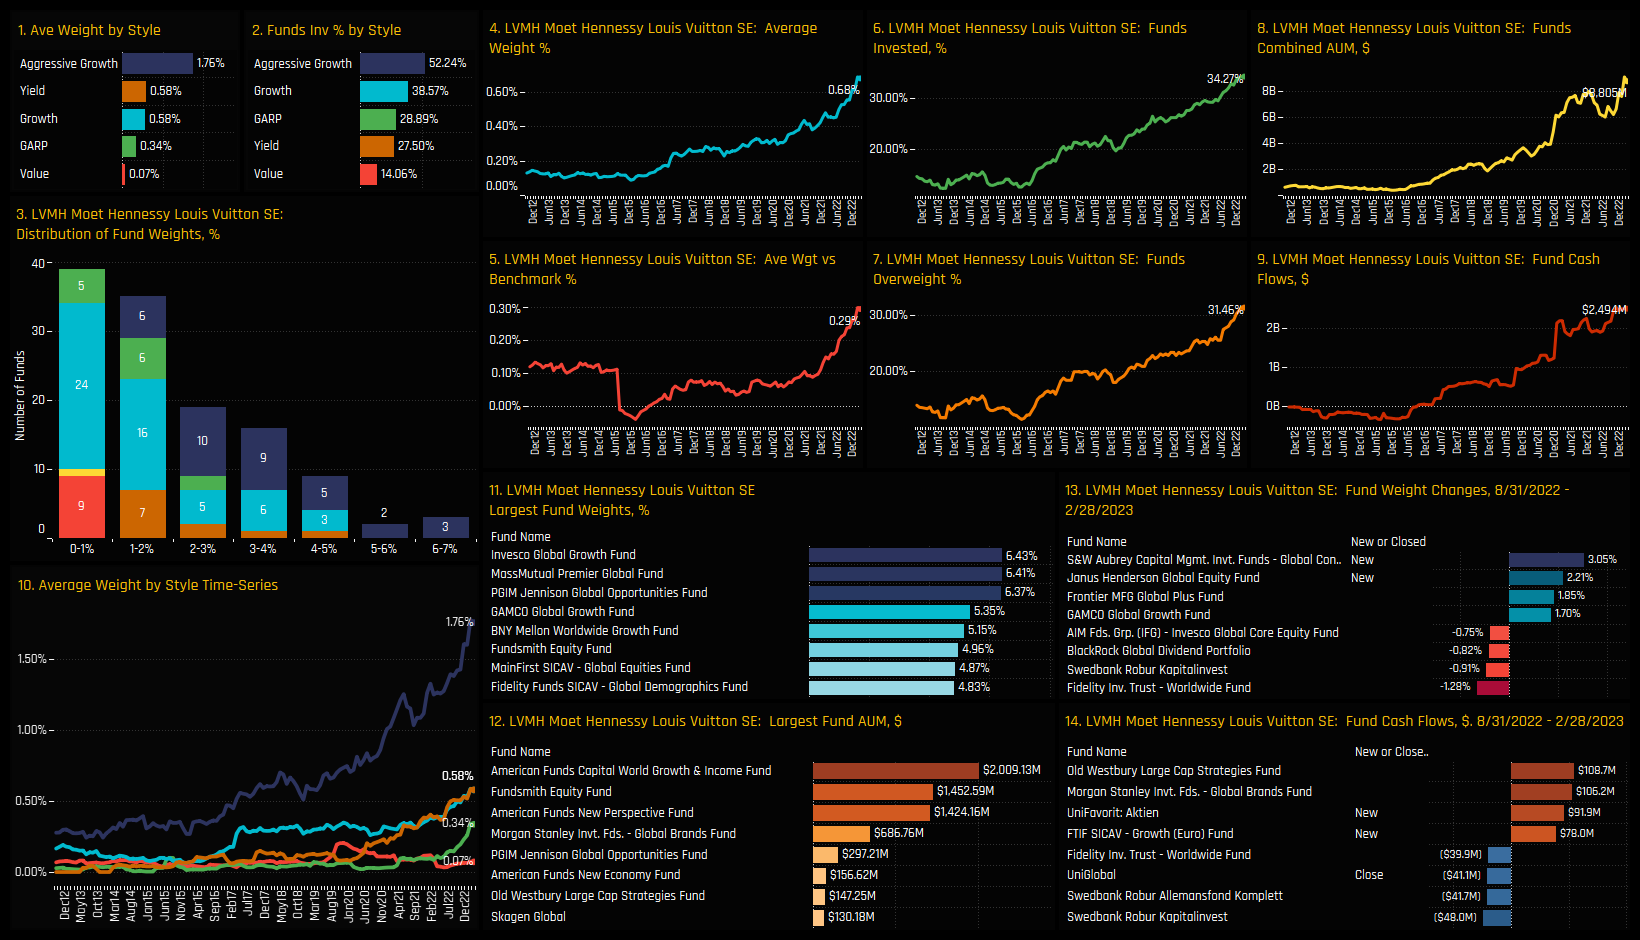
High Positioning & High Momentum: LVMH
High Positioning & High Momentum: Deutsche Telekom
High Positioning & Low Momentum: Abbvie Inc
High Positioning & Low Momentum: S&P Global
Low Positioning & Low Momentum: Intel Corporation
Low Positioning & Low Momentum: HP Inc.
Low Positioning & High Momentum: HSBC Holdings Plc.
Low Positioning & High Momentum: Telstra Group Limited
For more analysis, data or information on active investor positioning in your market, please get in touch with me on steven.holden@copleyfundresearch.com


