In this issue:
China Consumer Staples: Conviction Overweight
BYD Company Ltd: Rising Up The Ranks
China A-Shares Stock Positioning Update
154 MSCI China Equity Funds, AUM $50bn
China Consumer Staples: Conviction Overweight
Active MSCI China managers break away from benchmarks as overweights close in on record levels.
Time-Series & Sector Positioning
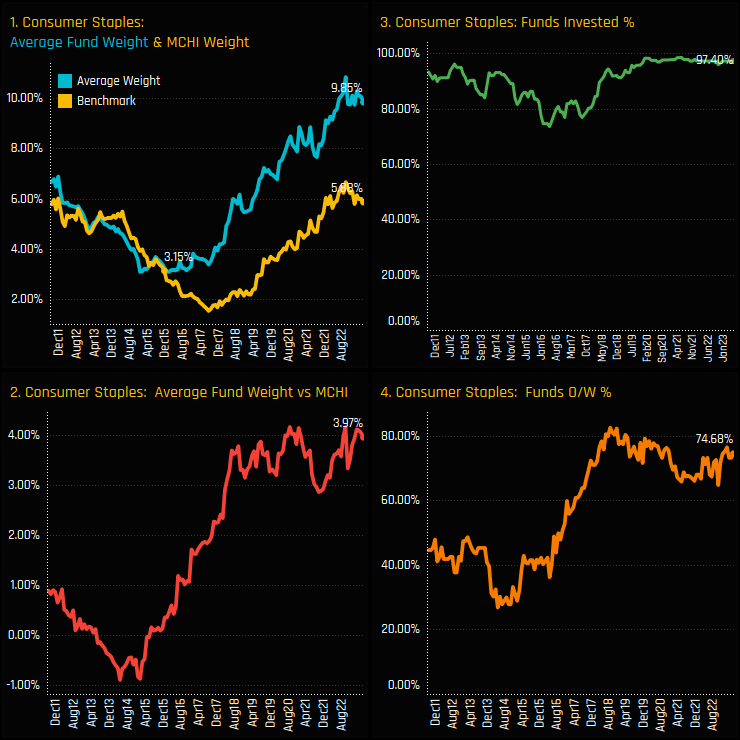
The growth in Consumer Staples exposure has been a key theme for China active managers over the last decade. Average fund weights matched the benchmark at 3.15% in late 2015, but since then there has been a growing divergence between active and passive allocations (ch1). Versus the iShares MSCI China benchmark, the active funds in our analysis are now positioned +3.97% overweight (ch2), with 74.7% of managers holding a Consumer Staples weight higher than the benchmark’s 5.88% allocation (ch4).
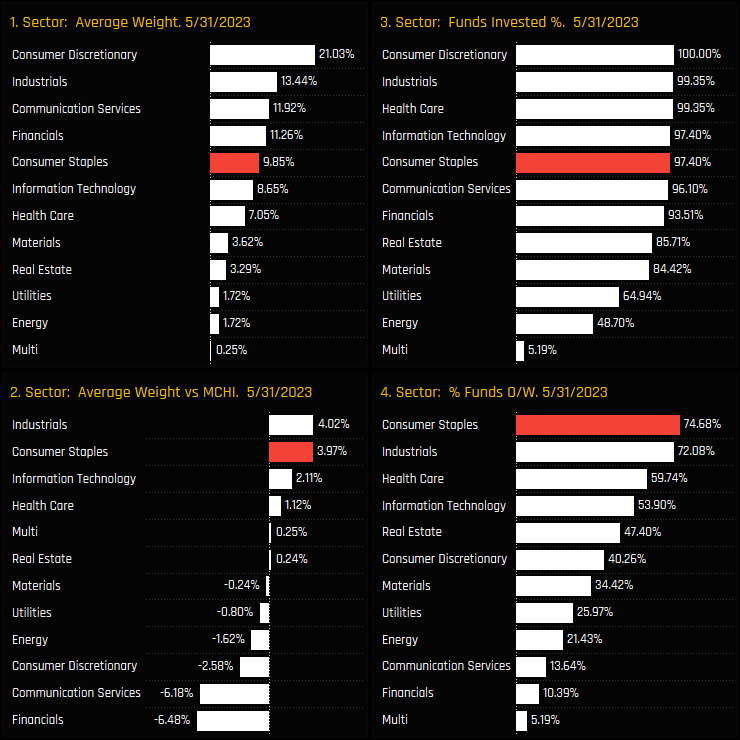
Versus sector peers, Consumer Staples are the 5th largest sector allocation behind Financials, Communication Services, Industrials and Consumer Discretionary (ch1). Versus the iShares MSCI China ETF, Consumer Staples are the 2nd largest overweight position behind Industrials (ch2), offsetting large underweights in the Financials and Communication Services sectors.
Fund Holdings & Activity
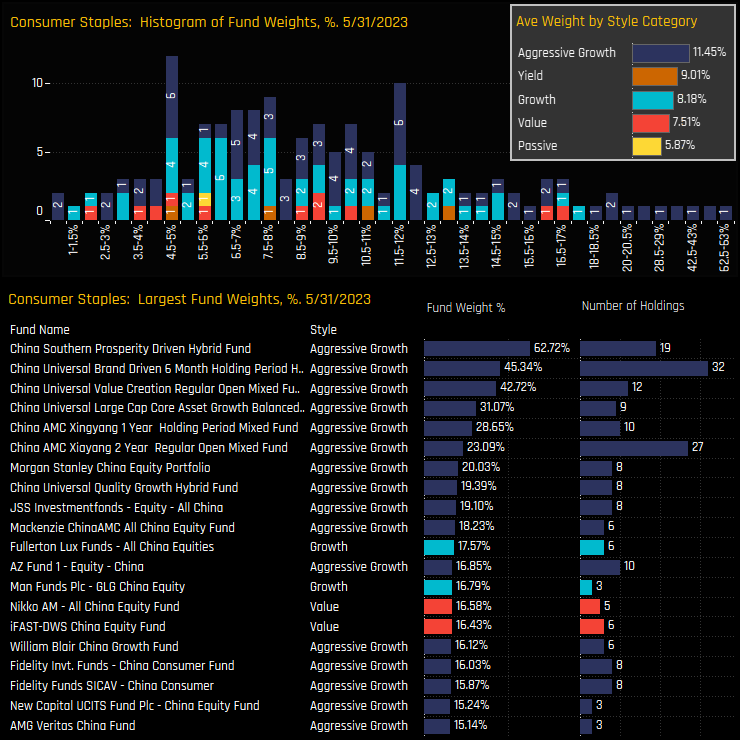
The histogram of fund level holdings in the top chart shows the bulk of Consumer Staples weights at between 4.5% and 12%. The long tail to the upside is dominated by domestic China strategies at the Aggressive Growth end of the spectrum, led by China Southern Prosperity (62.7%) and China Universal Brand Driven (45.3%). All Style groups are overweight the iShares MSCI China ETF, on average
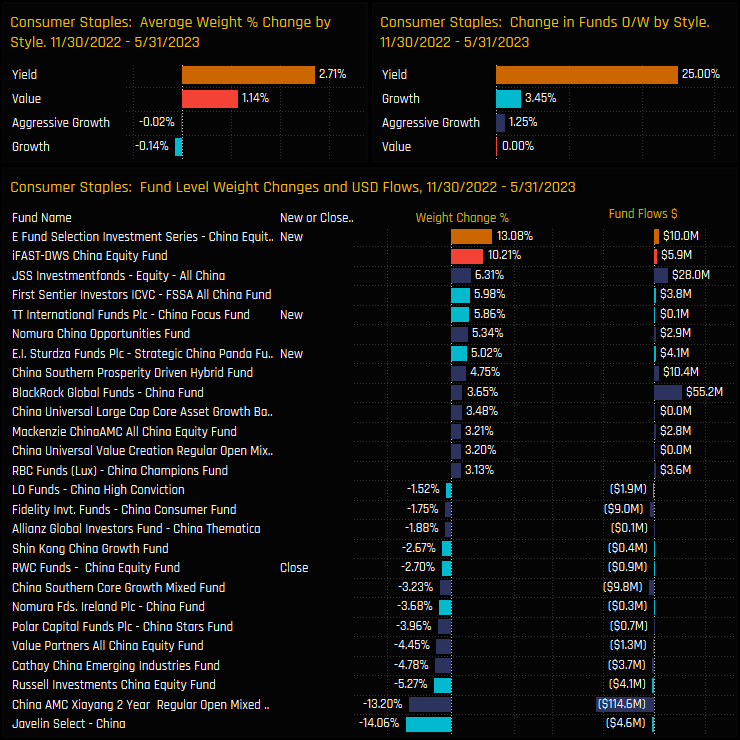
Fund level activity over the last 6-months has been skewed to the buyside, with 3 opening positions cancelling out 2 closures, led by E Fund China Equity Dividend’s 13.1% new holding. With only 4 Yield funds in our China analysis, this shows as a 25% increase in the percentage of Yield funds moving to overweight, though a further +3.45% of Growth and +1.25% of Aggressive Growth funds made the same move.
Stock Holdings & Activity
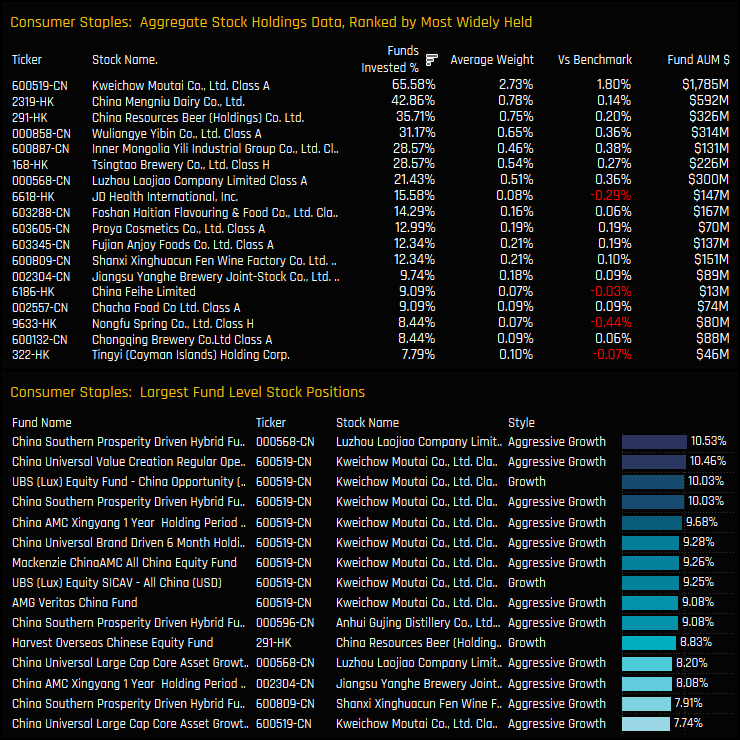
Stock holdings in the Consumer Staples sector are widespread, with 7 companies held by more than 20% of the funds in our analysis. The most widely held is Kweichow Moutai Co, a stock owned by 65.6% of funds at an average weight of 2.73%, or overweight the benchmark by +1.80%. The list of large stock level positions in the bottom chart below is dominated by Kweichow Moutai, with 3 funds holding a >10% position and a further 6 above 9%. Kweichow is the high conviction holding within the sector.
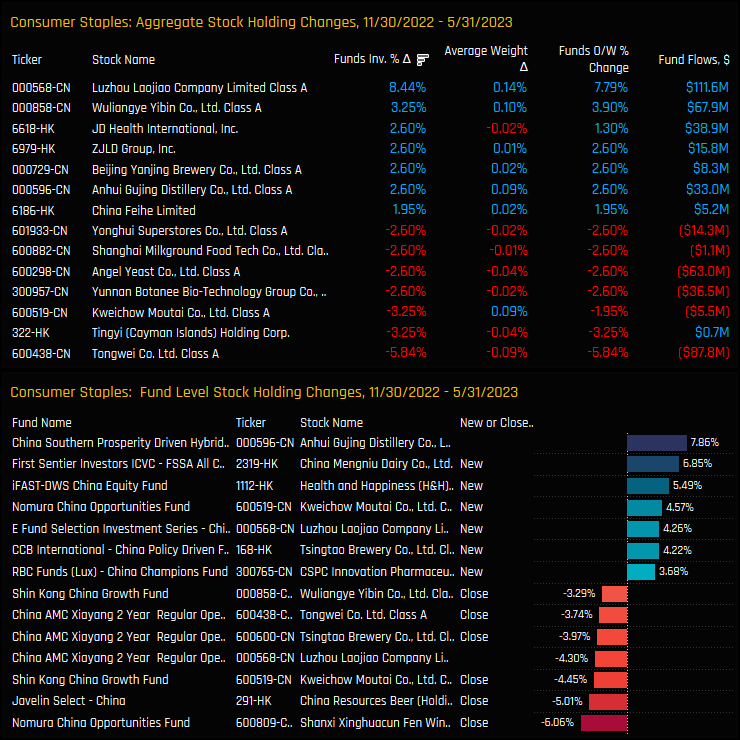
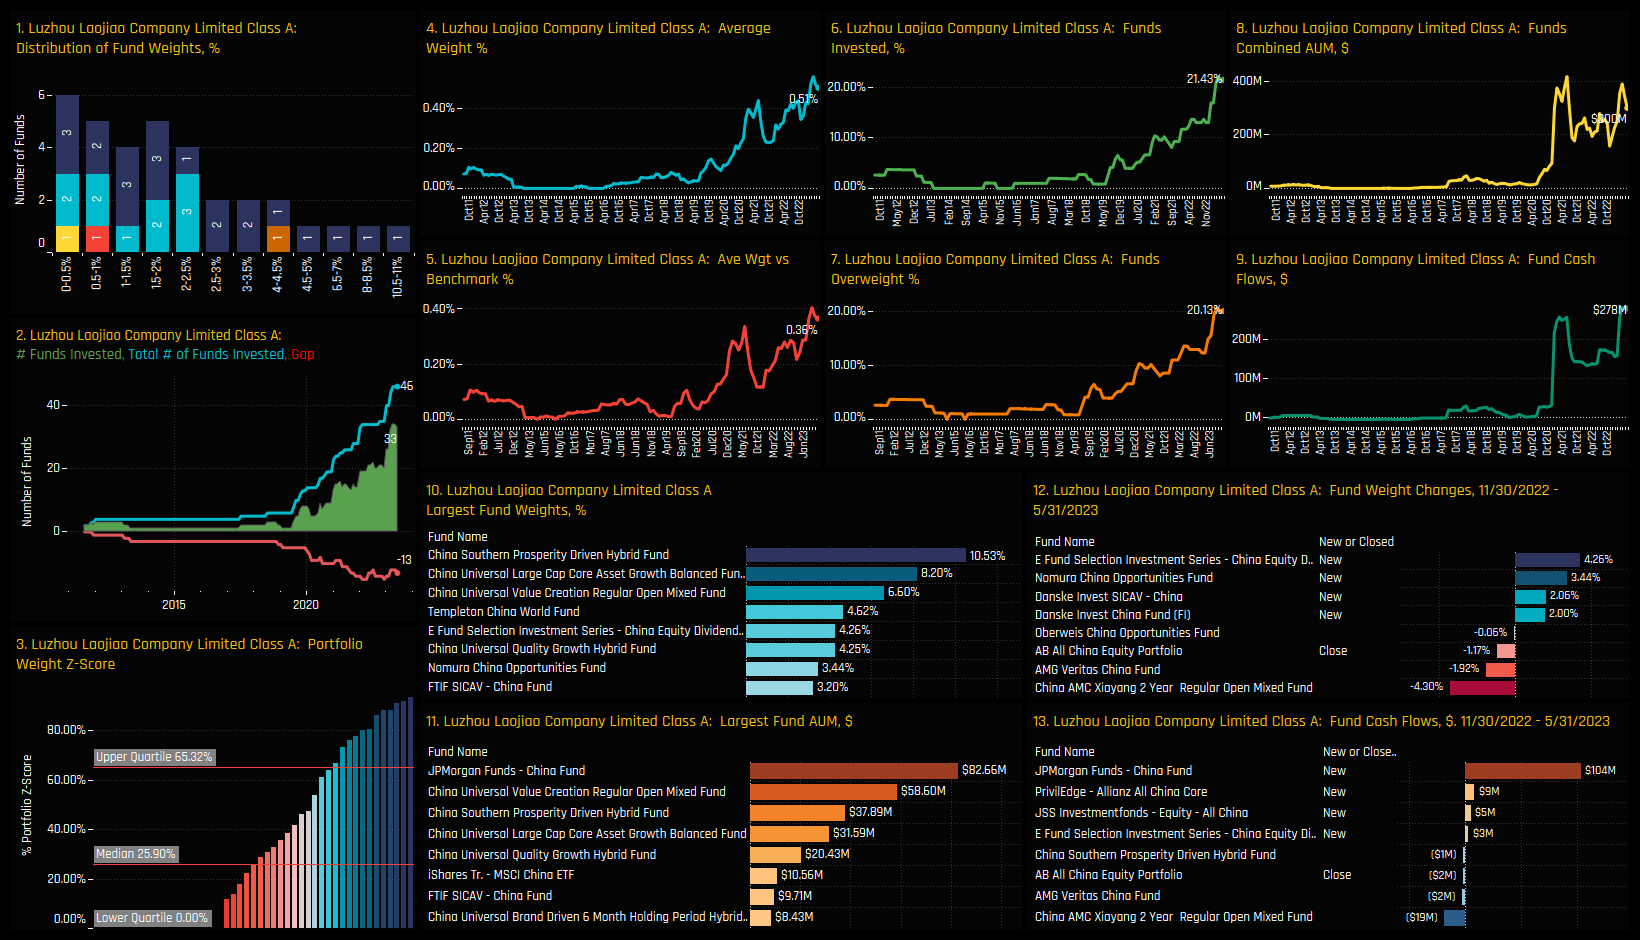
Aggregate stock level position changes over the last 6-months are shown in the top chart below. There has been a high degree of rotation within the sector, with a net +8.4% of funds buying in to Luzhou Laojiao Company and +3.25% in to Wuliangye Yibin Co. Against this, a net -5.84% of funds closed exposure to Tongwei Co and -3.25% closed Tingyi Holding Corp and Kweichow Moutai positions. The bottom chart highlights the largest individual fund level changes over the same period, with China Southern Prosperity Driven Hybrid Fund’s +7.86% weight increase in Anhui Gujing Distillery among the larger moves.
Conclusions & Links
The majority of active MSCI China funds are positioned for the outperformance of the Consumer Staples sector. Overweights are near record levels at +3.97% above benchmark, underpinned by strong ownership in stocks such as Kweichow Moutai and Mengniu Dairy.
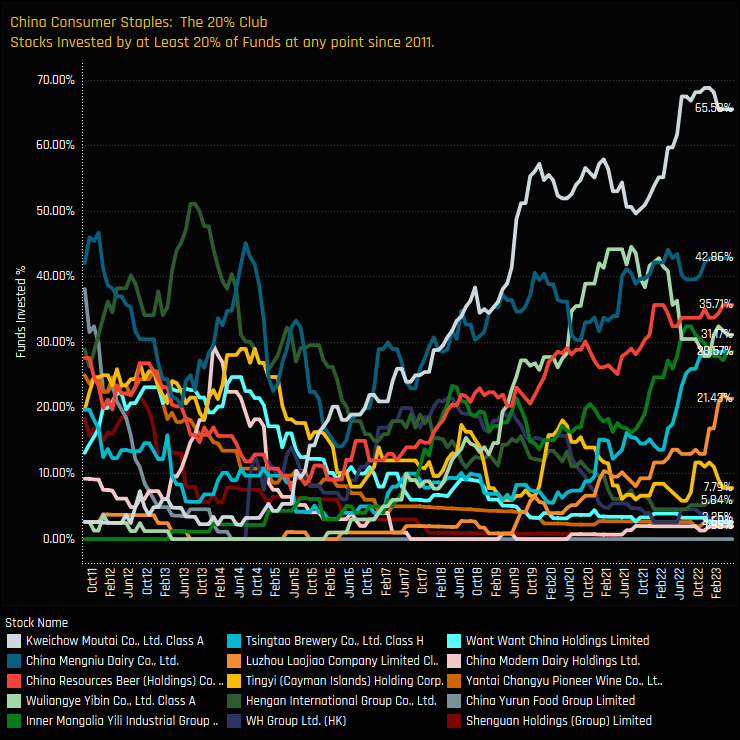
In fact, today’s 7 most widely held stocks in the Consumer Staples sector join a prized group of just 15 companies that have ever been owned by more than 20% of funds at any one time. The time-series of funds invested for these stocks is shown in the chart opposite. Dubbed the 20% Club, 8 of these stocks have since left, with Luzhou Laojiao Company the most recent entrant. The remaining 6 stocks are Kweichow Moutai, China Mengniu Dairy, China Resources Beer, Wuliangye Yibin, Inner Mongolia Yibin and Tsingtao Brewery.
The 20% club accounts for 65% of the total Consumer Staples allocation and 88.4% of the total overweight. Though 106 stocks have found investment in the Consumer Staples sector today, in the mind of the active China investor at least, 7 of these are best positioned to capture growth in China’s vast consumer market.
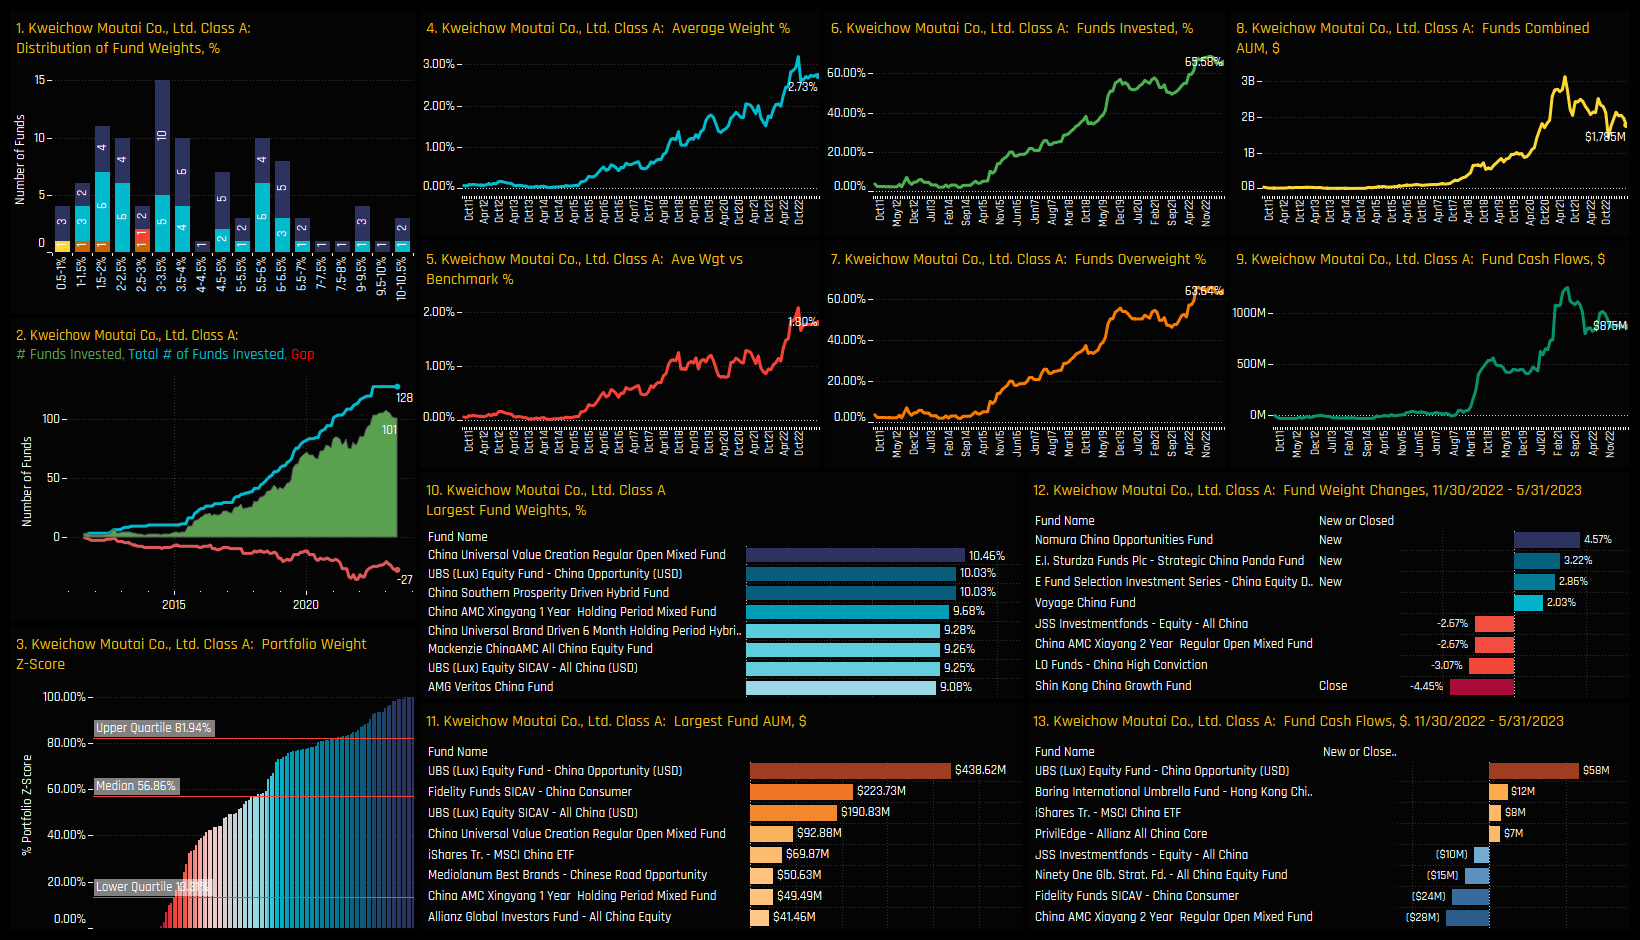
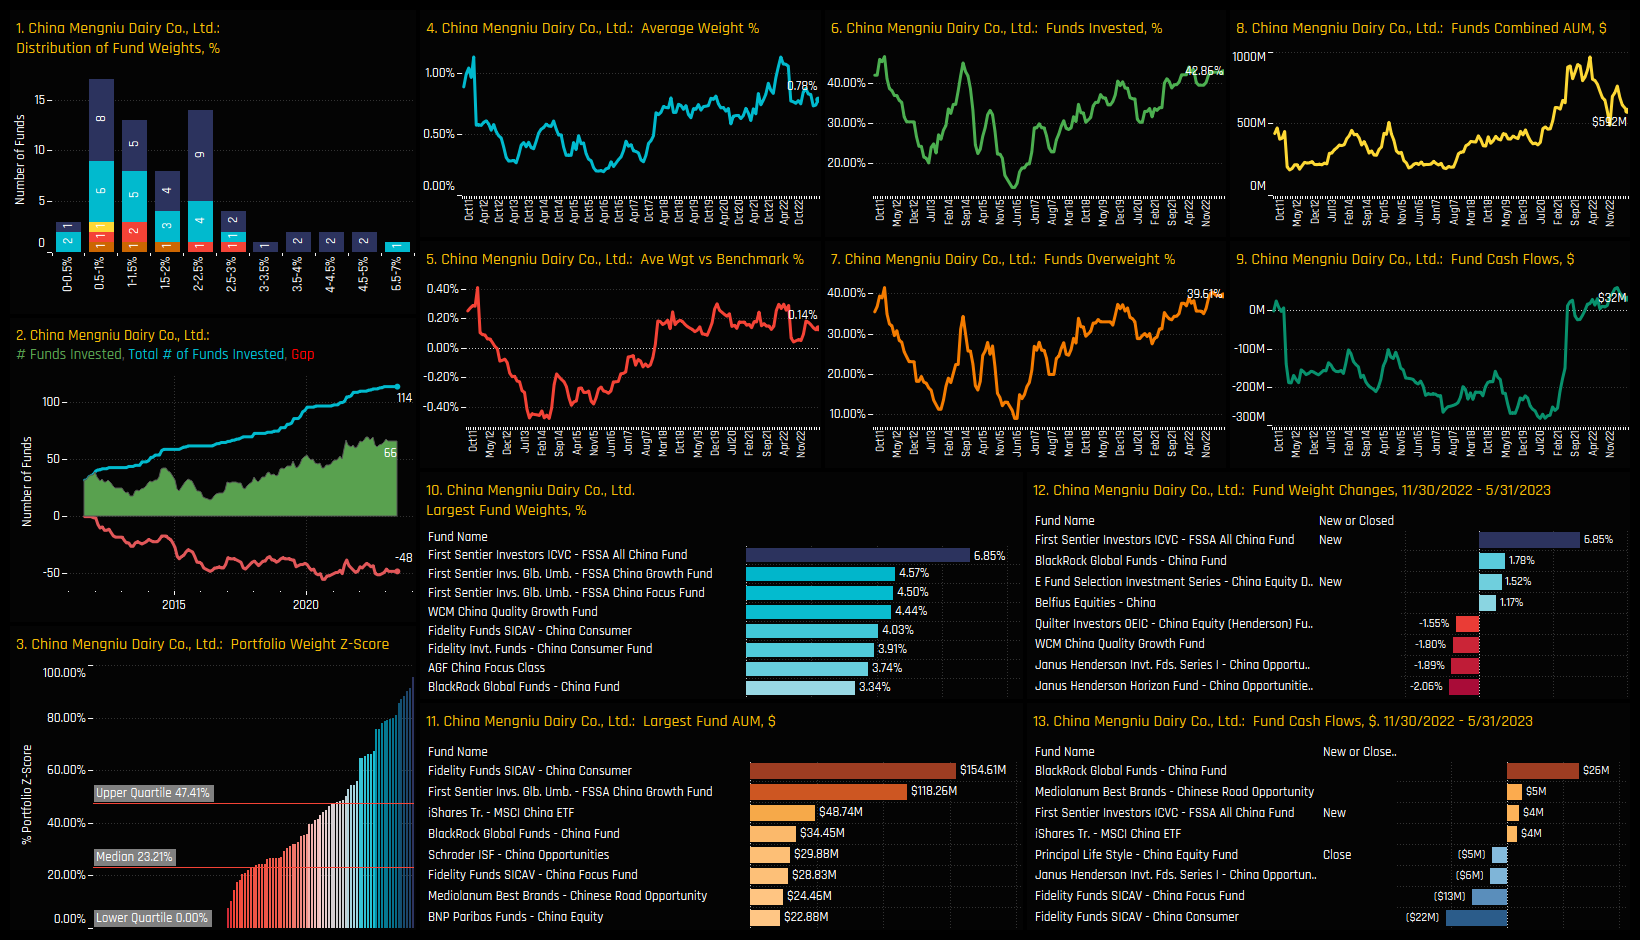
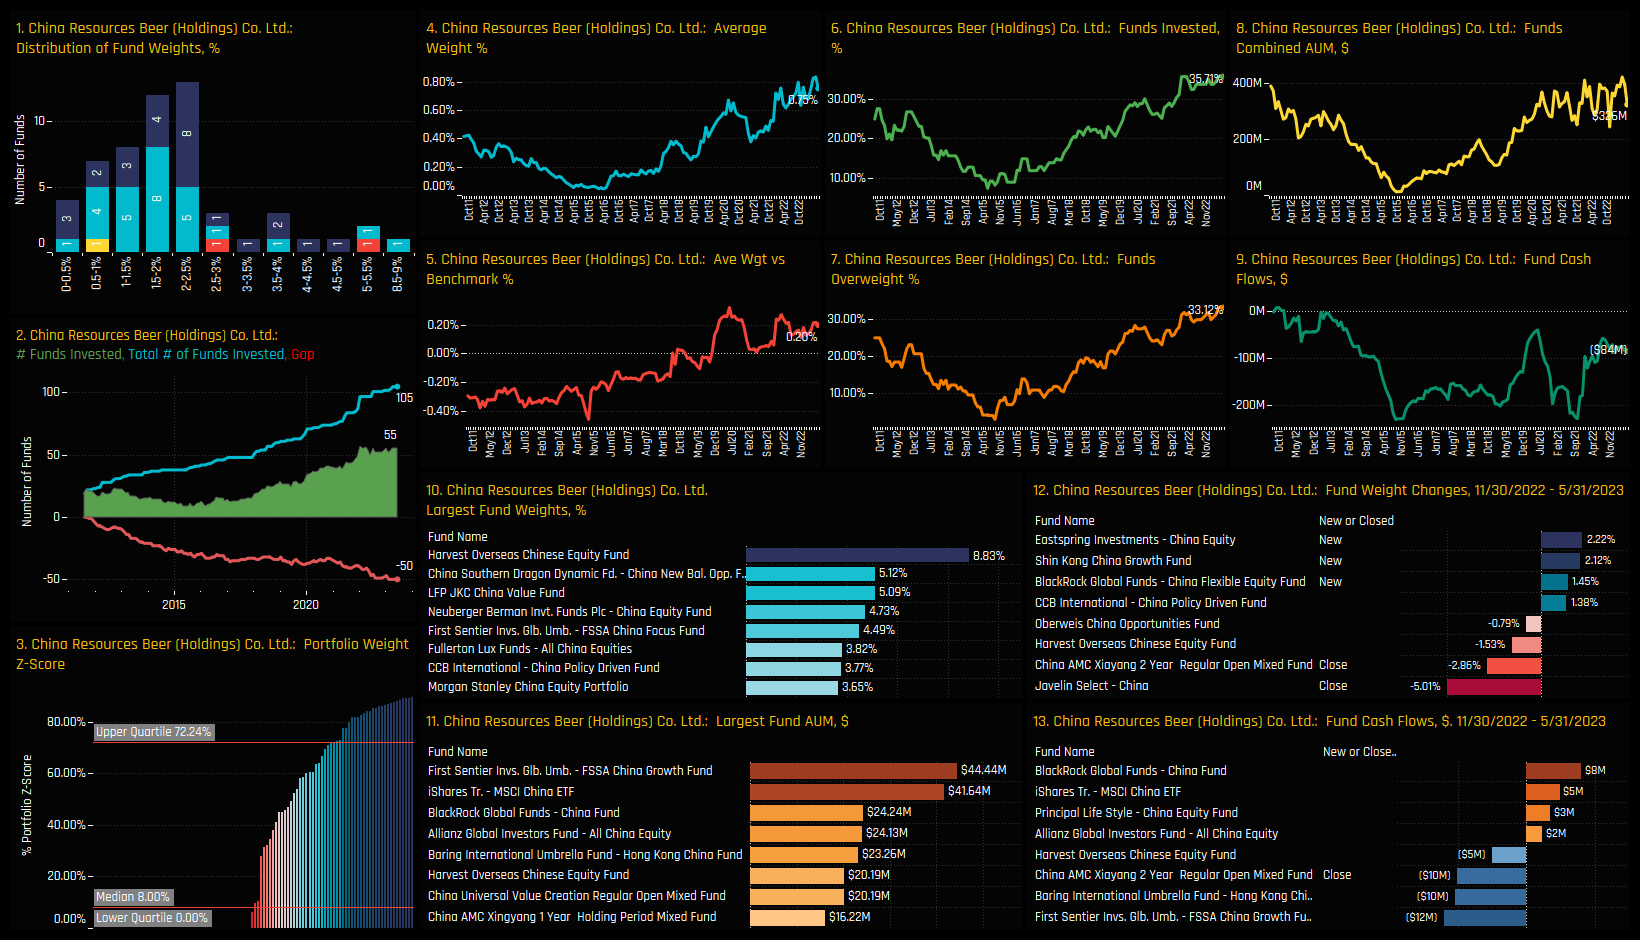
Click on the link below for an extended data report on China Consumer Staples positioning. Scroll down for stock profiles on Kweichow Moutai, China Mengniu Dairy, China Resources Beer and Luzhou Laojiao Company.
China A-Share funds join EM and Asia Ex-Japan Funds in raising exposure to BYD.
Time-Series Analysis & Stock Activity
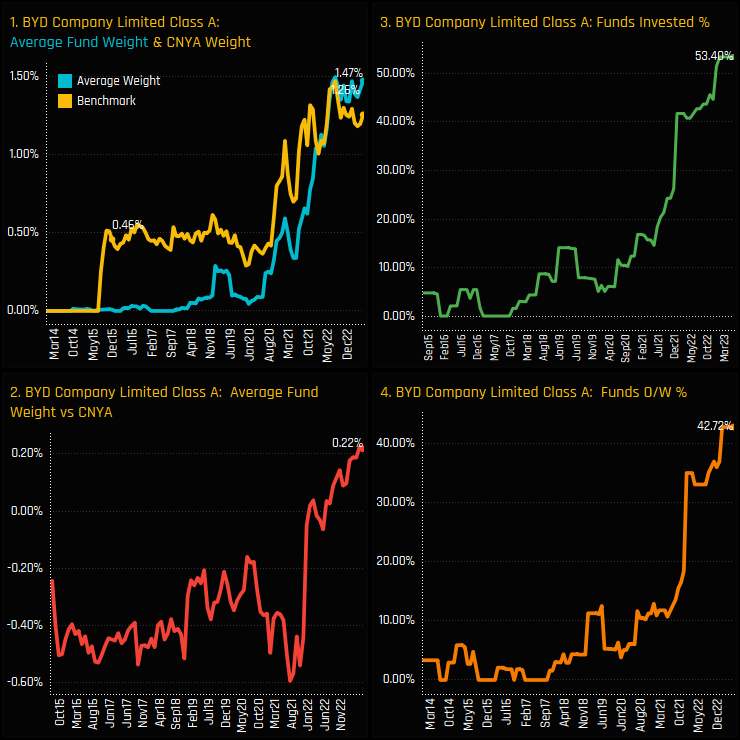
Ownership in BYD Company Limited A Shares has soared to record levels. A consistently avoided stock among active China A-Share investors before 2020, interest started to gather momentum towards the early part of 2020. Chart 3 below shows the percentage of A-Share funds invested in BYD over time, with a sharp jump higher from below 20% in mid-2021 to record levels of 53.4% today. This aggressive ownership increase has resulted in the collapsing of a sizeable underweight position that ran from 2015 – 2021. With nearly half of the A-Share funds in our analysis now positioned overweight, sentiment has never been stronger.
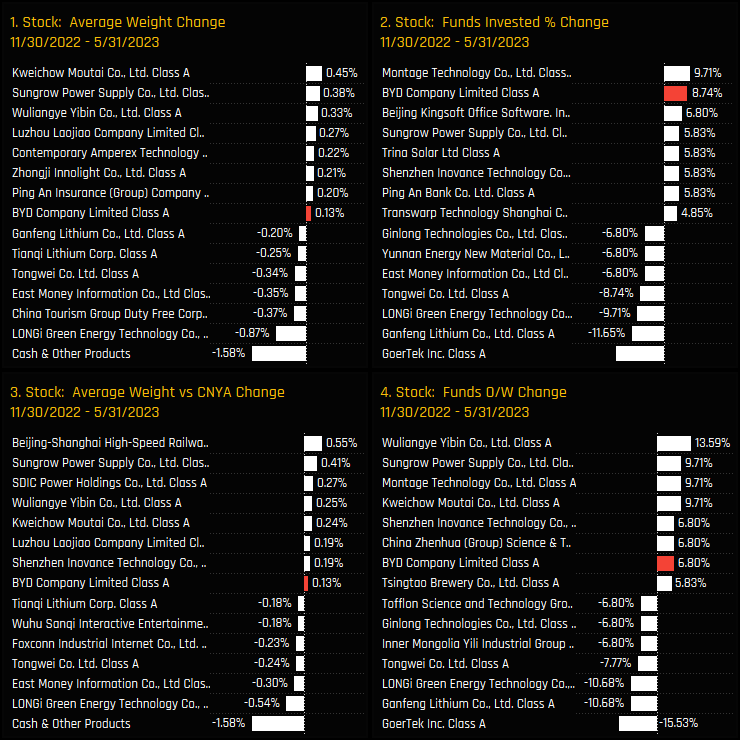
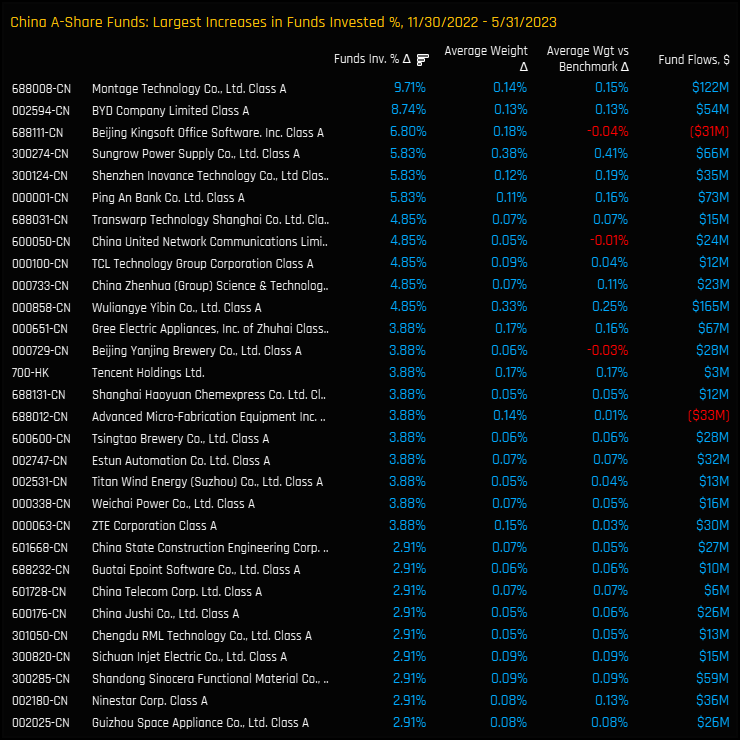
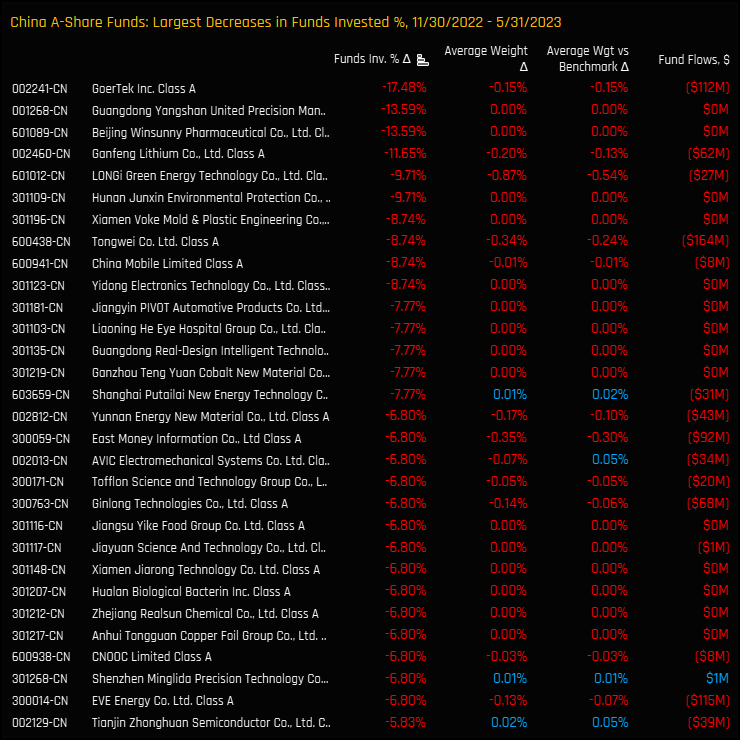
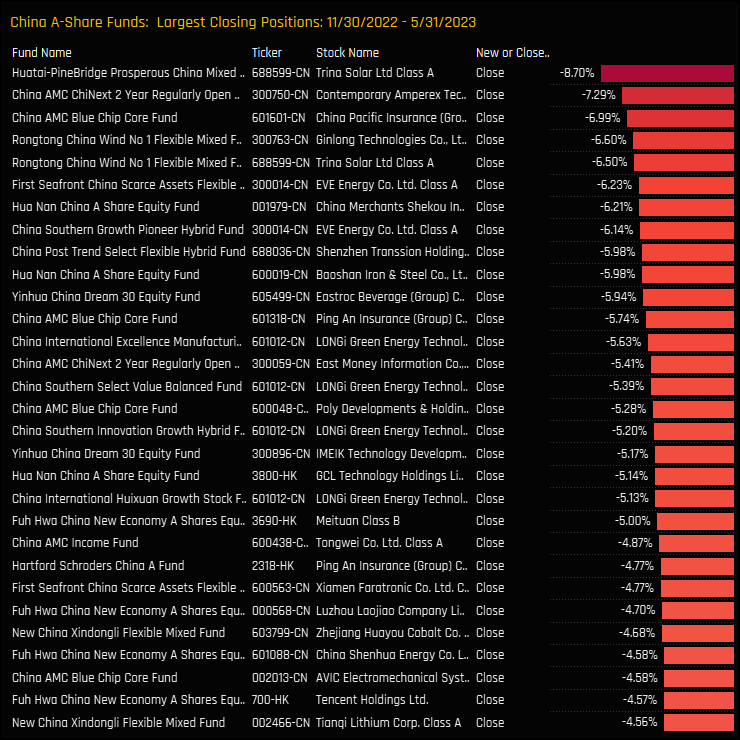
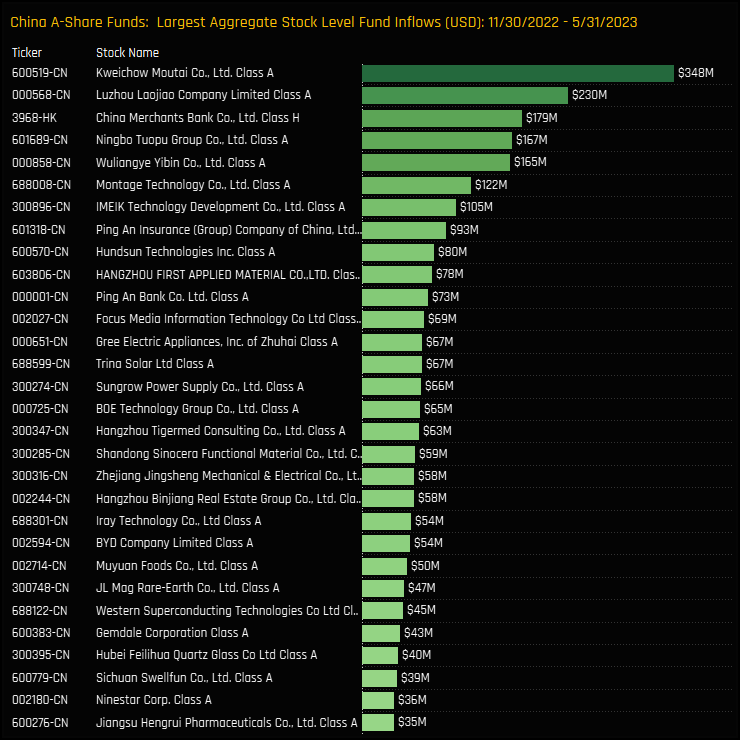
Over the last 6-months, BYD has maintained this positive momentum and has faired well versus China A-Share peers across all sectors, as highlighted in the charts below. All 4 measures of fund ownership moved higher over the period, with the rise in the percentage of funds invested of +8.74% the second highest across the A-Share universe. Montage Technology Co captured the largest increase in ownership, whilst A-Share managers closed positions in GoerTek Inc Class A, Ganfeng Lithium Co and LONGi Green Energy Technology.
Fund Activity & Latest Fund Holdings
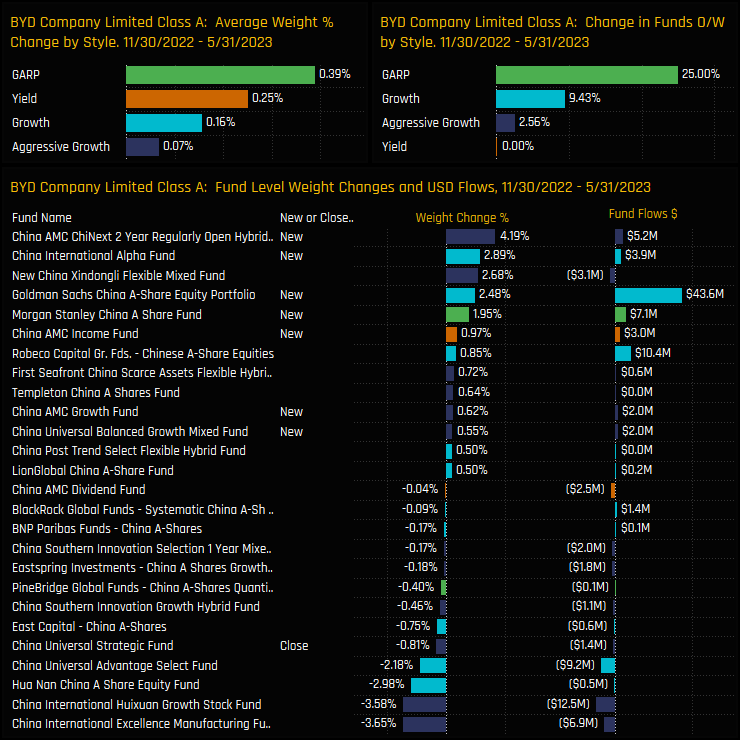
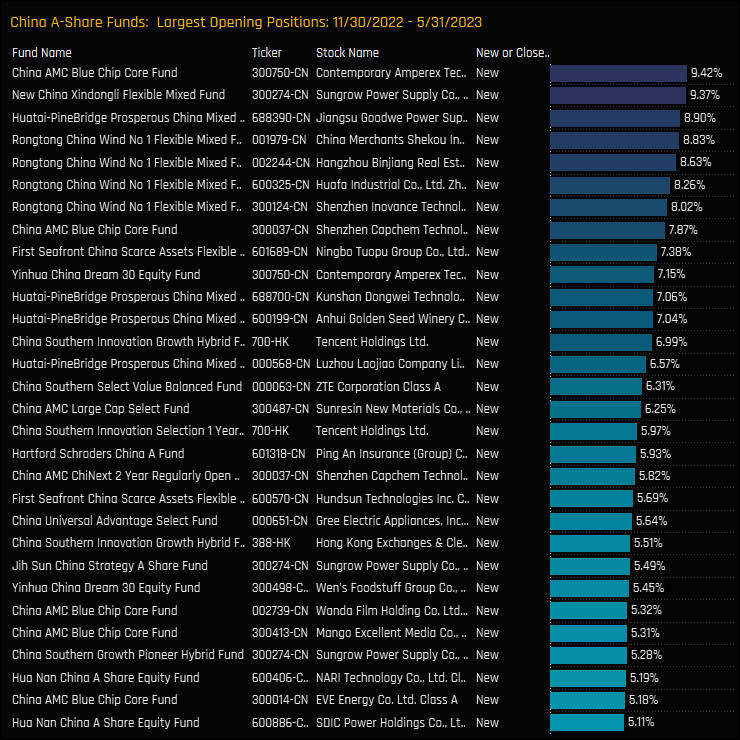
The below charts show the Style breakdown and fund level activity driving this rotation. On a Style basis, GARP and Yield funds saw ownership rise the most within their respective universes, though Growth and Aggressive Growth funds increased exposure the most in absolute terms. On a fund level, between 11/30/2022 and 05/31/2023 a further 9 funds opened new positions in BYD, led by China AMC (+4.19%) and China International Alpha (+2.89%).
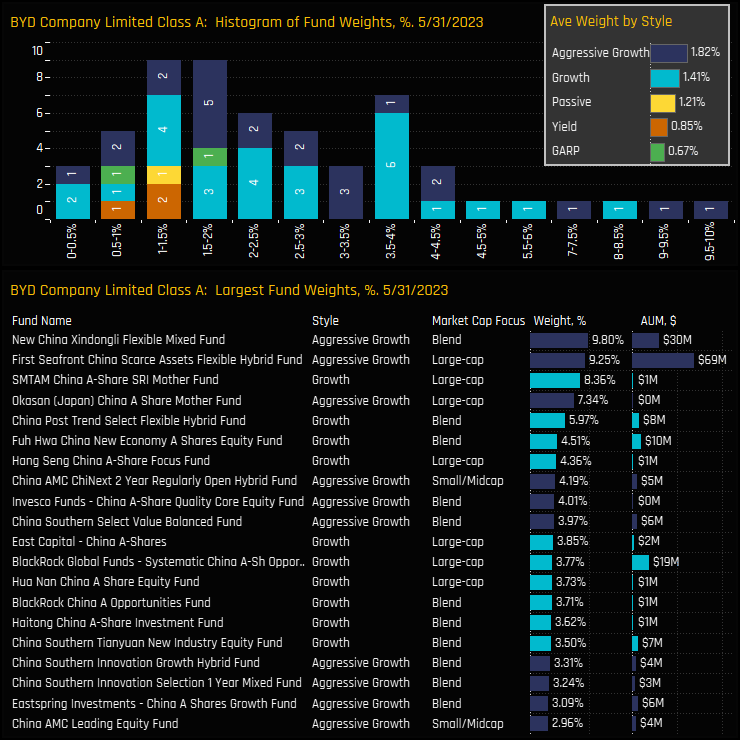
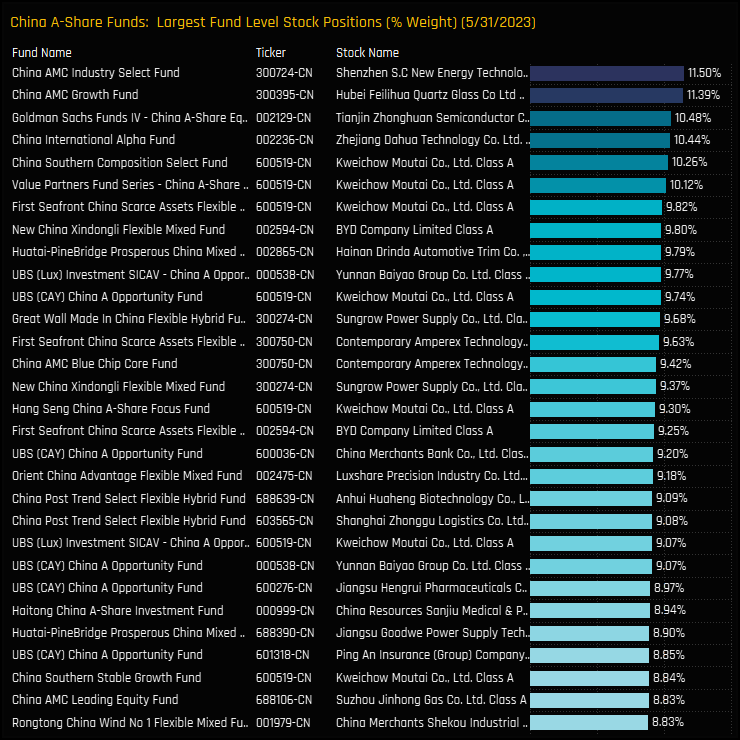
The histogram of fund weights in BYD is shown in the top chart below, and highlights the majority of holders at between the 1% and 4% level. The cluster of 6 funds above 5% is led by New China Xindongi Flexible (9.8%) and First Seafront China Scarce Assets (9.25%) and highlights how BYD has risen to the forefront of selected strategies. Growth and Aggressive Growth funds are the lead allocators, with both positioned ahead of the iShares MSCI China A-Shares benchmark, on average.
Latest Stock Holdings & BYD's Global Appeal
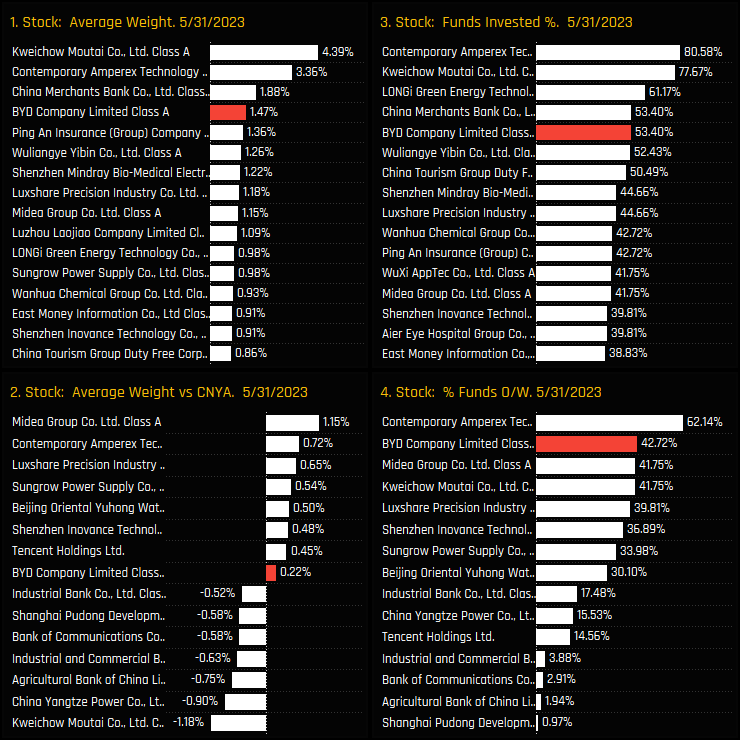
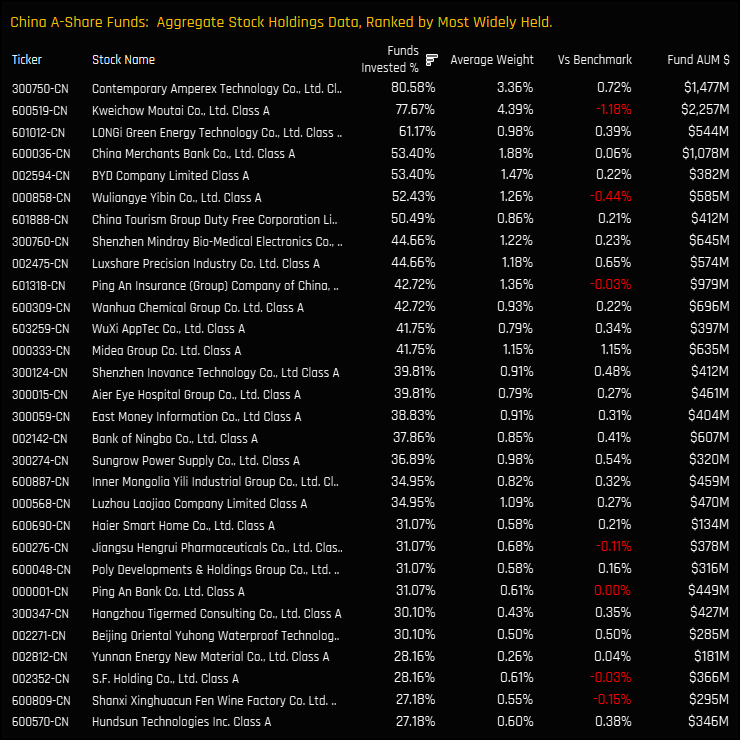
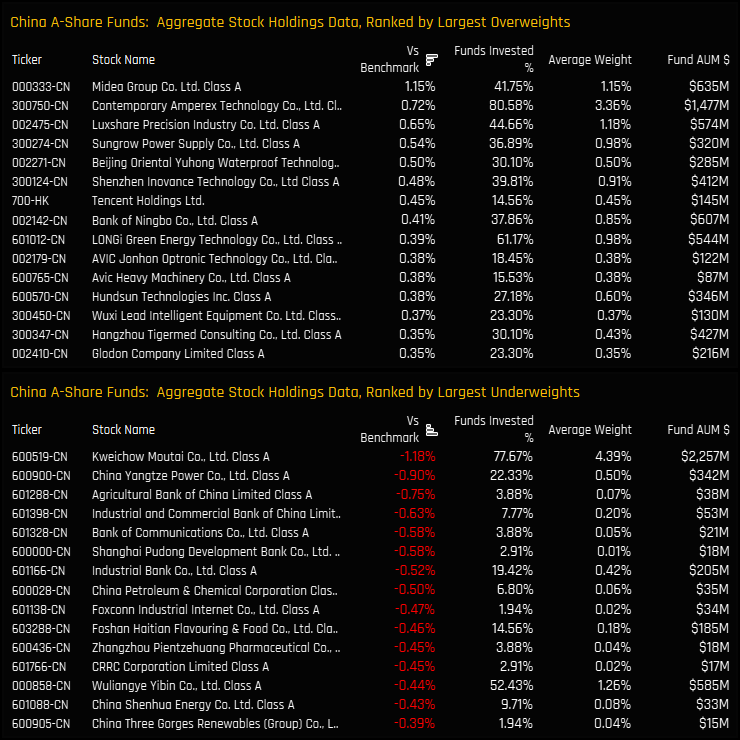
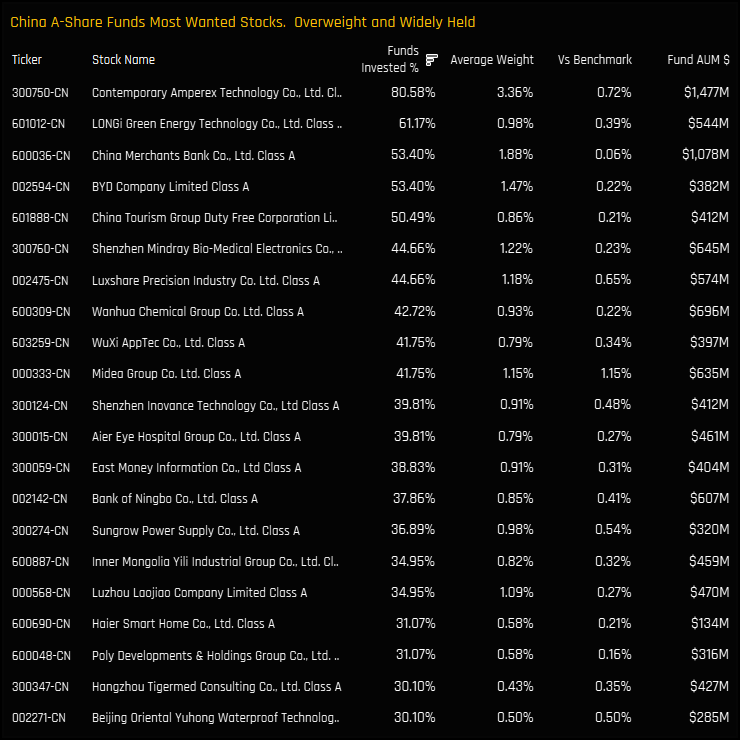
The charts below show the latest ownership statistics for all stocks in the A-Share universe. BYD has risen up the ranks to become the 4th most widely held and 4th largest weight in the A-Share stock universe. Versus the benchmark, only Contemporary Amperex Technology is held overweight by more funds.
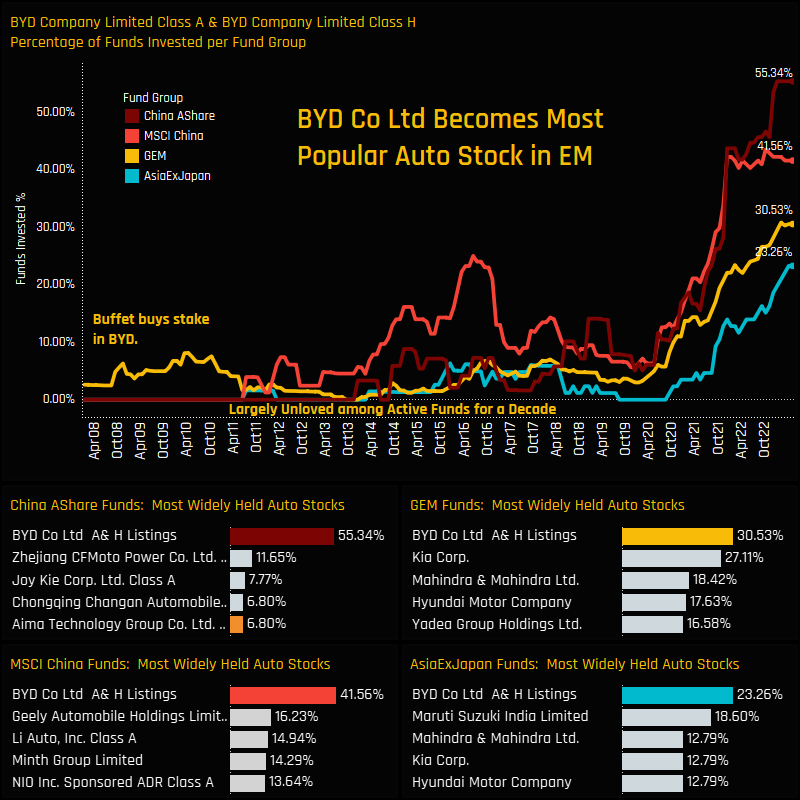
Finally, we understand that those of you who have a subscription to our EM and Asia Ex-Japan research may be experiencing a sense of deja-vu. The fact is, BYD is flashing green across these fund universes too, in addition to our MSCI China and China A-Share fund groups. The charts below show record levels of investment across all 4 universes in BYD, with the stock even overtaking the industry heavyweights of Kia Motors and Maruti Suzuki to become the most widely owned Auto stock in EM right now.
Links
Click on the link opposite for the full data report on BYD Co positioning among active China A-Share Funds.
The latest aggregate and fund level stock holding metrics among active China A-Share investors.
Most Widely Held Stocks
The 30 most widely held stocks among China A-Share active equity funds
Top Over/Underweights
The top 15 aggregate overweight and underweight stock holdings versus the iShares China A-Share ETF (CNYA)
Unloved Stocks
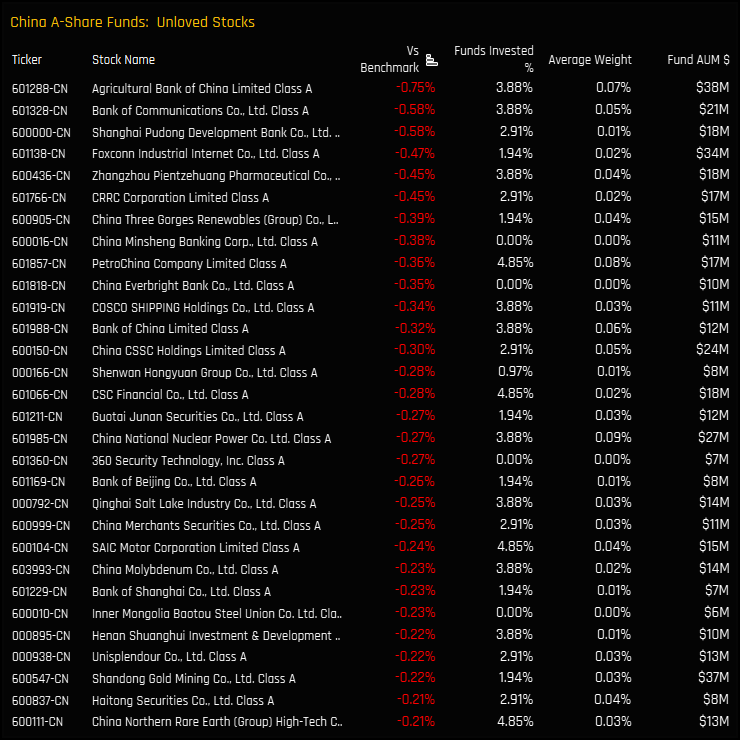
Stocks held by less than 5% of the China A-Share Funds in our analysis, and net underweight vs the iShares MSCI CNYA (cash component removed and stock weights adjusted)
High Conviction Stocks
Stocks held by more than 30% of the China A-Share Funds in our analysis, and net overweight vs the iShares MSCI CNYA ETF
Largest Fund Level Stock Positions, %
The top 30 largest individual fund level stock positions on a portfolio weight basis.
Largest Fund Level Stock Positions, $
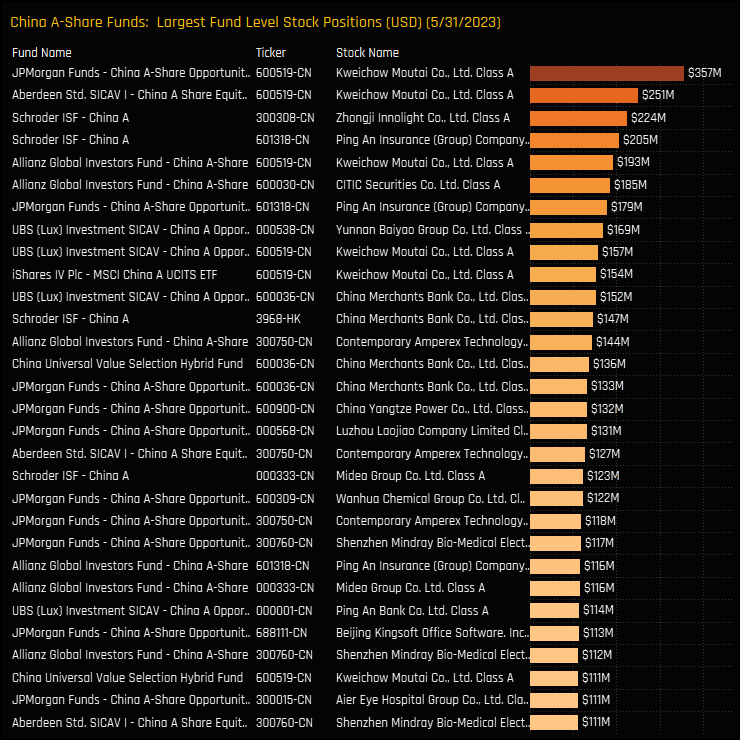
The top 30 largest individual fund level stock positions on a fund AUM basis.
Largest Ownership Increases
The stocks with the largest net increase in the percentage of funds invested between 11/30/2022 and 05/31/2023
Largest Ownership Decreases
The stocks with the largest net decrease in the percentage of funds invested between 11/30/2022 and 05/31/2023
Largest Opening Positions
The largest opening stock positions between 11/30/2022 and 05/31/2023
Largest Closing Positions
The largest closing stock positions between 11/30/2022 and 05/31/2023
Largest Stock Inflows, $
The largest combined fund inflows on a stock level between 11/30/2022 and 05/31/2023
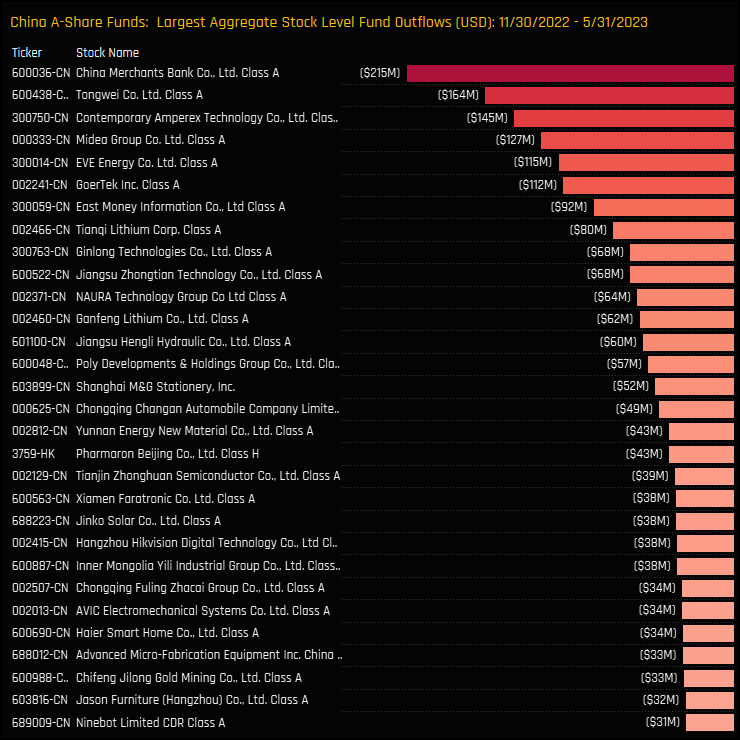
Largest Stock Outflows, $
The largest combined fund outflows on a stock level between 11/30/2022 and 05/31/2023
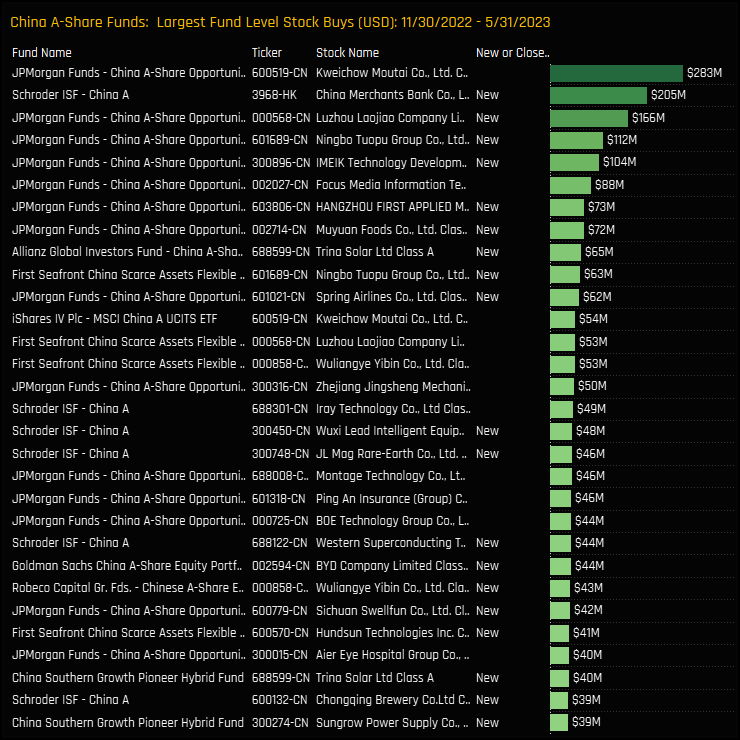
Largest Fund Level Stock Inflows, $
The largest fund level stock inflows between 11/30/2022 and 05/31/2023
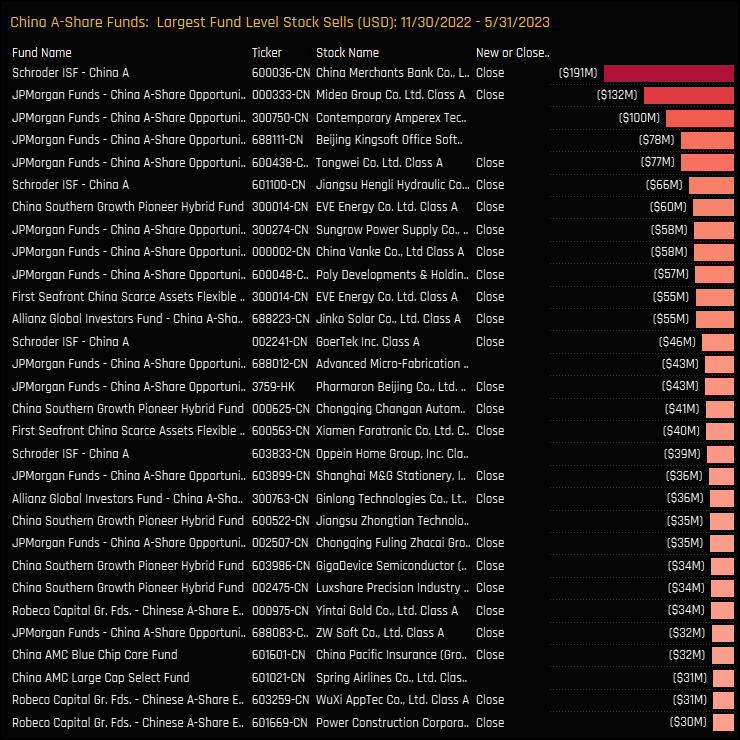
Largest Fund Level Stock Outflows, $
The largest fund level stock outflows between 11/30/2022 and 05/31/2023
257 Active China Funds, AUM $94bn
China Active Funds Ownership Reports
Please click on the links below for the full data reports on MSCI China and China A-Share active fund ownership.
For more analysis, data or information on active investor positioning in your market, please get in touch with me on steven.holden@copleyfundresearch.com