1600 Active Equity Funds, AUM $4.7tr
Fund Positioning Chart Pack
BYD Co Ltd Becomes Most Popular Auto Stock in EM
EM Fund Positioning: Qatar vs Saudi
High Active in China. The Best Way to Beat The Benchmark?
UK Tobacco: Kicking the Habit
Netherlands Positioning: Extending Gains
Asia Ex-Japan's Unloved Stocks
GEM, Asia Ex-Japan, China, China A-Shares
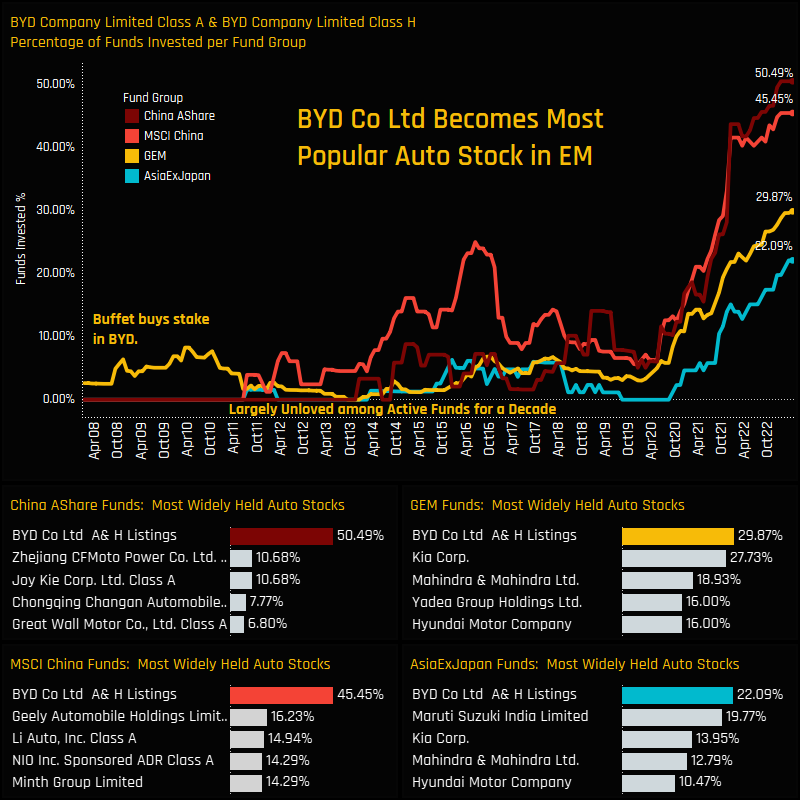
BYD Co Ltd Becomes Most Popular Auto Stock in EM
Investment in BYD Company Limited A&H Shares has reached record highs among active managers focused in EM, Asia Ex-Japan and China. The top chart below shows the percentage of funds in our MSCI China, China A-Share, Asia Ex-Japan and Emerging Markets fund universes who own BYD over time. The active community largely avoided the stock between 2008 and 2020, with less than 5% of EM and Asia Ex-Japan funds invested at any point during that period. Investor sentiment changed tack towards the latter part of 2020, when a growing number of funds across each group started to add BYD to their portfolios. This trend continued through 2022 and 2023, with today’s levels of investment being the highest on record for each fund group.
How do these investment levels compare to peers in the Auto sector? The bottom set of 4 charts show the percentage of funds in each fund group invested in BYD compared to key rivals in the Auto sector. BYD has risen up the ranks to become the most widely held Auto stock across all 4 fund groups.
For China and China A-Share funds, BYD is the most widely held auto company by a margin, with a second tier of companies such as Geely Automobile and Zhejiang CFMoto Power Co held by a much smaller percentage of managers.
But even with the broader set of investible alternatives across EM and Asia Ex-Japan, BYD has risen to the top, surpassing established rivals such as Kia Corp, Maruti Suzuki, Mahindra & Mahindra and Hyundai Corp over the last 2-years.
375 emerging market Funds, AUM $400bn
EM Fund Positioning: Qatar vs Saudi
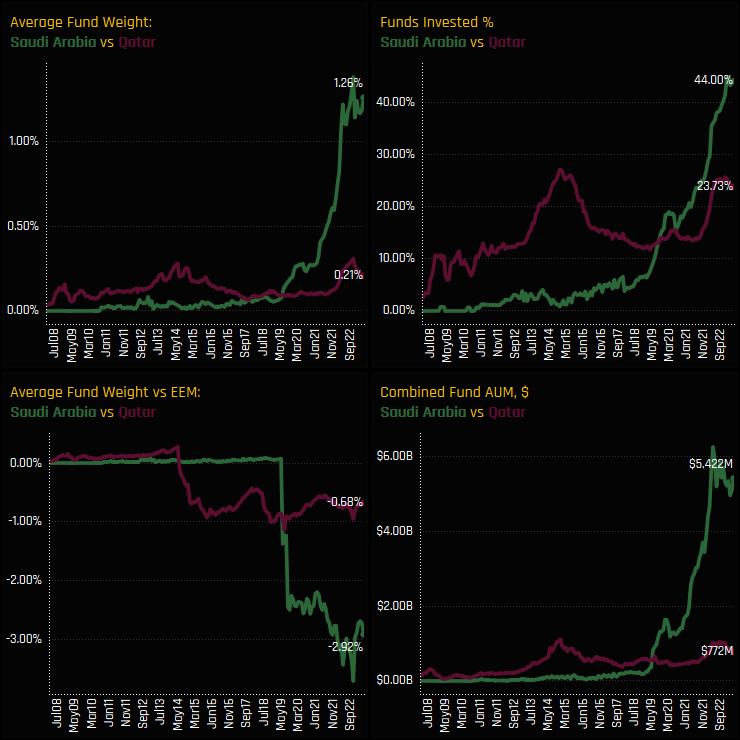
The charts to the right show EM fund ownership over time for both Qatar and Saudi Arabia. From once being the dominant exposure, Qatar has been heavily eclipsed by Saudi Arabia since it was admitted to the MSCI EM index back in 2019. In contrast to Qatar, Saudi ownership continued to grow aggressively after its MSCI EM entry, whereas Qatar ownership dropped off in the months following admission in 2014. Saudi Arabia is now a country position for 44% of the funds in our analysis at an average weight of 1.26%, whereas Qatar is owned by 23.7% of managers at a weight of 0.21%. Both countries are key underweights for active EM managers, but Saudi is the larger underweight by some distance.
From our analysis and from discussions with managers, there is a sense that Saudi is on the path to full ownership, and that it will become harder to avoid exposure as index weights remain above 4% and an increasing number of active peers buy in. The fact that ownership growth in Qatar has stalled suggests that active managers are more comfortable in avoiding Qatar exposure, for now. Ownership levels failed to surpass the previous highs of 2014, with some managers now scaling back the new exposures they put on between 2021 and 2022. One wonders whether these were short-term positions in the context of rising oil prices and a rotation out of Tech. However, given Qatar’s rising prominence on the Global stage and the growing appetite for investment in the MENA region, we would be surprised if investment levels remained this low for long. Now could represent an opportunity for active managers to get ahead of peers and close the gap to benchmark.
The MENA region is growing in prominence in our EM analysis and has been the focus of many recent reports. In our latest piece on Qatar, we analysed the current ownership picture in detail, providing data on the EM funds invested in the region and a breakdown of aggregate and fund level stock positioning. It’s a must read for any manager running a country underweight in Qatar right now.
154 Active MSCI China Funds, AUM $58bn
High Active in China. The Best Way to Beat The Benchmark?
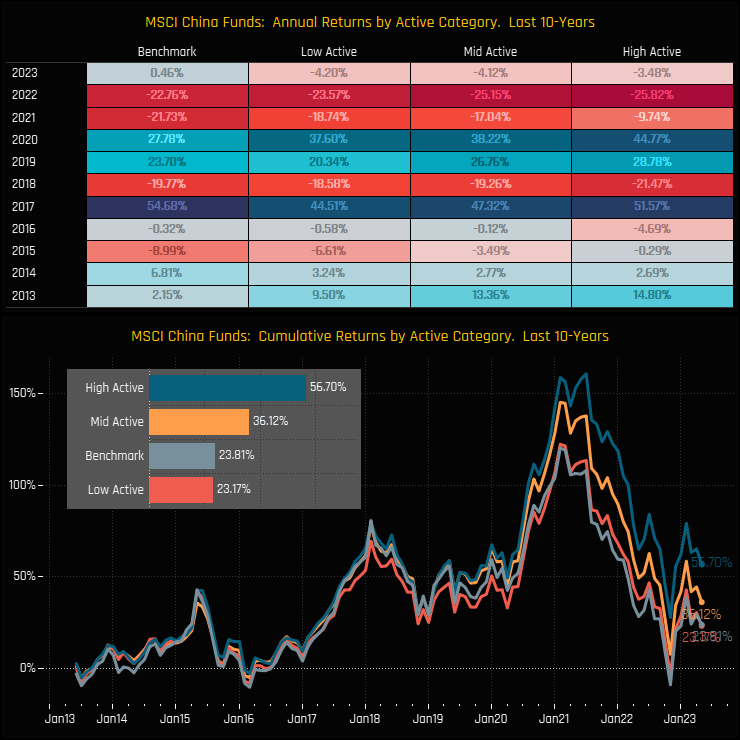
We split the 154 active China funds in our analysis based on their independence from the benchmark MSCI China index. We categorise funds in to High Active (active shares >75%), Mid Active (active shares between 60% and 75%) and Low Active (active shares <60%). We then measure the average performance of each group over the last decade, in addition to that of the iShares MSCI China ETF. The results are shown in the chart opposite.
Our data suggests that a high active approach has been the most rewarding over the period, with average returns of 56.7% for High Active funds, compared to 36.1% of Mid Active and 23.2% for Low Active. Indeed, low active funds are the only group to have underperformed the benchmark over the period, reflective of their need to stay close to benchmark whilst charging higher fees. For High Active, there have been an equal number of outperforming and underperforming years, but the outperforming years are far greater in magnitude, with 2020 and 2021 particularly profitable.
As well as a full data suite on active positioning in the China market, we also provide data on active performance, split by active share, style, market cap focus and more. We also provide data on an individual fund’s performance compared to their most appropriate peer group. Please get in touch to find out more.
267 UK EQUITY FUNDS, AUM $184BN
UK Tobacco: Kicking the Habit
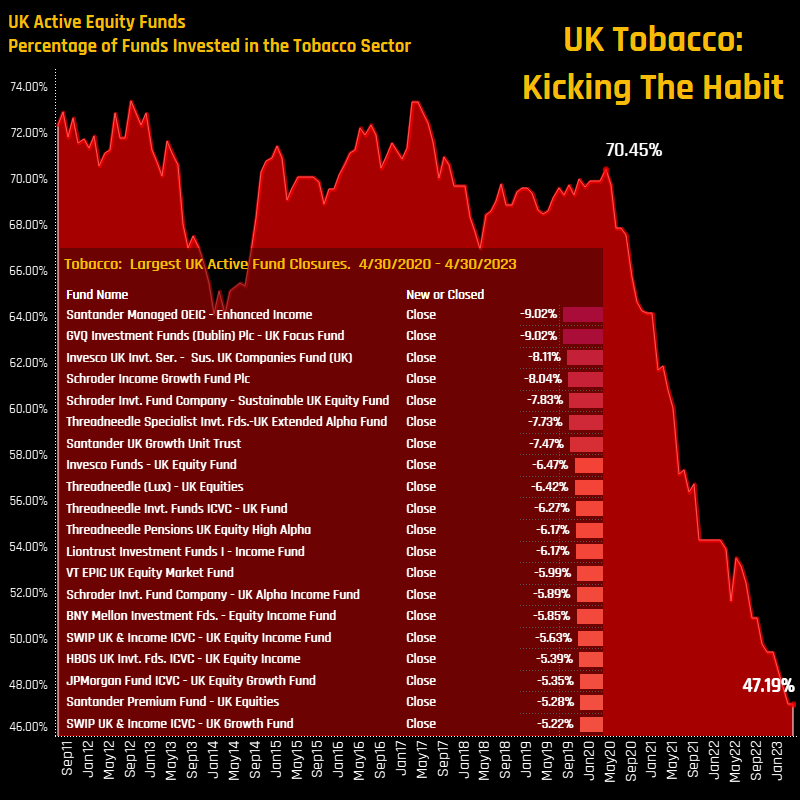
UK Fund ownership in the Tobacco industry group has fallen to its lowest level on record. The red shaded area in the chart to the right shows the percentage of the 267 active UK funds in our analysis with exposure to Tobacco stocks over time. Perhaps surprisingly, the decline only started to take effect in early 2020 when 70.45% of the UK funds in our analysis still held exposure. Since then, and perhaps as a result of a growing ESG awareness among investors, the trajectory of ownership has been on an aggressively downward path, with today’s 47.2% fund ownership the lowest on record.
The managers responsible for the decline are depicted in the inset chart. Among the significant closures, Santander Enhanced Income (-9.02%), GVQ UK Focus (-9.02%), and Invesco Sustainable UK Companies (-8.11%) led the way. They were part of a group of 59 funds that eliminated their exposure to Tobacco between the reporting period of 04/30/2020 and 04/30/2023.
From once being the 3rd largest Industry allocation in early 2011, Tobacco has fallen to the 12th, with less than half of the UK funds in our analysis holding a position. For those that have closed out positions in the Tobacco sector, take comfort in the fact that this stance is now in the majority. For those who still hold a large stake, this is becoming an increasingly non-consensus view.
352 GLOBAL EQUITY FUNDS, AUM $922BN
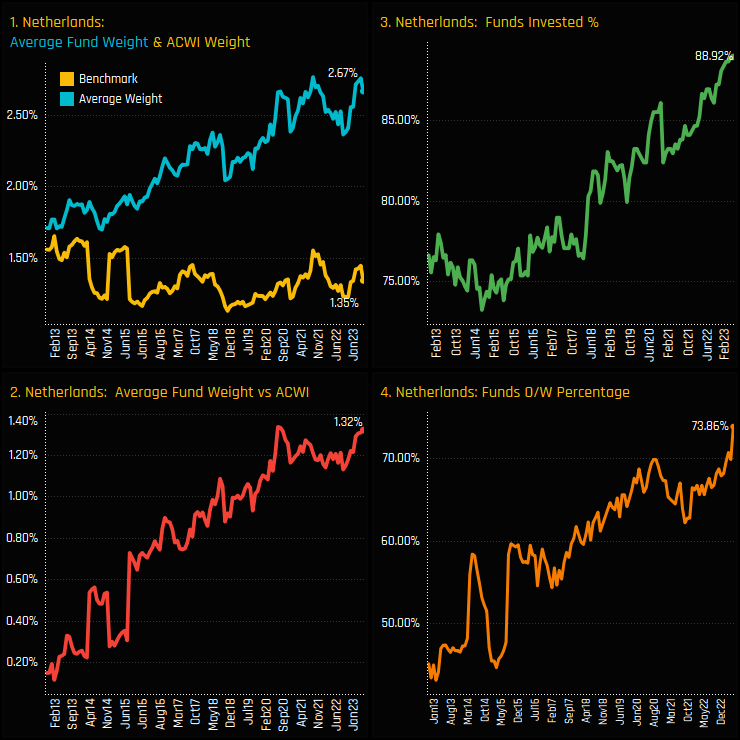
Netherlands Positioning: Extending Gains
The rise of The Netherlands in active Global portfolios continues unabated. The percentage of Global funds who hold The Netherlands as a country exposure has risen to 88.9%, the highest on record (ch3). Active weights and benchmark weights have diverged over the last decade (ch1), with the SPDRs MSCI ACWI ETF stuck in a 1.1%-1.6% range whilst active weights have surged to 2.67%. As such, active Global funds are running an overweight of +1.32% (ch2), with a record 73.9% of funds positioned more bullishly than the benchmark.
The net effect of these moves is to thrust The Netherlands up the pecking order of country allocations among active Global Equity funds. The Netherlands is now the 4th most widely held country allocation and the 3rd largest overweight versus the SPDRs MSCI ACWI ETF. Indeed, no other country has as many funds positioned overweight as The Netherlands does right now!
In the full report we look at the sectors, stocks and funds driving this rotation, together with a full breakdown of the latest positioning among managers.
86 ACTIVE ASIA EX-JAPAN FUNDS, AUM $55BN
Asia Ex-Japan's Unloved Stocks
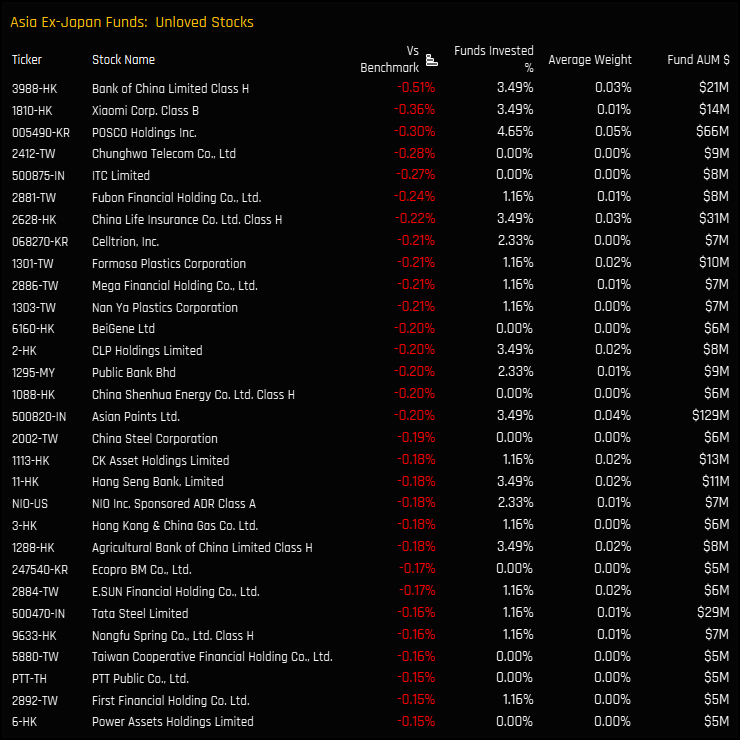
Every quarter we update 14 essential charts on aggregate and fund level stock positioning among the 86 active Asia Ex-Japan funds in our analysis.
The chart to the right screens for stocks that are held by less than 5% of the Asia Ex-Japan funds in our analysis and at average holding weights below the iShares MSCI AC Asia Ex-Japan ETF (AAJX). The list is headed by Bank of China Limited Class H, a company owned by just 3.49% of the funds in our analysis at an average weight of 0.03%, or underweight the benchmark by 0.51%.
Active managers tend to focus on how they are positioned versus their benchmark. We would argue that understanding where a manager is positioned versus the active competition is equally important.
To request access to the full reports mentioned above or inquire about a subscription to our research, please e-mail me directly on the below:
Related Posts

- Steve Holden
- May 17, 2023
Copley Fund Research Fund Positioning Chart Pack
1600 Active Equity Funds, AUM $4.7tr Fund Positioning Chart Pack Global Funds: USA: Record Unde ..

- Steve Holden
- March 6, 2024
UK Real Estate Hots Up
270 UK Equity Funds, AUM $190bn UK Real Estate Hots Up • Record number of UK funds now expose ..

- Steve Holden
- July 11, 2023
Copley Fund Research Fund Positioning Chart Pack III
1600 Active Equity Funds, AUM $4.7tr Fund Positioning Chart Pack Samsung Electronics: Return of ..

