In this issue:
H1 Performance & Attribution
H1 Top Down Positioning Update
Americas: Consensus Overweight
Voltronic Power Technology: Rising Up The Ranks
376 emerging market Funds, AUM $408bn
H1 Performance & Attribution
The latest stats on performance and the drivers of performance for H1 2023.
H1 Performance Summary
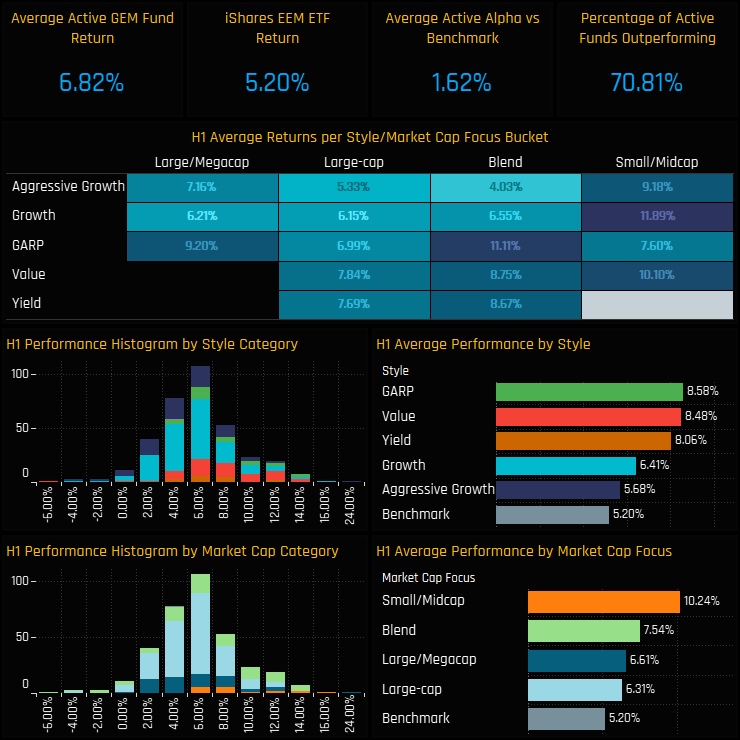
Active EM managers had a blockbuster first half of 2023. Average active fund returns came in at +6.82%, beating the benchmark iShares MSCI Emerging Markets ETF by 1.62% and with 71% of the 376 funds in our analysis outperforming. Fund returns were correlated to Style, with GARP and Value funds the best performers, but even Growth and Aggressive Growth funds returned higher than the benchmark, on average. On a market cap basis, Small/Midcap Funds were the star performers, returning 10.24% over H1 compared to 6.31% for Large-Cap funds.
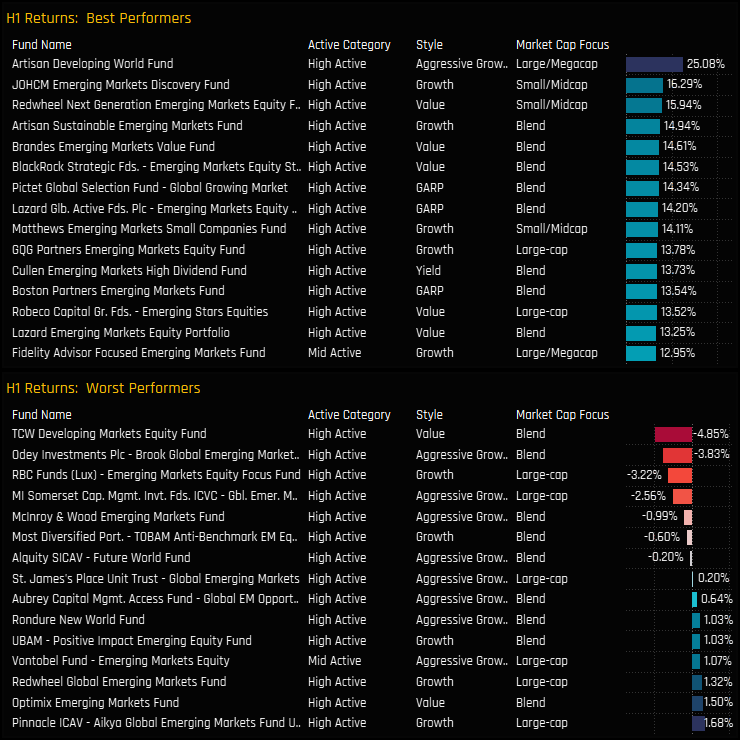
On a single fund level, all but 16 funds returned between 0% and 14%, with the outliers at the top end led by Artisan Developing World (+25.1%) and the Small/Midcap strategies of JOHCM EM Discovery (+16.29%) and Redwheel Next Gen EM Equity (+15.94%). At the bottom end, 7 funds posted negative returns led by TCW Developing Markets Equity (-4.85%) and Odey/Brook Global Emerging Markets (-3.83%).
Portfolio Contribution
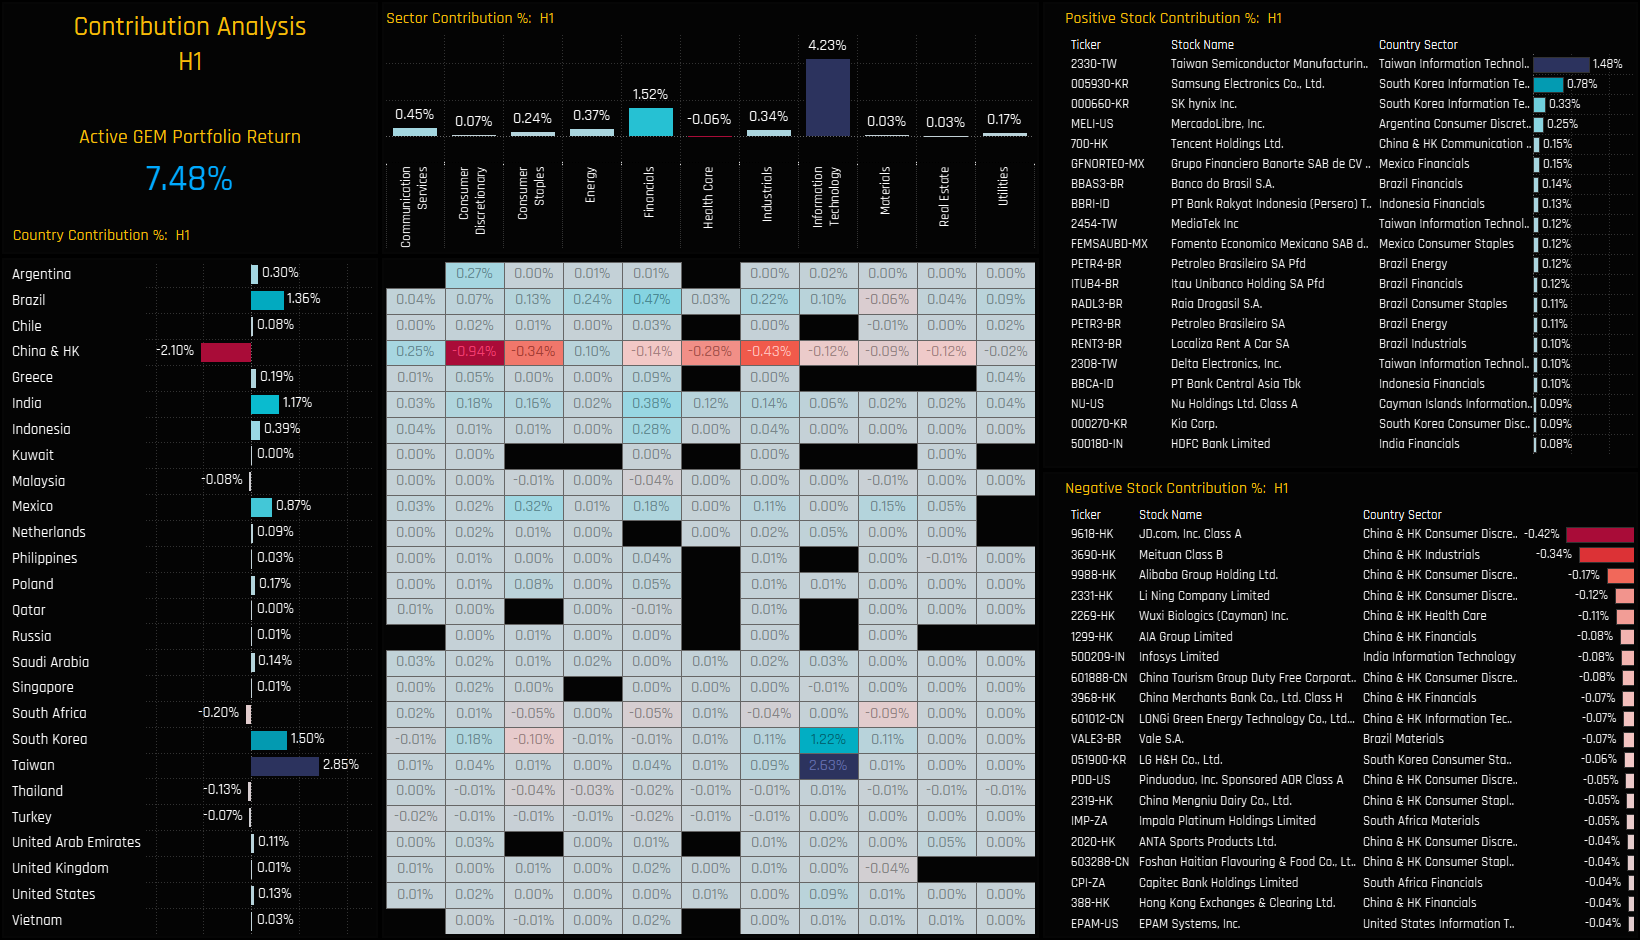
What were the drivers of these returns over the year across countries, sectors and stocks? The chart set below breaks down the performance of a portfolio based on the average holdings of the 376 active GEM funds in our analysis. This theoretical portfolio returned 7.48% in H1 2023, with Technology (+4.23%) and Financials (+1.52%) the key drivers and Health Care (-0.06%) the only sector to post negative returns on the year. On a Country level, China & HK lost the portfolio -2.1% in H1, but this was more than offset by strong returns in Taiwan (+2.85%), South Korea (+1.5%), Brazil (+1.36%) and India (+1.17%).
Drilling down a level further, costly country/sectors were China & HK Consumer Discretionary (-0.94%), Industrials (-0.43%) and Consumer Staples (-0.34%). The duo of Taiwan Tech (+2.63%) and South Korean Tech (+1.22%) dominate the winners, alongside smaller contributions from Indian and Brazilian Financials. The key stocks driving performance can be seen in the right hand charts below, led by TSMC (+1.48%), Samsung Electronics (+0.78%) on the positive side, and JD.Com (-0.42%), Meituan (-0.34%) and Alibaba Group Holdings (-0.17%) on the negative.
Portfolio Attribution
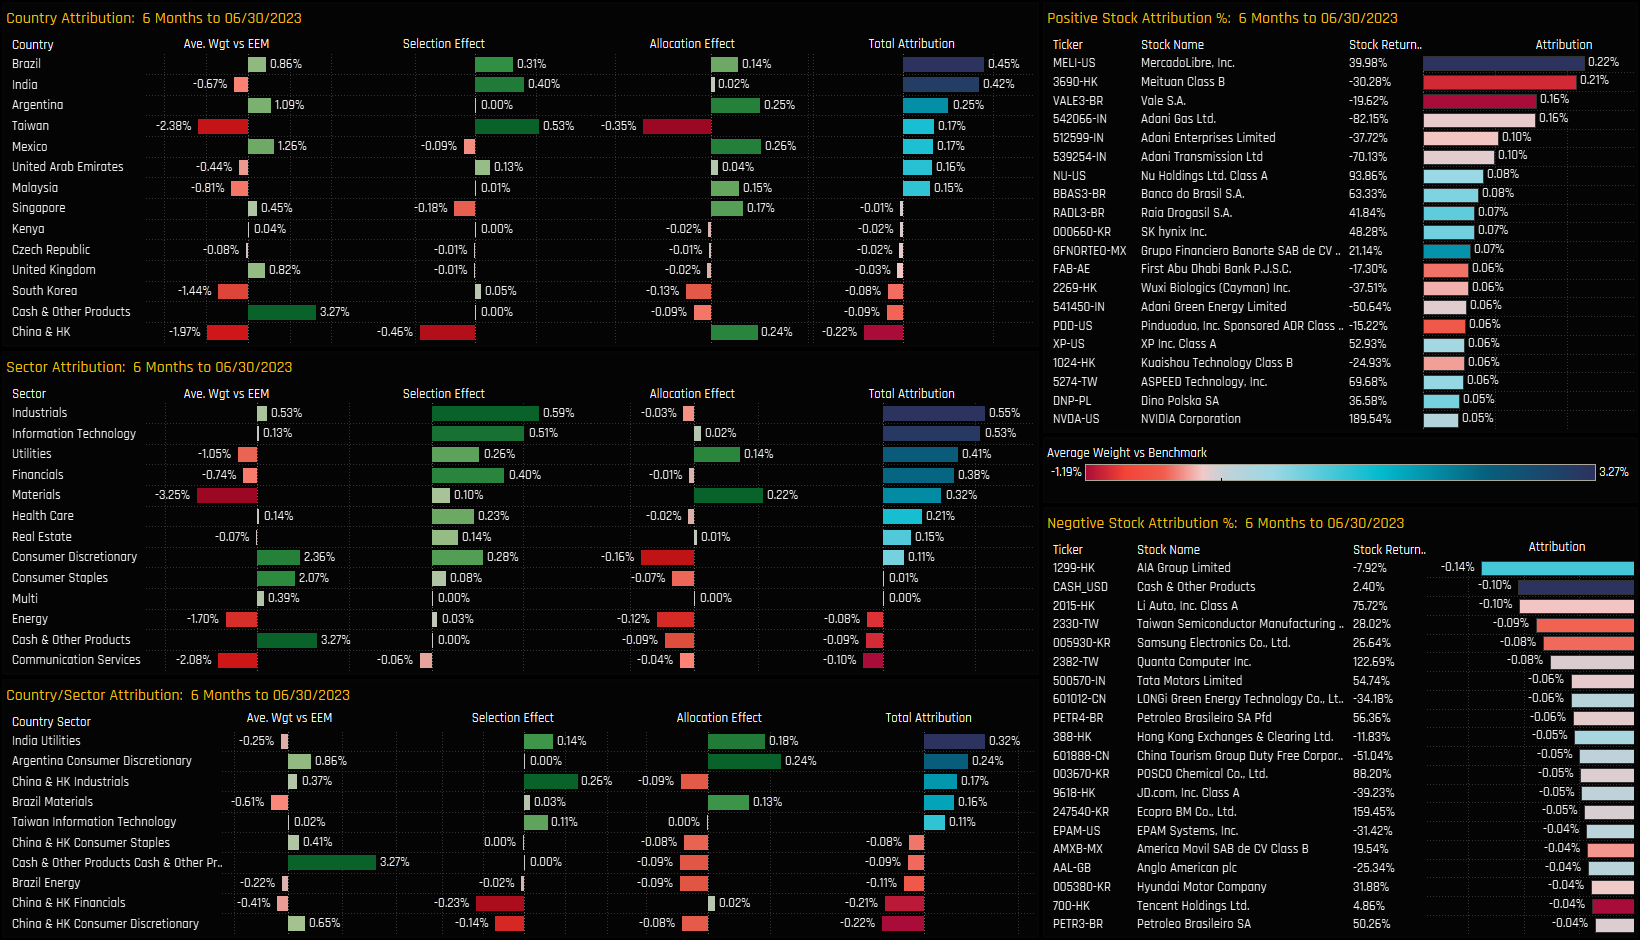
We perform attribution analysis on this portfolio versus a representation of the benchmark based on the iShares MSCI Emerging Markets ETF. The portfolio outperformed by +2.4% in H1 2023, with allocation effects on a country level (+1.76%) much more prominent than on a sector level (-0.16%) – i.e country level over/underweights played a much greater role than sector level over/underweights! A summary of the key drivers are documented below.
What worked:
Underweights in Malaysia, Materials, China & HK, India Utilities.
Overweights in Argentina, Brazil and Mexico.
Stock selection in Tech, Financials, Industrials, India, Taiwan, Brazil
Underweights in Adani Group of Companies, Meituan, Vale.
Overweights in MercadoLibre, Nu Holdings, Banco do Brasil
What didn’t:
Underweights in Communication Services, Taiwan, South Korea
Overweights in China & HK Industrials, Cash, Consumer Discretionary
Stock Selection in China & HK Financials and Consumer Discretionary
Overweights in AIA Group, Cash, LONGi Green Technology.
Underweights in Li Auto, TSMC, Samsung Electronics
376 emerging market Funds, AUM $408bn
H1 Top Down Positioning Update
How are EM funds positioned at the turn of the year across regions, countries, sector and stocks and what have been the key changes on the year so far?
Regions
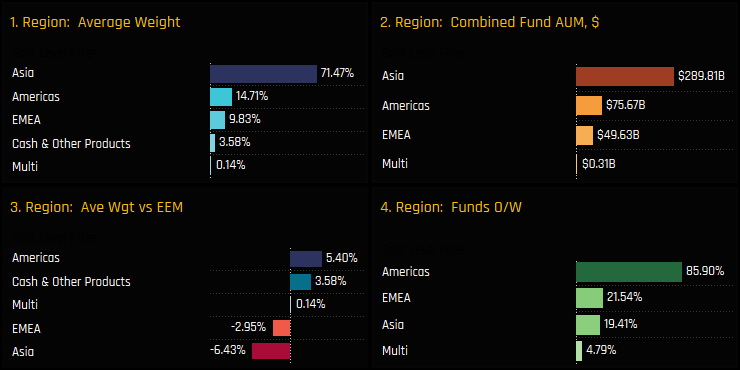
Active EM Funds start the 2nd half of 2023 with an aggressively bullish tilt towards the Americas region. Of the 376 GEM funds in our analysis, 85.9% are overweight the Americas compared to just 19.4% overweight Asia and 21.5% overweight EMEA. On an absolute level, Asia still dominates with an average weight of 74.5%, and accounts for $289.8bn of the $408bn in GEM fund assets that we track.
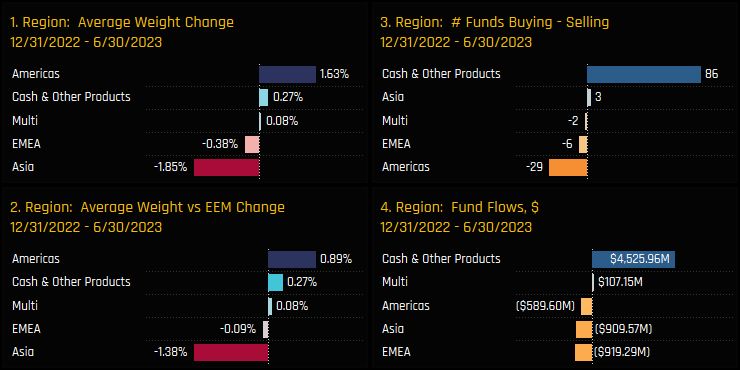
Between the filing dates of 12/31/2022 and 06/30/2023, active EM funds raised weights in The Americas by 1.63% which pushed overweights higher by +0.89%. In an almost mirror image, Asian weights dropped by -1.85% and underweights increased by -1.38%. Over the period we captured net fund inflows of $2.2bn, with cash balances swelling by $4.5bn and net cash positioning increasing by 0.27%. At some point this will need to be deployed.
Countries
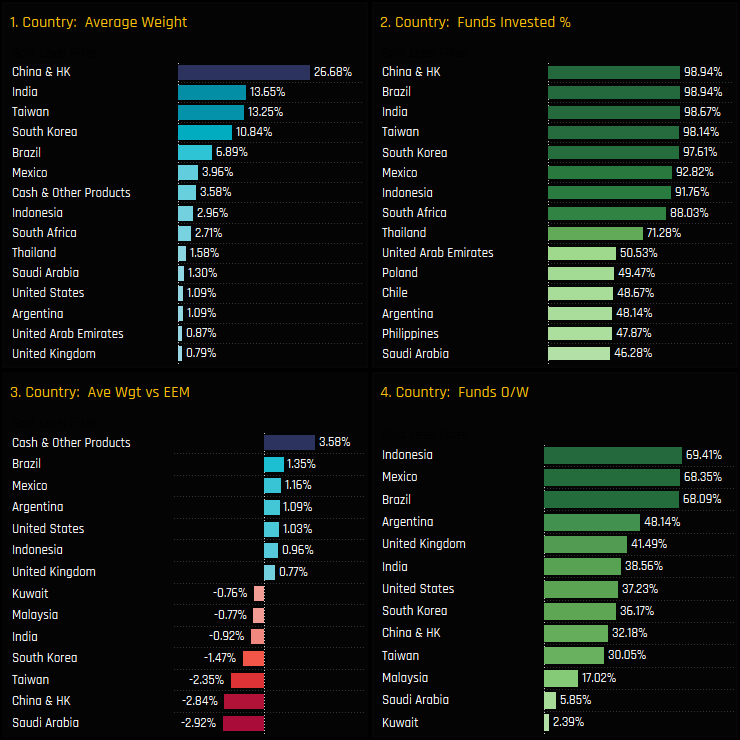
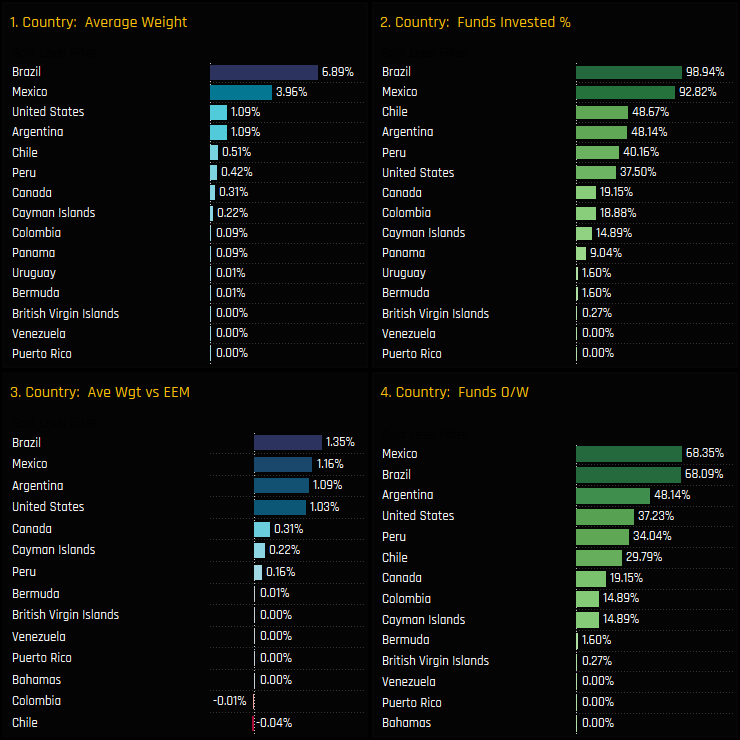
Country positioning is dominated by Asia’s ‘big 4’, which account for a combined 64.4% of the average active GEM Fund. Relative to the iShares MSCI EM ETF benchmark, the big 4 are now all held underweight, with a combined -7.6% shortfall. Overweights outside of Cash holdings are led by Brazil (+1.35%), Mexico (+1.16%) and Argentina (+1.09%), though more managers are overweight Indonesia (69.4%) than any other nation. The MENA region still suffers from a lack of participation, with Saudi Arabia held underweight by -2.92% as less than half of the funds in our analysis hold exposure.
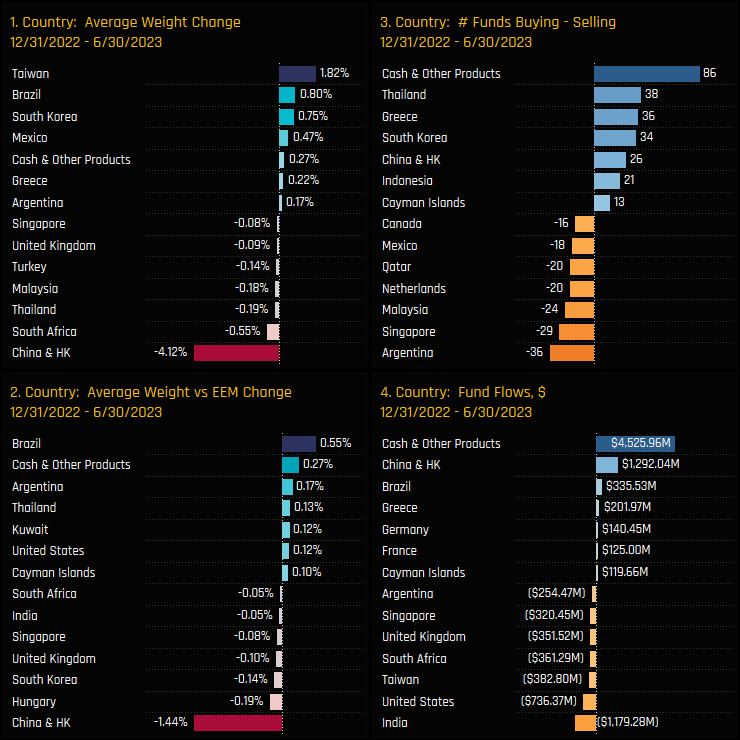
Country level ownership changes over the course of the year highlight a big drop in China & HK exposure (-4.12%) and an increase in Taiwan (+1.8%), Brazil (+0.8%) and South Korea (+0.75%). Despite China’s fall, there were signs that managers were buying in to weakness, with an excess of buyers over sellers and net fund inflows of $1.29bn over the period. Relative to benchmark, overweights increased in Brazil and Argentina and underweights increased in China & HK.
Sectors
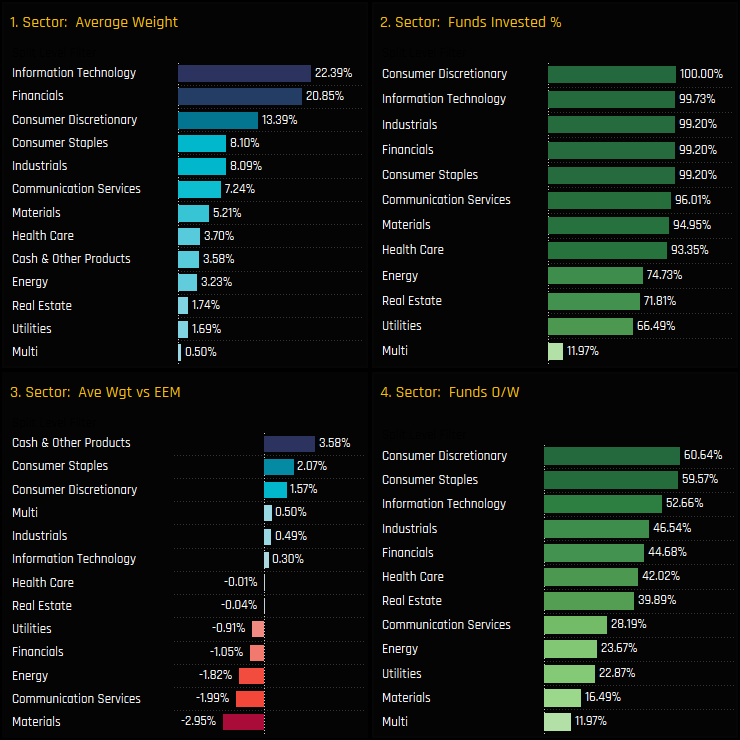
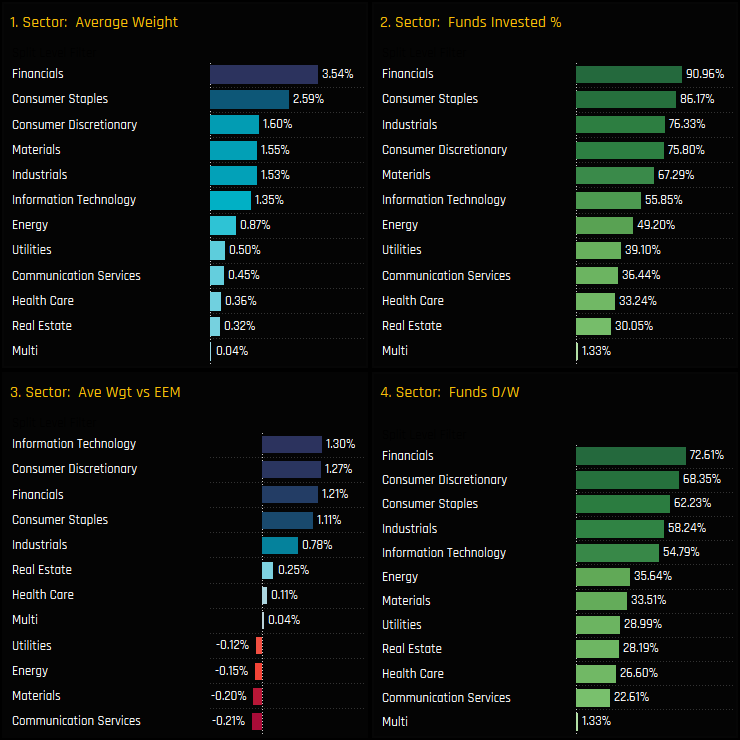
On a sector level, Technology and Financials have been trading places as the top sector positions for the last 12 months, but Tech leads the way as we commence H2 after making strong gains through April to June. Relative to benchmark, active EM funds maintain their preference for the Consumer sectors, with the majority of funds in our analysis positioned overweight the benchmark in each. Underweights are led by Materials, Communication Services and Energy.
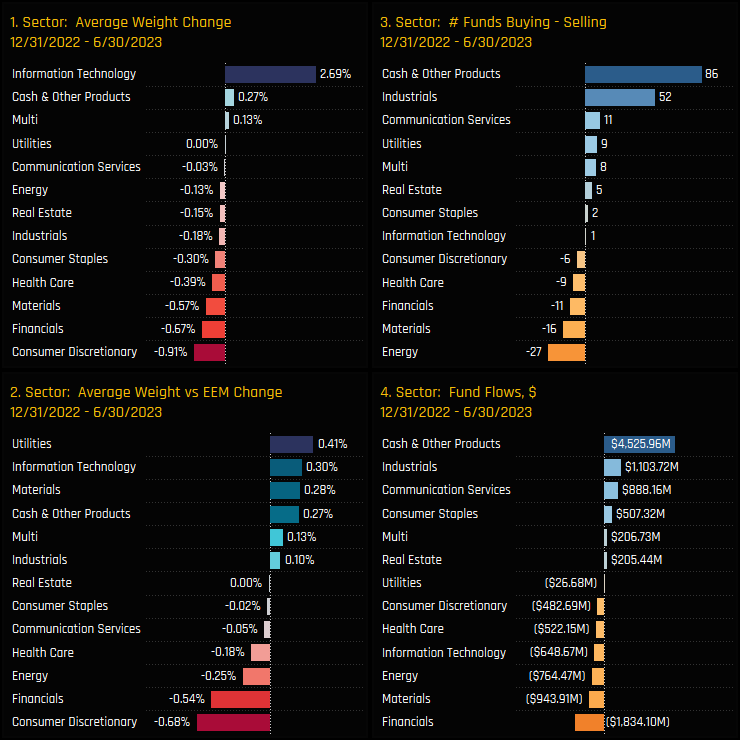
Sector ownership changes between 12/31/2022 and 06/30/2023 favoured the Tech sector, with average weights increasing by +2.69% and overweights by 0.30%. Financials saw ownership fall across all measures, with net outflows of -$1.8bn, average weights falling by -0.67% and an excess of sellers over buyers. Industrials are showing signs of positive rotation with a big excess of buyers over sellers and positive cash inflows.
Country Sectors
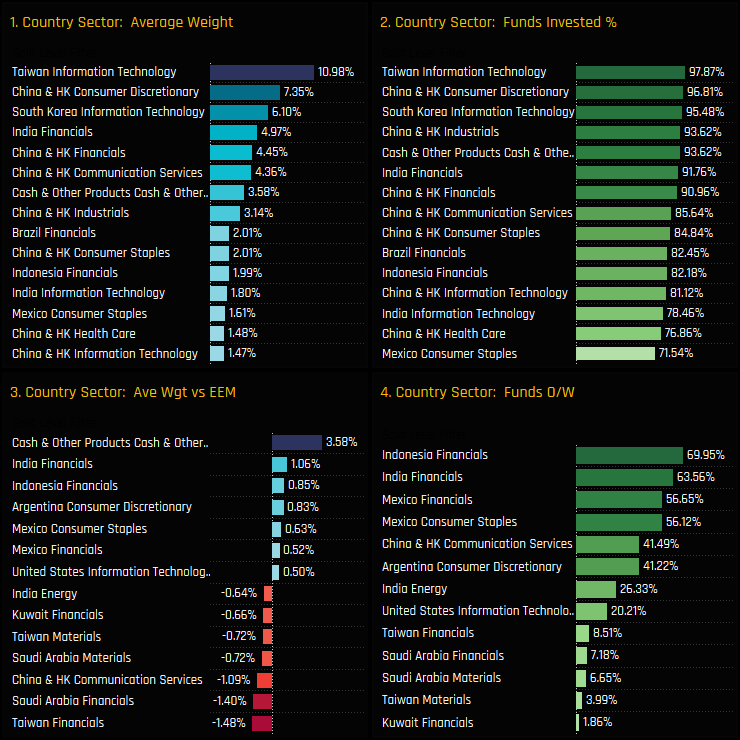
Country/sector positioning is dominated by sectors in Asia’s big 4, though Brazil Financials, Indonesian Financials and Mexican Consumer Staples find their way in to the top 15 exposures. Indian and Indonesian Financials are the consensus overweight positions, with managers instead running underweights in Taiwan Financials, Saudi Arabia Financials and China & HK Communication Services.
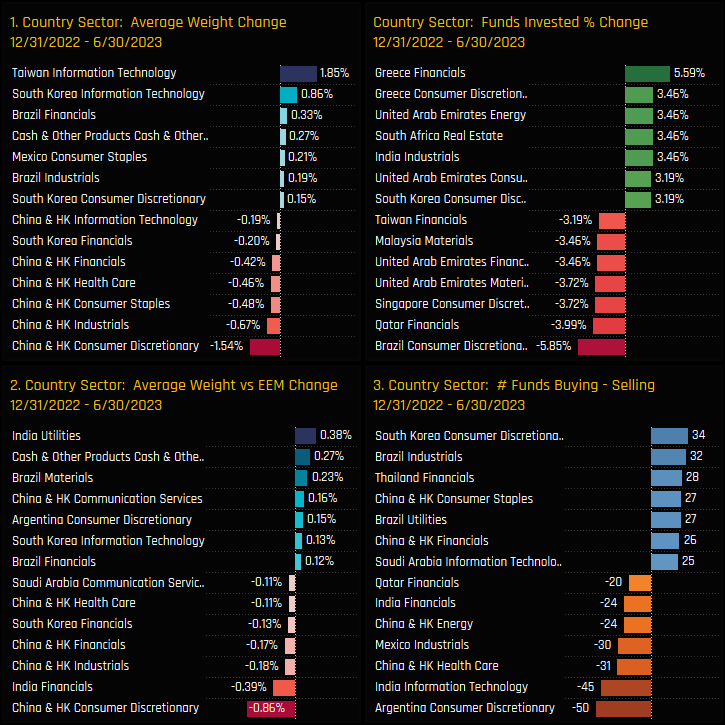
Taiwan and South Korean Technology stocks captured the largest average weight gains over the year, whilst allocations fell in the 5 major China & HK sectors. Greece is back on the radar, with +5.6% of funds adding Greek Financials exposure and +3.5% Greek Consumer Discretionary. Argentina Discretionary and Indian Technology saw and excess of sellers, whilst South Korea Discretionary and Brazil Industrials benefited from an excess of buyers.
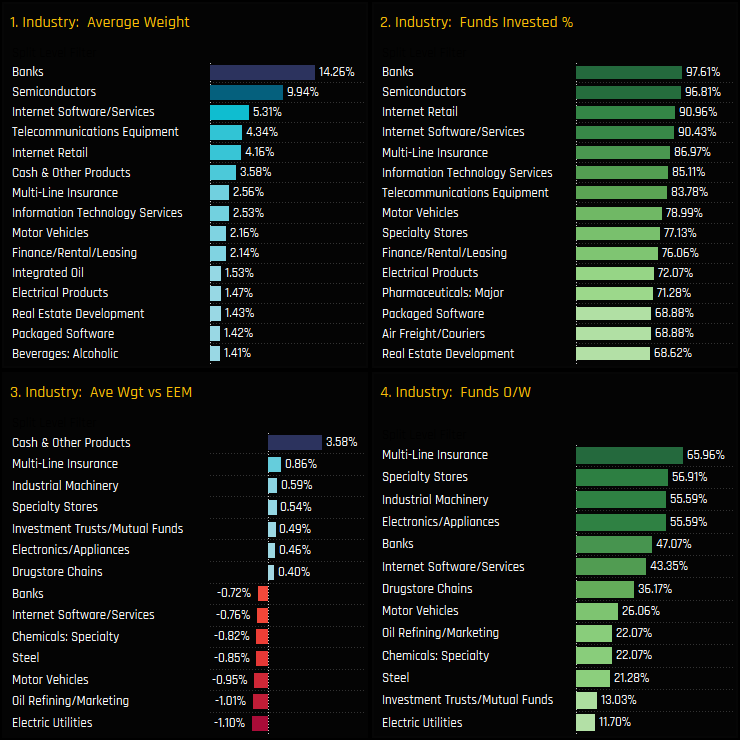
Industries
Industry positioning is led by Banks (14.3%) and Semiconductors (9.9%), with the largest 15 industries accounting for 58.2% of the average active GEM fund. Overweight industries include Multi-Line Insurance, Industrial Machinery and Specialty Stores with all held overweight by the majority of funds. Underweights are led by Electric Utilities, Oil Refining/Marketing and Motor Vehicles.
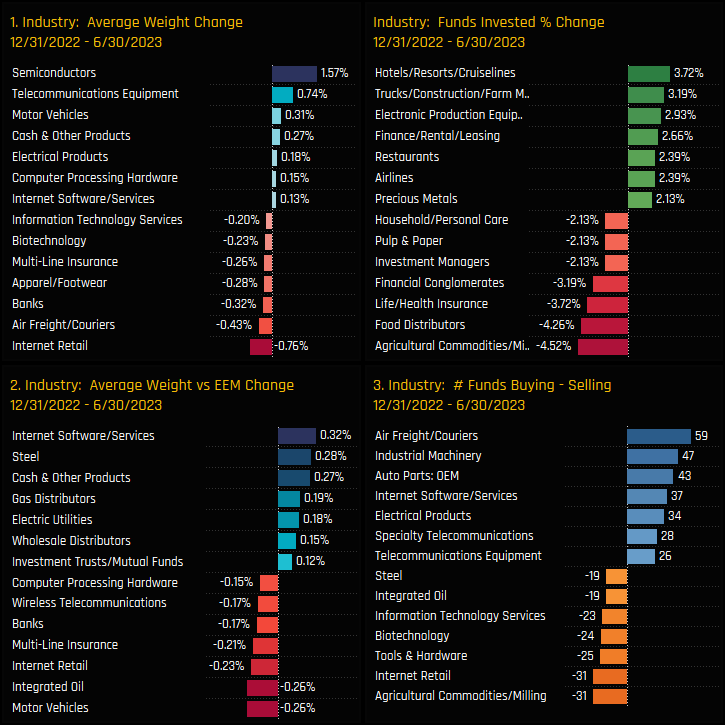
Semiconductors have made significant gains on the year and account for over half of the Technology sector move this year. EM funds have re-engaged with the embattled Hotels/Resorts/Cruiselines and Restaurant industry groups, whilst Internet Retail has seen a degree of outward manager rotation. Agricultural Commodities/Milling saw the percentage of funds invested drop by -4.5% and and excess of 31 sellers over buyers.
Stocks
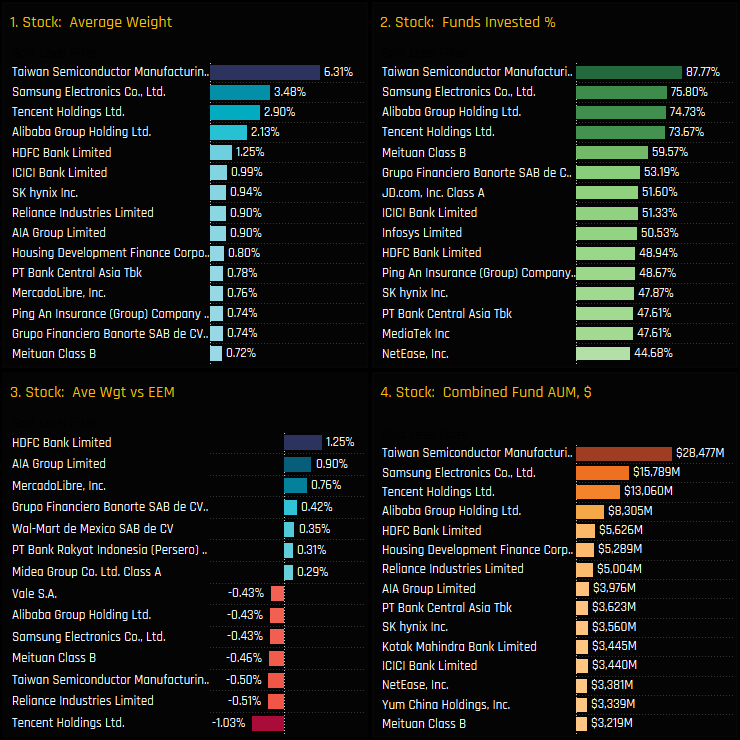
Finally on to stock positioning. TSMC, Samsung Electronics, Tencent Holdings and Alibaba Group Holdings are the consensus positions for the average EM fund. All 4 are owned by at least 70% of the funds in our analysis and form the backbone of most active EM portfolios. The fact that all 4 are held underweight is reflective of large benchmark weights rather than an aversion to the stocks themselves, but nevertheless, active EM funds stand to lose ground to the benchmark if all 4 outperform. Overweights are led by HDFC Bank, AIA Group and MercadoLibre.
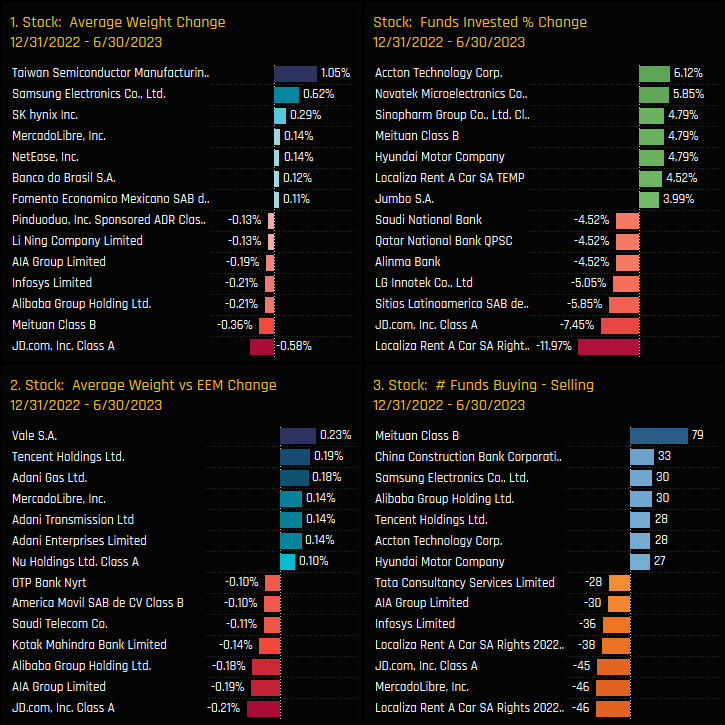
TSMC, Samsung Electronics and SK Hynix saw the largest increases in average weight this year, with the China trio of JD.Com, Meituan and Alibaba Group Holdings seeing weights decrease. In terms of outright ownership, Accton Technology captured new investment from 6.1% of the funds in our analysis, alongside Novatek Microelectronics (+5.9%) and Sinopharm Group (+4.8%). Note the large sell-off in JD.Com, with -7.5% of funds closing positions and average weights falling by -0.58%. JD.Com is still a well held name with 51.6% of funds still holding exposure – quite the overhang.
GEM Active Funds Ownership Report
That concludes our top down positioning review. For a more detailed look at positioning among the GEM funds in our analysis, click on the link opposite for the latest edition of the GEM Active Funds Ownership Report
Active managers break away from the benchmark as record numbers move to overweight.
Time-Series and Fund Level Positioning
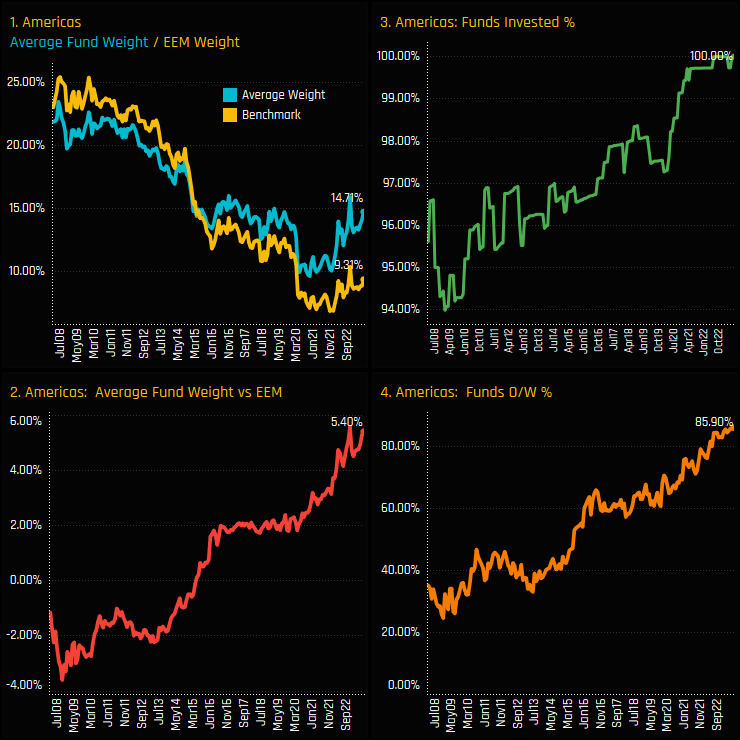
Active Emerging Market funds are going all in on the Americas. The percentage of funds overweight the region hit an all-time high this month of 85.9% (ch4), with an average overweight of +5.4% (ch2). Allocations snapped a decade long decline in late 2021 with holding weights below 10%, but have since rallied from the lows to hit 14.7% today, and breaking away from the iShares MSCI EM ETF Benchmark in the process. To say EM funds are banking on outperformance is an understatement.
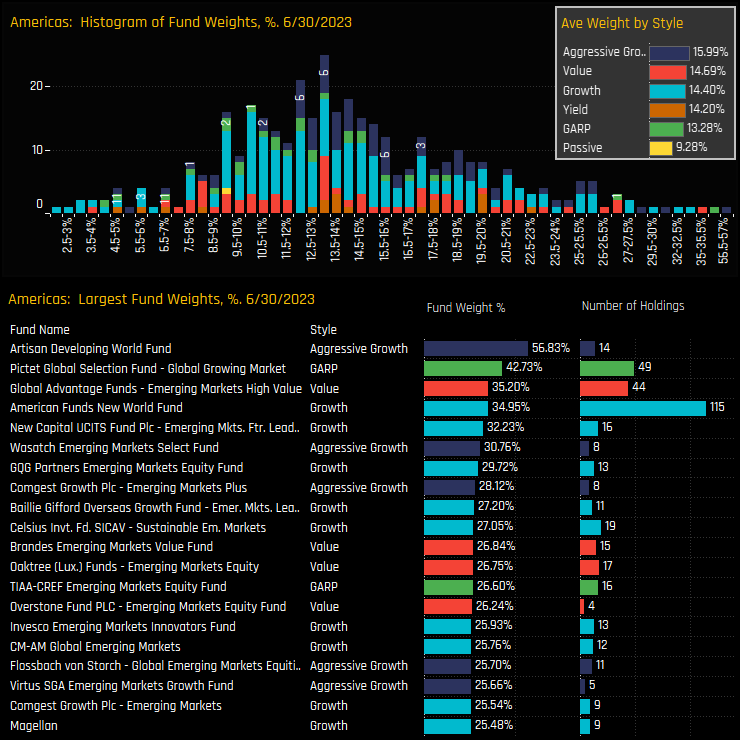
The histogram in the top chart below shows the breakdown of positioning on a fund level, with the bulk of the weight distribution well ahead of the index weight of 9.28%. The inset chart shows the average weight by fund Style, with all groups overweight the benchmark and Aggressive Growth and Value the top allocators. The region’s appeal across the Style groups is reflected in the top 3 holders, with Artisan Developing World (Agg’ Growth), Pictet Global Growing Mkt (GARP) and Global Advantage EM High Value ahead of the pack.
Fund Activity and Style Trends
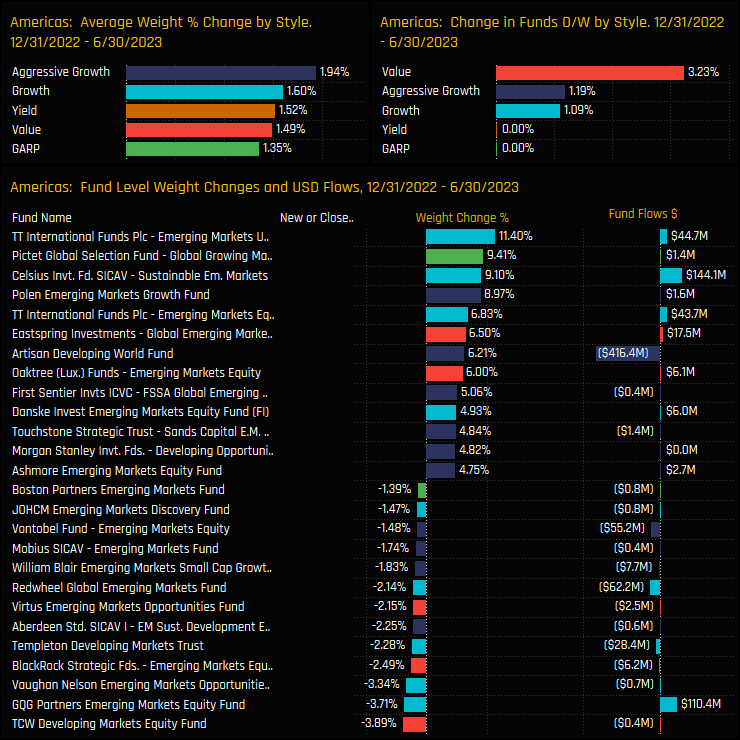
Over the course of the year, all Style groups saw their Americas allocations increase, headed by Aggressive Growth funds (+1.94%) and Growth (+1.6%). A further 3.2% of Value funds switched to overweight over the period in addition to +1.2% of Aggressive Growth funds and +1.1% of Growth. There were some sizeable reallocations, headed by TT International EM Unconstrained (+11.4%) and Pictet Global Growing Markets (+9.4%).
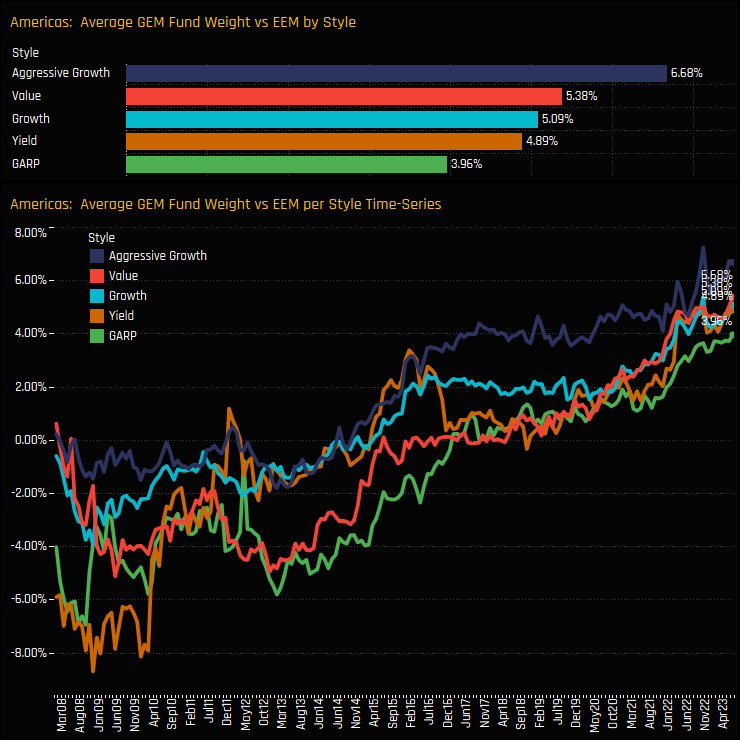
This leaves Aggressive Growth funds with the largest overweight position of +6.68% above the iShares MSCI EM ETF, followed by Value (+5.38%) and Growth (+5.09%), The longer term trends show Aggressive Growth moving earlier than peers, switching to overweight in 2014 compared to Value in 2017. All Style groups are close to, or at their highest ever overweight in the Americas region since our records begin in 2008.
Country & Sector Positioning
Brazil and Mexico are the dominant exposures, with both countries widely held and accounting for 74% of the total Americas allocation. Out-of-benchmark positions in the USA and Argentina, together with smaller exposures to Chile and Peru complete most of the remaining exposure. All countries with the exception of Chile are held overweight on average, with 68% of funds positioned overweight both in Brazil and Mexico.
On a sector level, Financials and Consumer Staples account for 42% of the total Americas allocation, with Discretionary, Materials, Industrial and Technology accounting for another 42%. Compared to the iShares EEM ETF, Financials are held overweight by 72.6% of the 376 EM funds at an average +1.2% above benchmark, with similar conviction in the Industrials, Technology and Consumer sectors.
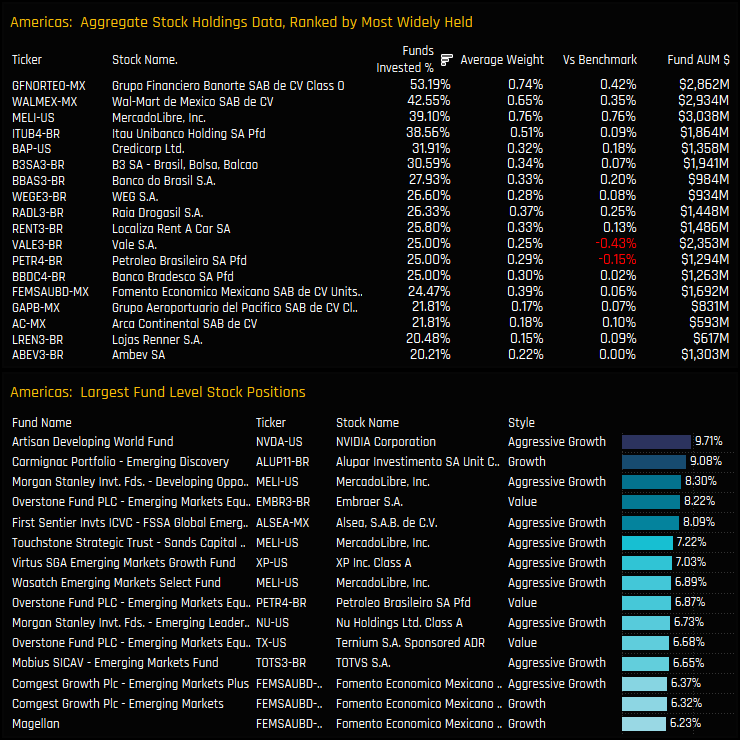
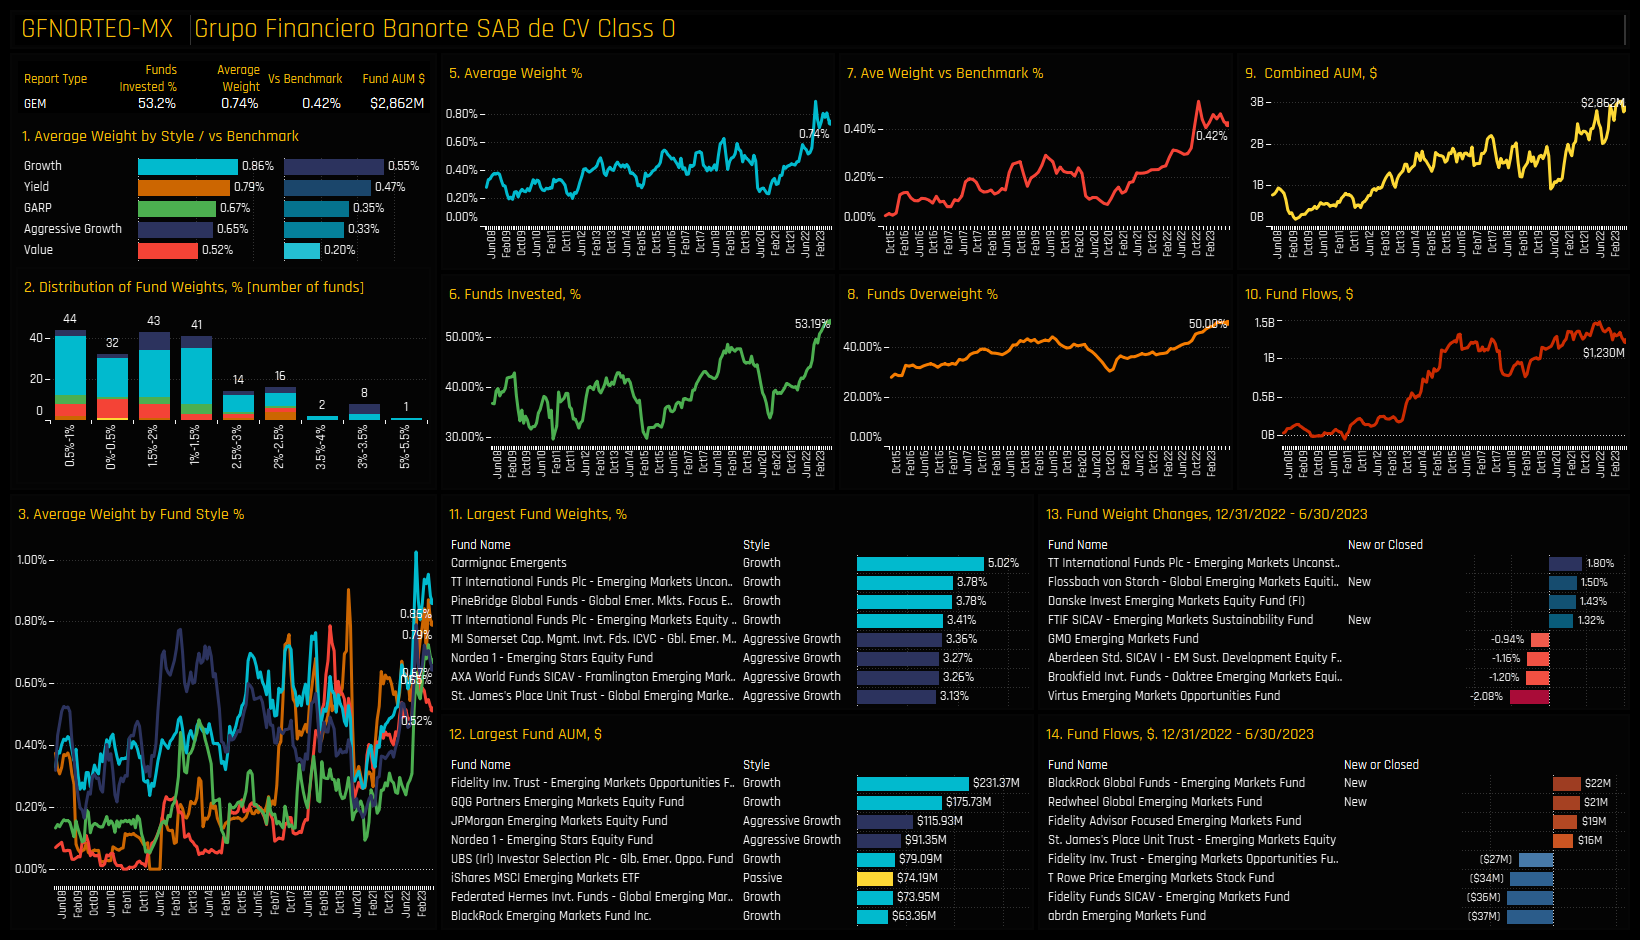
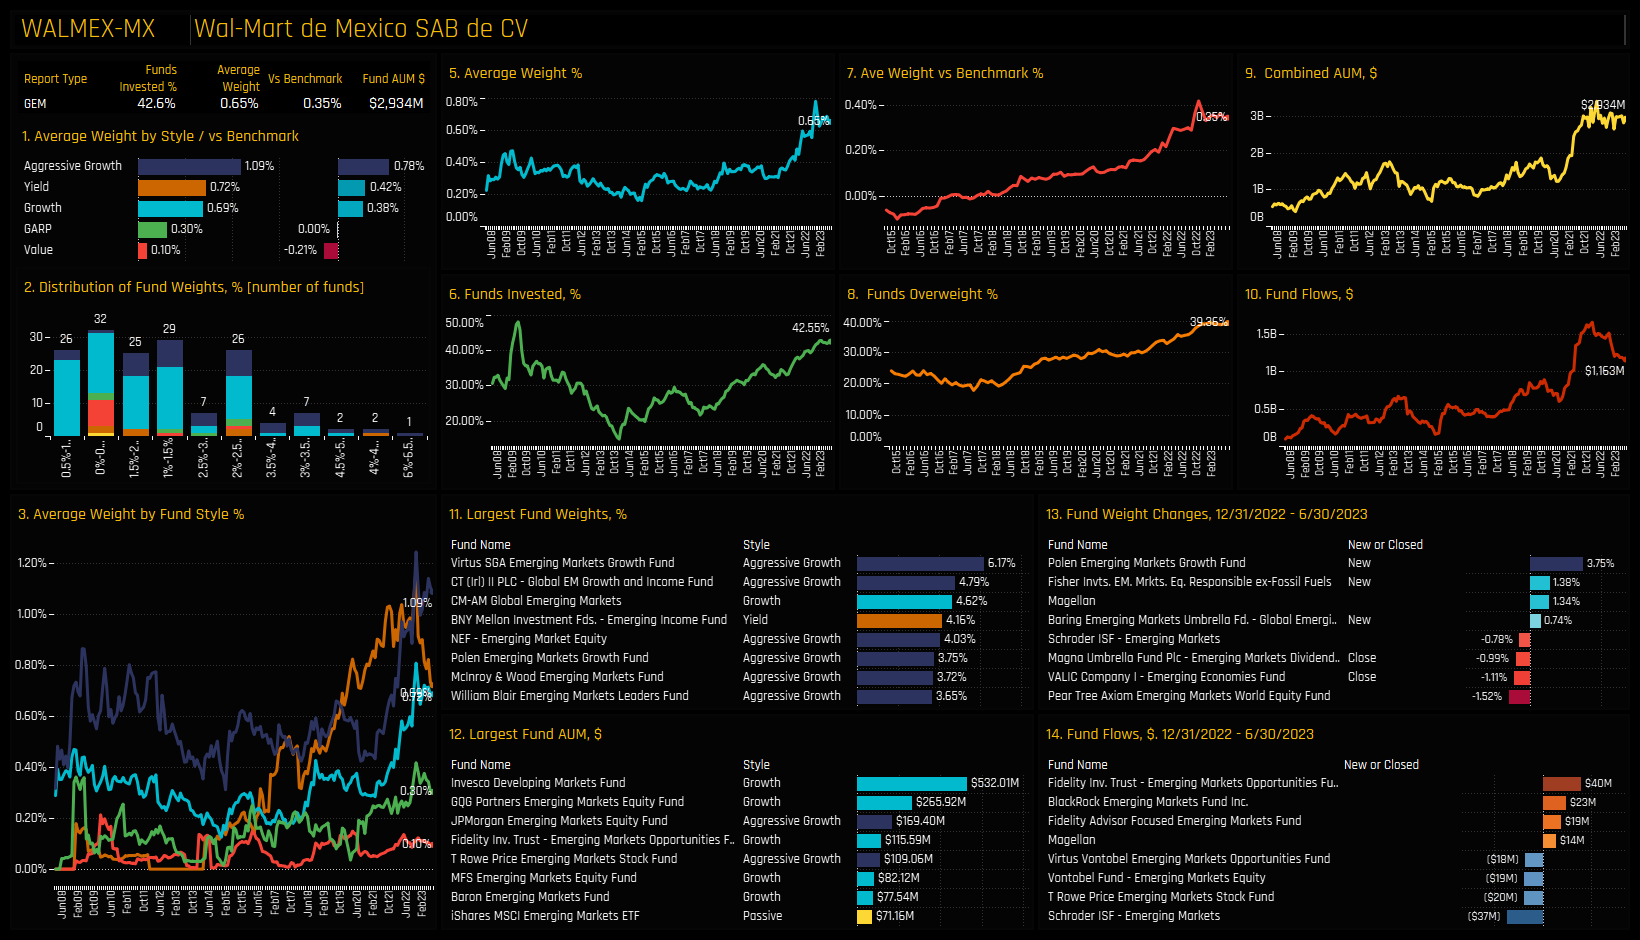
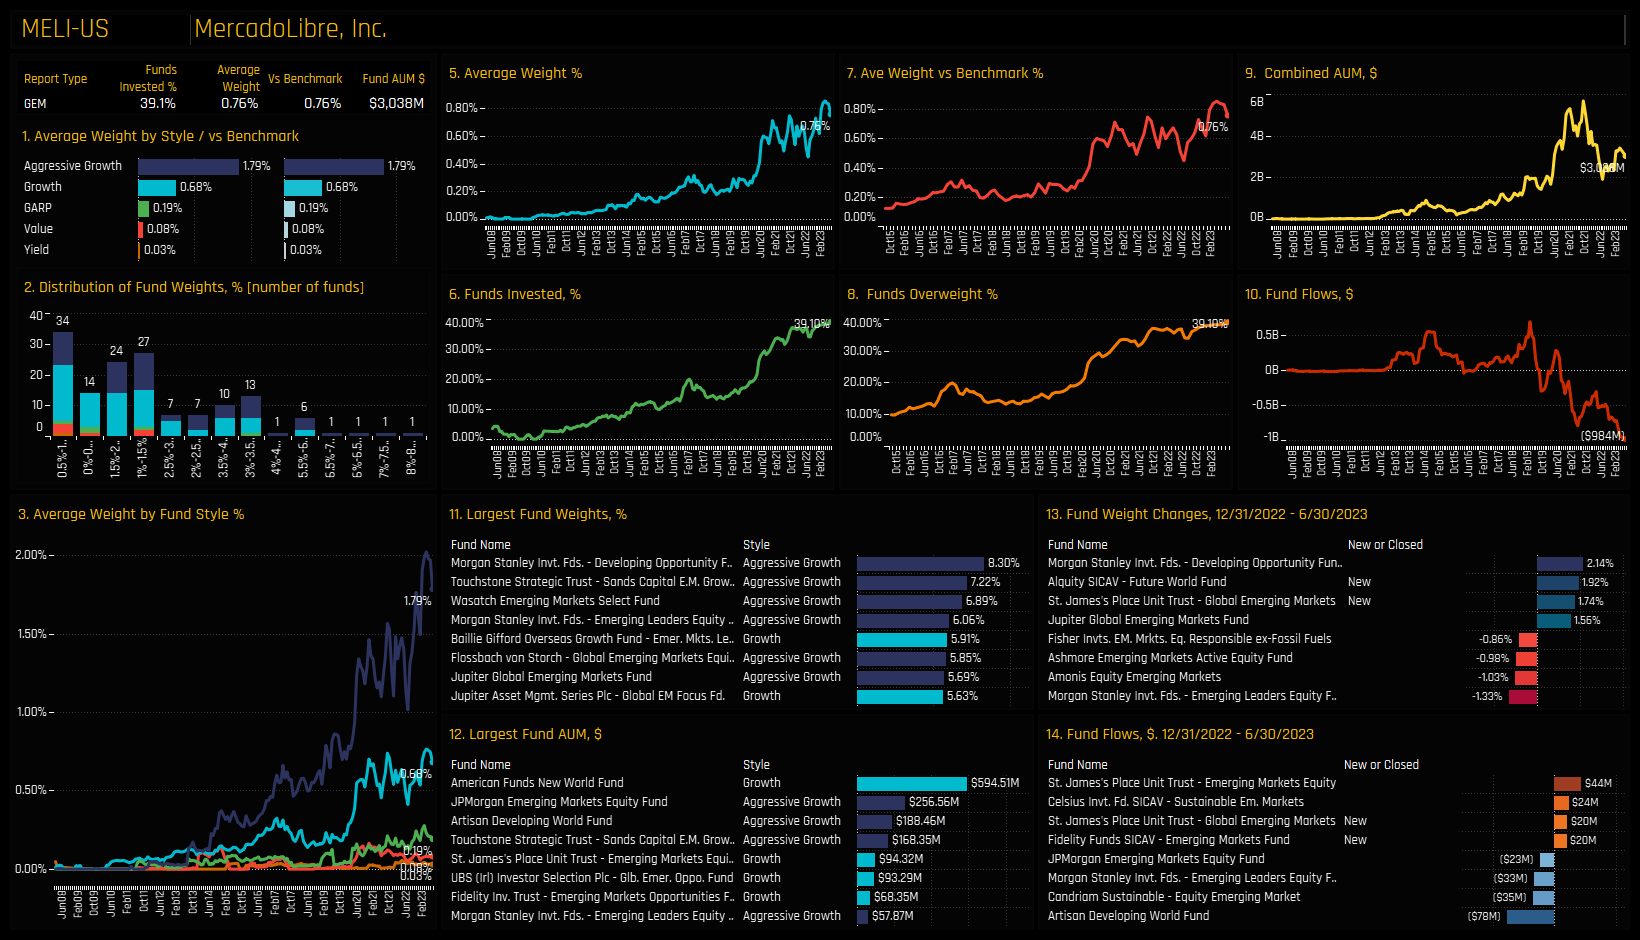
Stock Holdings & Activity
On a stock level, the 2 most widely held companies are in Mexico in the form of Grupo Financiero Banorte and Wal-Mart-de Mexico. MercadoLibre remains a popular holding with 39.1% of funds invested, whilst Itau Unibanco is the most widely held Brazilian company. On a fund level, Artisan’s DM biased EM fund holds a sizeable position in NVIDIA, whilst MercadoLibre has attracted high conviction positions from Morgan Stanley and Touchstone, among others.
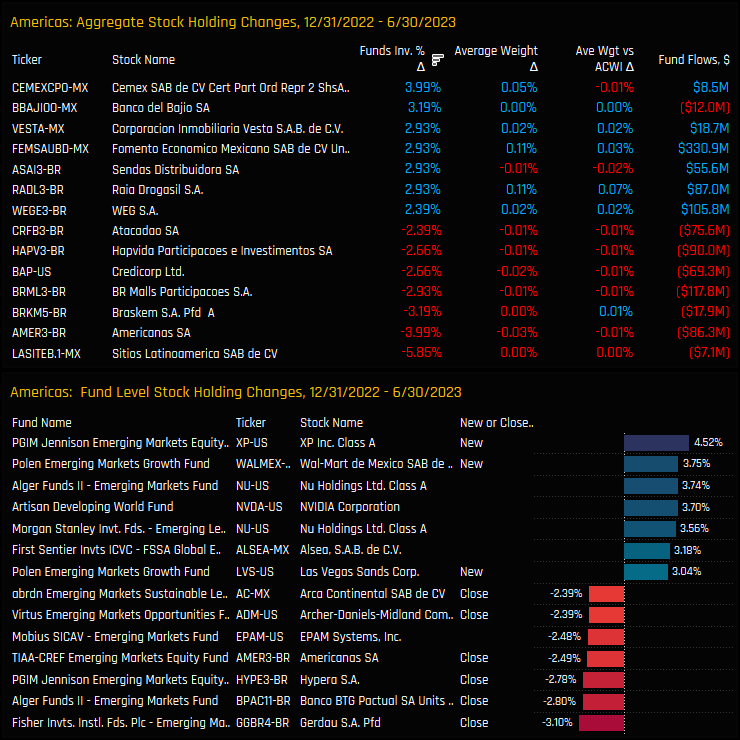
Over the last 6-months, stock level activity has been reasonably well balanced. The percentage of funds invested in Cemex SAB and Banco Del Bajio increased by 3.99% and 3.19% respectively. These were offset by net closures in Sitios Latinamerica SAB (-5.85%) and Americanas SA (-3.99%). On a fund level, PGIM Jennison’s new position in XP Inc stands out as a large non-EM weight, whilst the larger closures were spread across a number of Brazilian names.
Conclusions & Links
Active EM managers have never been so bullishly positioned in the Americas region relative to benchmark as they are today. To say this is a consensus position is an understatement, with just 14.1% of managers positioned lighter than the benchmark index.
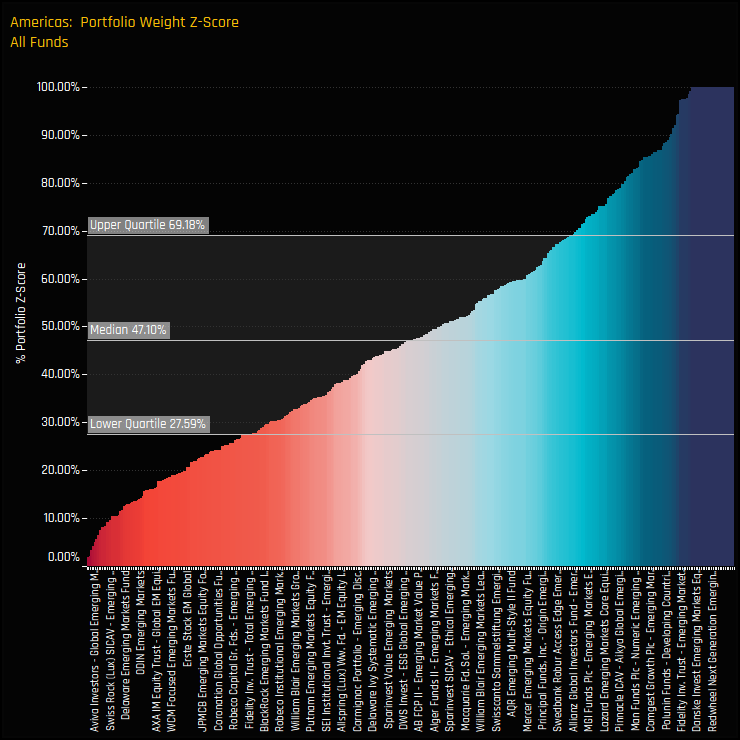
On an absolute basis the picture is less one-sided. Pre 2015, active EM managers were more accustomed to holding >15% in the region on average, so there is a historical precedent for the Americas to command a higher regional allocation.
The chart opposite shows the Z-Score of current weights versus history in the Americas for all funds in our analysis. A value of 100% means today’s weight is the highest on record for that fund, 0% the lowest. The picture is evenly split, with 50% of funds showing a Z-score of less than 47%. Only 24 funds are at their maximum ever exposure in the region out of the 376 funds in our analysis. There is clearly room for allocations to move higher from here.
Click below for an extended data report on positioning in the Americas region among the active EM funds in our analysis. Scroll down for profiles on Banorte, Wal-Mart de Mexico and MercadoLibre.
Record exposure in Voltronic Power Technology as EM funds open new positions.
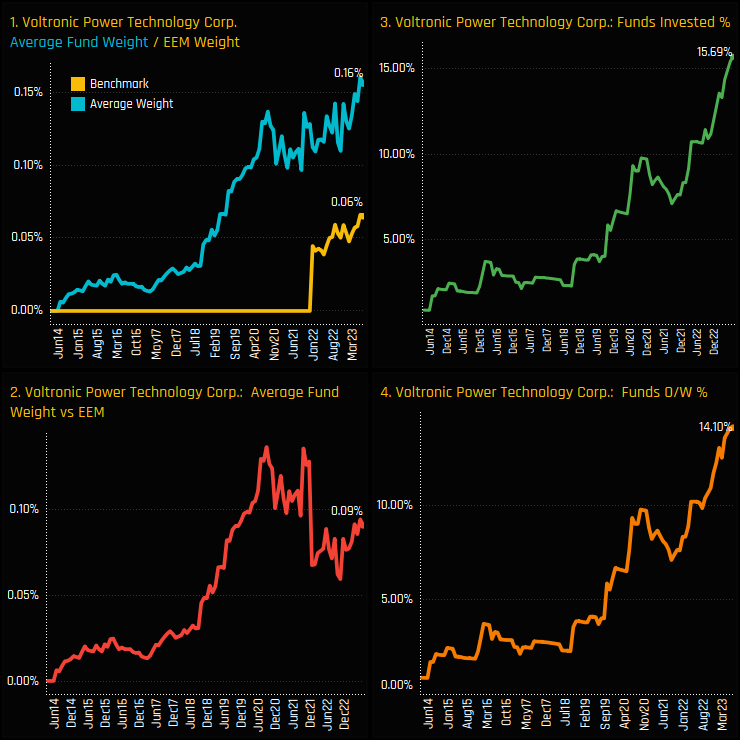
Ownership in Voltronic Power Technology has soared to record levels. Active EM managers accumulated positions well before Voltronic’s entry in to the MSCI Emerging Markets index in late 2021, but since then ownership has spiked markedly higher. A record 15.7% of EM funds now own a position at an average weight of 0.16%, or overweight the benchmark by 0.09%.
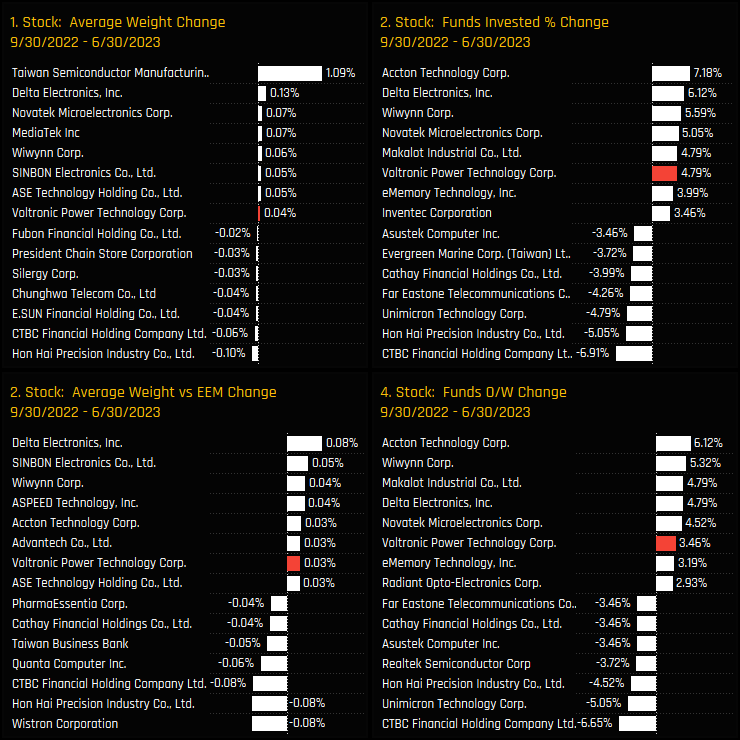
The charts below show the aggregate ownership changes in Taiwanese stocks since Voltronic’s latest spike higher in September 2022. Voltronic captured the 5th largest increase in the percentage of funds invested of +4.8%, though absolute weight changes were small in comparison to the big hitters of TSMC, Delta Electronics and Novatek Microelectronics.
Fund Activity & Holdings
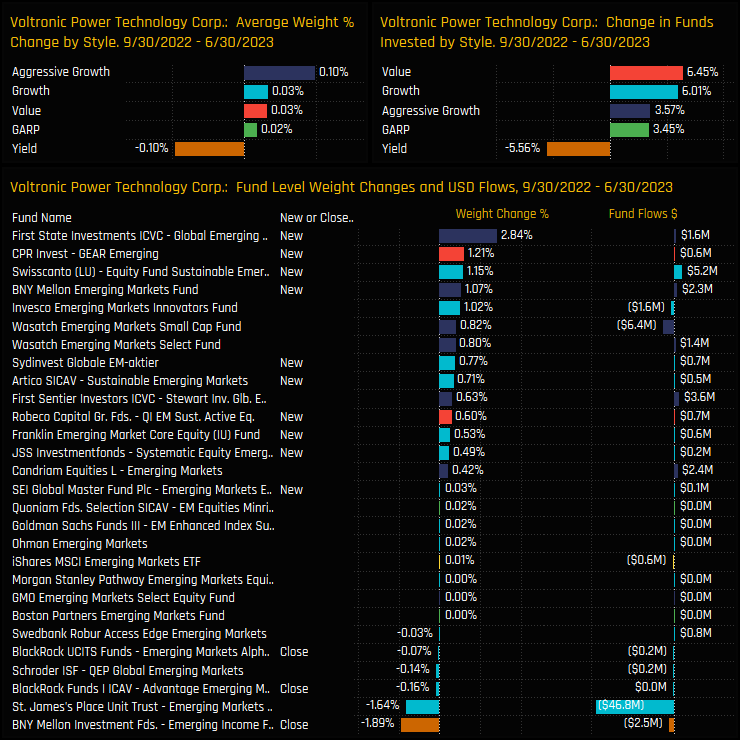
These ownership increases were underpinned by new positions from First State Global EM (+2.84%), CPR Invest (+1.21%) and Swisscanto Sustainable EM (+1.15%) among others. New position sizes were typically kept below 2%, reflective of Voltonic’s sub $5bn market cap. On a Style basis, both Value and Growth funds saw net ownership rise, though Yield funds fell on account of BNY Mellon EM Income 1.9% position closure.
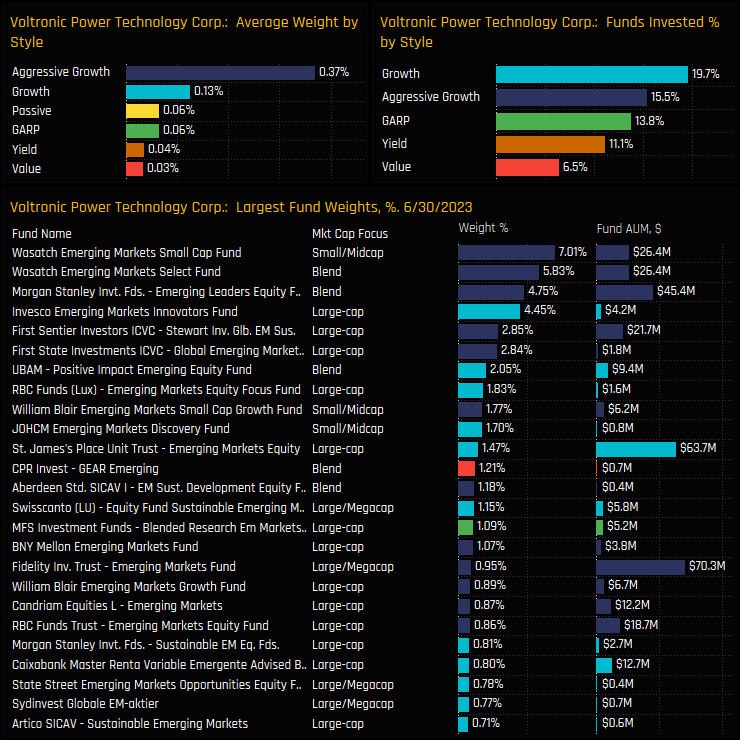
The current investor base is skewed towards the Aggressive Growth end of the spectrum, with average weights of 0.37% backed up by large positions from Wasatch’s EM Small Cap (7%) and Select Funds (5.8%). Of the 60 funds who own Voltronic, 7 hold above 2%, 9 hold between 1% and 2% and the rest below 1%. It has yet to convince the majority of investors for a larger weight and remains a fringe holding for most.
Conclusions & Links
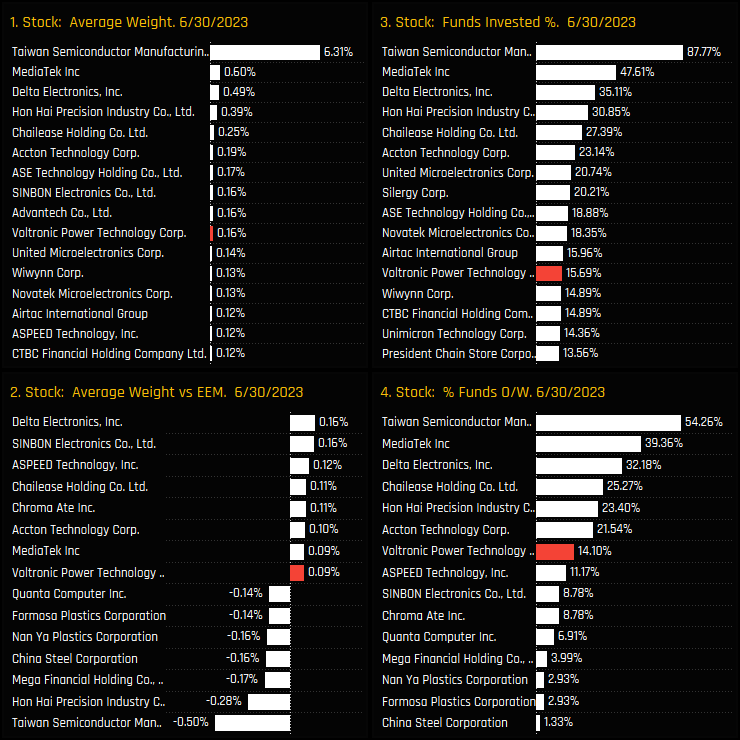
The recent spike in activity has moved Voltronic Power Technology up the order of Taiwanese stock exposures. The charts to the right show the latest ownership statistics for Taiwanese companies among EM investors. Voltronic Power Technology is the 12th most widely owned stock in Taiwan and the 7th most overweighted company.
It’s early stages, with relatively small position sizes and most EM funds yet to invest, but the recent upswing in sentiment suggests that Voltronic deserves the attention of every active EM investor.
Click below for the extended data report on Voltronic Power Technology among the active GEM funds in our analysis.
For more analysis, data or information on active investor positioning in your market, please get in touch with me on steven.holden@copleyfundresearch.com
Investor Positioning Report — Copley Fund Research Ltd · Last updated: July 2026 · Registered in England and Wales
1. Who we are
Copley Fund Research Ltd provides proprietary institutional fund intelligence to listed companies and investor relations professionals. These terms govern every purchase of an Investor Positioning Report. By completing a purchase you confirm you have read, understood, and agreed to these terms in full.
2. What you are purchasing
The Investor Positioning Report is a bespoke PDF report mapping the institutional fund universe around your stock. It covers current investors, past investors, competitor investors, and white space investors. Every report is built from scratch for the specific company ordered and is not a standardised or templated product.
3. Delivery and process
Following payment or invoice issuance, Copley Fund Research will contact you within one working day to agree your competitor set. Production begins once the competitor set is confirmed in writing. The completed report will be released to you within 48 hours of production starting, provided payment has been received in full; where payment is outstanding, the report will be withheld until payment clears. If the requested company falls outside our covered fund universes, or a competitor set cannot be agreed, Copley Fund Research will issue a full refund or cancel the outstanding invoice.
4. Competitor set agreement
The competitor set is agreed with you in writing prior to production, and the report is built to that agreed specification. Requests to amend the competitor set after delivery, based on a change of preference rather than an error, may be treated as a new order.
5. Refund policy
Because each report is produced individually for your company, orders are non-refundable once production has begun, except as set out in clauses 3 and 5a below. By purchasing, you agree not to dispute the charge with your card provider on the basis that the service was not as described, provided the report has been delivered to the agreed specification or corrected under clause 5a.
5a. Quality remedy
If a delivered report contains a material error caused by Copley Fund Research — for example, an incorrect company analysed, a competitor omitted from the agreed set, or content missing from the specification in clause 2 — Copley Fund Research will correct and redeliver the report at no additional charge, within a reasonable timeframe. This is your sole remedy for such errors.
6. Data and accuracy
All fund positioning data in the report reflects holdings as disclosed at the most recently available reporting date at the time of compilation. The timing of fund holdings disclosures is determined by regulatory requirements applicable to each fund and is outside the control of Copley Fund Research Ltd. This data may not reflect current fund positions. Copley Fund Research takes reasonable care to ensure accuracy but makes no warranty, express or implied, as to the completeness or current accuracy of the underlying data — though this does not affect the quality remedy in clause 5a for errors in how that data was analysed or presented. Past fund positioning is not indicative of future fund behaviour or investment decisions.
7. Not investment advice
The Investor Positioning Report is produced for investor relations intelligence purposes only. It does not constitute investment advice, financial advice, or a recommendation to buy, hold, or sell any security. The data reflects historical fund positioning and must not be relied upon as a prediction of future fund behaviour or investment decisions. Copley Fund Research Ltd is not authorised or regulated by the Financial Conduct Authority for the provision of investment advice.
8. Permitted use and confidentiality
The report is licensed for internal use by the purchasing organisation only. You may share it with employees and directors of your organisation. You may not: reproduce, redistribute, publish, or resell the report or any part of it; share it with any third party outside your organisation without prior written consent; use the fund or portfolio manager names contained in the report to approach those individuals on behalf of Copley Fund Research or in a manner that could damage Copley Fund Research's relationships with those funds; or use the data for any purpose other than your own investor relations strategy. The data, analysis, and methodology contained in the report are the intellectual property of Copley


