Active EM managers are heavily positioned in TSMC. It is the largest portfolio holding for 64% of funds, with an average weight double that of its nearest rivals. But is the risk of not holding TSMC greater than playing the contrarian?
Stock Positioning
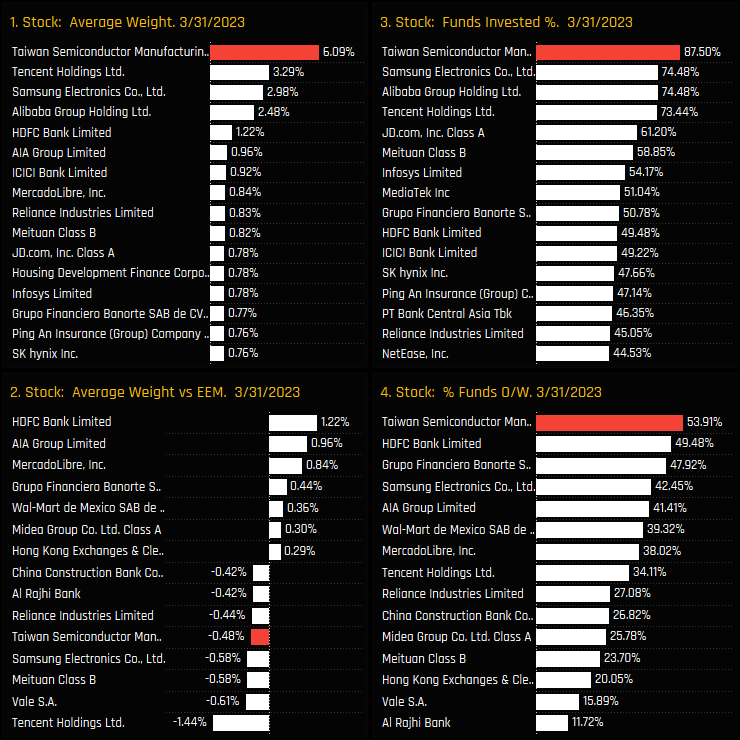
Taiwan Semiconductor Manufacturing Company (TSMC) is by far the most dominant stock holding among active EM investors. It is owned by 87.5% of the funds in our analysis (ch3) at an average weight of 6.1% (ch1), almost double the weight of Tencent Holdings, Samsung Electronics or Alibaba Group Holdings. On average, this represents an underweight of -0.48% versus the iShares MSCI Emerging Markets index (ch2), though the majority of funds hold TSMC as an overweight position (ch4).
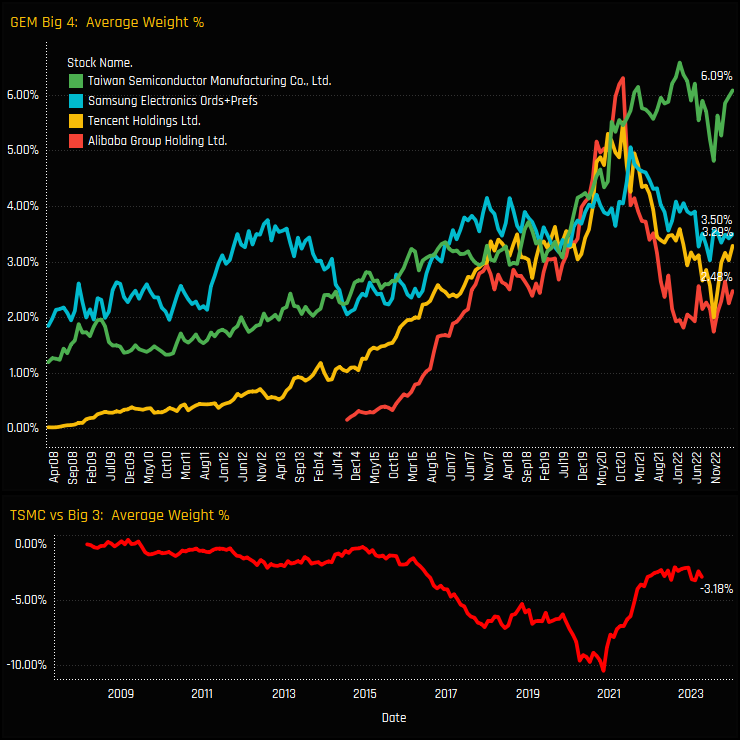
The top chart below shows the time series of average fund weights for the ‘big 4’ stocks of TSMC, Samsung Electronics (ords+prefs combined), Alibaba Group Holdings and Tencent Holdings. Between 2008 and 2018, Samsung Electronics and TSMC traded places as the dominant fund weight, with Alibaba briefly holding top spot in October 2020. But following the China ‘Tech Crackdown’ of late 2020, TSMC’s share price remained strong in the face of serious underperformance from Alibaba, Tencent and Samsung. As such, the gap between TSMC’s weight and the remaining 3 has closed towards levels last seen in 2016, when both Alibaba and Tencent were in their ownership infancy.
Fund Holdings
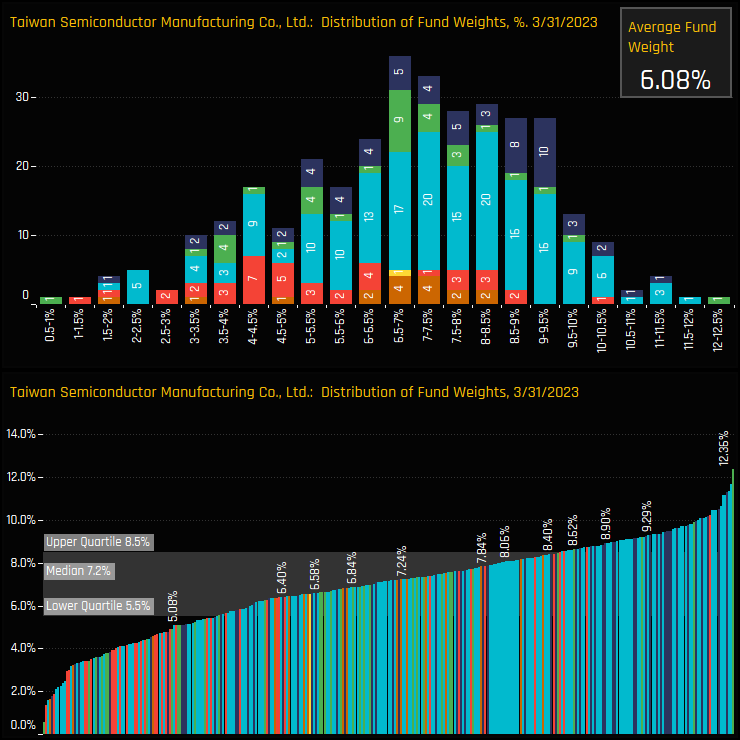
The charts below show the histogram and distribution of fund weights in TSMC using the latest fund filings, adjusted for pricing as of the end of last month. The bulk of the distribution sits at between 6% and 10%, with 218 of the 337 holders allocating within this band. Outside of this range the distribution is skewed to the left-hand side, with 101 funds holding less than 6% and 17 funds holding more than a 10% allocation.
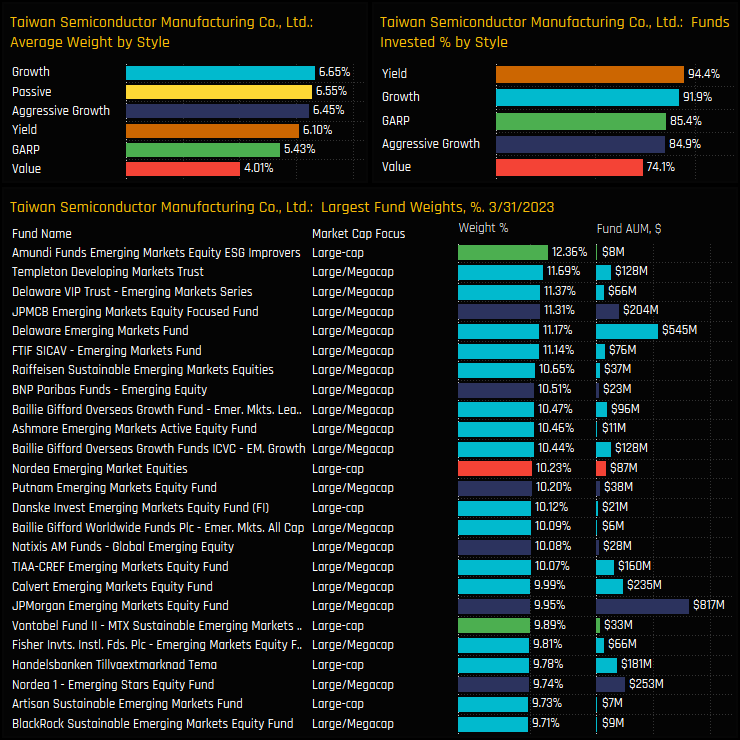
Those at the top of the distribution are led by Amundi ESG Improvers (12.4%) and Templeton Developing Markets Trust (11.7%). Allocations are correlated to the Style of the fund, with Growth and Aggressive Growth funds more heavily and widely allocated than their Value peers. Yield managers are the exception, with 94.4% of the Yield funds in our analysis holding a position at an average weight of 6.1%.
Historical and Peer Group Positioning
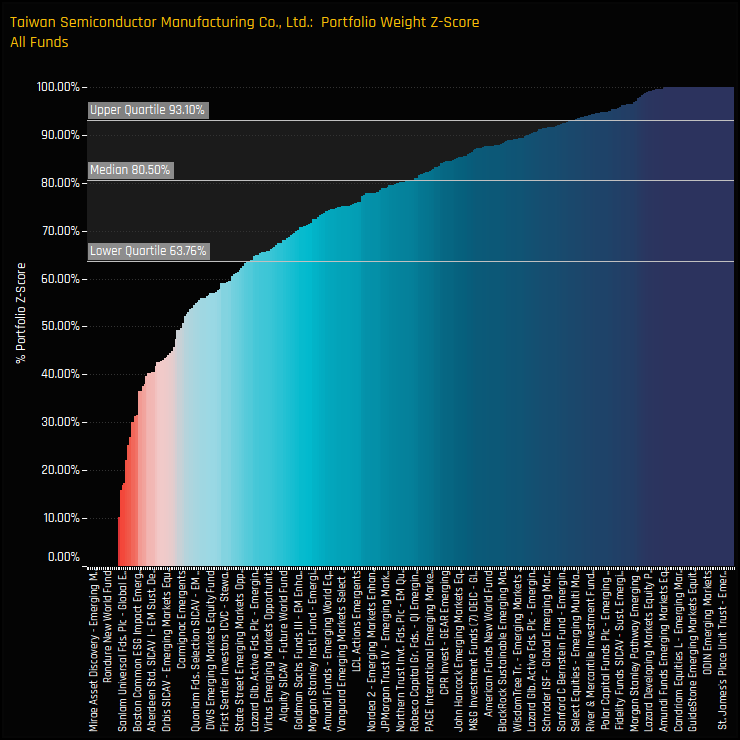
Positioning data from the EM funds in our analysis implies that fund managers are expressing unprecedented levels of confidence in TSMC’s ability to generate returns, compared to historical levels. The chart below shows The Z-Score of current portfolio weights versus history for all current and previous holders of TSMC. A value of 100% means today’s weight is the highest on record for that fund, zero the lowest. Over half of the managers in our analysis have a Z-Score of above 80% in TMSC and 3/4 above 63.7%. In short, they are heavily positioned versus their own history.
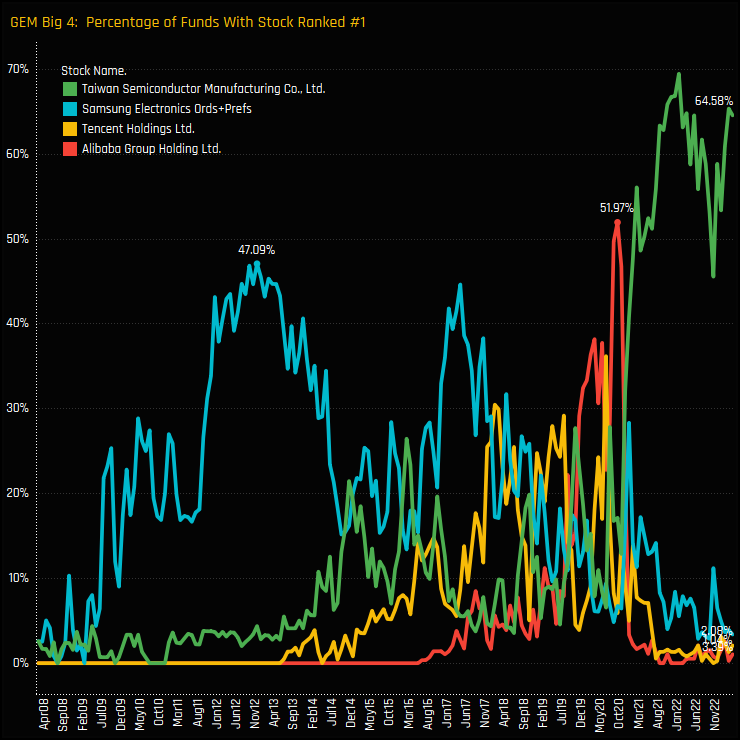
But perhaps the most telling statistic is highlighted in the chart below, which shows the percentage of funds in our analysis that have held either of the Big 4 GEM stocks as their largest position over the last 15-years. For example, in late 2012, 47.1% of EM funds held Samsung Electronics (Prefs+ords combined) as their largest holding, and just before the ‘Tech Crackdown’ in late 2020, Alibaba Group Holdings was the largest position for 52% of managers. But none of those gets close to where TSMC is today, which is held as the largest position in 64.6% of the 384 funds in our analysis (i.e 248 funds). Not quite the highest on record for TSMC, but still totally eclipsing the remaining Big 4.
Conclusions & Links
Whilst we cast no opinions on whether TSMC is worthy of such extreme positioning, there is no denying that the majority of active EM managers are hoping for TSMC to outperform. But this is nothing new, with the ownership gap to Tencent, Alibaba and Samsung Electronics in place for the last 18-months. There are certainly no obvious catalysts in our data to suggest that managers are looking to scale back positions.
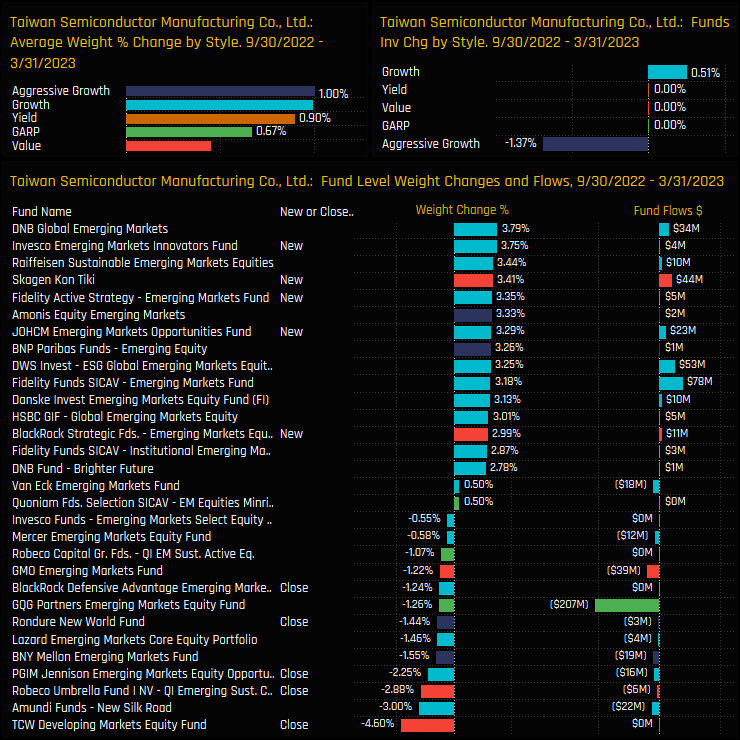
The chart to the right shows the changes in TSMC ownership split by Style and by individual Funds over the last 6-months. Average weights increased across all Style groups as TSMC outperformed (top left), and there was an even balance of opening and closing positions over the period (bottom chart).
Is TSMC overcrowded? It’s hard to argue that it’s not, with the majority of managers exposed to TSMC at weights far higher than any other stock in EM. In addition, most managers are close to their highest ever allocation. But with index weights at 6.5% and fellow active managers heavily positioned, its easy to see why most are sticking with their exposure. The risk of not holding TSMC may be greater than playing the contrarian. Whichever way you look at it, to avoid TSMC is one of the largest non-consensus stock trades in EM today.
For more analysis, data or information on active investor positioning in your market, please get in touch with us on


