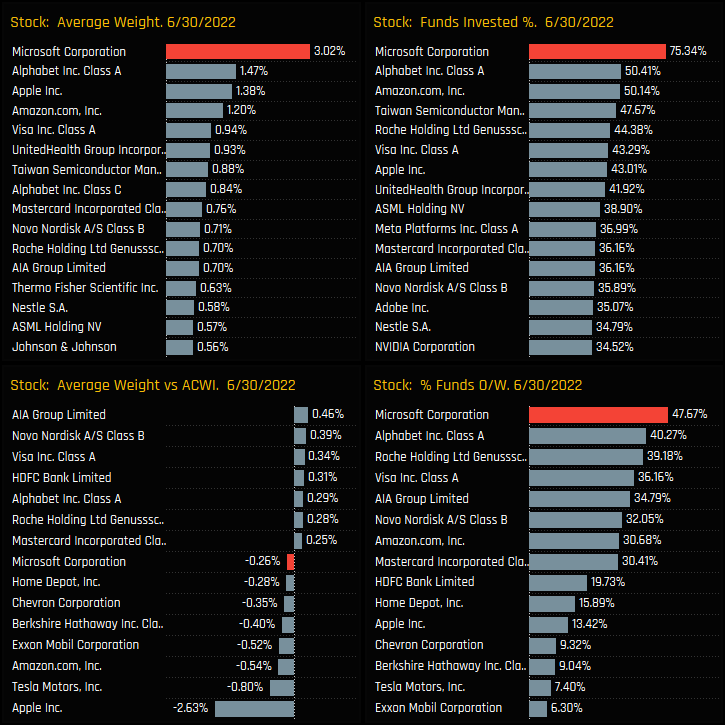
Microsoft Corporation is the most widely held stock among active US equity investors. Of the 365 active strategies in our analysis, 75% own Microsoft at an average weight of 3.02%.
There is a growing dispersion between Value and Growth managers in MSFT. Growth managers are at record levels of ownership, whereas Value managers are running their largest underweight on record.
US Growth managers are relying on Microsoft to deliver an increasing proportion of the Growth within their portfolios. The cost of that growth is coming under scrutiny by Value managers
MSFT Positioning
Microsoft Corporation is the most widely held stock among active Global equity investors. Of the 365 active strategies in our analysis, 75.3% own Microsoft at an average weight of 3.02%. Versus the iShares All Country World ETF benchmark, 47.7% of funds are overweight, the most of any stock, with average holding weights much closer to the index than key underweight Apple Inc.
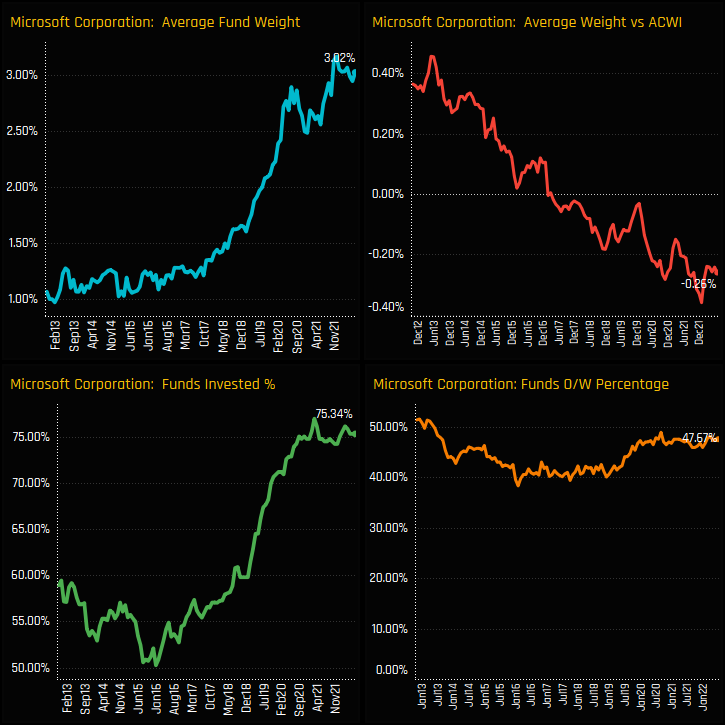
Over time, absolute ownership levels in Microsoft, shown in the left hand charts really gathered pace between early 2018 and late 2020. Average weights broke out of a sub 1.5% range and proceeded to double, commensurate with a rise in the percentage of funds invested from sub 60% to a peak of 77% in February 2021. Versus the benchmark, US investors switched to underweight in 2016 despite rising ownership, with weights in benchmark indices outpacing those of the active managers in our analysis.
Style Trends
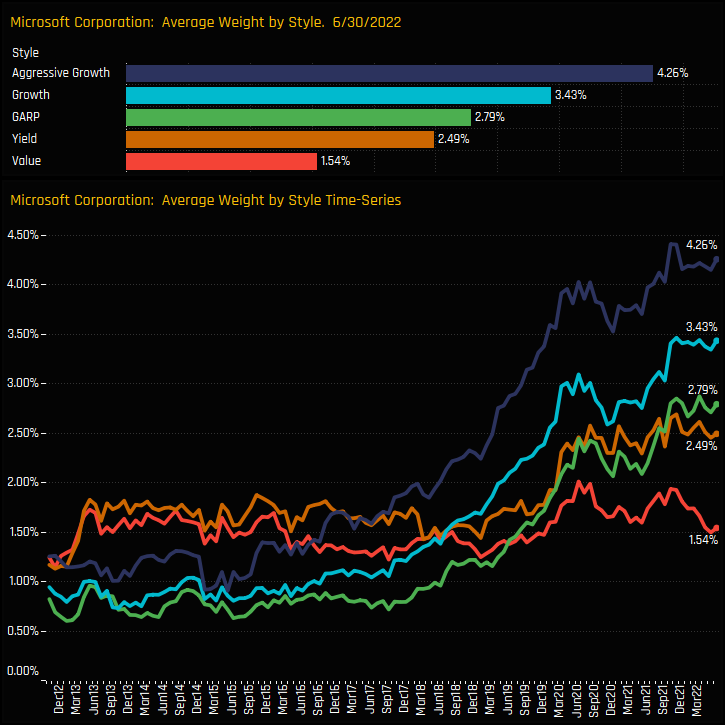
The large increase in Microsoft exposure since 2018 was driven by the Growth focused funds in our analysis. Aggressive Growth and Growth strategies have increased exposure significantly since 2018, with both sets of investors now close to their highest ever allocation levels. In contrast, Value managers have kept exposure fairly consistent and never strayed above 2% over the last decade.
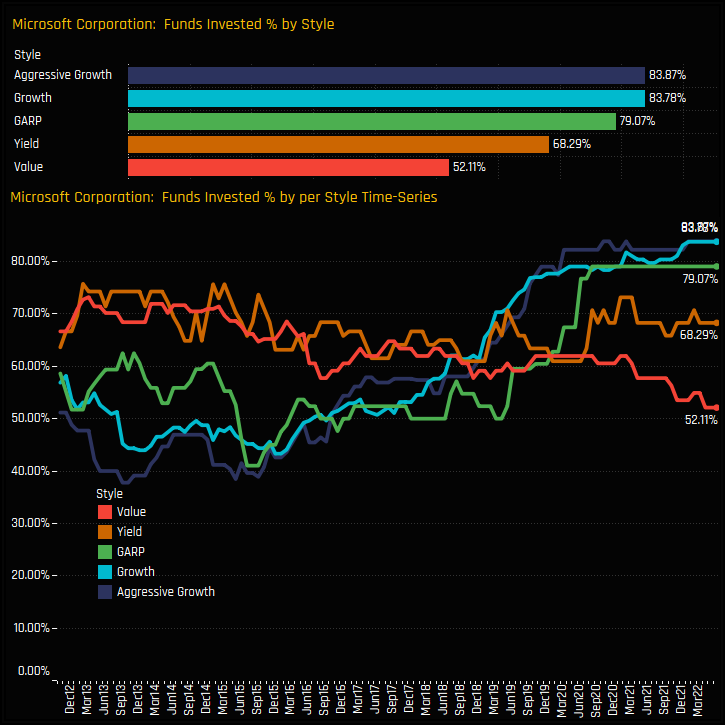
The charts below show the percentage of funds invested in Microsoft, broken down by Style group. The dispersion between Value and Growth is again evident, with the percentage of Value funds holding Microsoft at its lowest ever level of 52.1%. In contrast, a record percentage of Growth (83.78%) and Aggressive Growth (83.87%) funds have exposure to the stock.
Style Dispersion
Versus the benchmark, Growth and Aggressive Growth investors are overweight Microsoft, with Value funds at record underweights of -1.74%, on average.
This puts the difference between Aggressive Growth and Value fund allocations in Microsoft Corp at their highest ever wides of -2.71%.
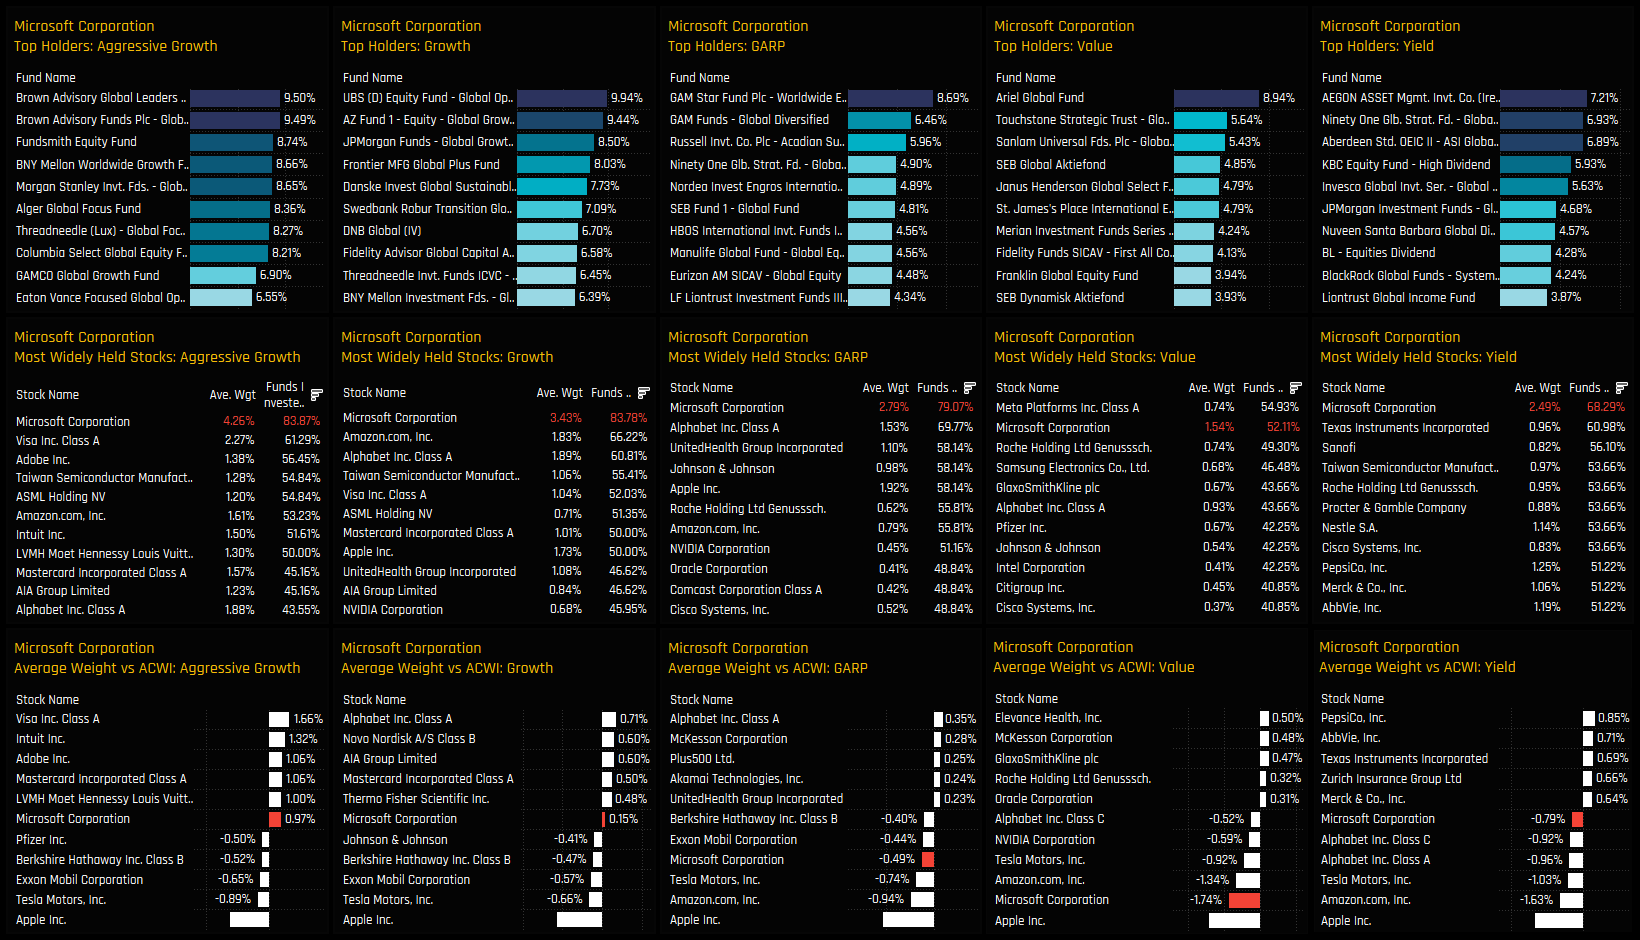
Microsoft Holdings by Style
It’s an interesting set up. It’s not as if Microsoft doesn’t classify as a valid investment for Value managers. The charts below show the top holders, the aggregate stock holdings and the key stock over/underweights for each Style group. It highlights Microsoft as the most widely held stock among Aggressive Growth, Growth, GARP and Yield investors and the 2nd most widely held among Value. The differences lie not only with the higher percentage of Growth biased managers invested in Microsoft, but also in the size of the individual fund allocations. Growth and Aggressive Growth managers are more likely to run big overweights in Microsoft, whilst Value managers hold Microsoft as a less dominant position.
Growth vs Value
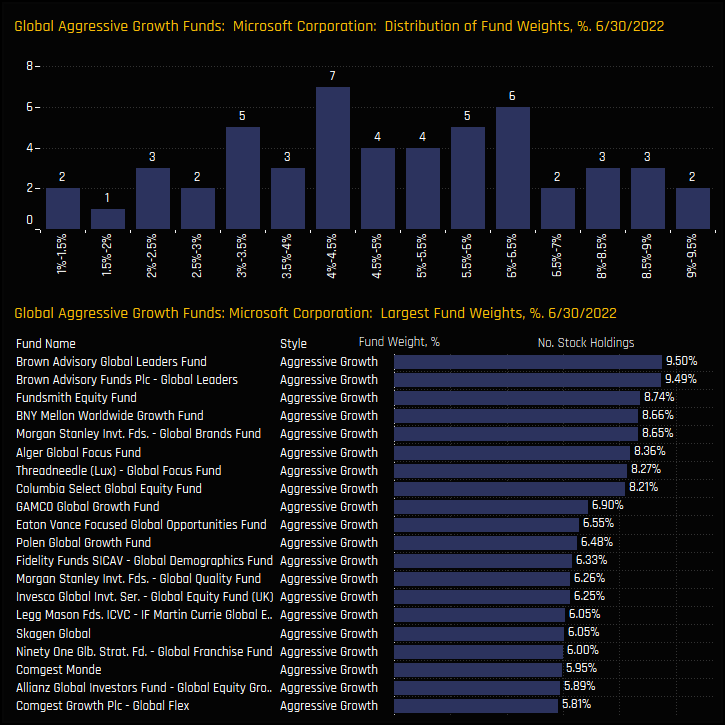
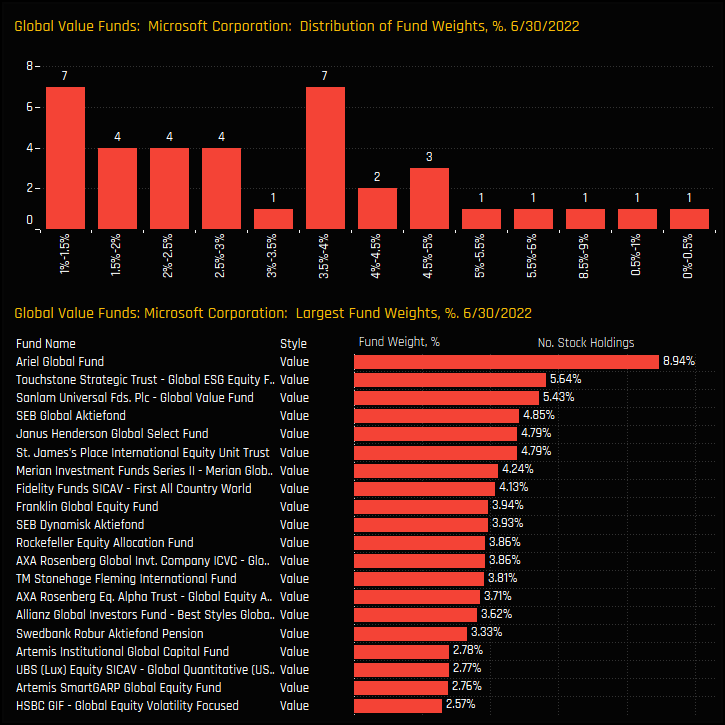
We can see this more clearly by looking at the distribution of Microsoft holdings among Global Aggressive Growth (left chart) and Value managers (right chart). The majority of holding weights for Aggressive Growth managers sit above 2% with the peak of the distribution between 4% – 6.5%. For Value, the majority of funds have portfolio weights of between 1.% and 4%. Only 8% of Value managers hold more than a 5% portfolio weight in Microsoft compared to 32.7% for Aggressive Growth.
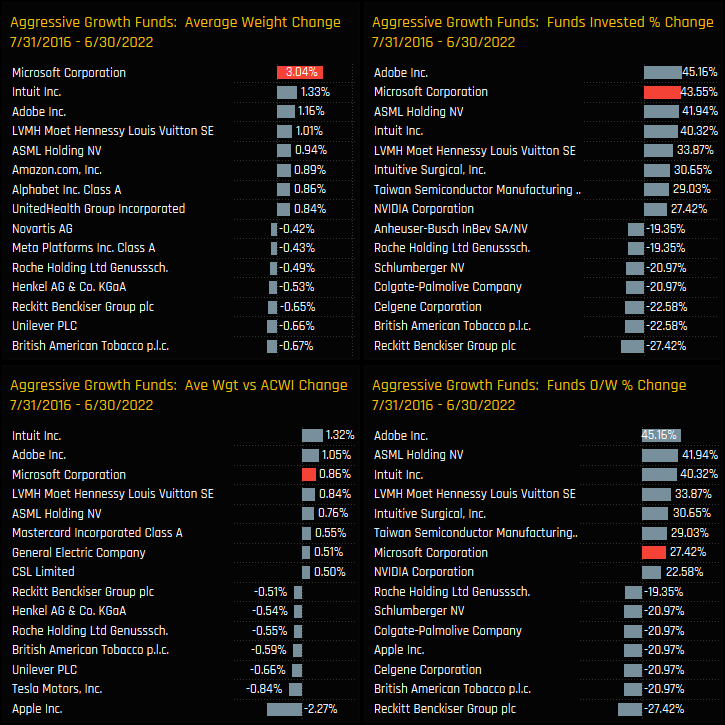
The Style Rebalance
What kind of stock activity has driven this divide? The charts below show the change in stock allocations among Aggressive Growth managers from the time they were last in-line with Value managers in July 2016. The rotation in to Microsoft has been sizeable and deliberate for Aggressive Growth managers, with 43.6% opening positions, average weights rising by +3.04% and overweights by +0.86%. This has displaced exposure in stocks such as Reckitt Benckiser Group, Unilever PLC and British American Tobacco, among others. Aggressive Growth managers have been more comfortable relying on Microsoft to deliver an increasing proportion of the Growth within their Global portfolios.
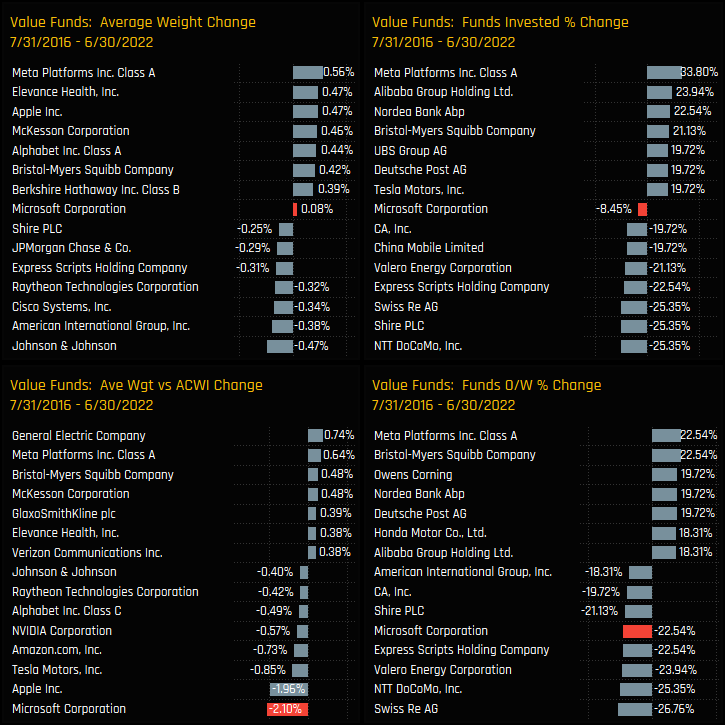
Compare this to Value managers, where exposure in Microsoft has fallen on all measures. Over the same period, average weights declined by -0.08% and relative weights by -2.1% as -8.45% of Value managers closed exposure entirely. The size of the stock rebalances have been more moderate over the period too, with Meta Platforms the most obvious beneficiary, capturing new investment from +33.8% of Value managers with weights increasing by +0.56%. For Value managers, though Microsoft remains a key holding, it’s value characteristics do not warrant such an allocation skew, and the number of Value managers placing their confidence in Microsoft is diminishing.
Click on the link below for the latest data report on Microsoft Corp positioning among active Global funds.
For more analysis, data or information on active investor positioning in your market, please get in touch with me on steven.holden@copleyfundresearch.com


