14 January
Emerging Markets
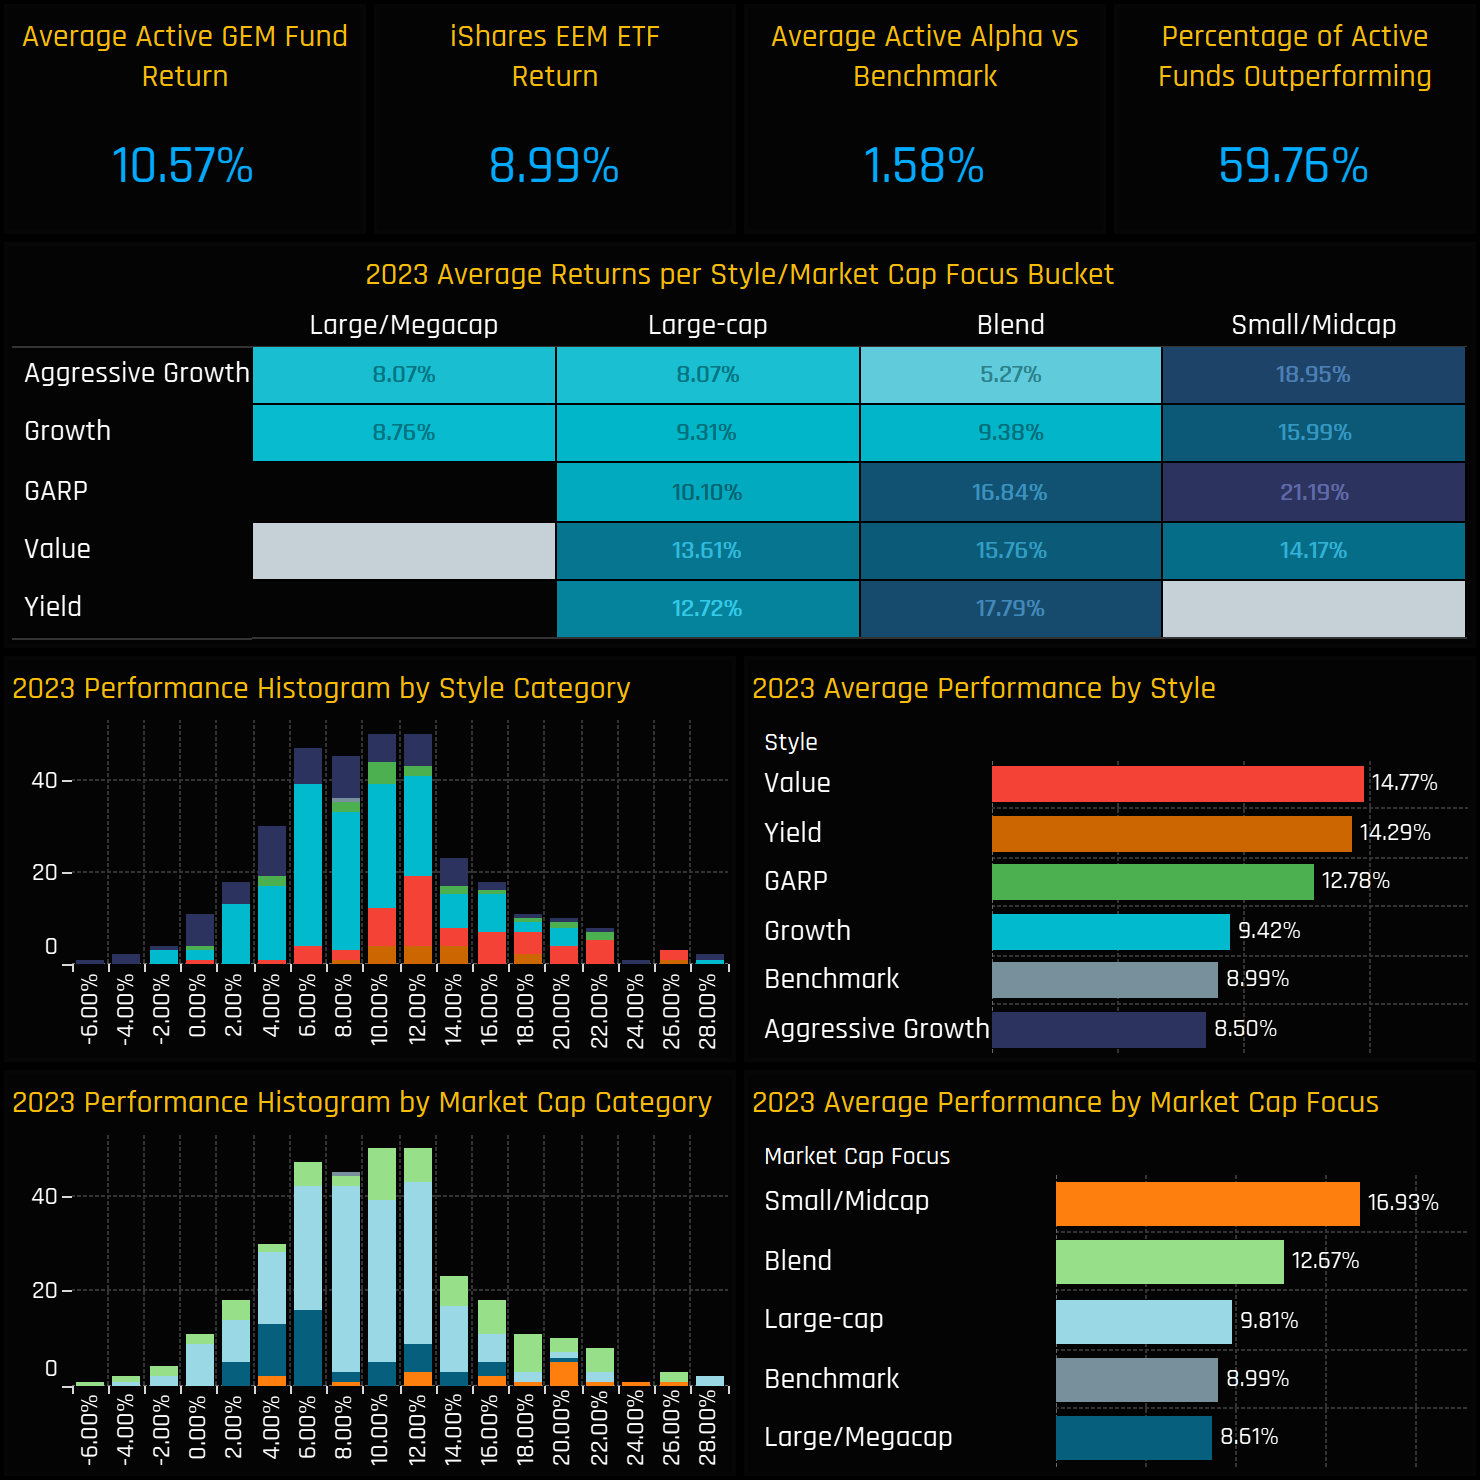
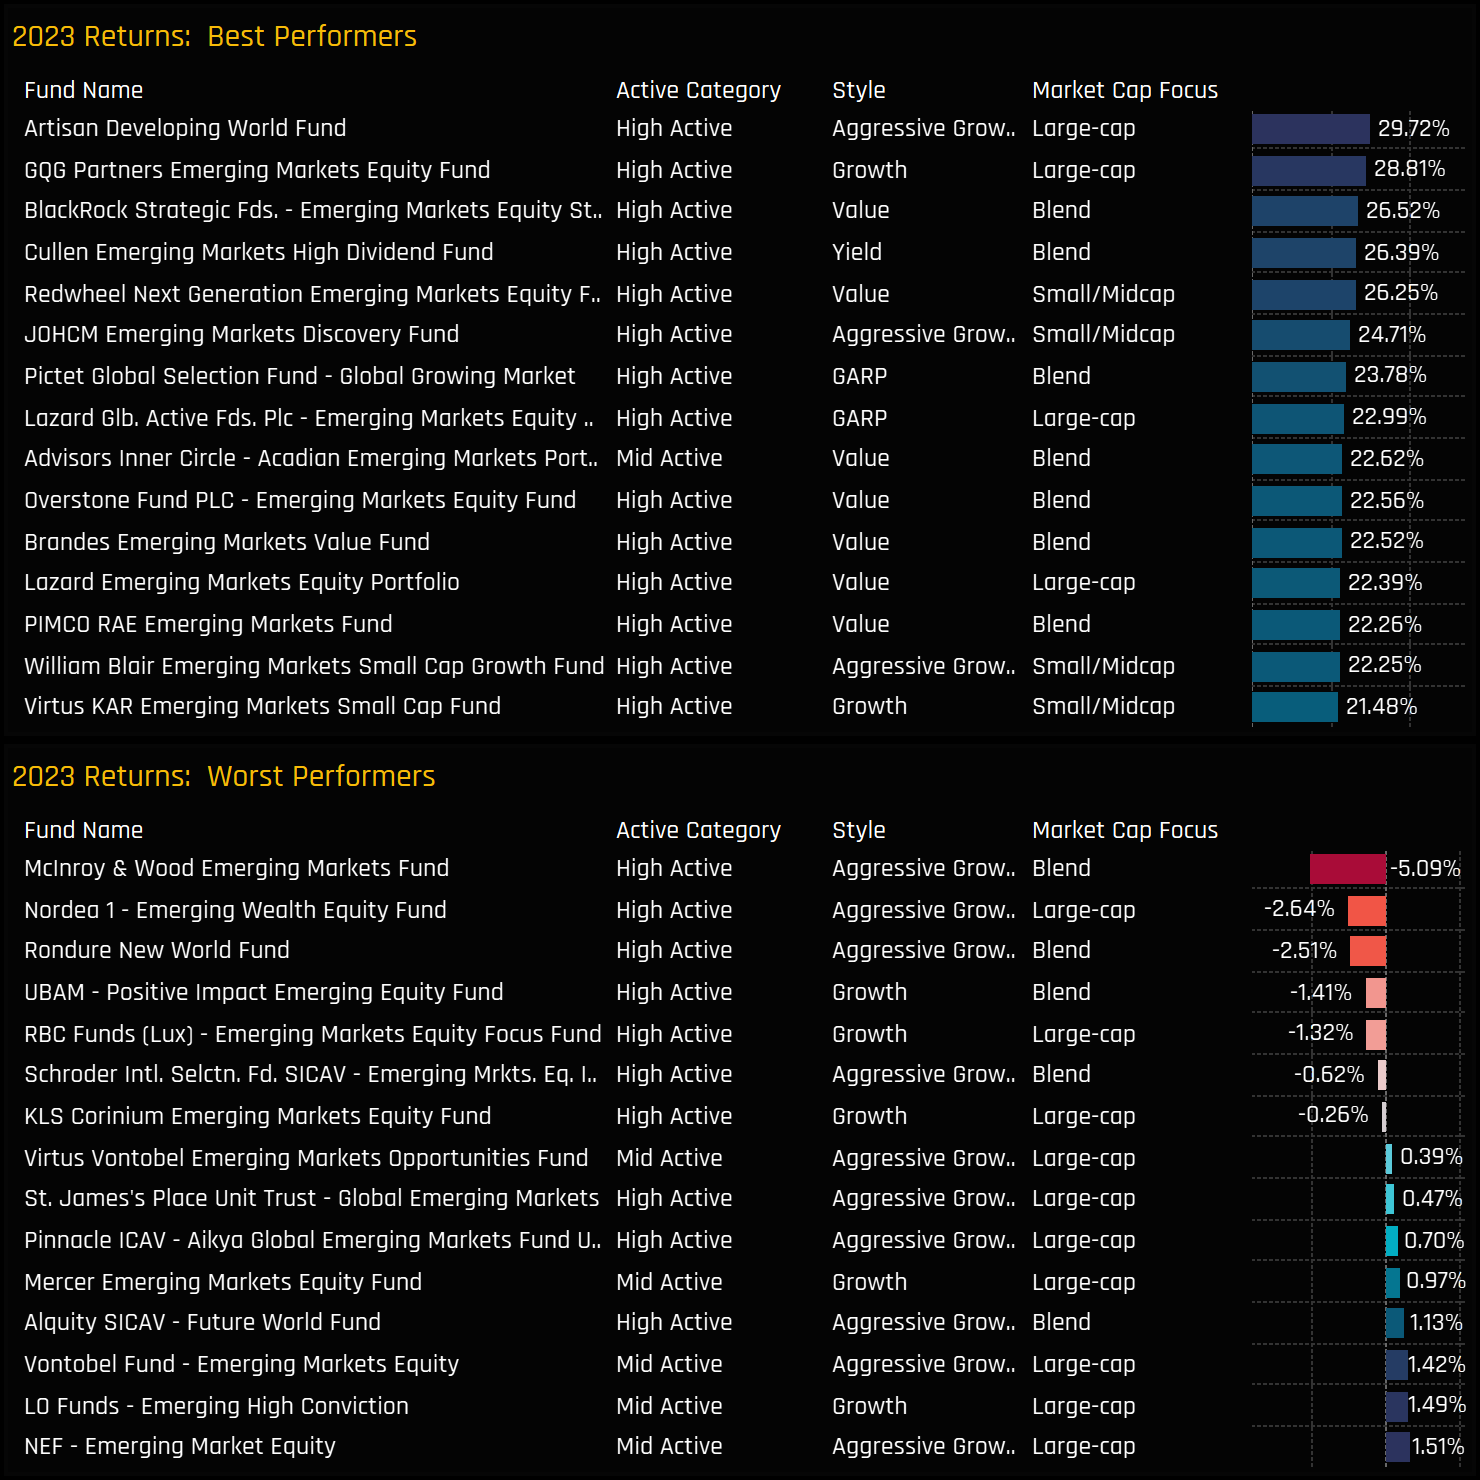
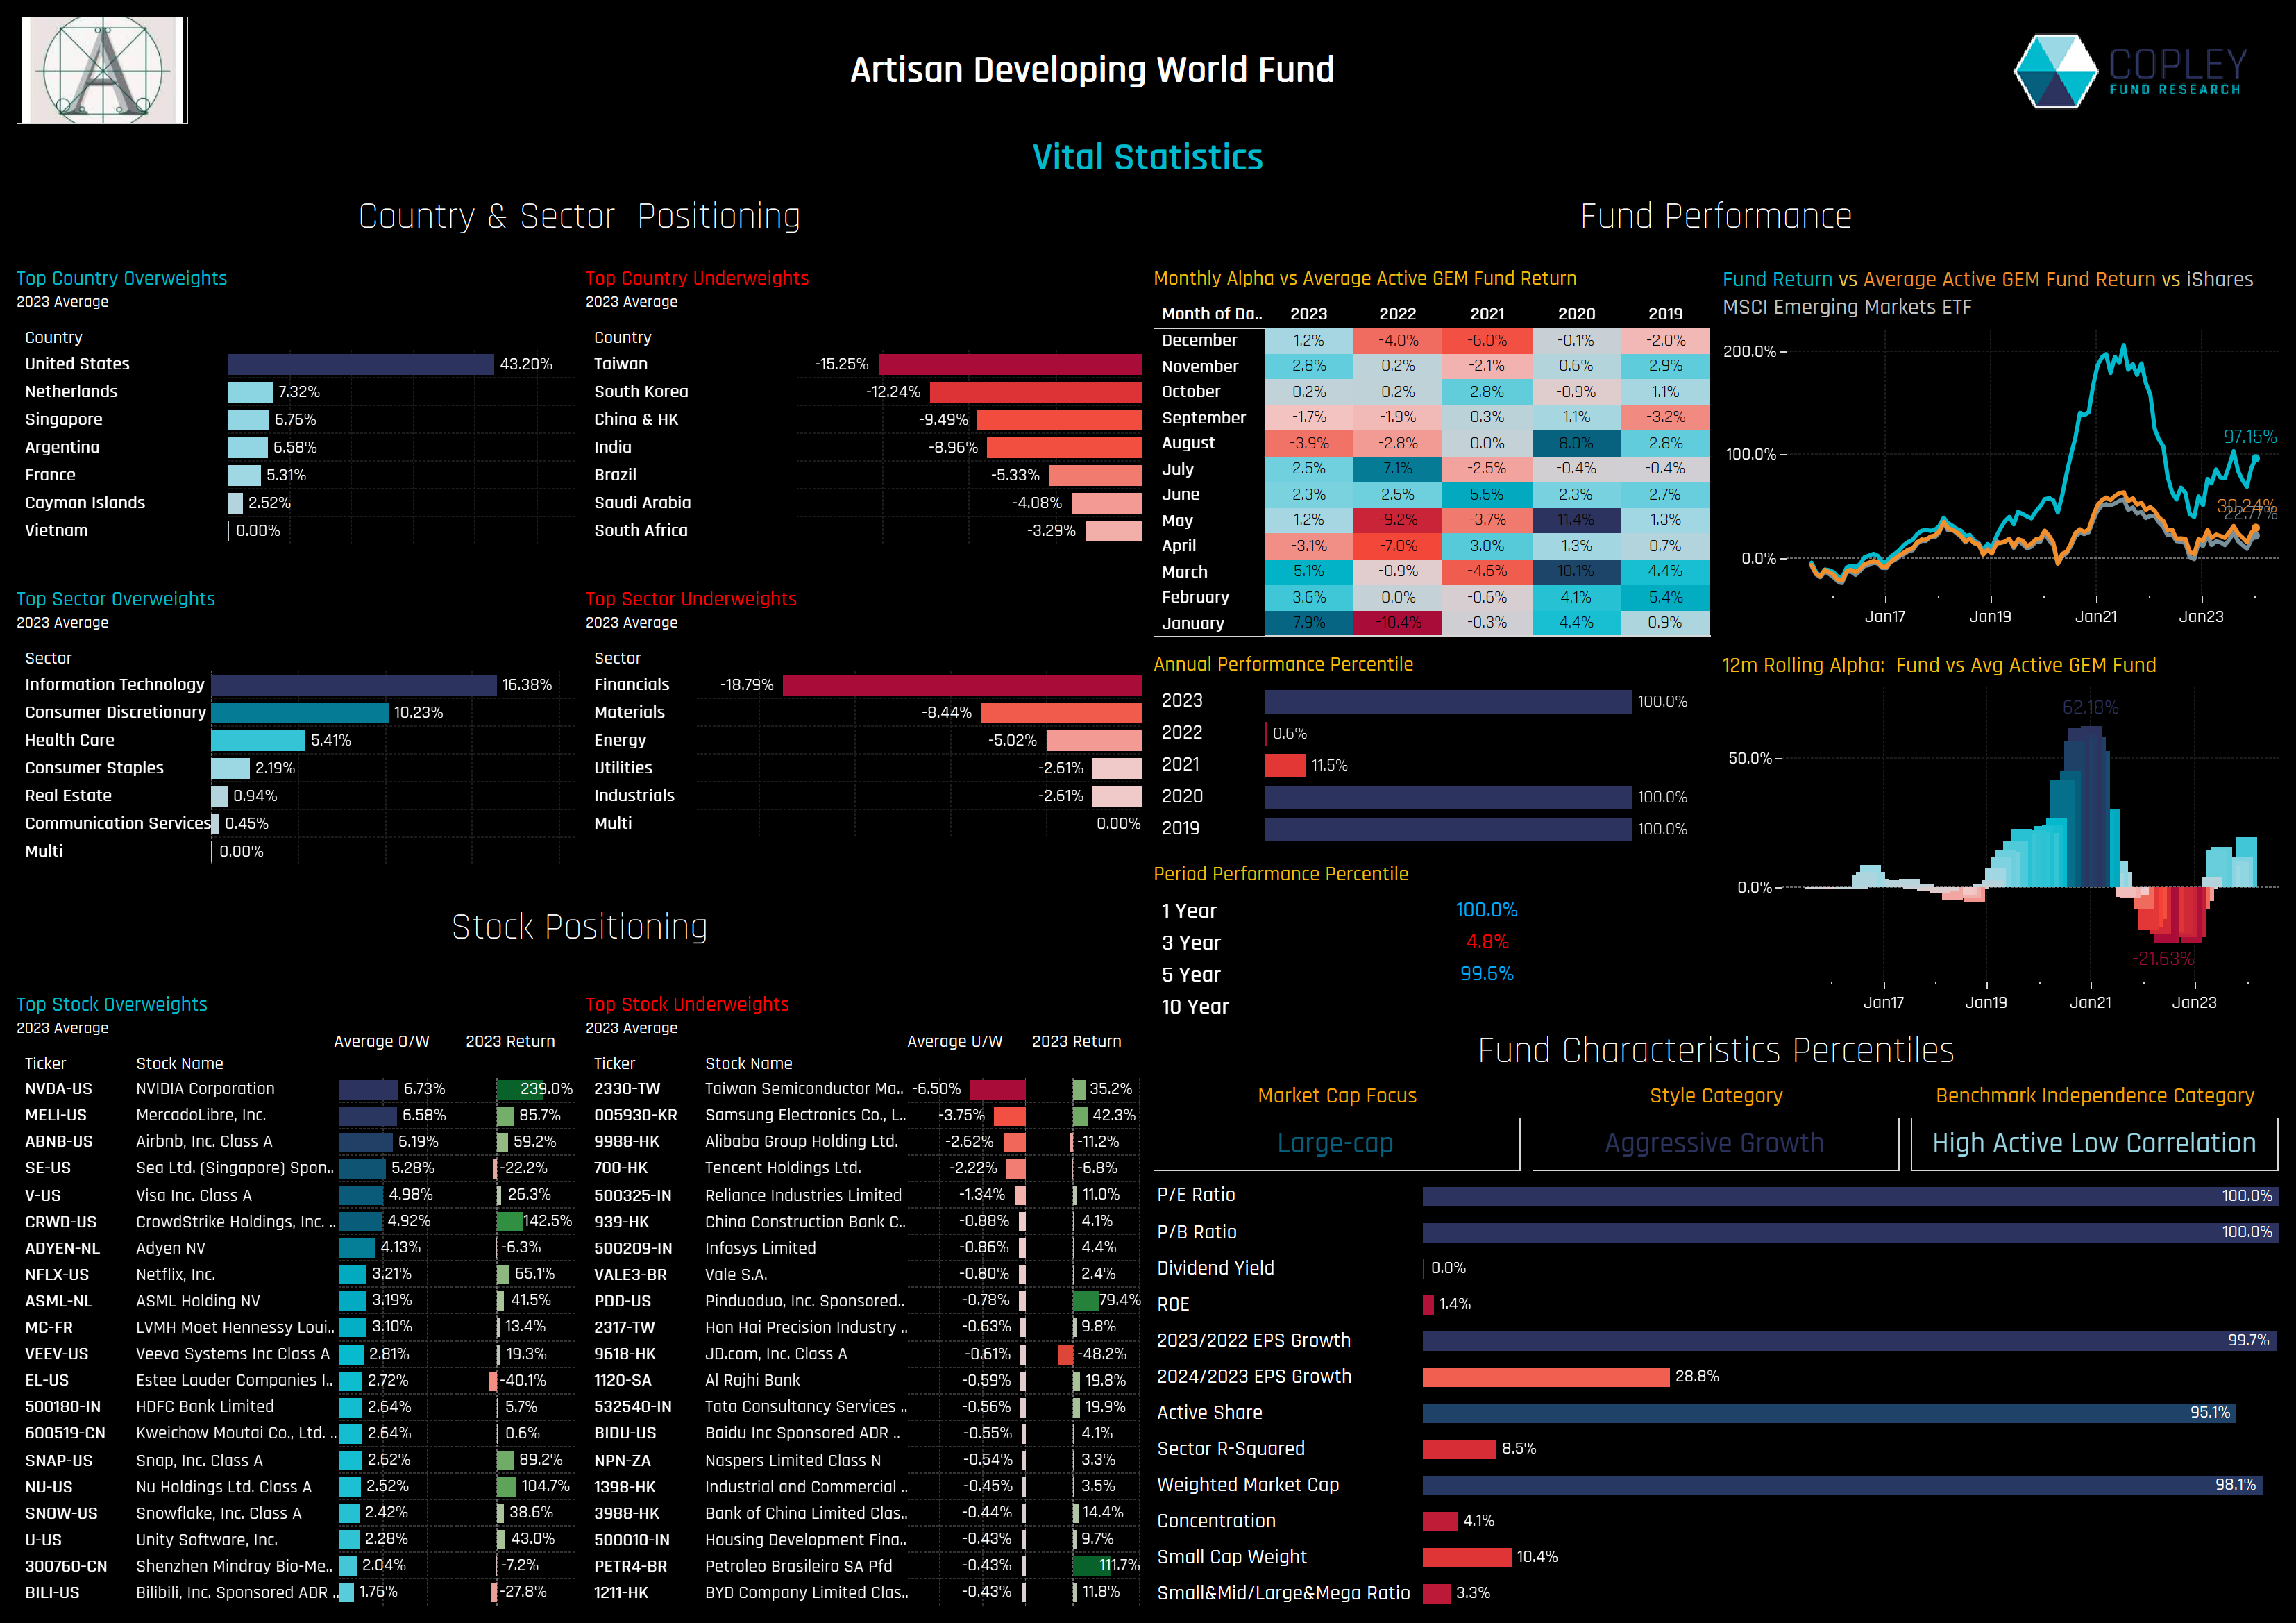
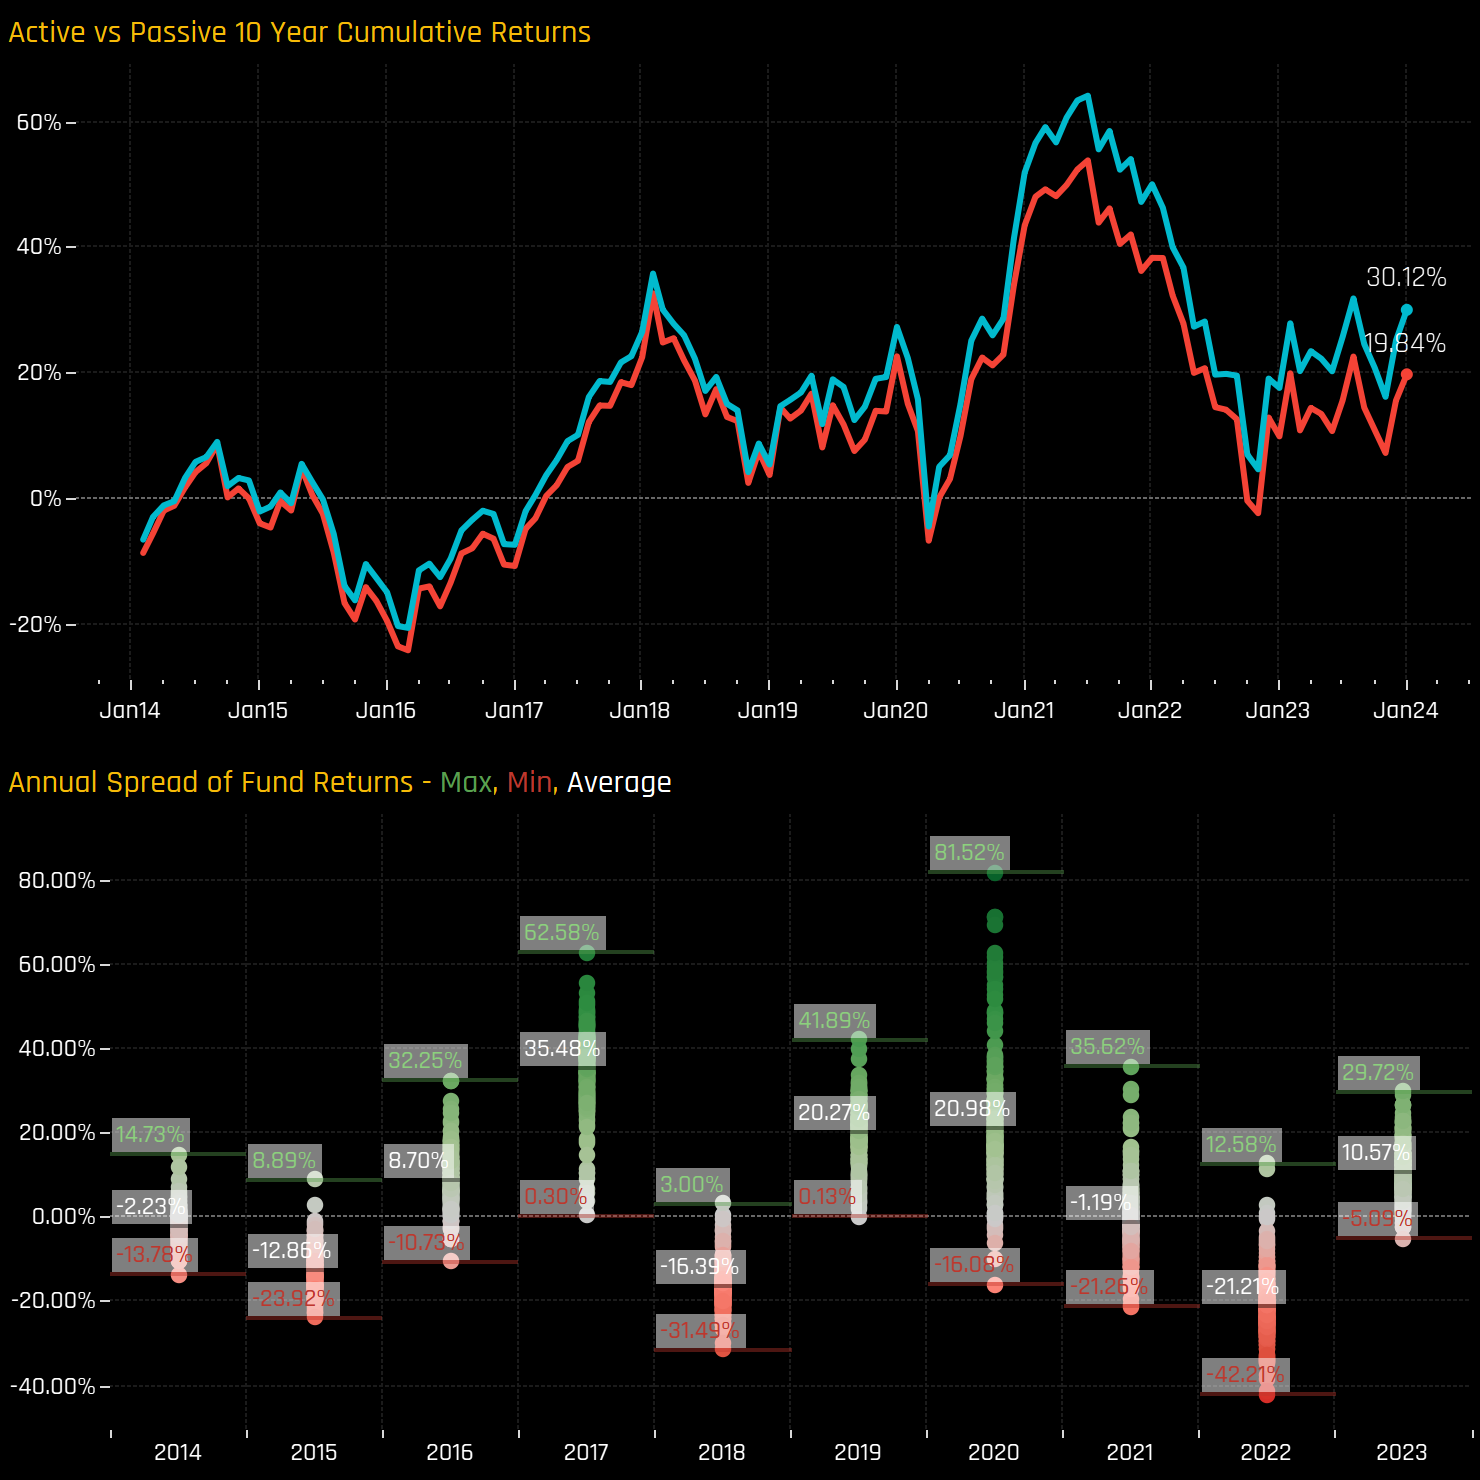
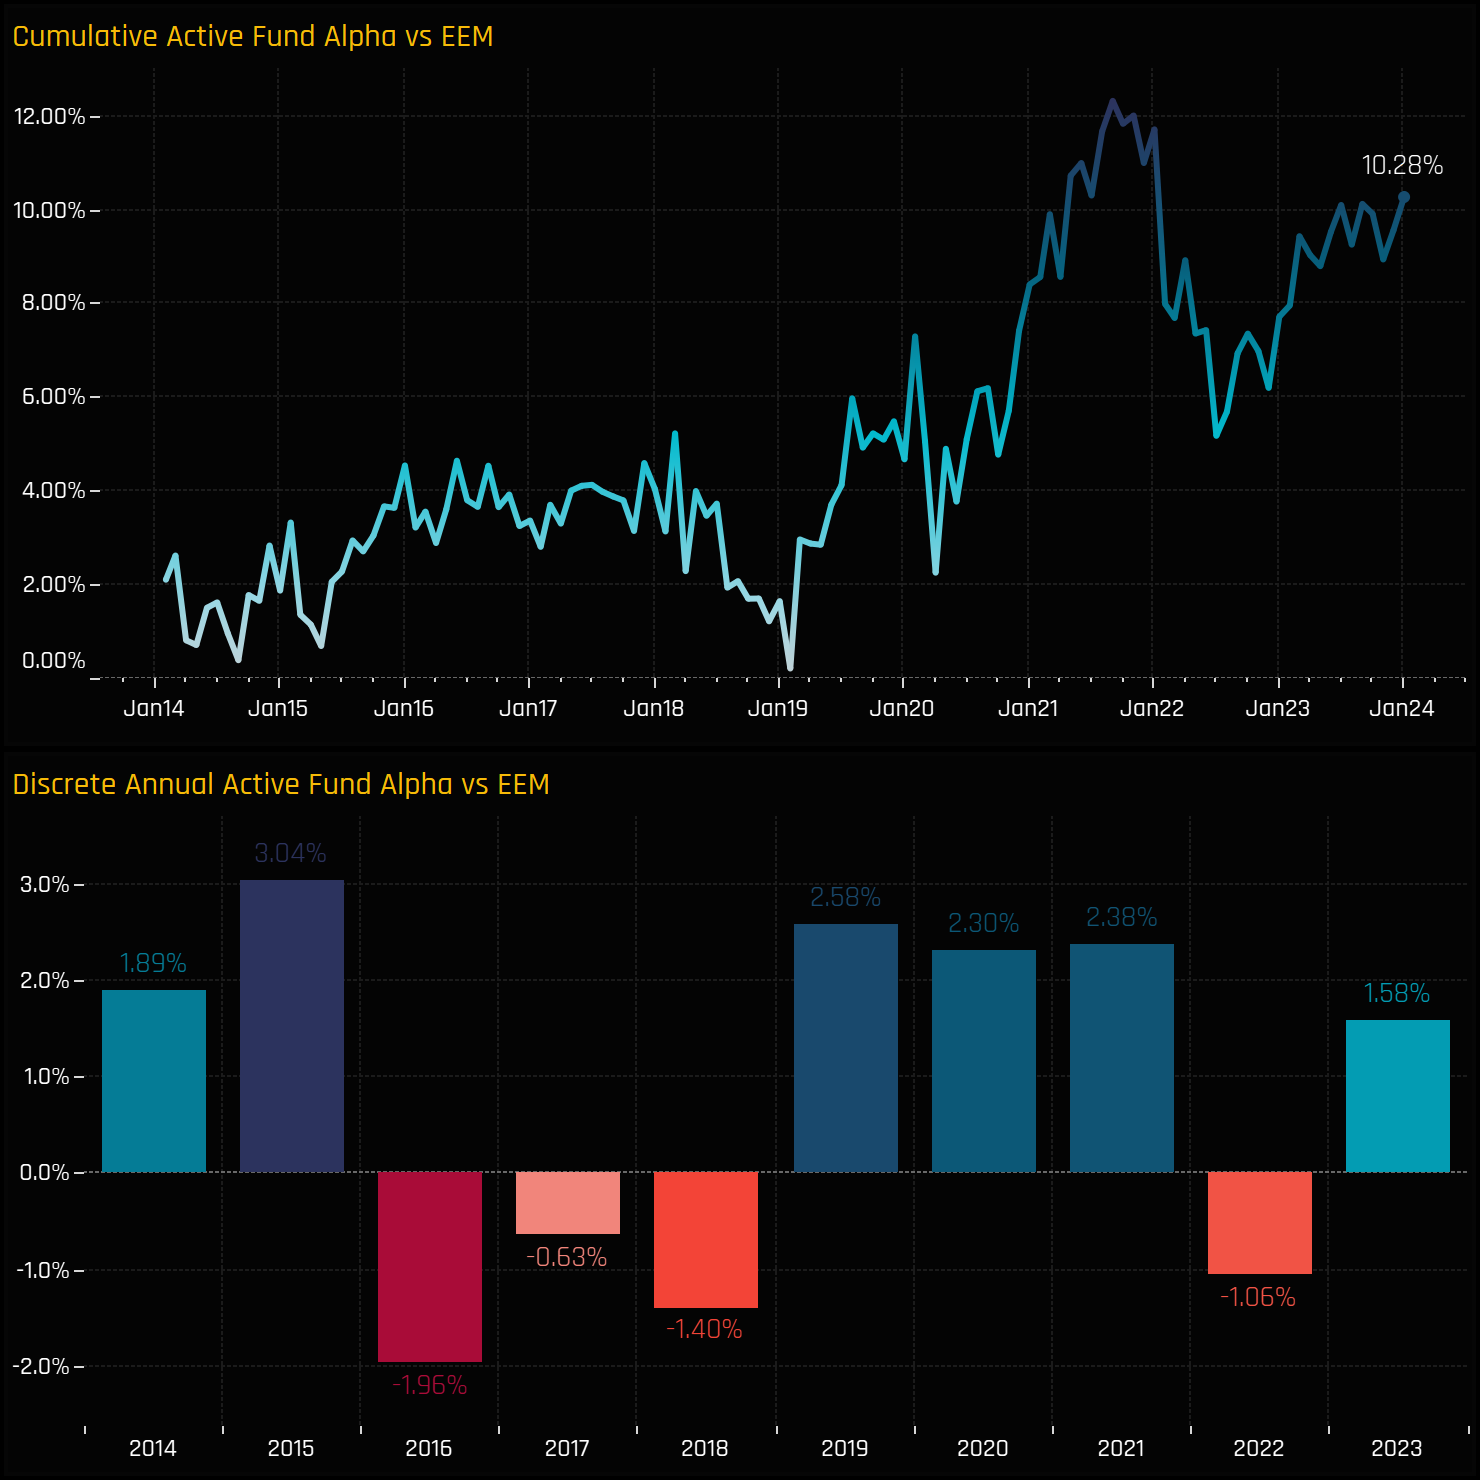
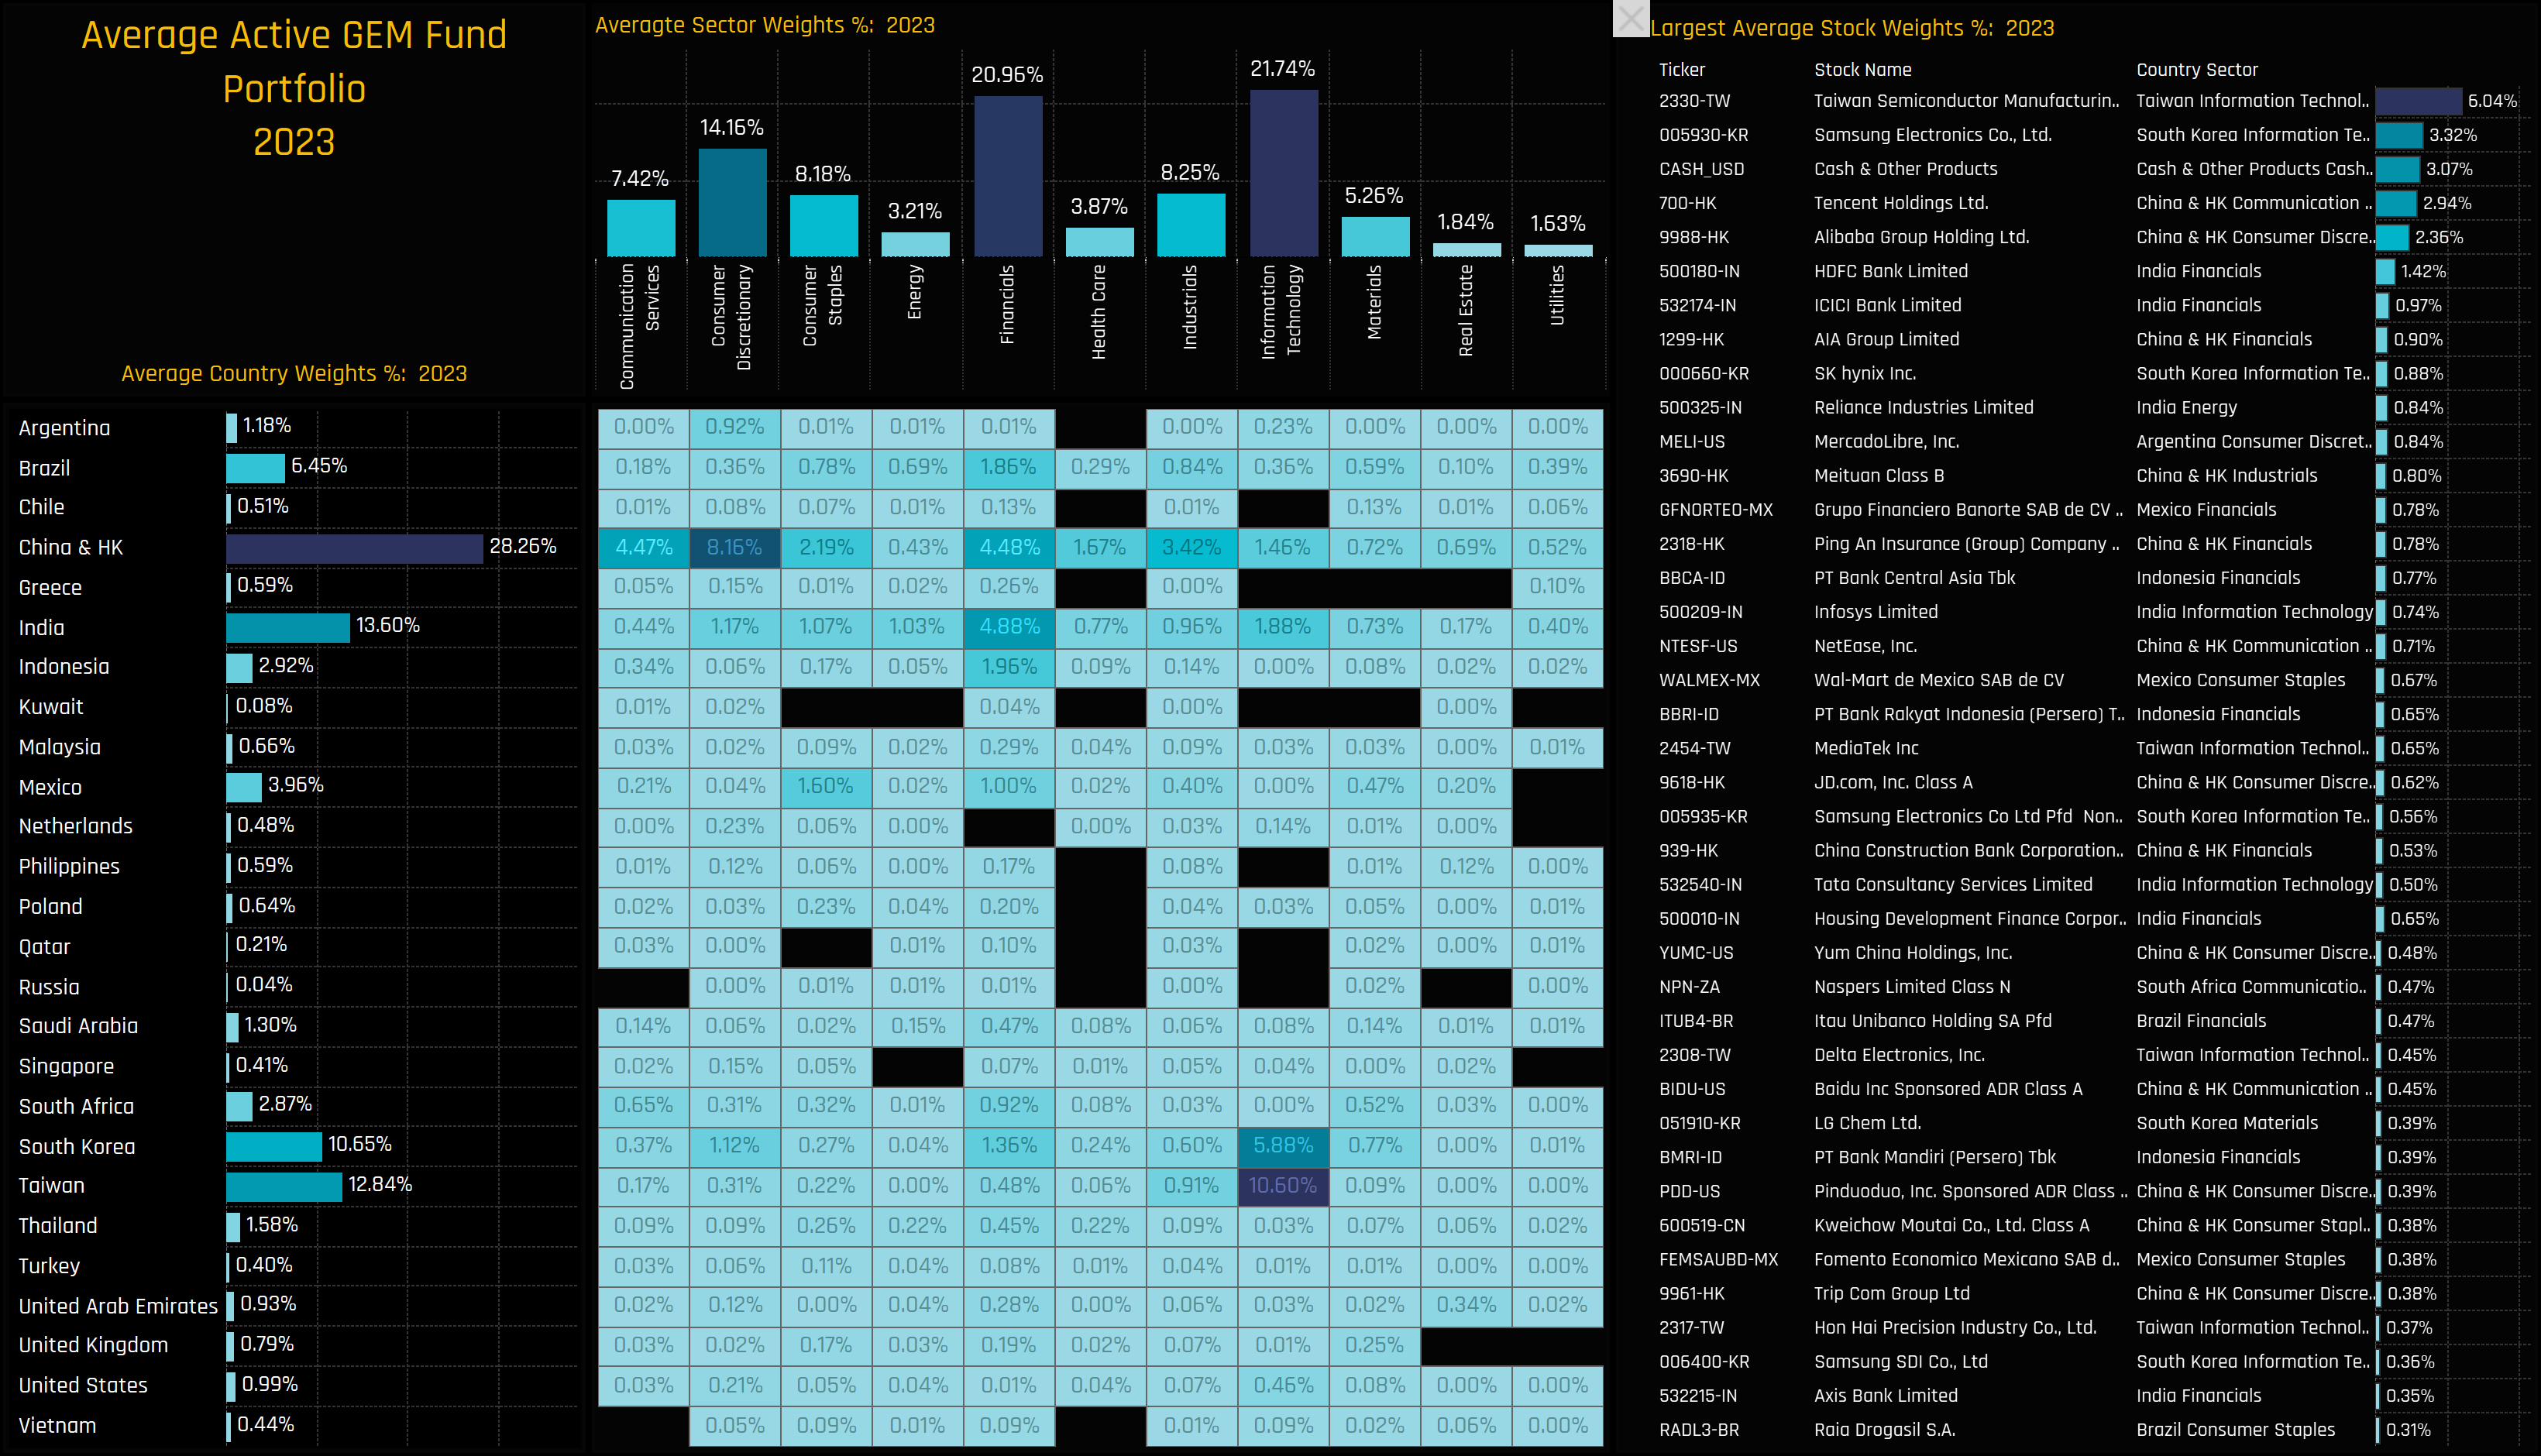
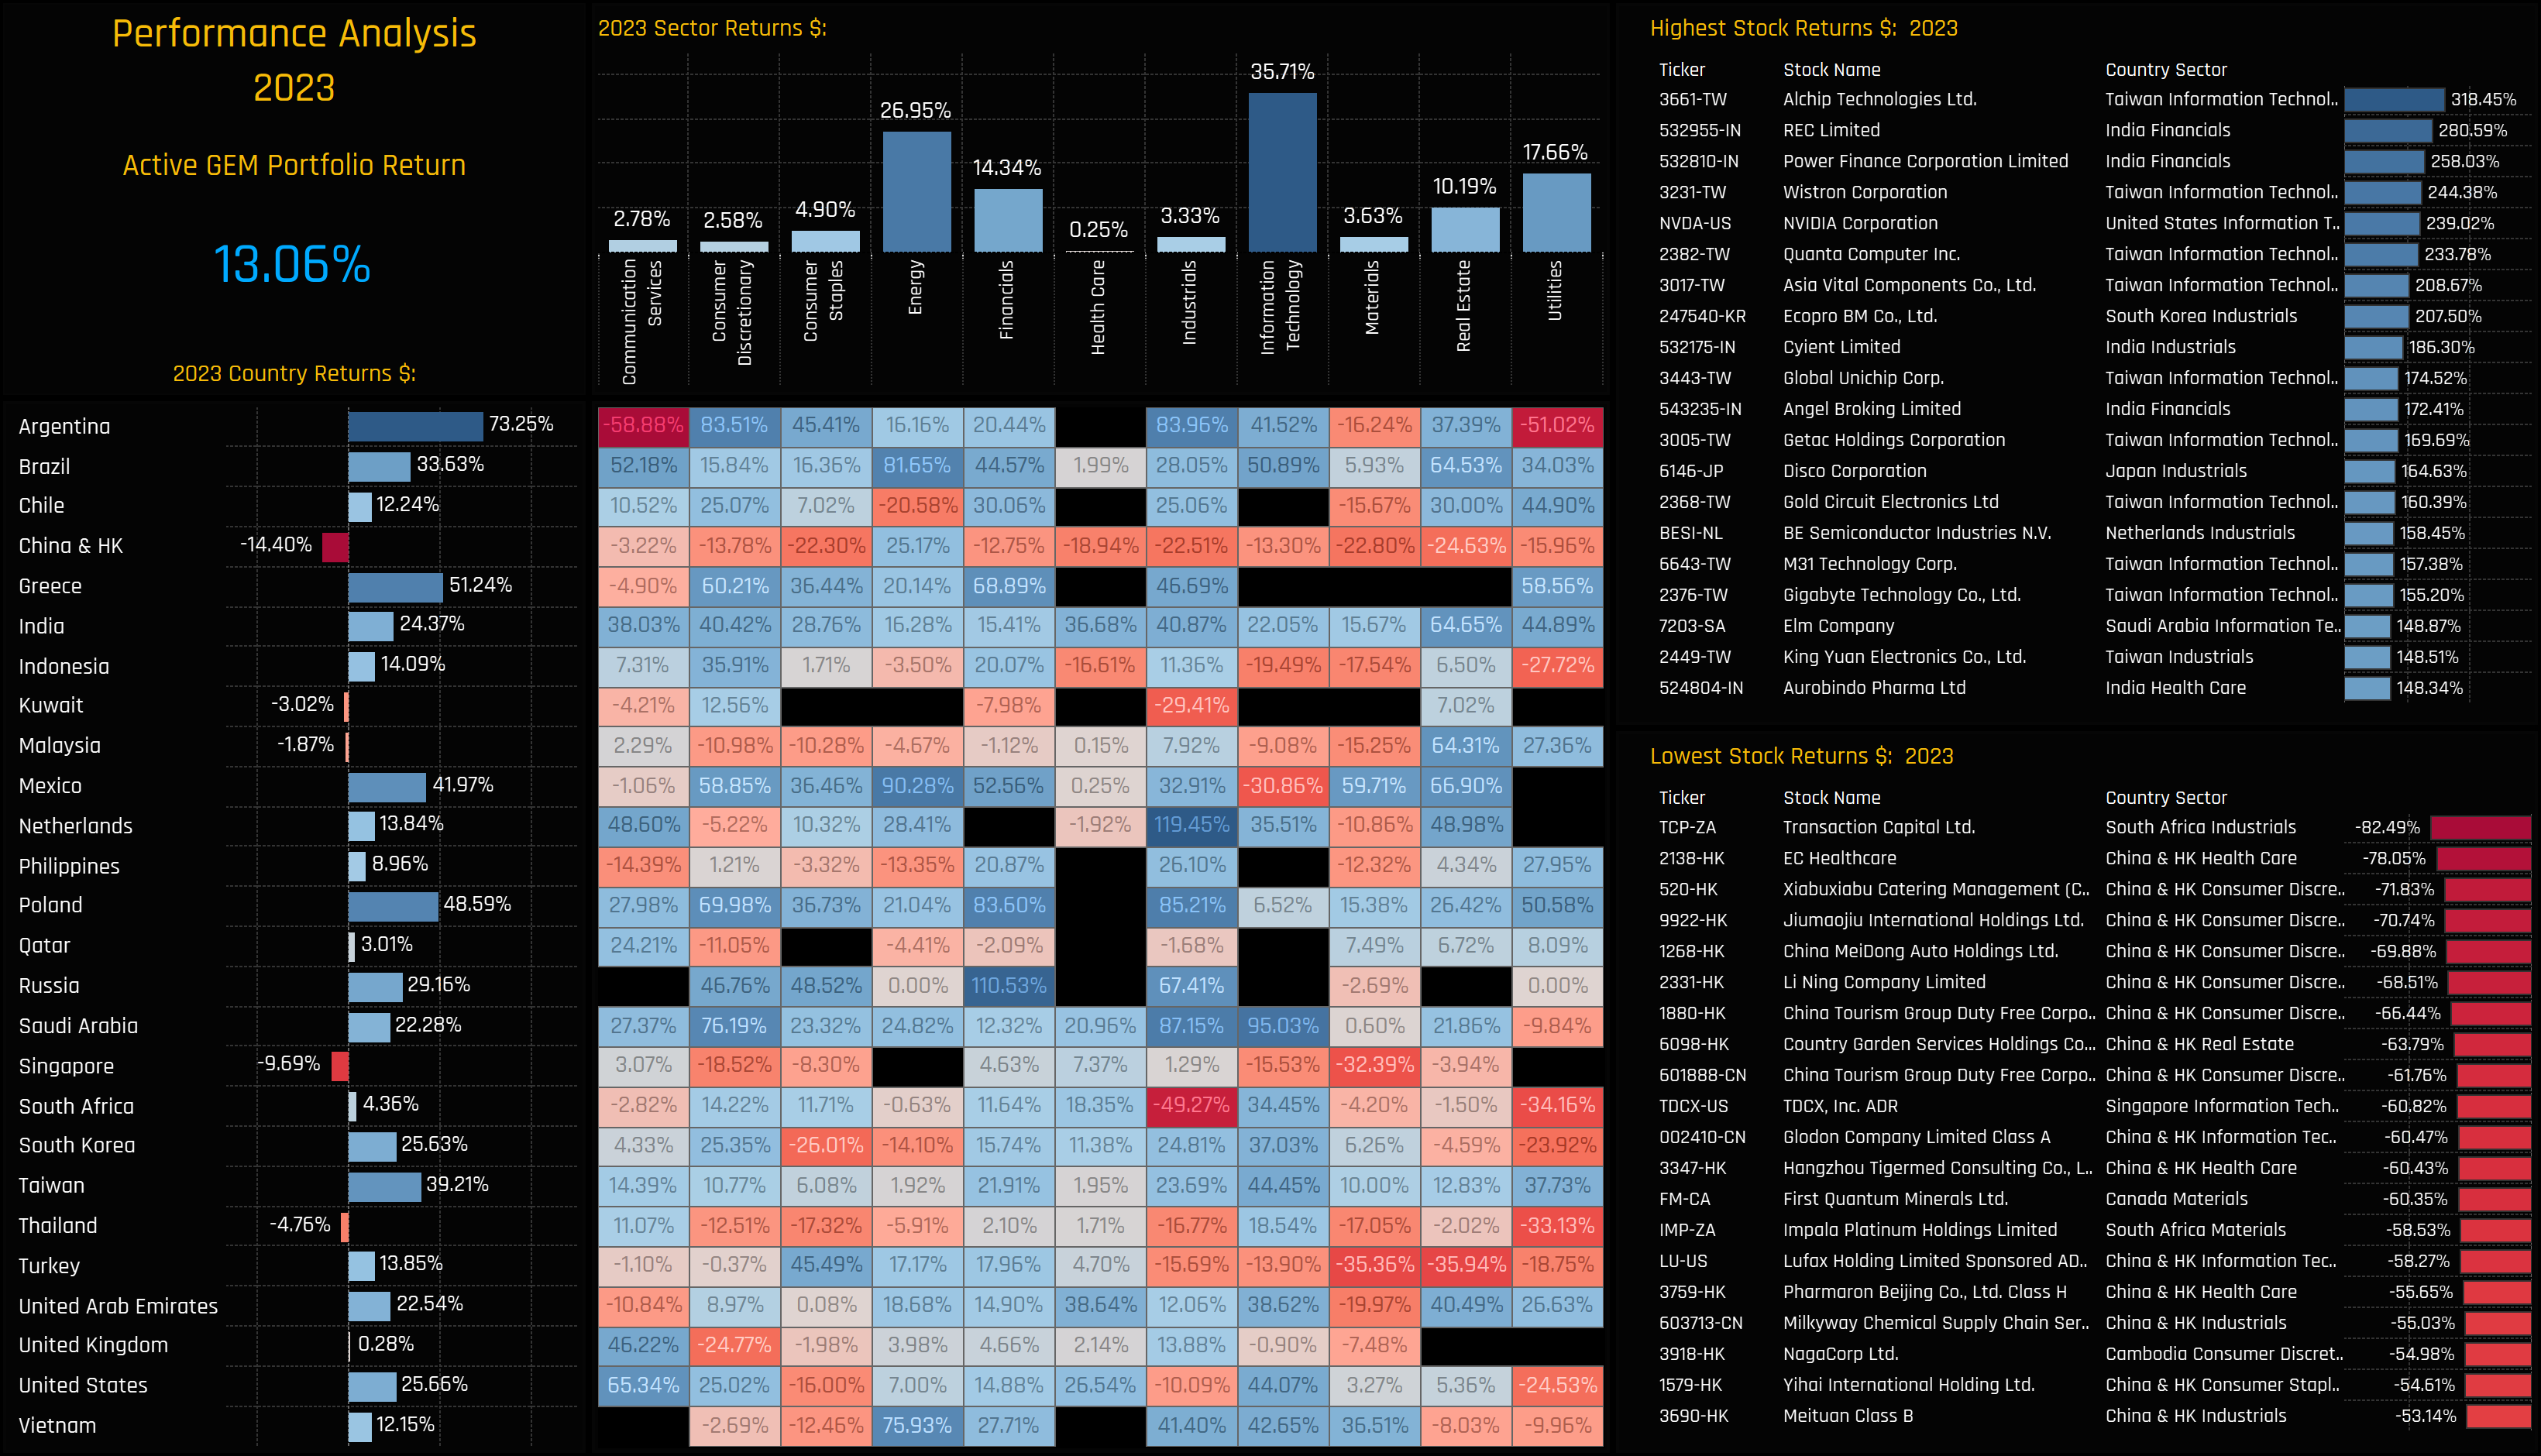
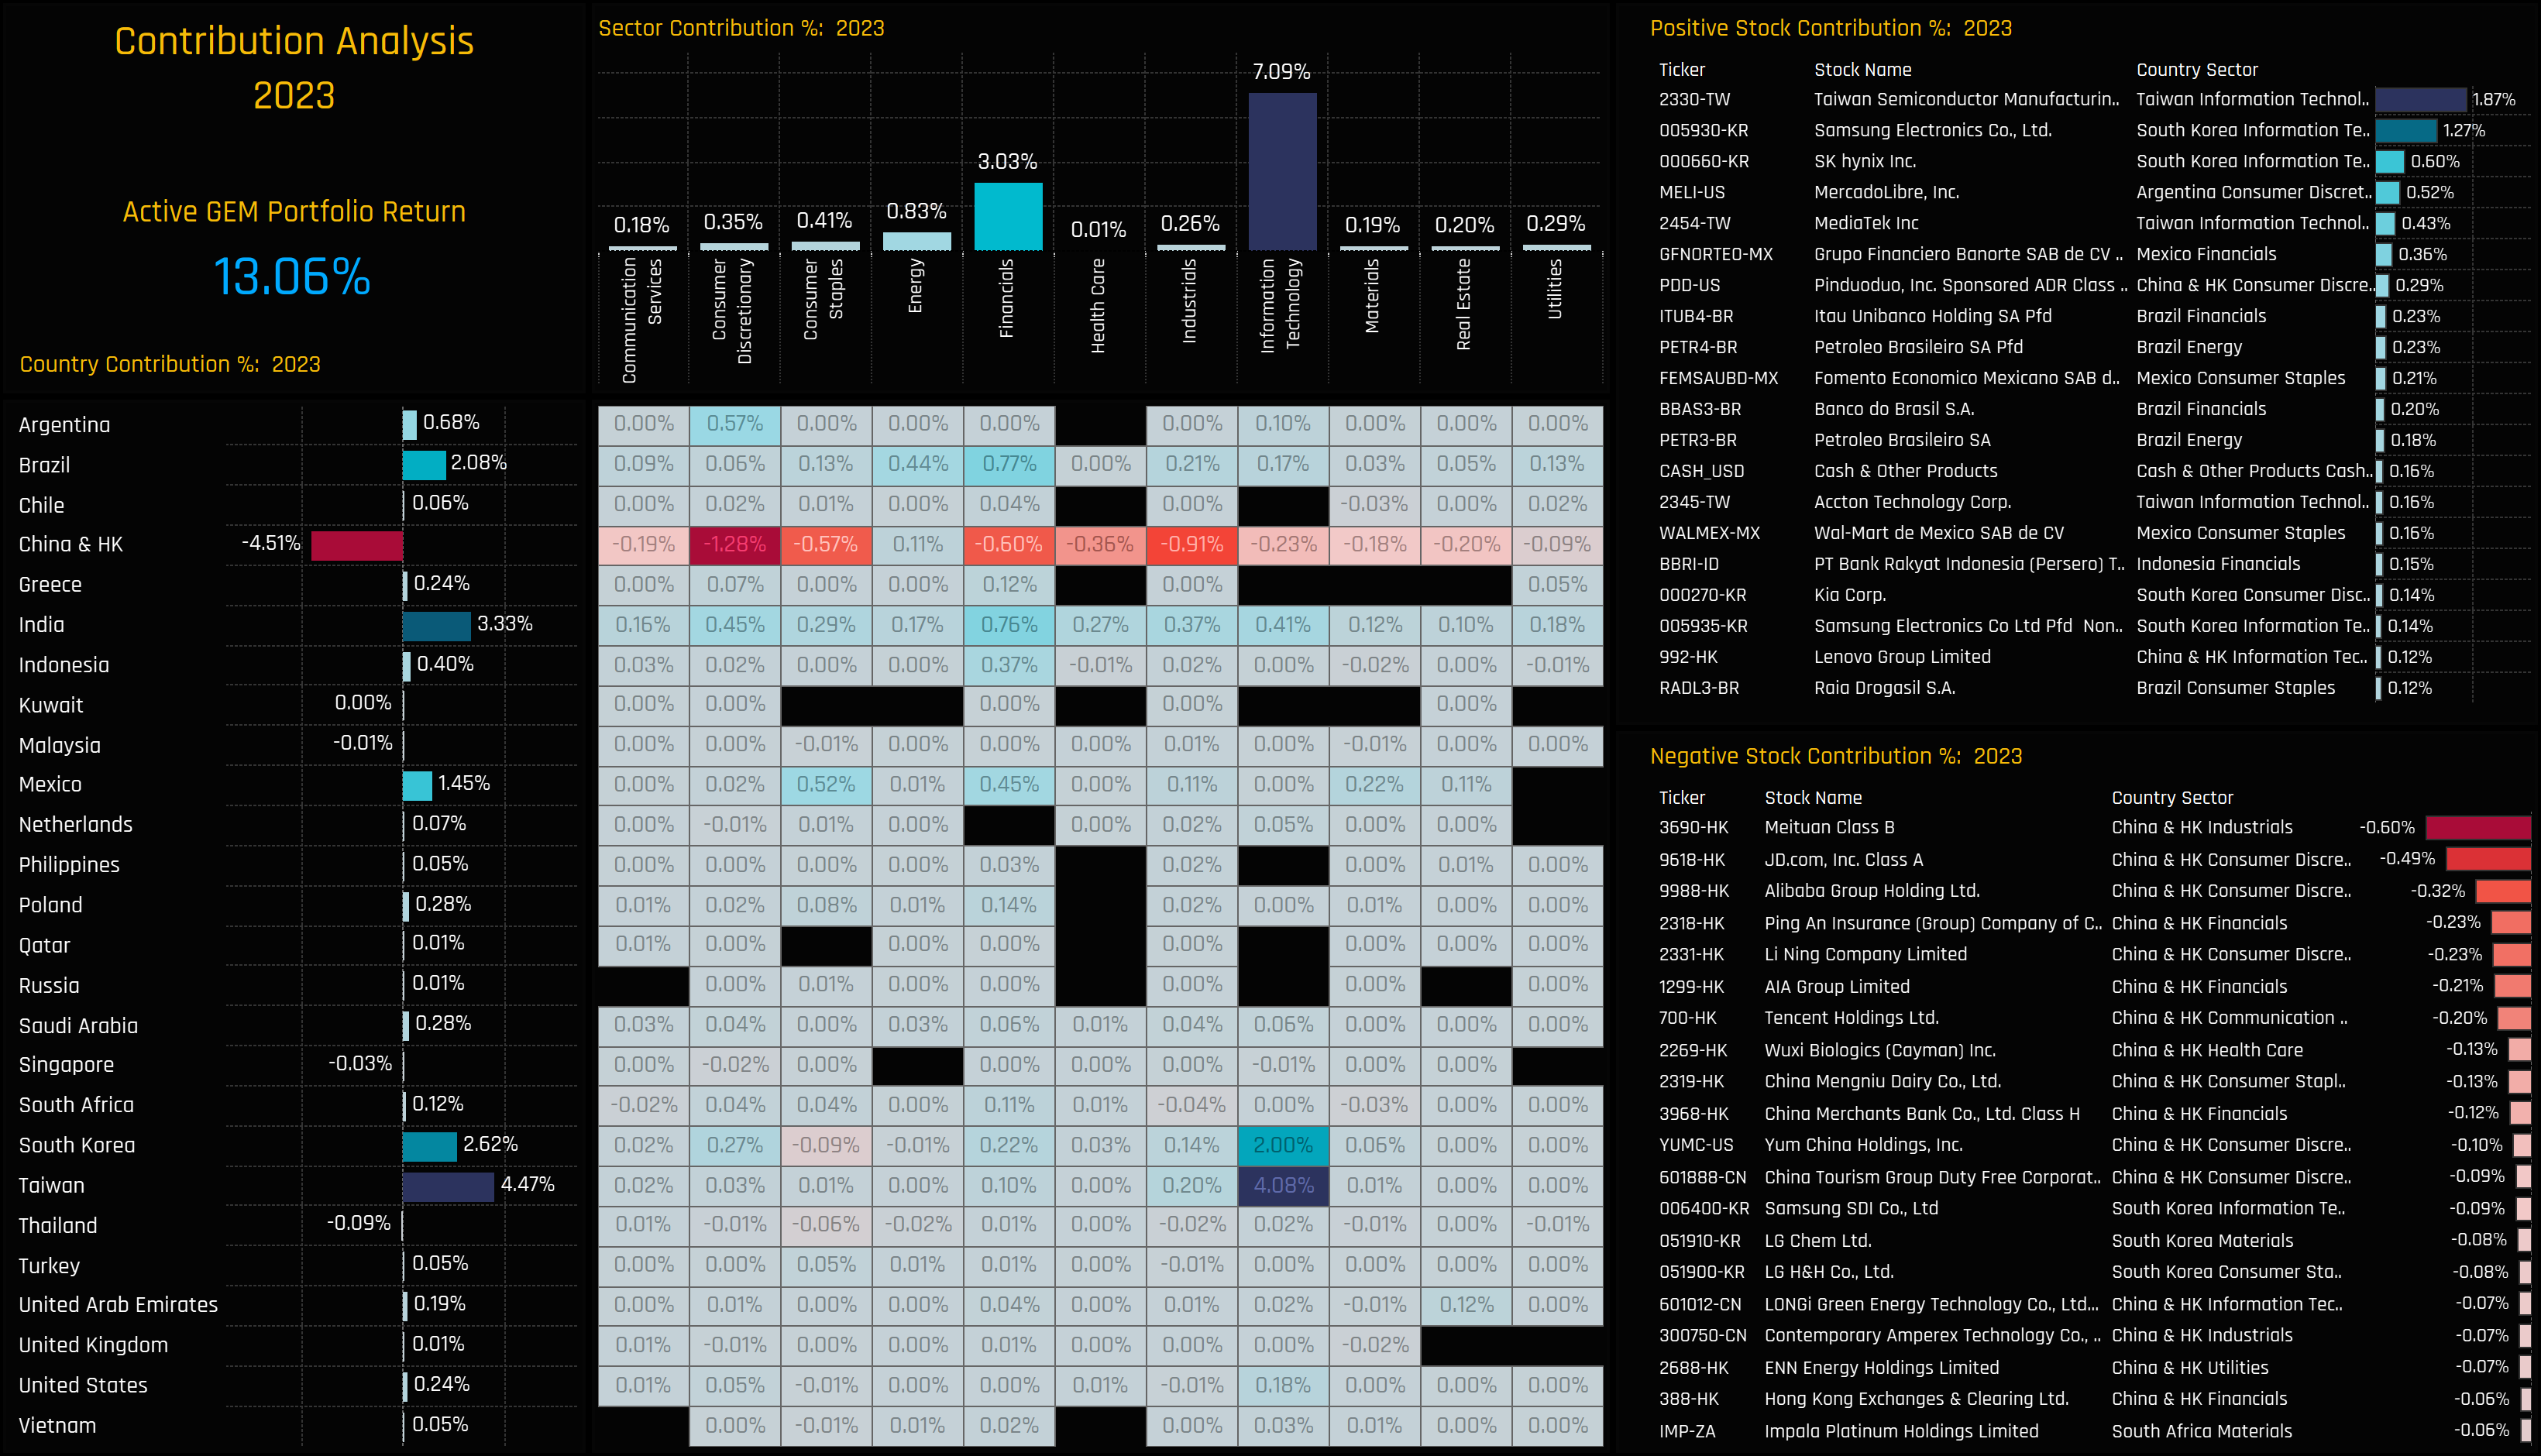
Emerging Market Active Fund Performance & Attribution Review, 2023
- Steve Holden
- 0 Comments
Related Posts


