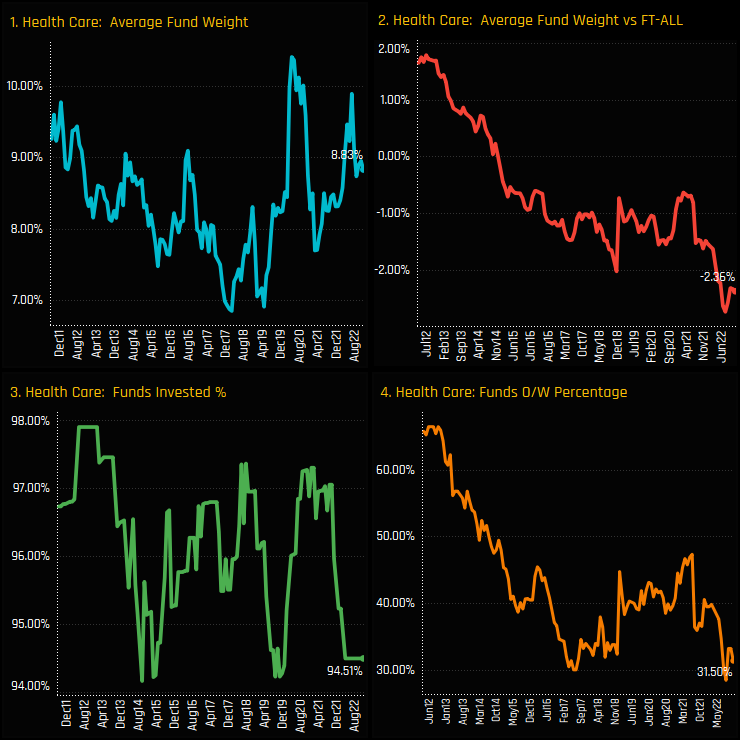
Average holding weights in the UK Health Care sector have stayed within a fairly tight range over the last decade. With the exception of a few brief moments outside, UK active funds have always allocated between 7% and 10% in Health Care stocks, with today’s level of 8.83% towards the higher end of that range (ch1). It is the picture relative to benchmark that is more striking. Chart 2 shows the average active fund weight minus the weight in the SPDRs FTSE UK All Share ETF (cash removed and weights adjusted). It shows a consistent decline over the same period, with today’s underweight of -2.36% near the lowest on record. Chart 4 measures the percentage of funds who are overweight the UK Health Care sector, which has fallen from over 65% in 2011 to just 31.5% today.
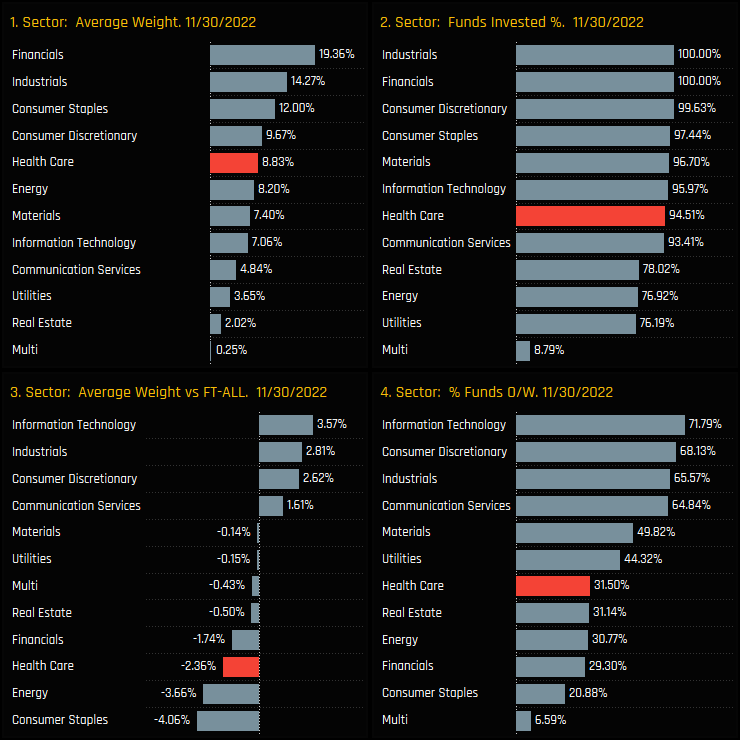
Versus sector peers, Health Care is the 5th largest sector allocation on an average weight basis, well behind the leaders Financials (19.36%) and Industrials (14.27%). It is further down the order in terms of the absolute percentage of funds invested, with 5.5% of managers avoiding UK Health Care completely, versus full investment in Financials and Industrials (ch2). Versus the benchmark, Health Care is now the 3rd largest sector underweight behind Consumer Staples and Energy, offsetting overweights in the Information Technology and Industrials sectors.
Sector Activity and Sentiment
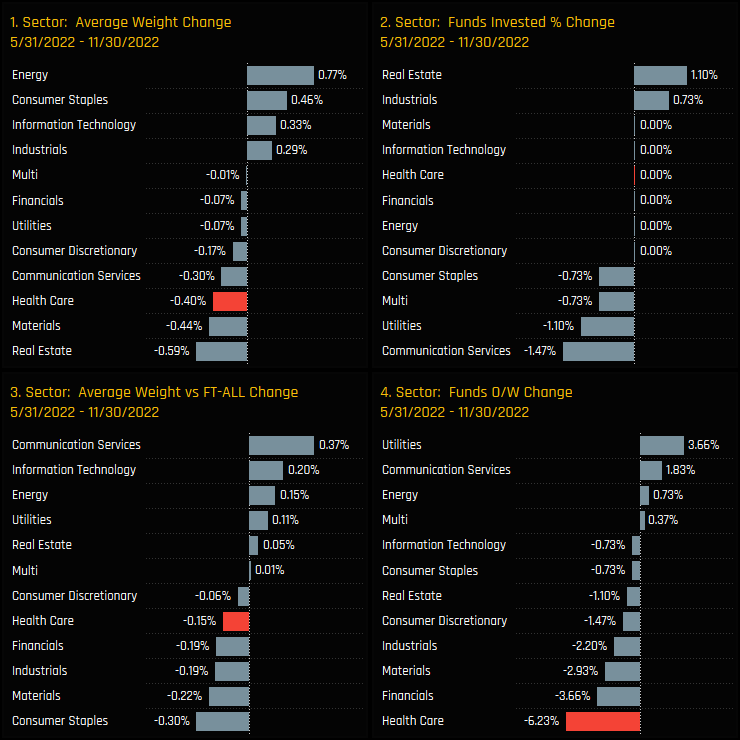
The charts below show the change in our Sector ownership metrics between 05/31/2022 and 11/30/2022. Over this shorter period, Health Care has suffered versus Sector peers, with average fund weights falling by -0.4% (ch1), relative to benchmark weights falling by -0.15% (ch3) and -6.23% of active funds moving from overweight to underweight (ch4).
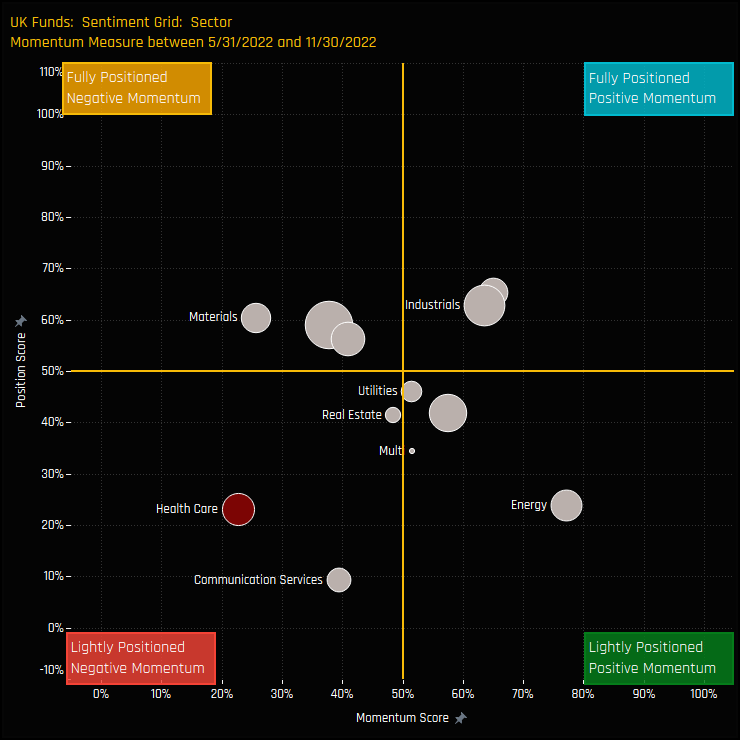
The sentiment grid below shows where current positioning in each sector sits versus its own history going back to 2011 on a scale of 0-100% (y-axis), against a measure of fund activity for each sector between 05/31/2022 and 11/30/2022 (x-axis). Health Care sits in the bottom-left quadrant, with low positioning and negative momentum among managers.
Fund Holdings & Activity
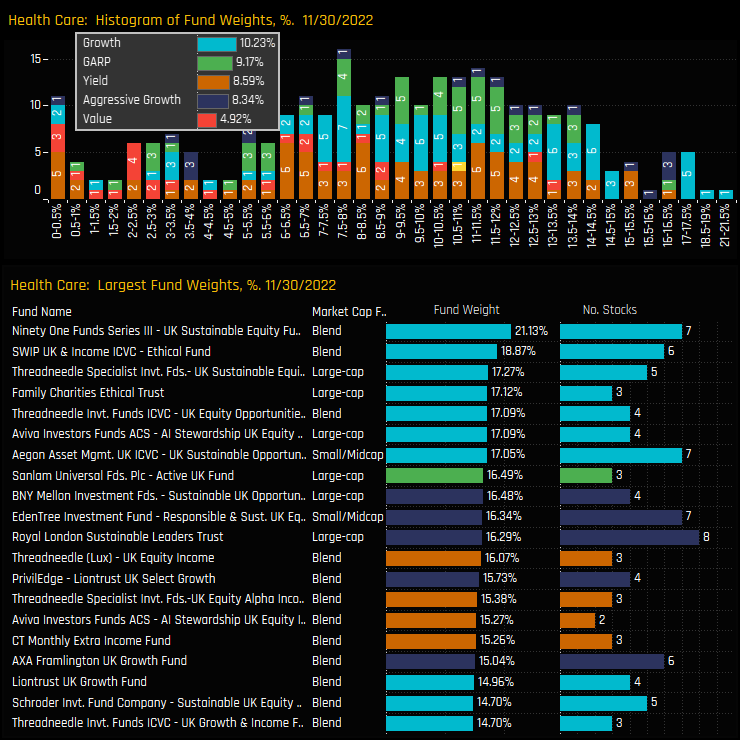
The top chart below shows the distribution of fund weights and the average weights by fund style. The bulk of the distribution in Health Care sits between 6% and 14%, with Value managers allocating significantly less than their Growth counterparts (4.92% vs 10.23%). Top allocators are from the Growth category and led by Ninety One UK Sustainable Equity (21.1%) and SWIP UK Ethical (18.87%).
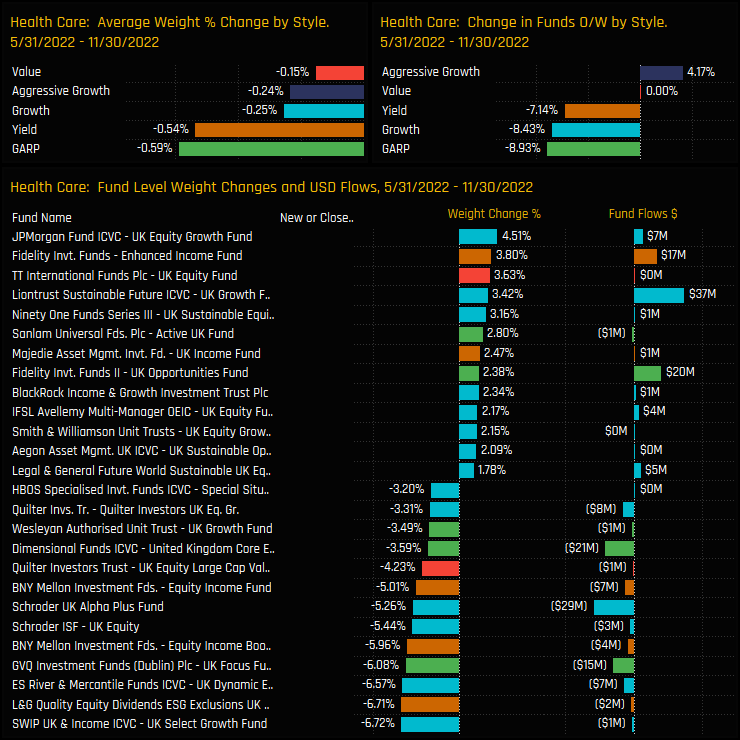
Style level changes over the last 6-months show average weights falling for all categories, though GARP and Yield funds led the way. Though there was buying over the period, largely from the Haleon spin off, the larger of the weight changes were on the sell side, led by SWIP UK Select Growth (-6.72%) and L&G Quality Equity Dividends (-6.71%)
Stock Holdings & Activity
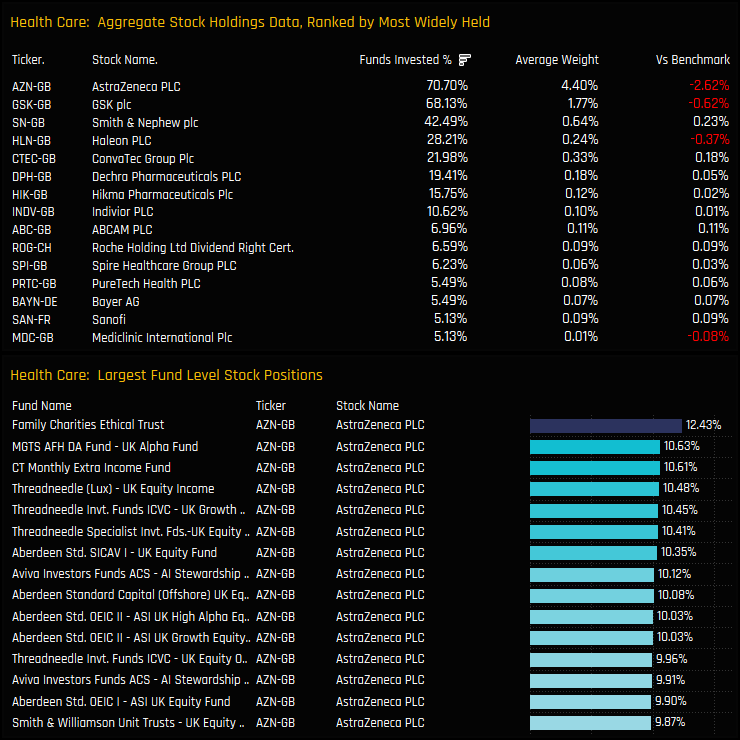
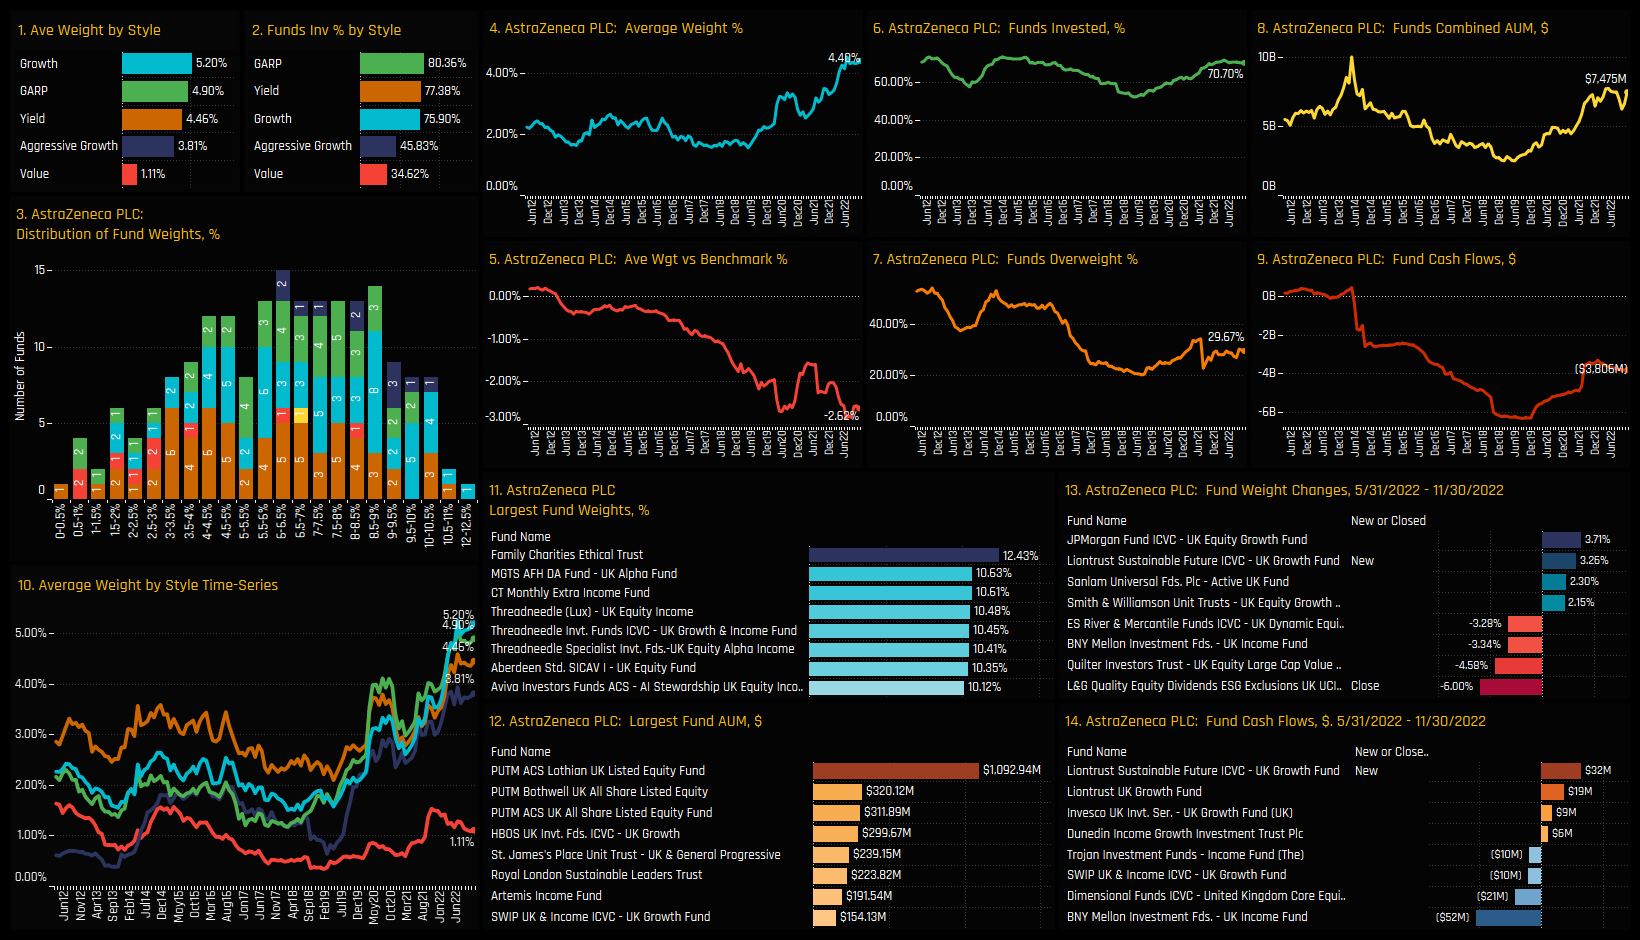
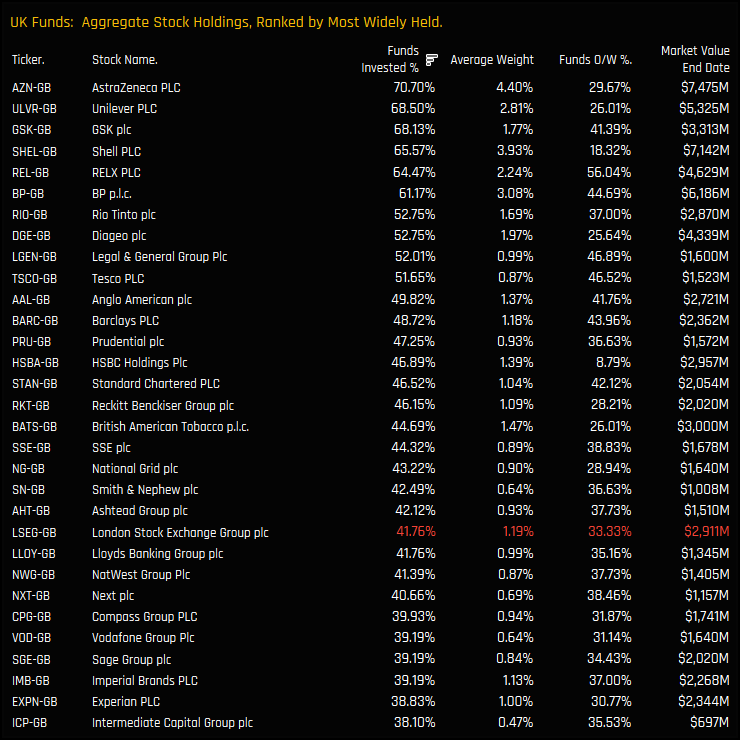
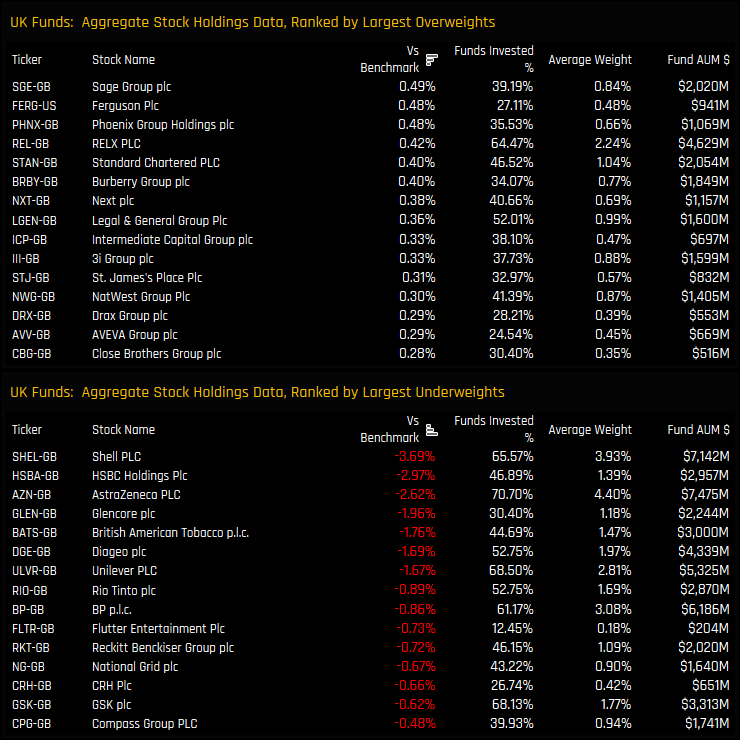
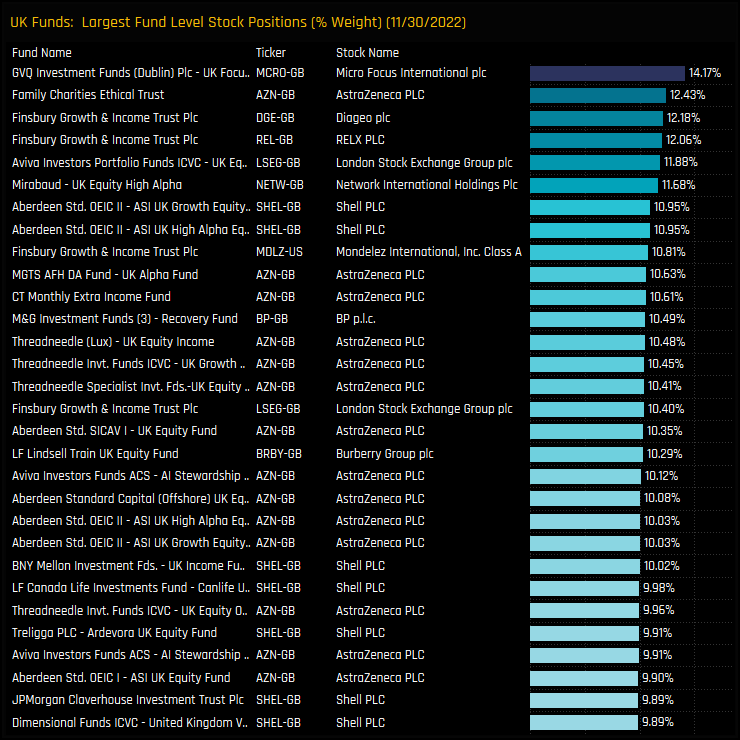
The most widely held stock the UK Health Care sector is AstraZeneca PLC, owned by 70.7% of UK managers at an average weight of 4.4%. It also accounts for all of the largest 100 stock positions in the sector, led by Family Charities Ethical Trust on 12.43%. Yet despite these high levels of conviction, compared to the benchmark FTSE All Share index, AZN represents a key underweight position for active UK managers. In fact, the net underweight of -2.62% accounts for more than the net underweight of -2.36% for the entire Health Care sector. Overweights in Smith & Nephew, ConvaTec Group and out-of-benchmark Sanofi provide the partial offset.
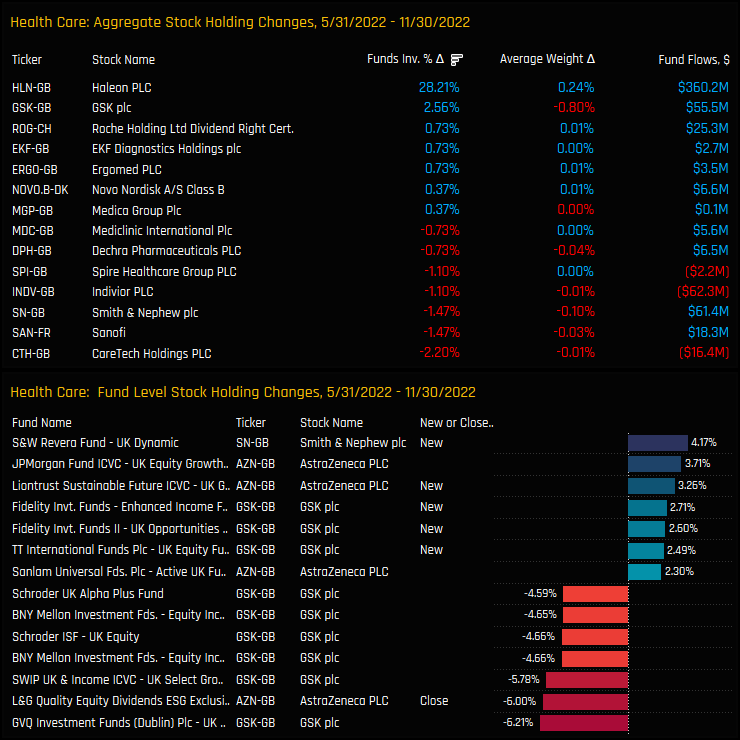
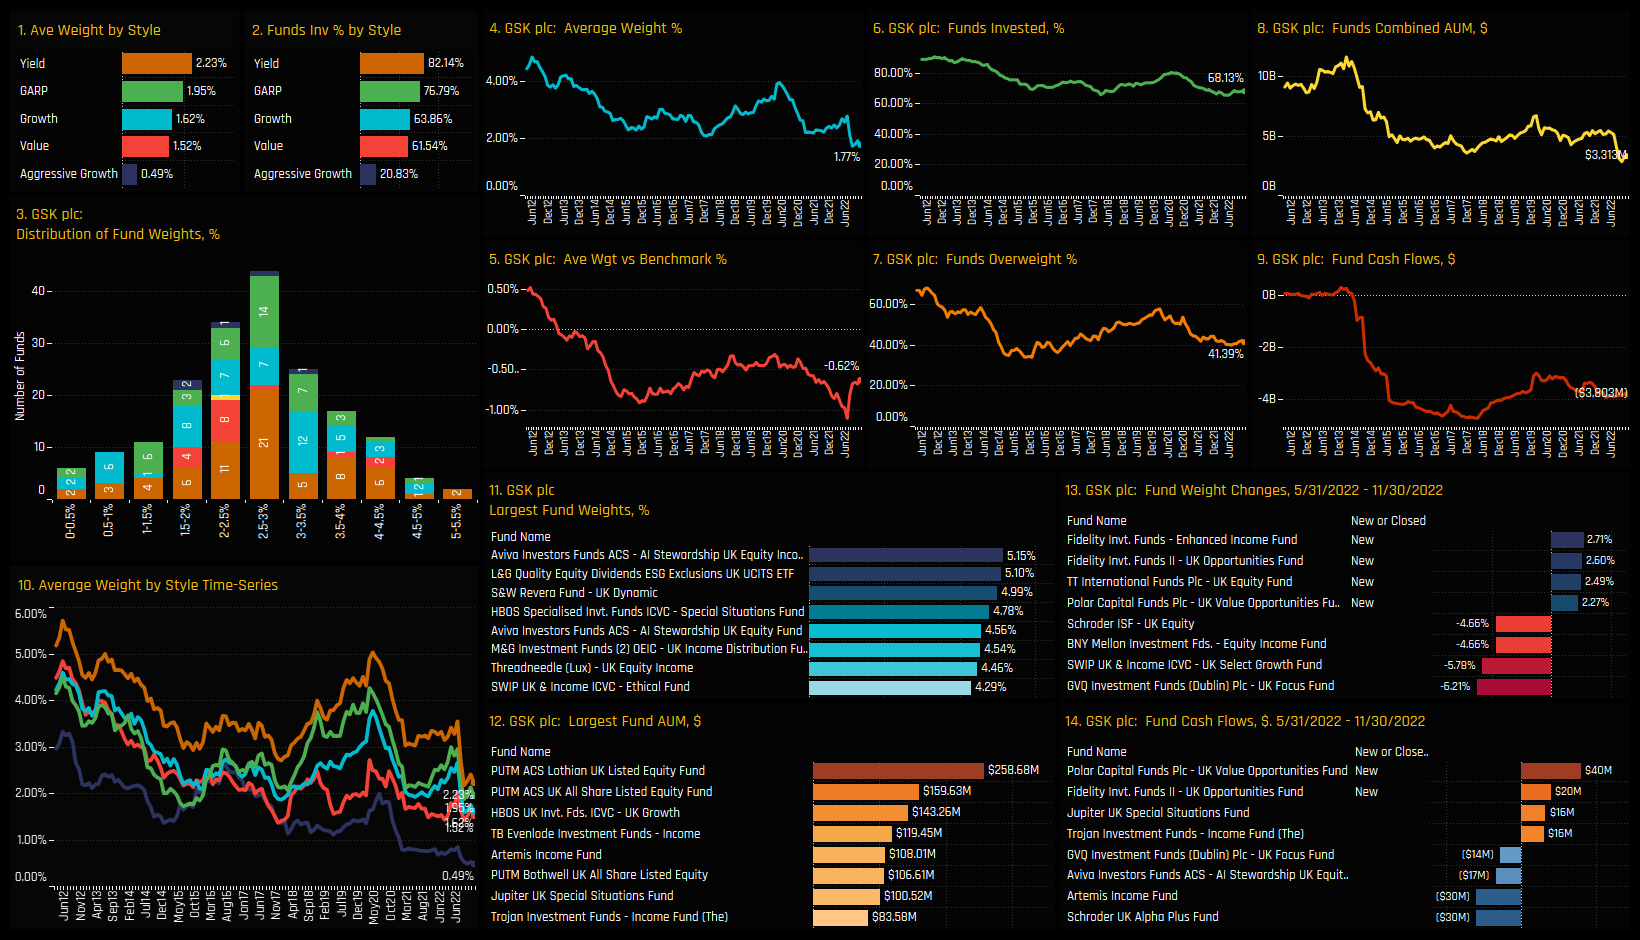
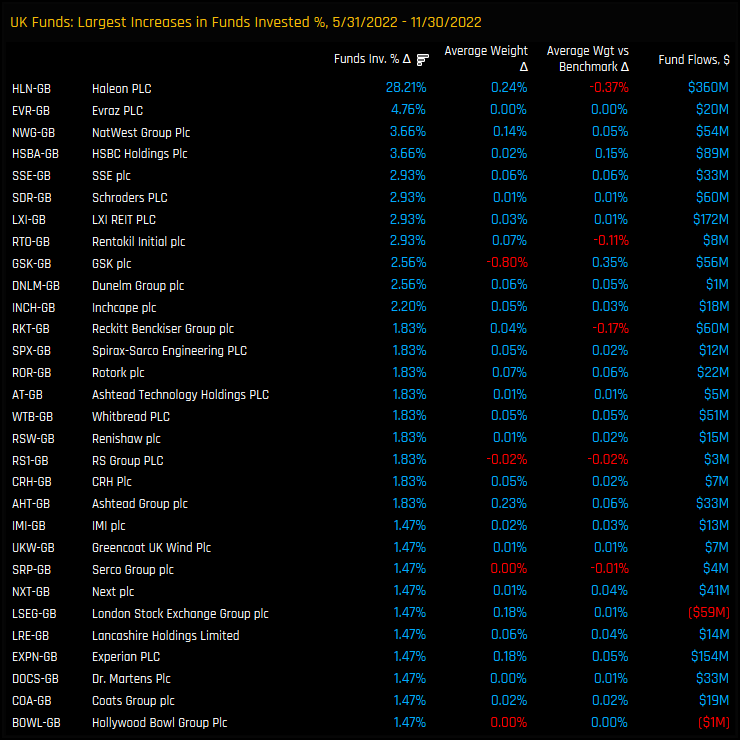
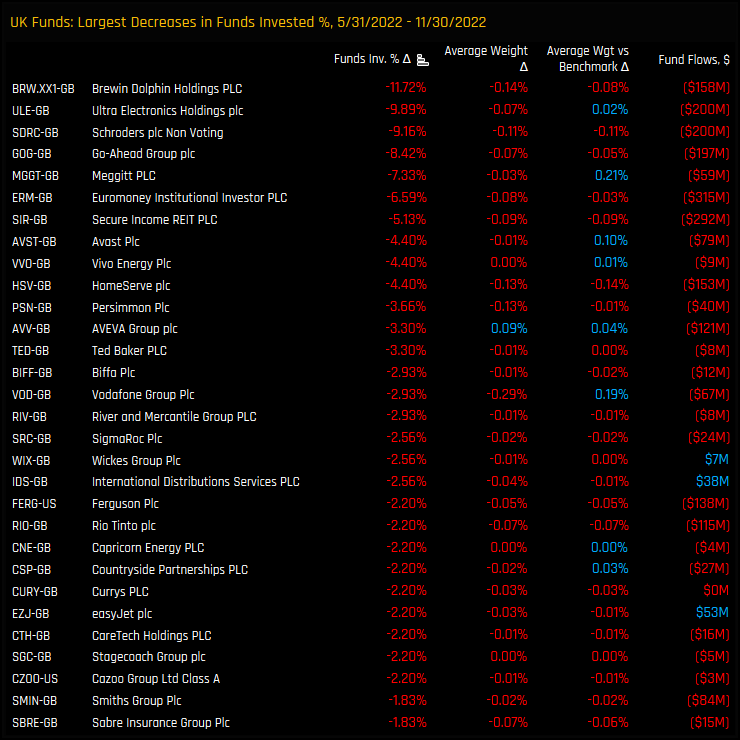
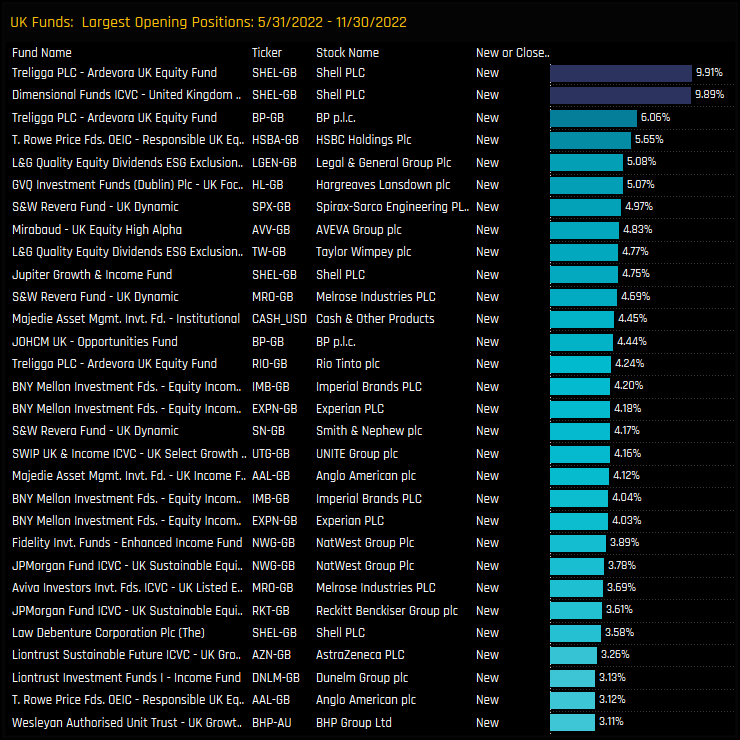
Changes in stock ownership over the last 6-months have been dominated by the Haleon PLC spin off, with 28.2% of the funds in our analysis owning the stock since it’s listing in July this year. On aggregate, GSK ownership increased too, with the percentage of funds invested increasing by +2.56%, whilst ownership fell for CareTech Holdings, Sanofi and Smith & Nephew plc over the period. On an individual fund level, S&W Revera UK Dynamic opened the largest position of +4.17% in Smith & Nephew, in addition to some decent sized adjustments in GSK positioning.
Conclusions & Data Report
Health Care remains a core holding among active UK equity funds. Average weights sit towards the higher-end of the 10-year range at 8.6%, with the majority of funds (94.15%) holding some exposure to the sector.
Relative to the benchmark however, the ownership picture tells a different story. The net underweight in Health Care has drifted lower over the last decade and sits near record lows of -2.36%. Health Care now stands as the 3rd largest underweight risk to UK investors and has been driven by 2 key factors: 1) AstraZeneca positioning and 2) Value Fund positioning.
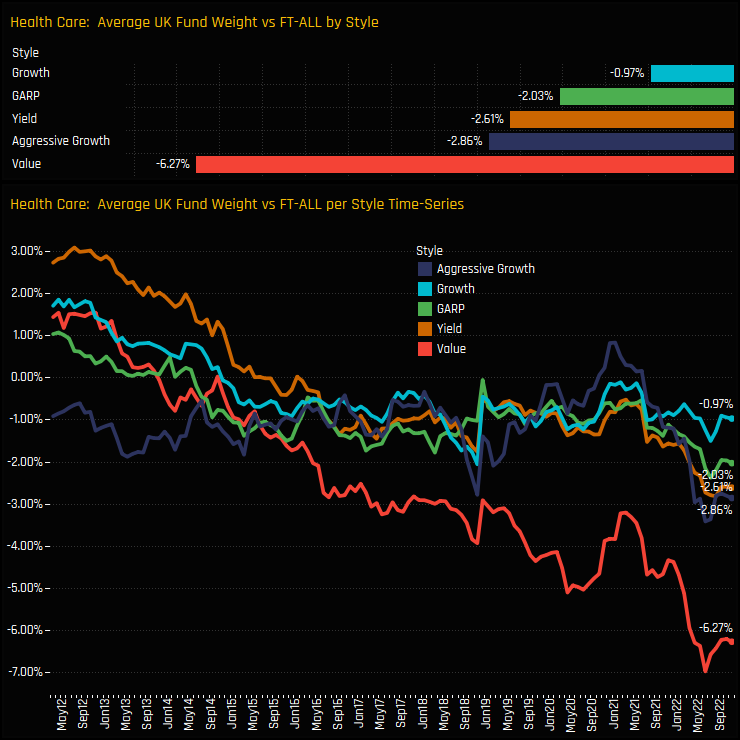
For AstraZeneca, whilst absolute ownership has moved close to record levels, it has failed to keep pace with increases in the FTSE All Share benchmark, with the net underweight of -2.62% near the lowest on record (see stock profile below). Again, Value managers are notable in their absence, with average weights tracking much lower than their Style peers.
The growing Value underweight in the Health Care sector can be seen in the chart opposite. Diverging from all other Style groups in 2015, active UK Value managers are seemingly happy to let underweights increase, with a huge gap of -6.27% versus the FTSE All Share weight. Value managers are banking on some serious underperformance.
Please click on the link below for an extended data report on the Health Care sector among UK active equity funds. Scroll down for ownership profiles on AstraZeneca PLC and GSK PLC and for more analysis on UK fund positioning.
Stock Profile: AstraZeneca
Stock Profile: GSK plc
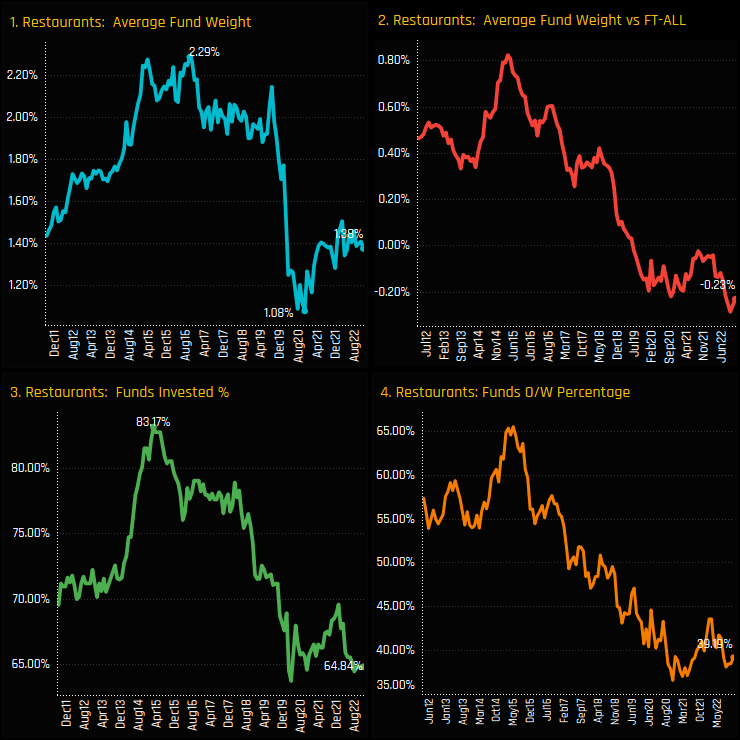
Fund positioning in the UK Restaurant sector remains at depressed levels. Pre-COVID, average weights in the Restaurant sector sat above 2%, but took a heavy dive through 2020 to a low of 1.08% in October of the same year. In truth though, exposure in the Restaurant sector was in decline well before COVID, with peak ownership occurring in early 2015, when 83% of UK active funds held exposure. Despite attempts of a bounce in 2021, ownership levels have declined again in 2022, with 64.8% of funds invested near the lowest levels on record (ch3).
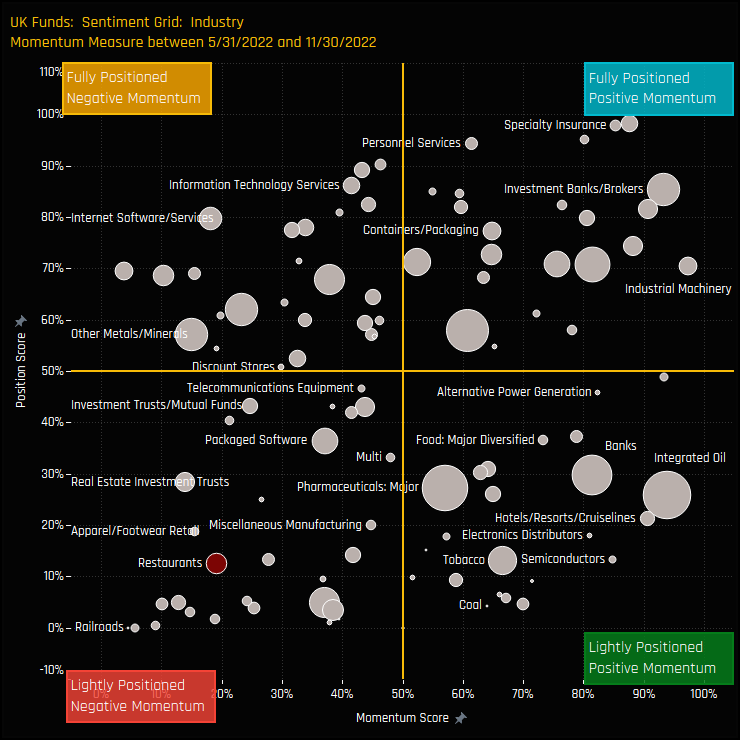
The sentiment grid below highlights this, with low levels of positioning in Restaurant stocks over the last decade coupled with declining levels of ownership over the last 6-months. Instead, UK managers are increasing positioning in Banks, Integrated Oil and Industrial Machinery, whilst holding near record exposure to Insurance and Investment Bank/Brokers. Sentiment in Restaurant stocks is among the worst of all Industry groups in the UK.
Fund Activity, Style & Positioning
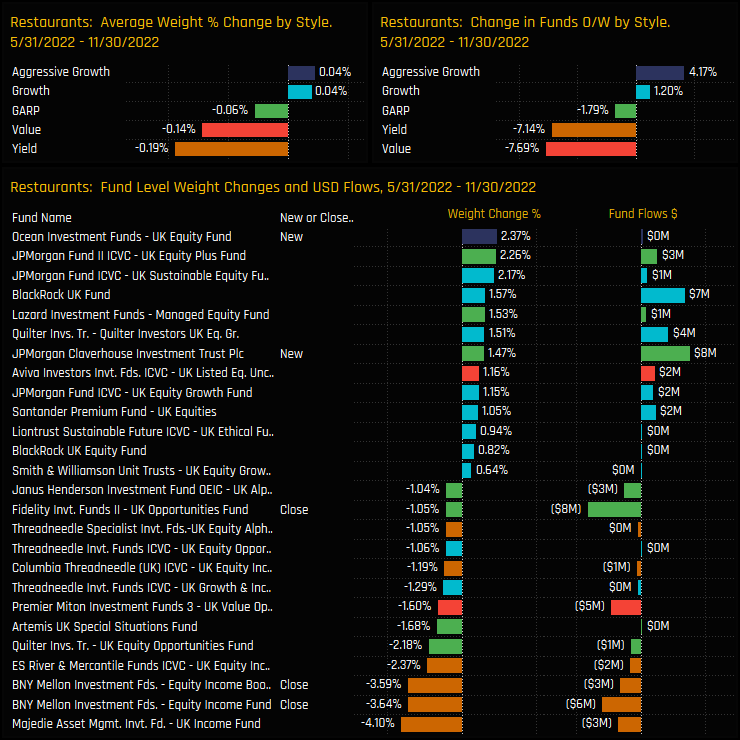
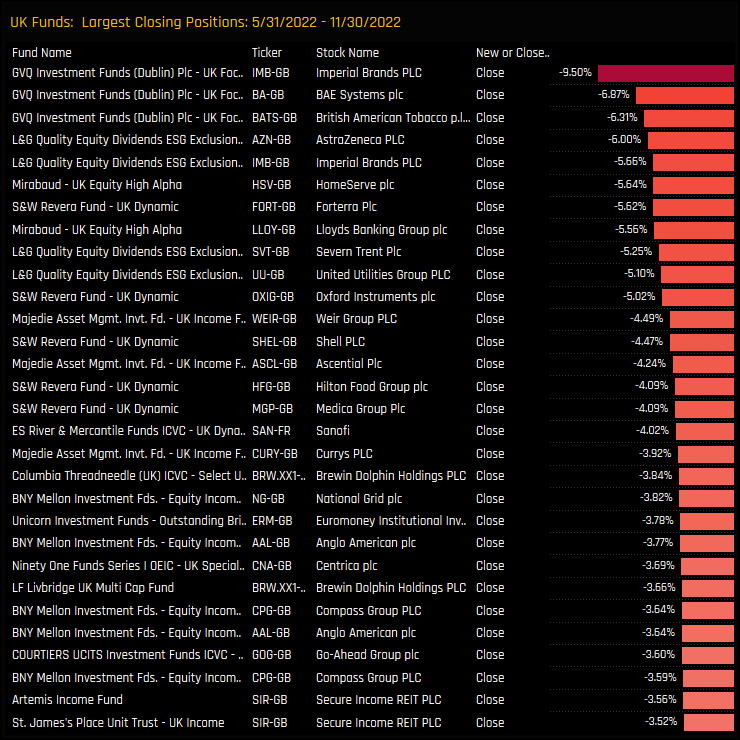
On a Fund Style basis, these decreases were led by Yield and Value managers, with average weights falling and an excess of funds moving to underweight over the last 6-months. Yield managers also make up the larger fund level decreases, with Majedie UK Income reducing weights by -4.1% and BNY Mellon Equity Income closing their 3.64% position. On the positive side, Growth and Aggressive Growth funds saw a moderate uptick in exposure.
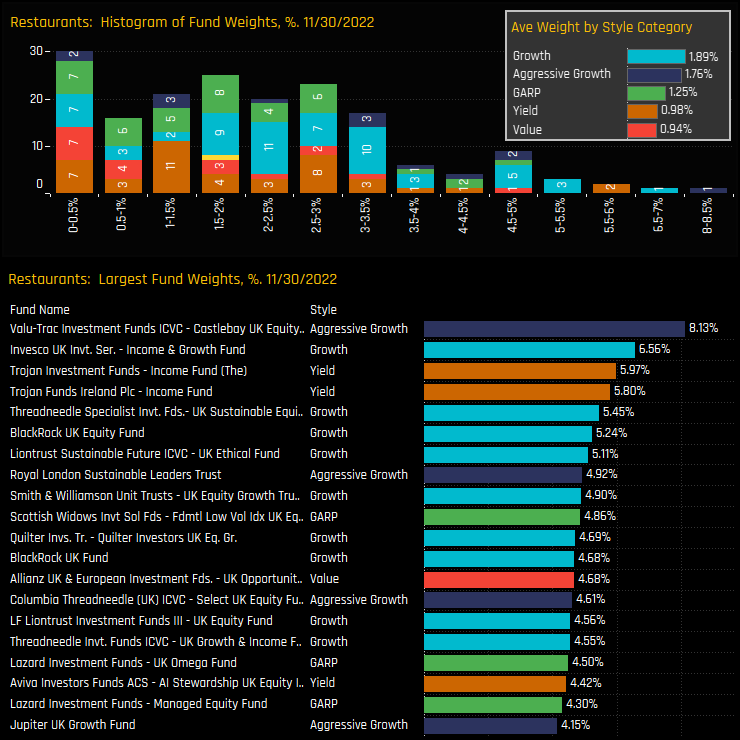
This leaves the Restaurant industry group as a minor allocation for the majority. Of the 64% of managers who do hold a position, most hold less than a 3.5% weight. There is a right-sided tail to the holdings distribution, with Castlebay UK Equity holding an 8.13% weight and Invesco UK Income & Growth a 6.6% weight. Again, Growth and Aggressive Growth investors are more heavily allocated than their Value/Yield peers.
Stock Holdings & Activity
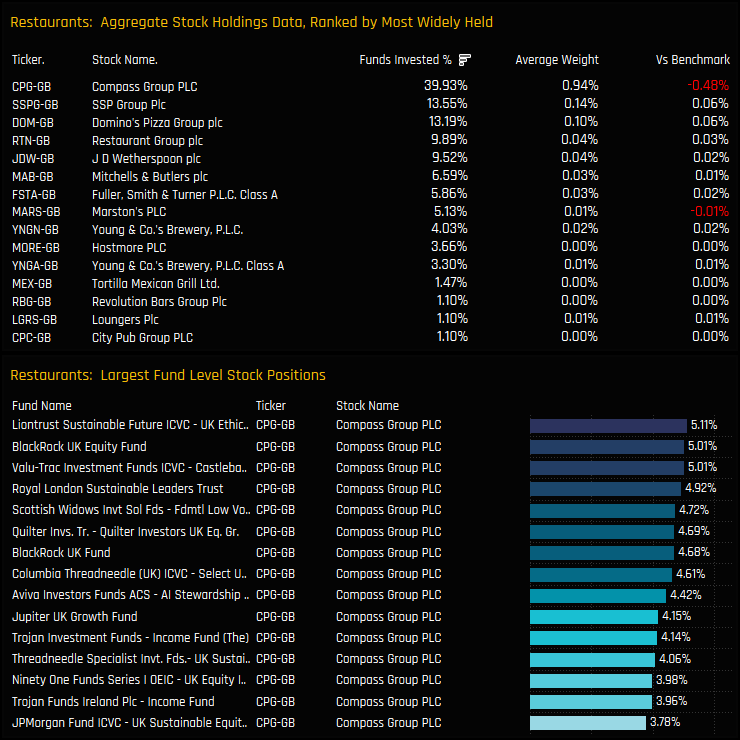
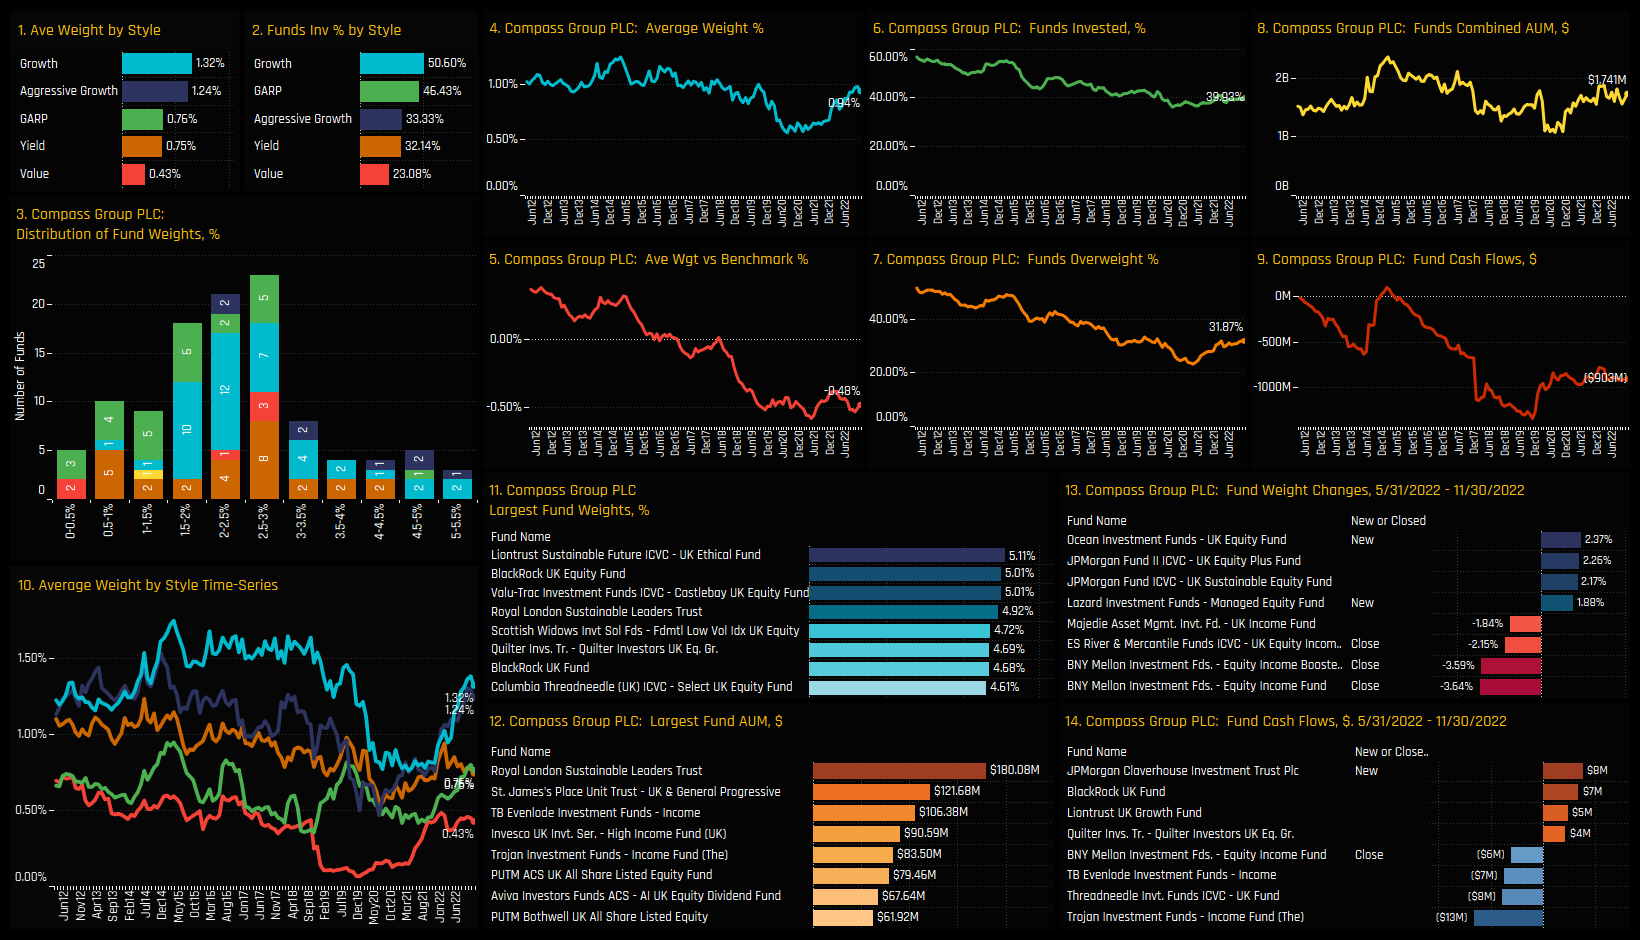
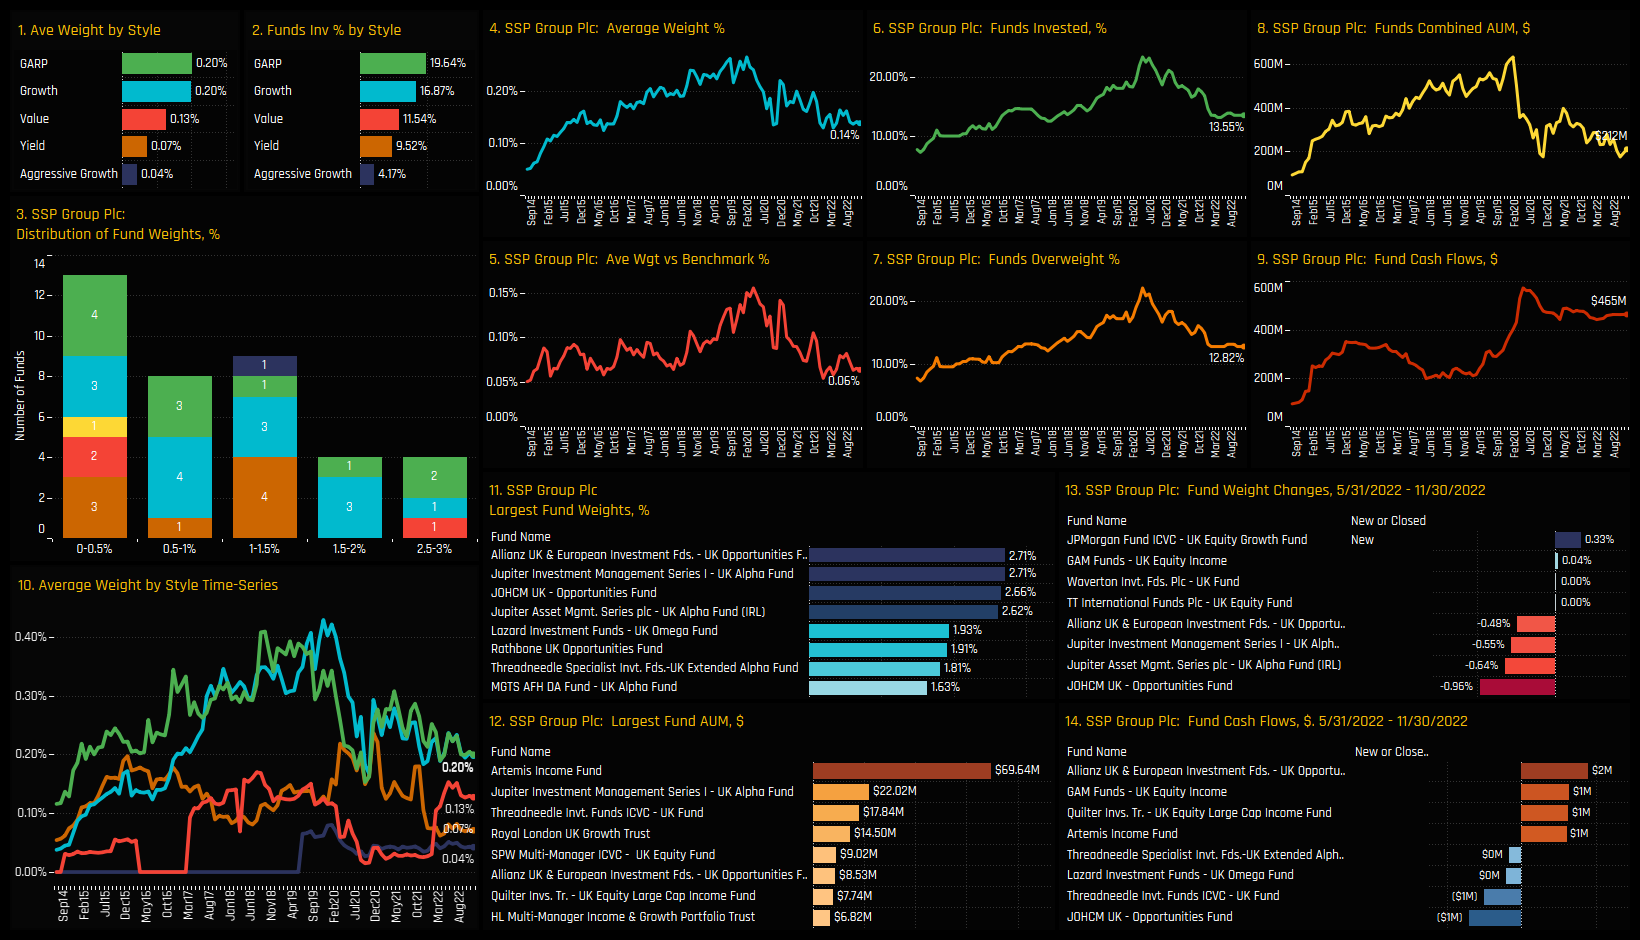
On a stock level, Compass Group is the dominant holding by a distance, owned by 39.9% of funds at an average weight of 0.94%. It dominates the list of high conviction holdings, led by Liontrust UK Ethical (5.1%) and BlackRock UK Equity (5.01%). SSP Group and Dominos Pizza share similar ownership profiles among UK managers, but after that, no other stocks in the sector are owned by more than 10% of managers.
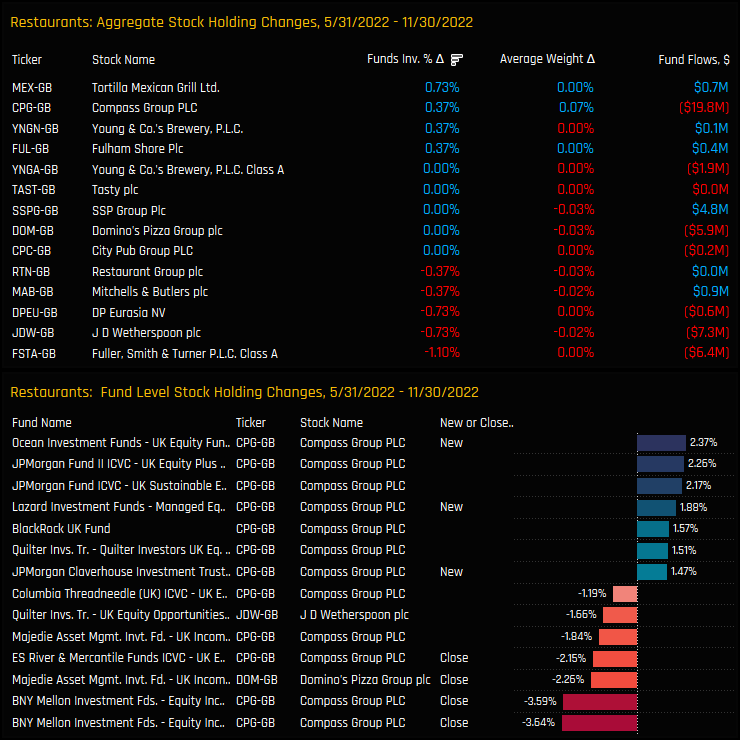
Over the last 6-months, activity within the sector has been muted but skewed to the sell side. Moderate upticks in ownership for Tortilla Mexican Grill and Compass Group were offset by net closures in Fuller, Smith & Turner and J D Wetherspoon. Most of the major activity was in Compass Group, with openings by Ocean UK Equity (+2.37%) and Lazard Managed Equity (+1.88%) offset by closures from BNY Mellon Equity Dividend (-3.64%) and Equity Dividend Booster (-3.59%).
Conclusions & Data Report
Sentiment in the UK Restaurant sector remains fragile. Declines in exposure that started in 2015/2016 were heavily compounded by the effects of COVID lockdowns in 2020. Yet despite attempts at a bounce in 2021 as part of the COVID re-opening trade, 2022 has seen ownership levels return to their lowest levels on record.
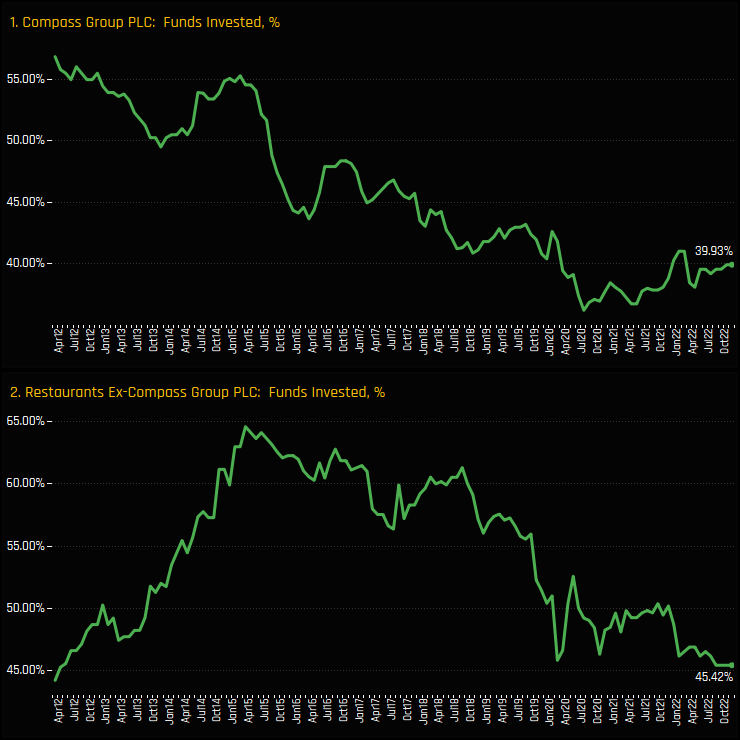
From a stock perspective, Compass Group dominates the picture, though long-term ownership trends have been similar for most stocks within the sector. The chart to the right shows the percentage of funds invested in Compass Group (top) and the percentage of funds invested in Restaurants Ex-Compass Group (bottom). Both have been in long-term decline, though Compass Group does appear to be moving higher from the lows. Perhaps the 2nd and 3rd tier stocks will follow, but all hopes appear to rest on Compass Group to turn things around.
Please click on the link below for an extended data report on the Restaurants industry group among active UK equity funds. Scroll down for ownership profiles on Compass Group and SPP Group, and for more analysis on UK fund positioning.
Stock Profile: Compass Group PLC
Stock Profile: SPP Group Plc
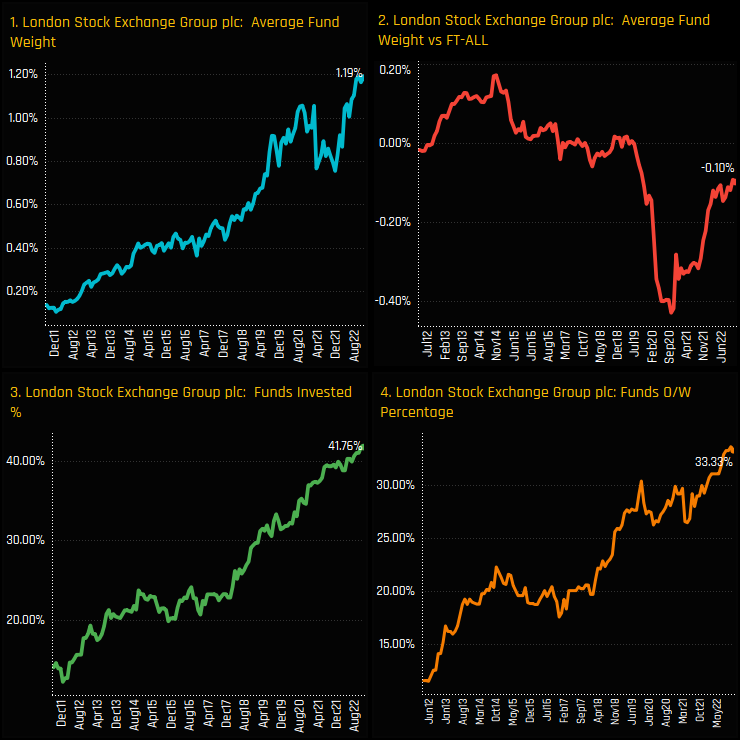
The London Stock Exchange Group is seeing a remarkable rise in ownership among UK active managers. The percentage of UK funds invested in the LSE Group has risen from under 10% in 2012 to a record 41.8% today with average fund weights hitting all-time highs of 1.19%. Versus the benchmark, a record 33.3% of managers are overweight the benchmark SPDRs FTSE UK All Share ETF, though today’s average weight represents an underweight of -0.10%.
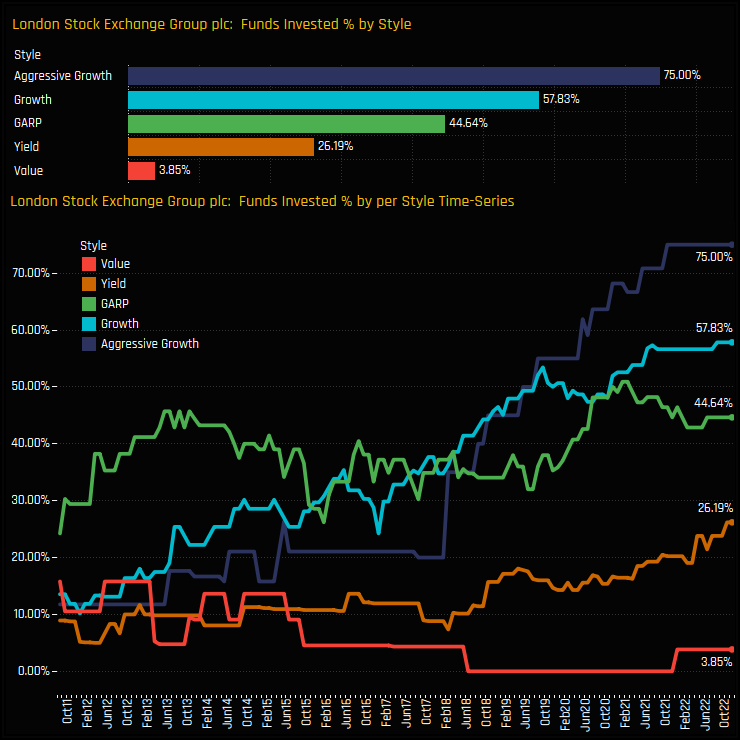
The charts below show the percentage of UK funds in each style group who hold a position in the LSE Group (top chart) and the trends over time (bottom chart). The rise in ownership has been driven by high growth investors, with both Aggressive Growth and Growth strategies at their highest levels of ownership on record. Value managers are almost non-existent from the register, whilst Yield managers are slowly accumulating positions.
Fund Holdings & Activity
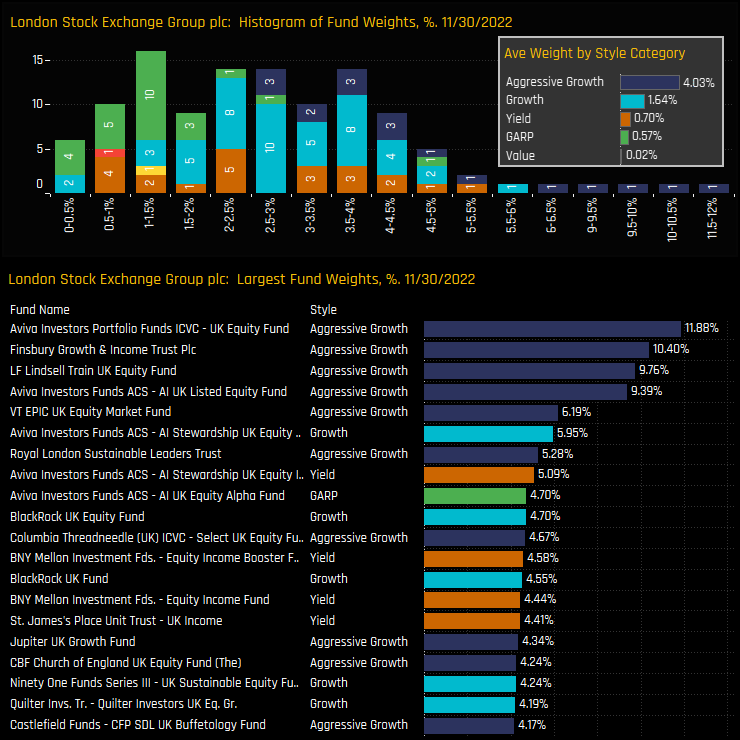
We can see this Style imbalance in the distribution of fund weights chart below (top). The bulk of the holding distribution sits between 1% and 4%, but the tail to the upside is occupied by Growth and Aggressive Growth strategies. Top holders are Aviva UK Equity (11.9%), Finsbury Growth & Income (10.4%) and Lindsell Train UK Equity (9.8%).
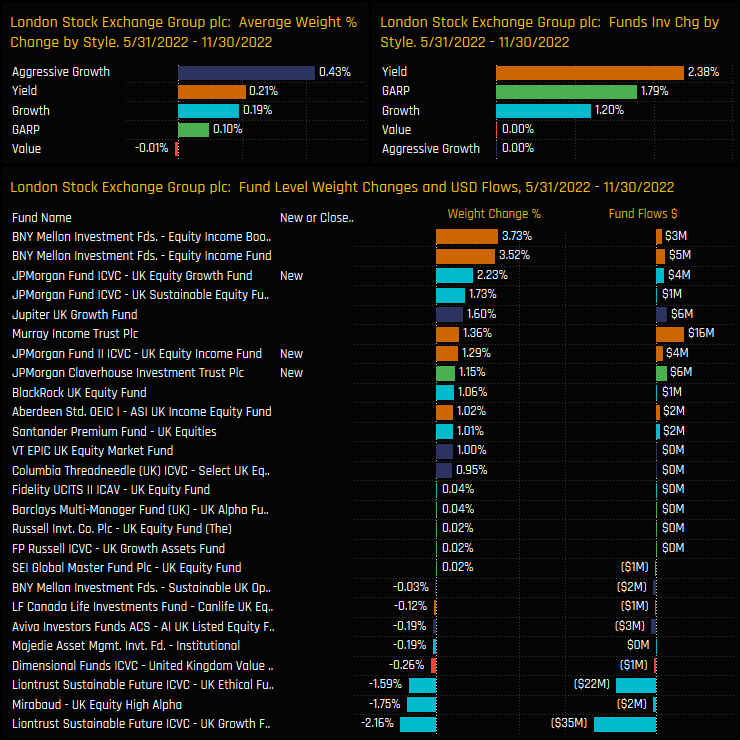
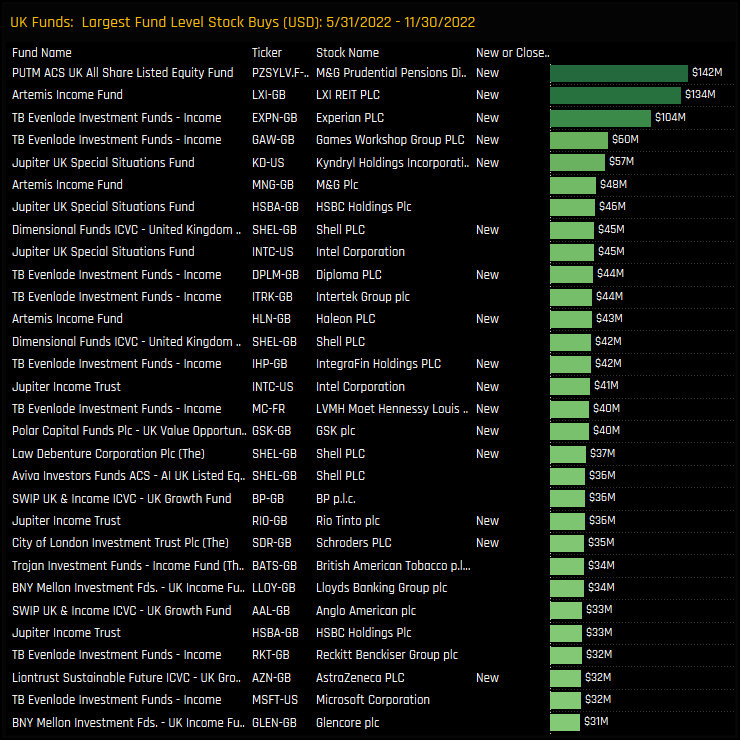
Over the last 6-months, fund level activity in the LSE Group has been positive, with a number of JP Morgan UK strategies opening new exposure and selected Income funds increasing fund weights. On average, ownership levels increased across the Style spectrum with the exception of Value.
Conclusions & Data Report
In over a decades worth of holdings data among UK active funds, ownership levels in the LSE Group have never looked as bright. Rising ownership is pushing UK fund exposure to new highs, driven by Aggressive Growth and Growth strategies.
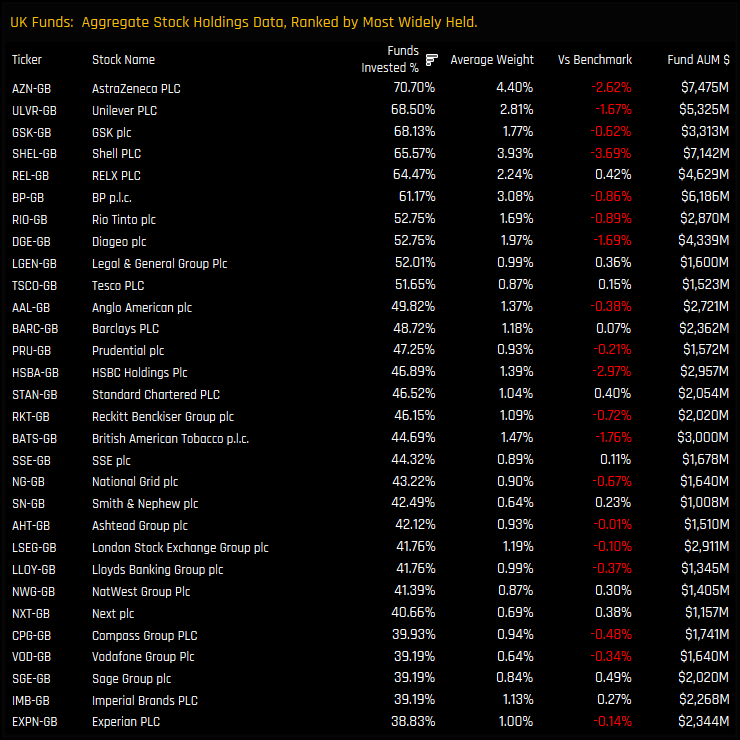
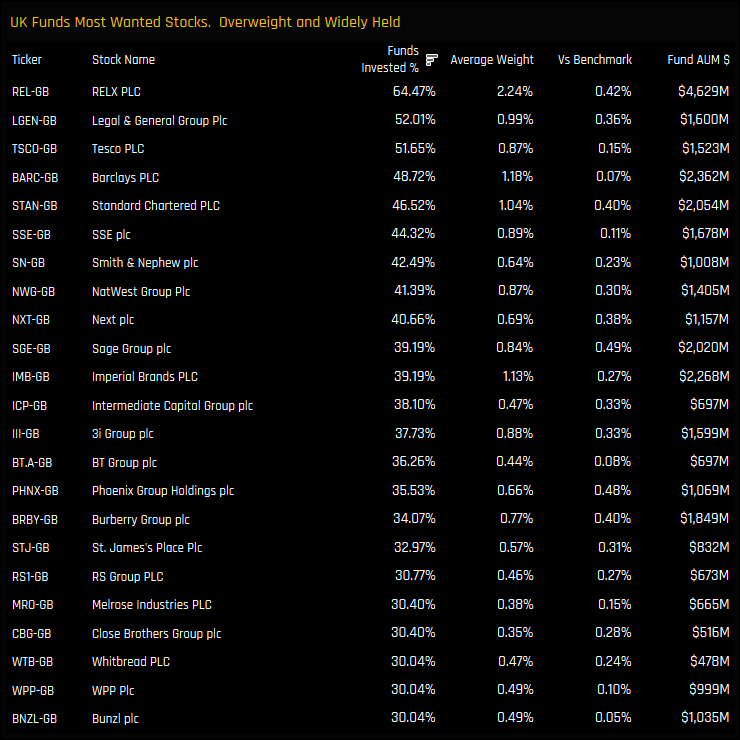
The chart to the right shows the aggregate stock holding statistics among UK equity funds, ranked by the most widely held companies. The LSE Group has risen to the 22nd most widely held stock in the UK and the 12th largest on an average weight basis.
The fact that a growing number of Yield investors are buying in to the stock demonstrates the LSE Group’s growing appeal among the Style groups, and also hints at the potential for further ownership growth from here. Of the 84 Yield funds in our UK analysis, only 22 own the LSE Group and of the 26 Value funds, just 1 has exposure. If growth expectations are realized, expect ownership to move higher from here.
Please click on the link below for an extended data report on the LSE Group PLC Group among active UK equity funds. Scroll down for our final piece on UK Fund positioning,
For more analysis, data or information on active investor positioning in your market, please get in touch with me on steven.holden@copleyfundresearch.com
Related Posts

- Steve Holden
- March 27, 2023
UK Fund Positioning Analysis, March 2023
264 UK Equity Funds, AUM $176bn UK Equity Fund Positioning Analysis, March 2023 In this issue: ..

- Steve Holden
- April 28, 2023
UK Fund Positioning Analysis, April 2023
270 UK Equity Funds, AUM $179bn UK Equity Fund Positioning Analysis, April 2023 In this issue: ..

- Steve Holden
- April 28, 2025
UK Funds: Positioning Chart Pack, April 2025
UK Fund Analysis Active UK Funds: Positioning Chart Pack, April 25 In this month’s cha ..

