Active Global Funds: Performance & Attribution Q1 2026
April 22nd 2026
Tough quarter, familiar outcome: Global active funds fell -4.79% and trailed the MSCI ACWI Index by 1.7%, with nearly two-thirds of managers underperforming as style dispersion widened (Value +7.3% vs Aggressive Growth).
US Tech drag, Energy miss: Losses were driven by US Technology (-2.2% impact), while Taiwan/Korea gains weren’t enough to offset broader US and European weakness. Relative underperformance came from missing Energy upside and poor stock selection in key US sectors.
Crowded pain, positioning gap persists: Weakness in core holdings (Magnificent Seven) outweighed gains from TSMC/ASML and Energy.
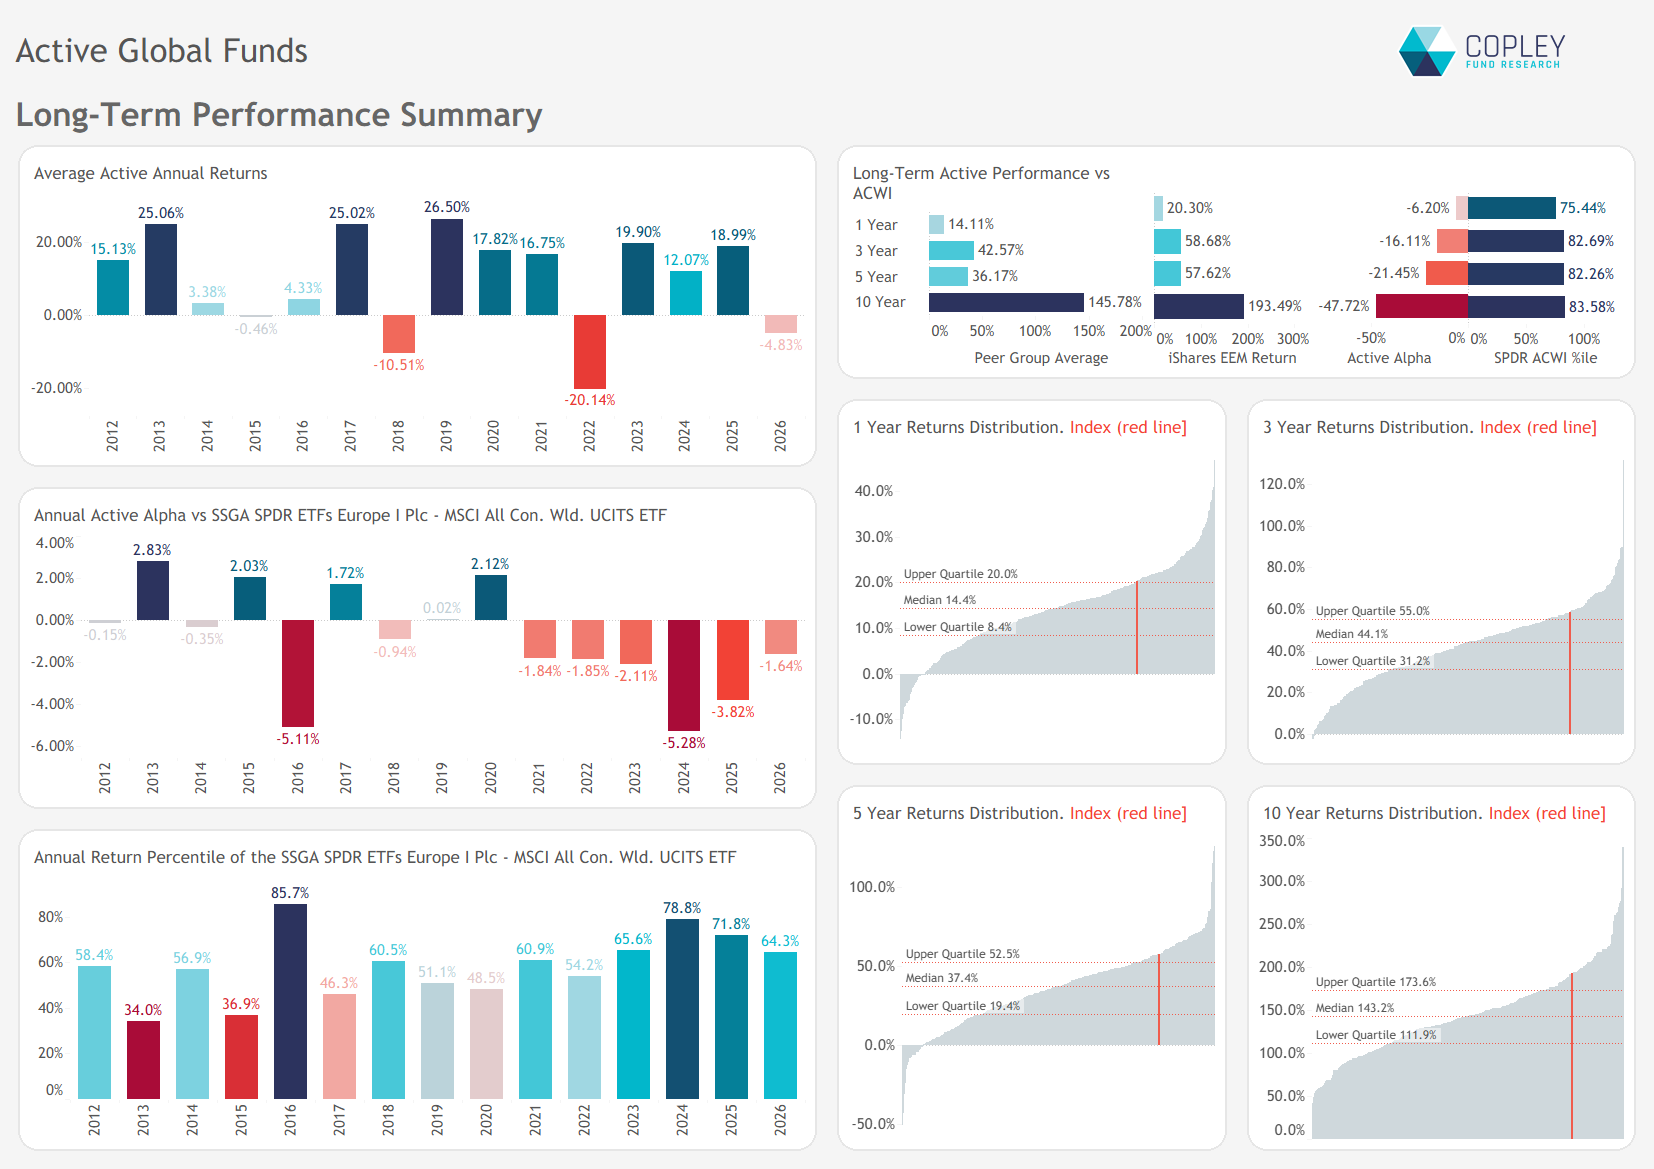
Longer term, active funds remain deeply behind (-47.7% over 10 years), with positioning still out of sync with market leadership.
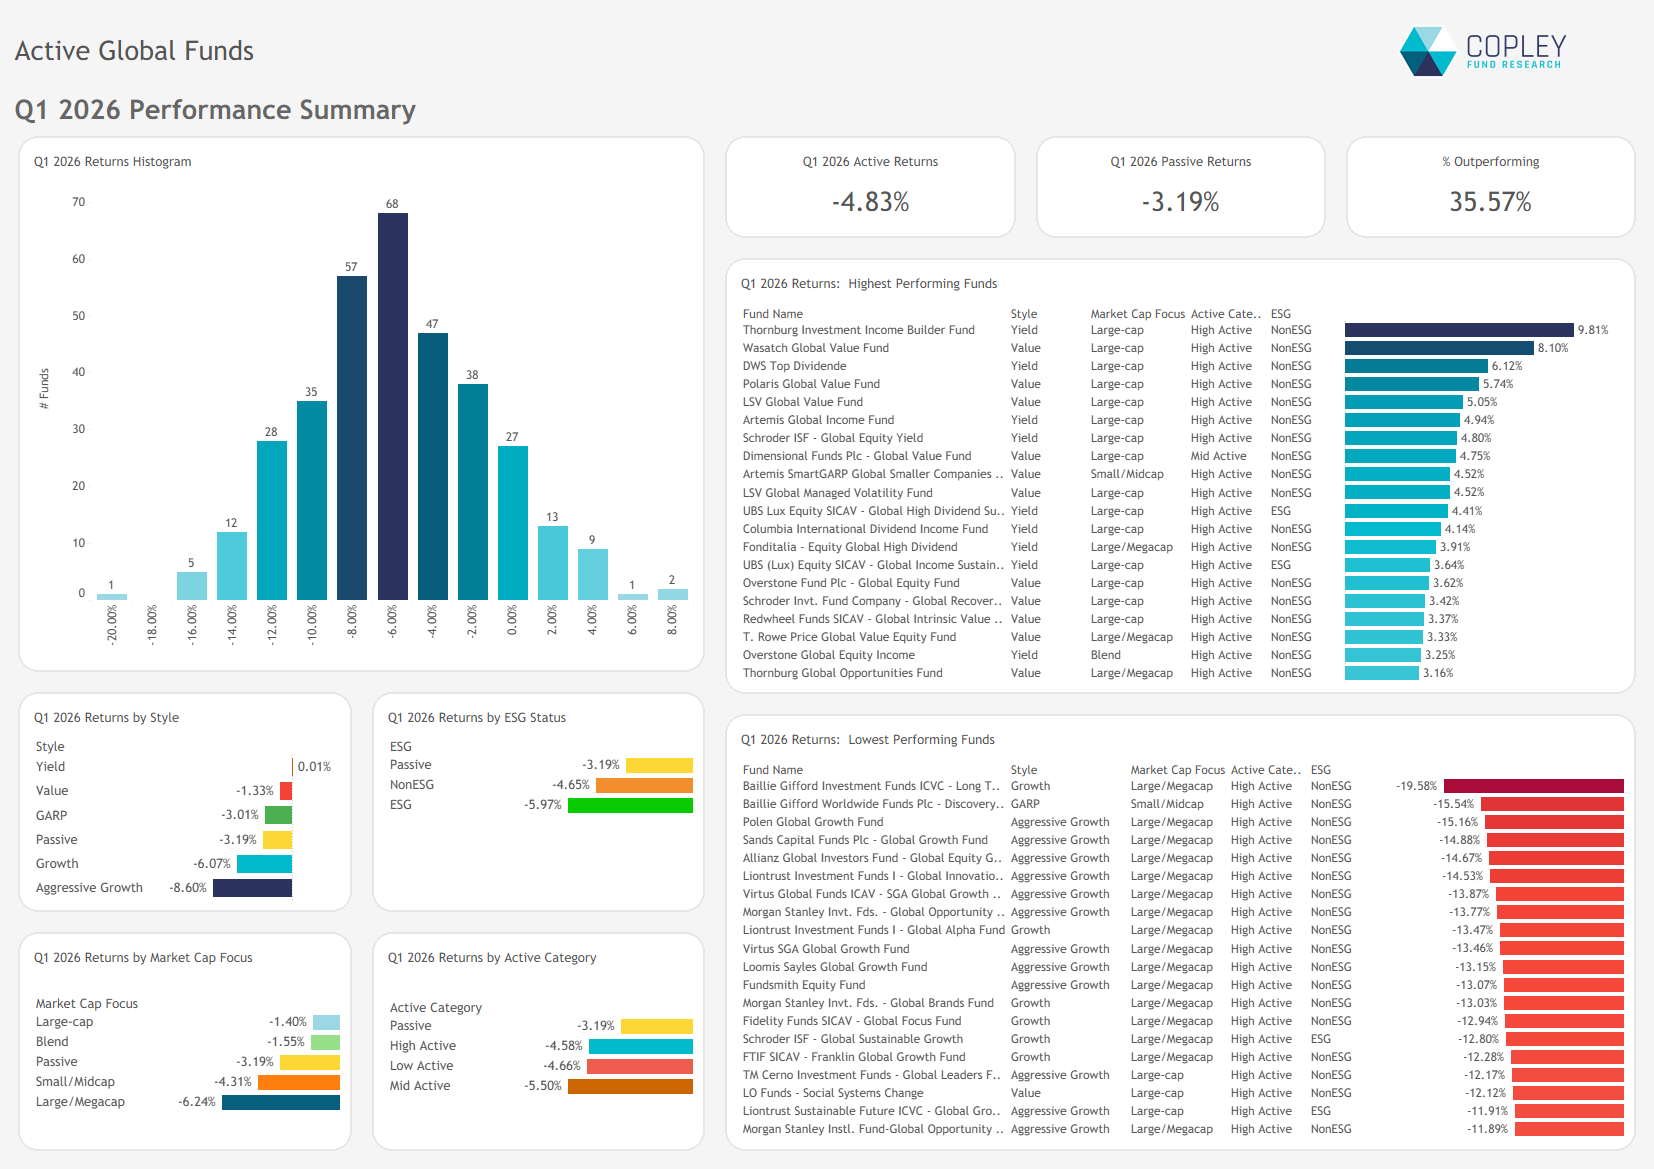
A Difficult Quarter Active Global funds had a tough quarter on multiple fronts. Average returns fell -4.79%, with all styles bar Yield in negative territory. Performance was largely driven by style, with Value outperforming Aggressive Growth by 7.3%. Thornburg Income Builder (+9.8%) and Wasatch Global Value (+8.1%) stood out as the top performers.
The MSCI ACWI Index remains a high bar, outperforming the average active fund by 1.7% and beating nearly two-thirds of managers in our universe.
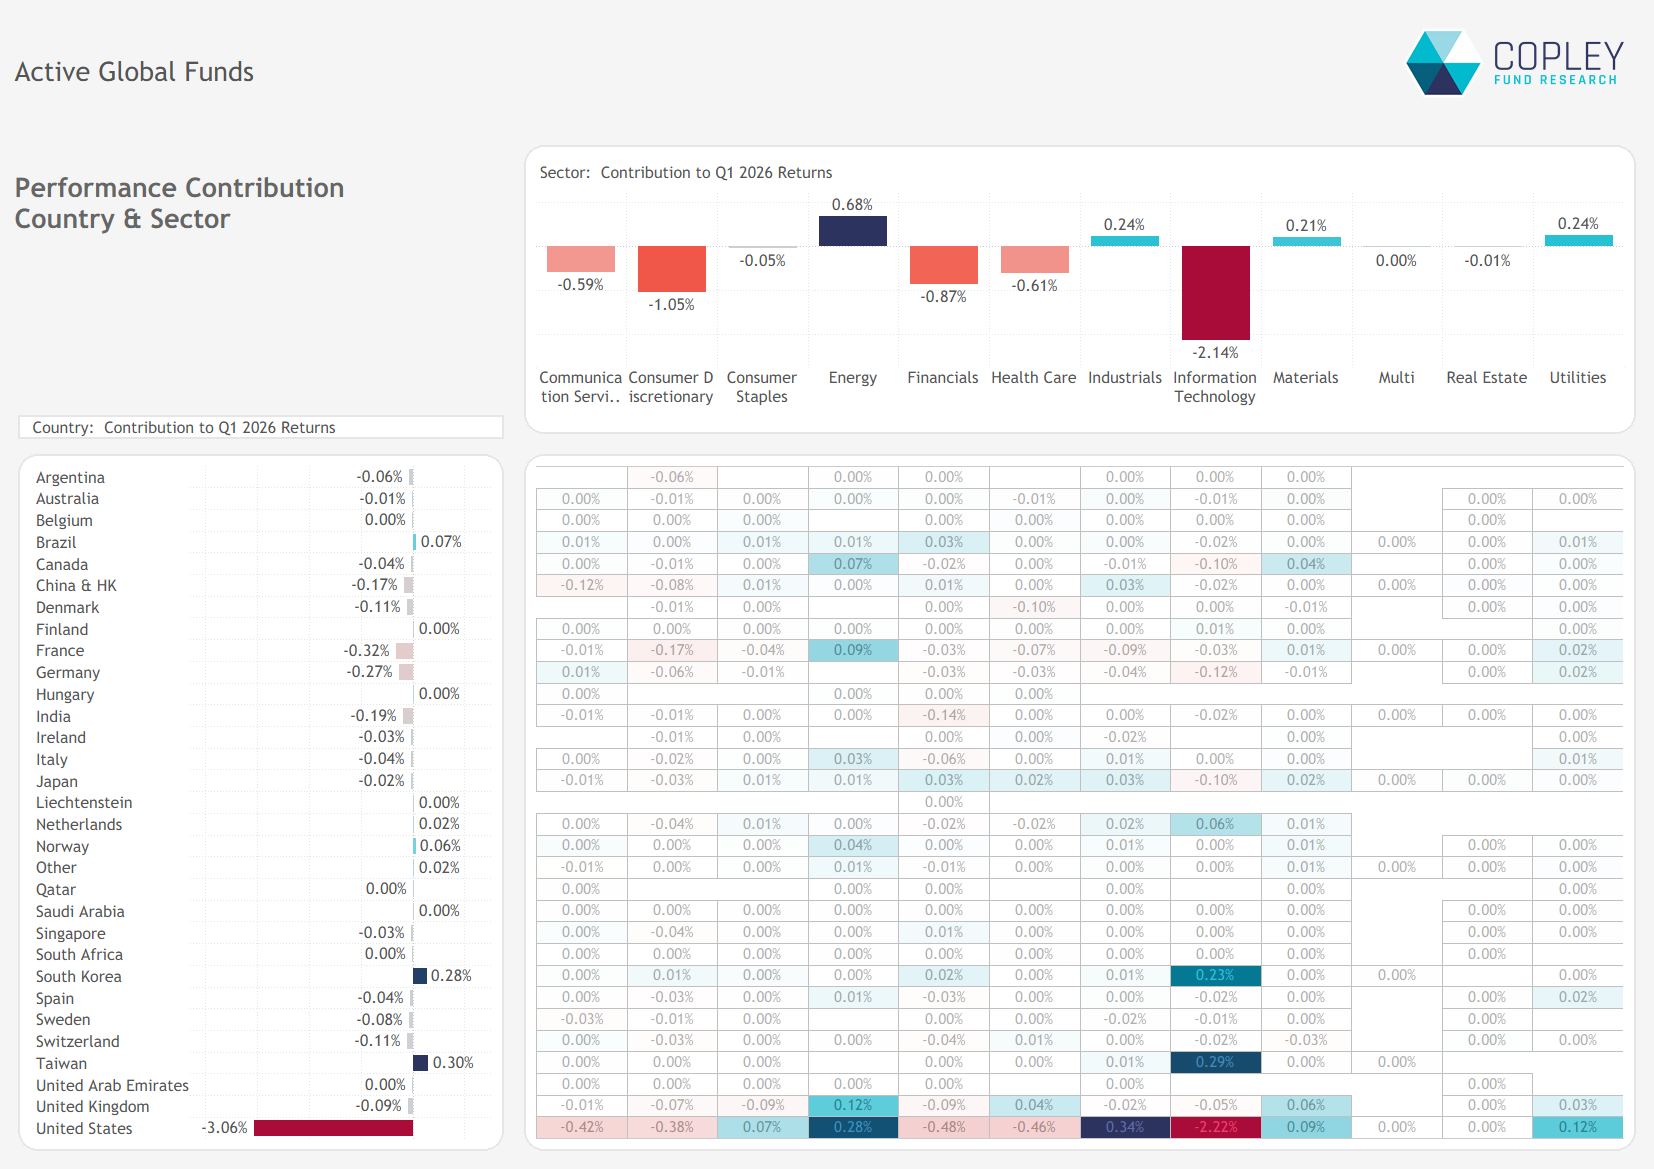
US Leads Returns Lower The charts below break down Q1 return drivers by country and sector, based on aggregate manager holdings. At the sector level, Technology was the dominant drag, detracting 2.14% from returns. This was compounded by further weakness in Consumer Discretionary, Financials, and Health Care. Energy provided the only meaningful offset, contributing +0.68%, with smaller positives from Industrials, Utilities, and Materials.
At the country level, Taiwan and South Korea were the only clear contributors, but these gains were more than offset by declines in the US and, to a lesser extent, across major European markets. Within the US, modest gains from Energy and Industrials (+0.62% combined) were overwhelmed by losses in Technology, which alone cost the average Global fund -2.2% over the quarter.
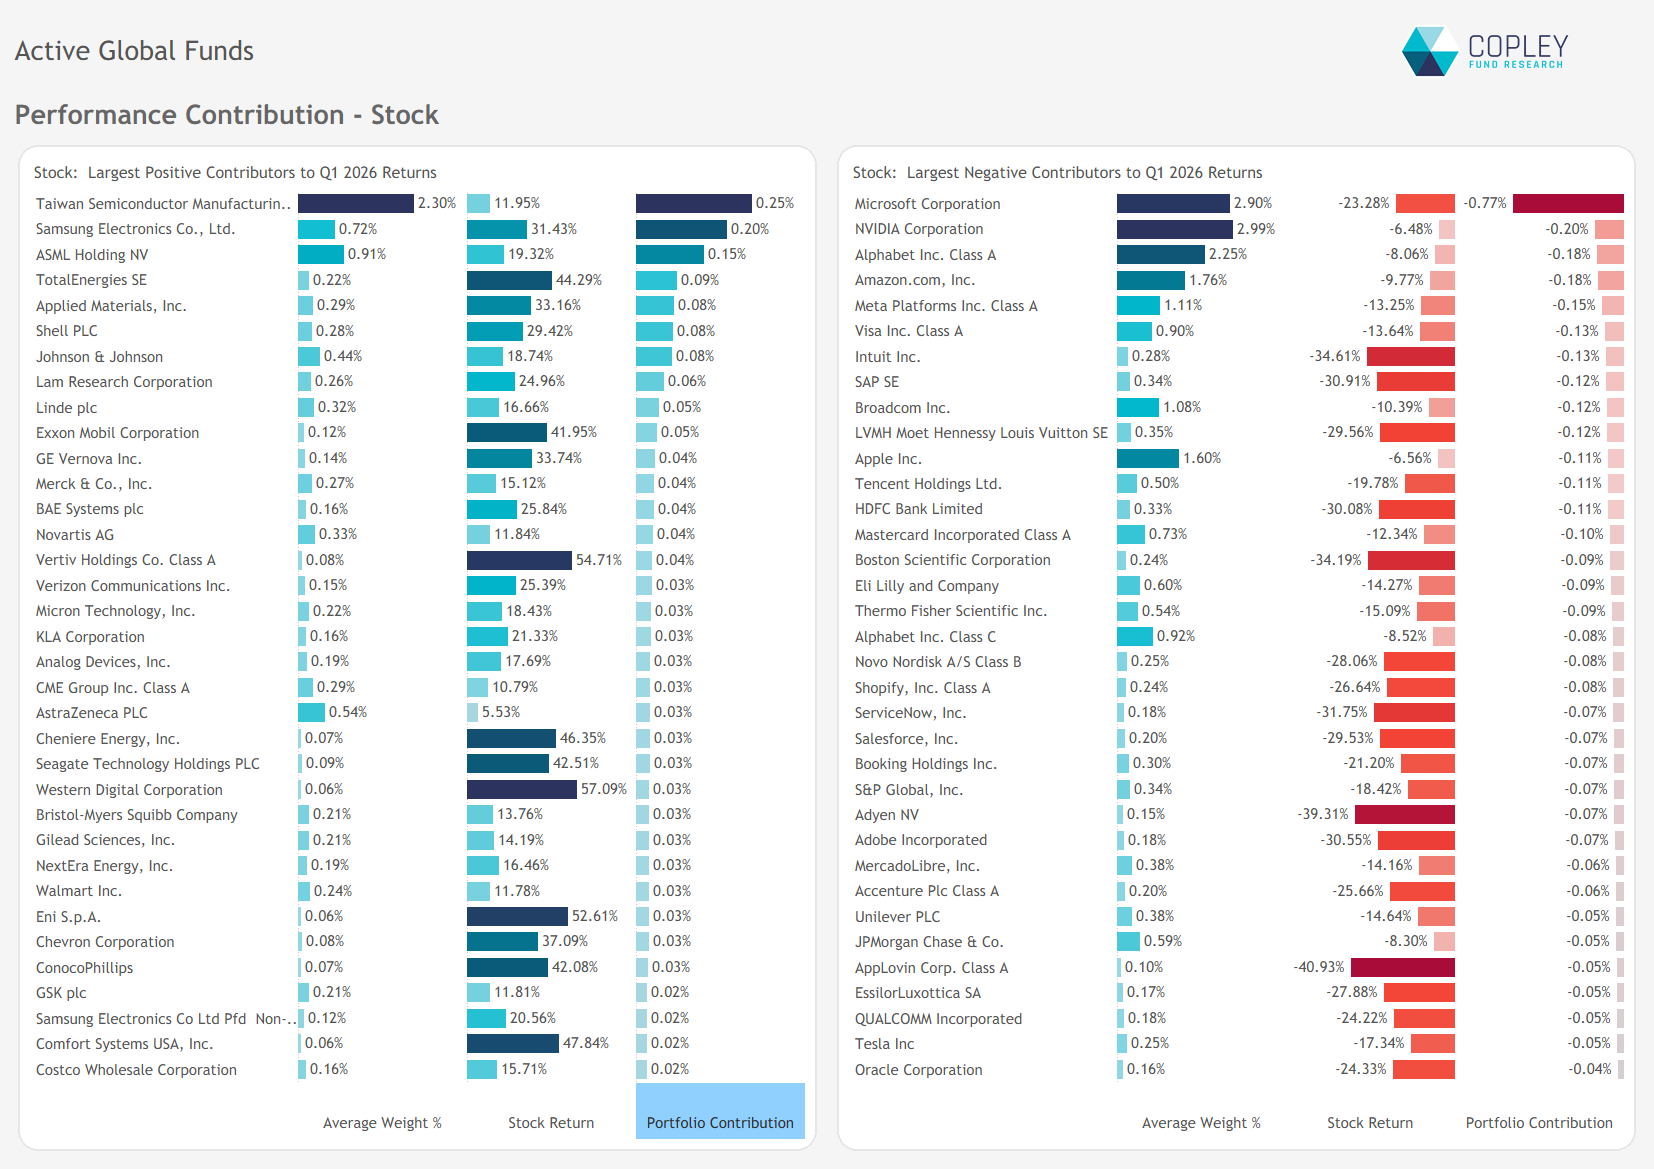
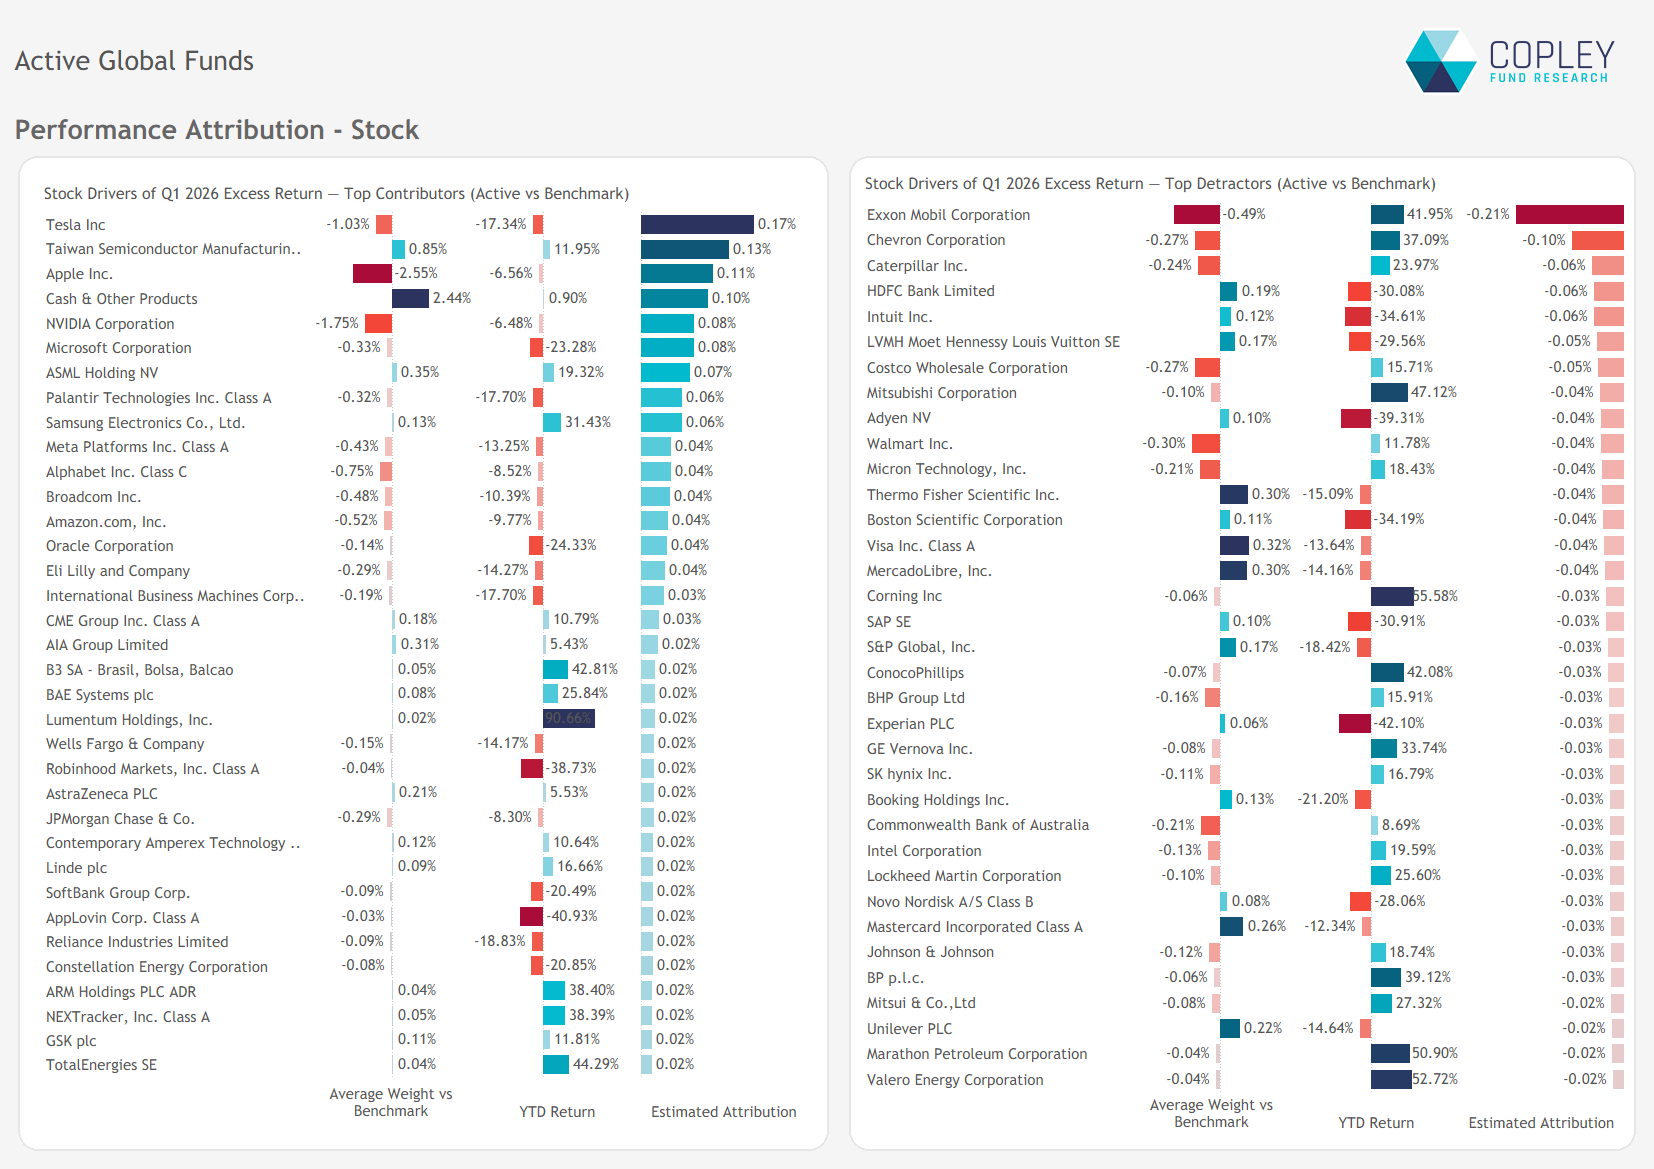
Stock-Level Influence At the stock level, gains were concentrated in a handful of names. TSMC, Samsung Electronics, and ASML were the primary contributors, alongside solid support from global energy majors.
However, these gains were overwhelmed by weakness in core positions. Microsoft (2.9% weight) fell 23.3%, while NVIDIA (3.0% weight) declined 6.5%. More broadly, all of the “Magnificent Seven” detracted, driving the quarter’s negative net return.
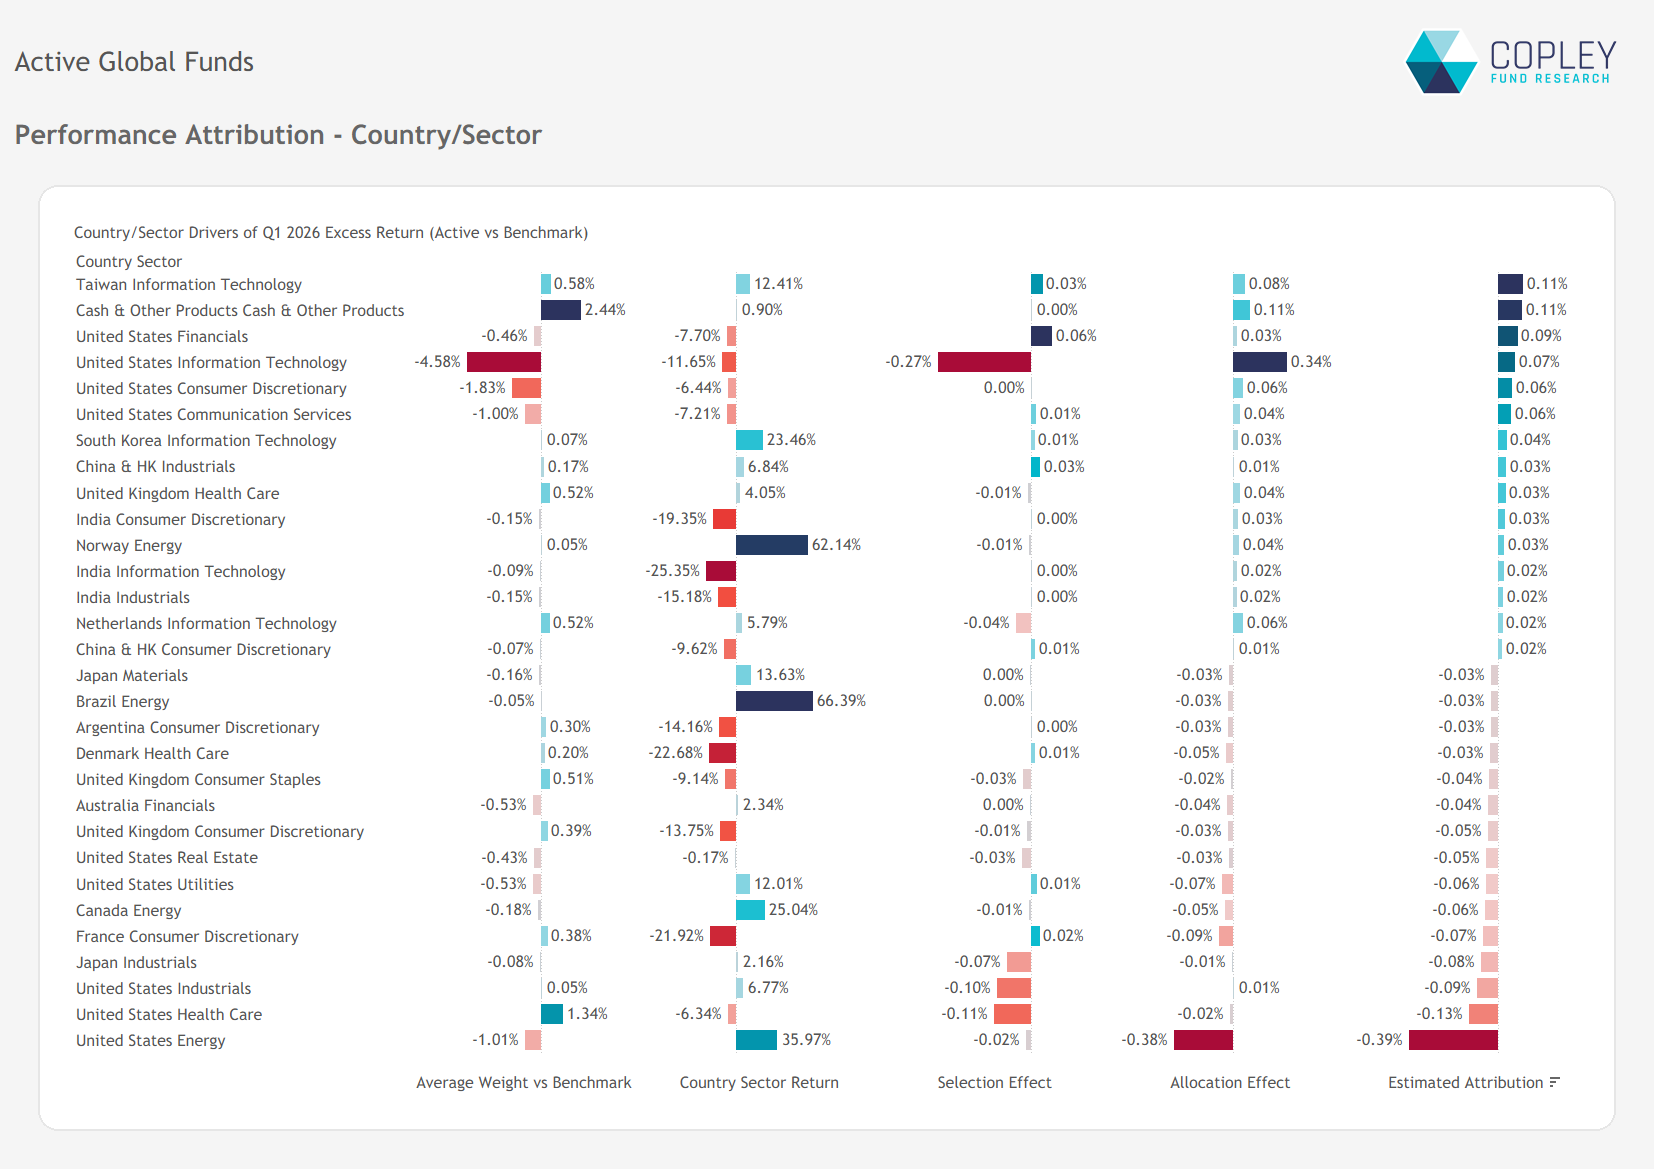
Performance Attribution – Where Funds Lost out to the Benchmark The chart below breaks down the key drivers of relative performance at the country/sector level. Outperformance was led by overweights to Taiwan Technology and Cash, alongside underweights in US Technology and strong stock selection within US Financials.
On the flip side, underperformance was driven by underweights in US Energy and weak stock selection across US Health Care, Industrials, and Technology.
Stock Attribution Active EM managers benefited from net overweights in TSMC and ASML, alongside cash positions, while underweights in Tesla, Apple, and NVIDIA also supported relative performance.
On the negative side, underownership of Exxon Mobil and Chevron was the largest drag, costing a combined 31bps in relative terms. Elsewhere, managers were caught offside with overweights in HDFC Bank, Intuit, and LVMH.
Long-Term Performance This quarter’s weakness adds to a prolonged period of underperformance for Global active funds versus the MSCI ACWI Index. A sixth consecutive year of lagging returns would further weigh on the asset class, with 10-year relative performance now sitting at -47.7% on average.
What stands out this quarter is the shift in drivers. Underperformance did not come from the usual source—underweights to the US and US Technology—but instead from missed gains in Energy, which more than offset any benefit from reduced US exposure.
Active positioning remains out of sync with the market’s winners. The question is whether that gap begins to close—or persists.
Performance & Attribution Report
Click the link opposite for full charts and data detailing the drivers of Q1 2026 performance, along with a review of 3-, 5-, and 10-year results across the active Global peer group.


