Global Emerging Markets
January 30th 2026
Executive Summary
2025 was marked by a series of specific rotations within active EM portfolios, with notable positioning changes across regions, countries, sectors and stocks. At the regional level, exposure shifted away from parts of Asia toward the Americas and EMEA ex-MENA, while MENA saw rising participation despite remaining underweight. At the country level, rotation was most pronounced between South Korea and India, alongside a clear pullback from Indonesia. Sector rotation saw increased allocations to Technology and Materials, offset by reductions in the Consumer sectors, while defensive sector exposure fell to record lows. At the stock level, leadership continued to change, with selling in former consensus names and rising ownership in a smaller set of emerging or re-emerging positions.
Entering 2026, active EM positioning reflects the cumulative outcome of that rotation. Asia remains the dominant allocation but is held at a net underweight versus the benchmark, the Americas remain the clearest consensus overweight, and EMEA positioning continues to normalise towards benchmark. Country positioning shows structural underweights in Taiwan, China & HK and India, offset by overweights in Brazil and Mexico, while South Korea’s positioning reflects a meaningful shift over the past year and Indonesia’s a clear reduction in participation. Sector exposure is anchored in Technology and Financials, which together account for around half of total allocations, with Technology underweight increasingly driven by concentration effects in TSMC.
At the stock level, TSMC remains the dominant EM holding, with record ownership and portfolio weight, yet sits at a sizeable aggregate underweight versus the benchmark as managers sell into strength. In EM ex-MENA, South Africa’s gold miners — Gold Fields and AngloGold Ashanti — have reached decade-high ownership levels, while OTP Bank continues to close the gap on Naspers as the region’s most widely held stock. In MENA, Emaar Properties has emerged as a core EM holding, now ranking among the 30 most widely owned stocks across the asset class. In ASEAN, positioning has weakened materially, driven by sustained selling in Indonesian banks — notably Bank Mandiri and Bank Rakyat Indonesia — offset only partially by recovering ownership in Sea Ltd and Grab Holdings.
As investors enter 2026, active EM positioning is characterised by established country-level over- and underweights, record-low exposure to defensive sectors, and high ownership but net underweights in the largest benchmark stocks.
Keep scrolling for the extended commentary, or click on the PDF link above for the Top Down Positioning Report, which includes the full breakdown of regional, country, sector and stock positioning among EM active funds.
Regional Positioning
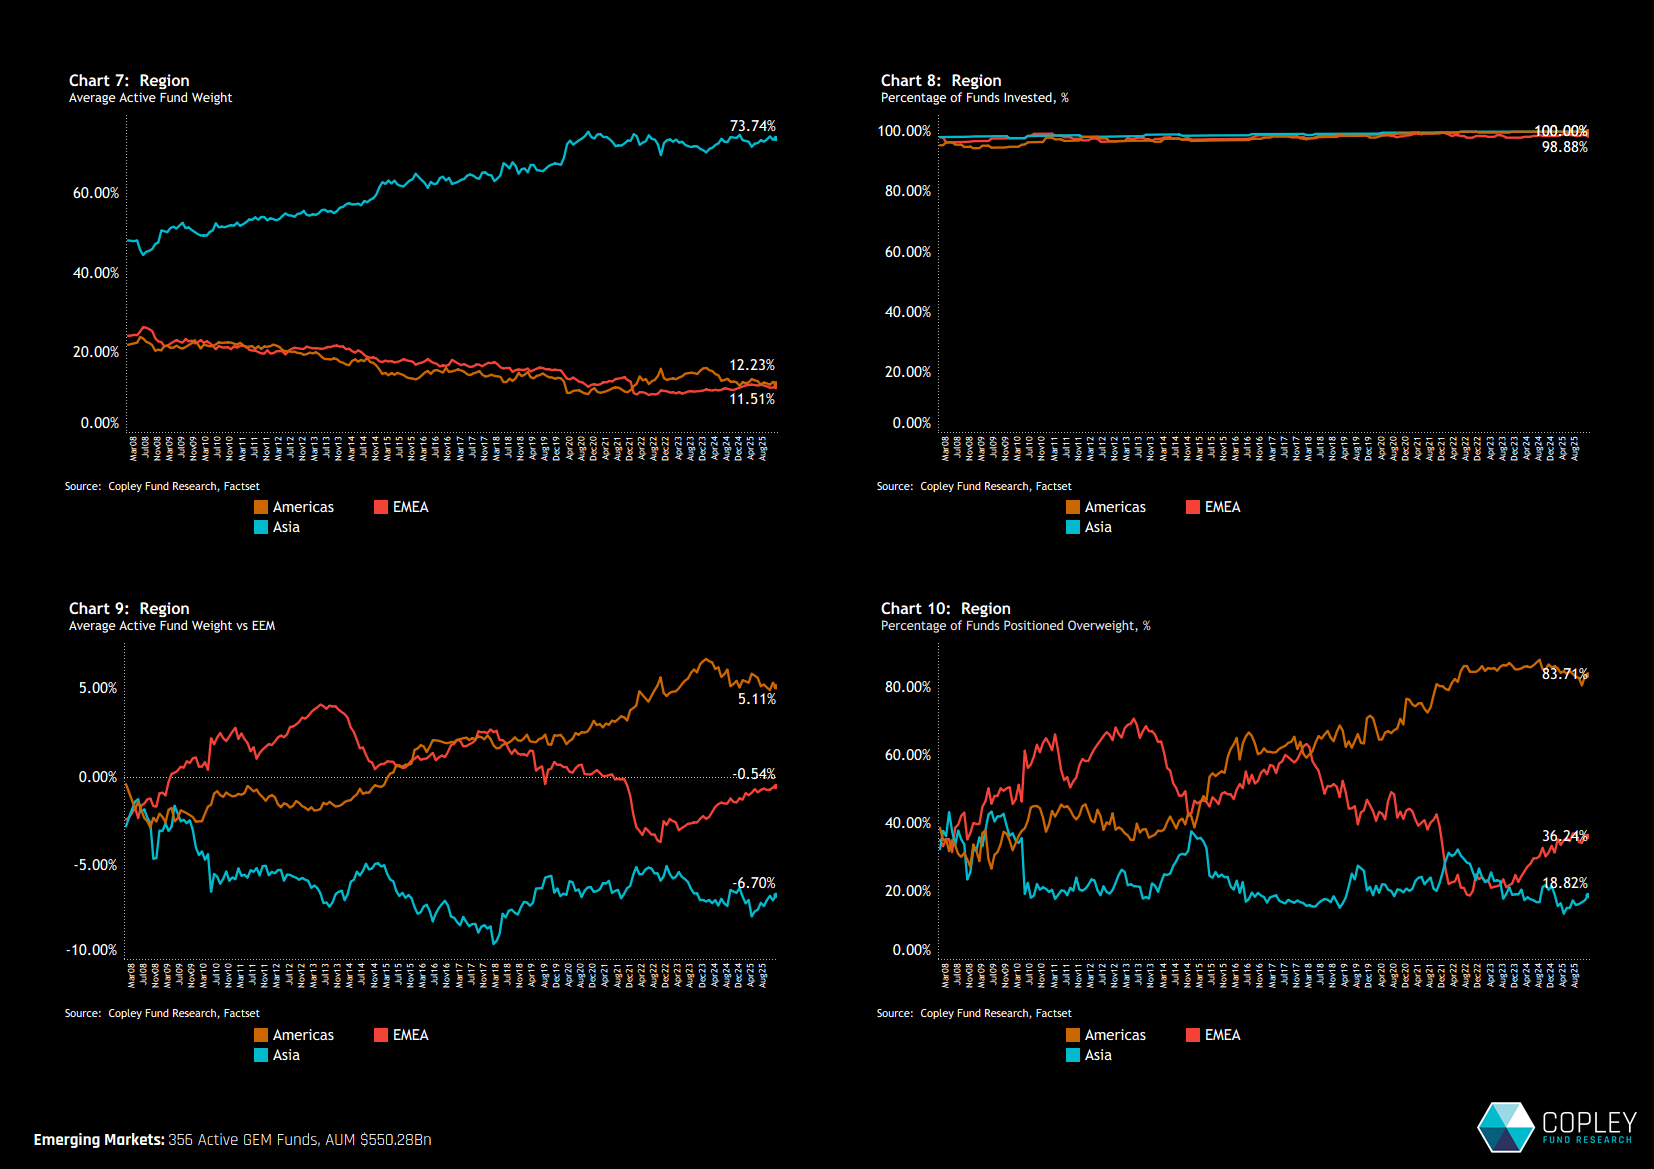
Active GEM funds begin the year with a familiar and pronounced Asia bias, with average allocations of 73.7%, compared to 12.2% for the Americas and 11.5% for EMEA (chart 7). That headline exposure masks a clear effort by active managers to moderate Asia risk, with the peer group running a persistent underweight versus the MSCI EM Index, currently at -6.7% (chart 9). In contrast, positioning in the Americas remains firmly consensus, with 83.7% of funds overweight the region at an average active overweight of 5.1%. EMEA positioning has seen a recent shift, with the aggregate underweight continuing to narrow as a growing number of managers rotate from underweight to outright overweight (chart 10).
Sub-Region Snapshot
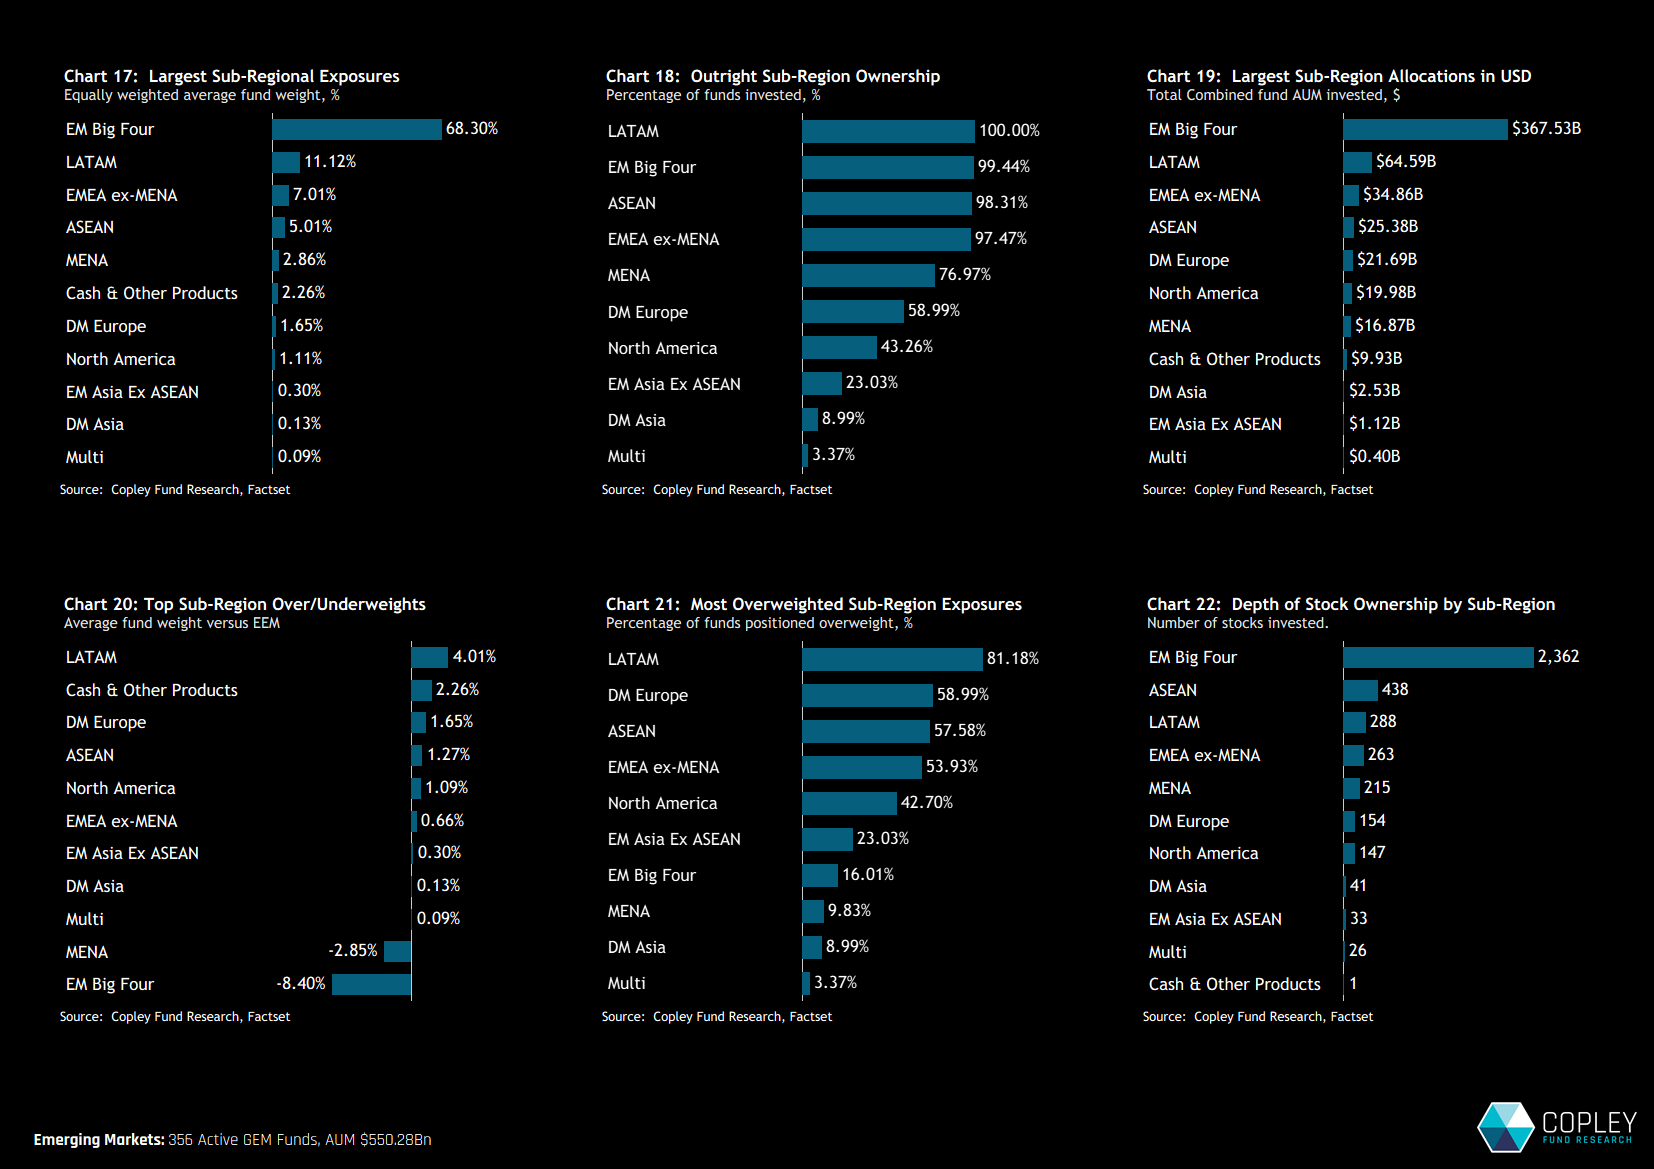
Breaking it down a level further, EM exposure remains highly concentrated in the “Big Four” — China & HK, Taiwan, South Korea and India — which together account for 68.3% of aggregate holdings. This is followed by LATAM at 11.1% and EMEA ex-MENA at 7.0% (chart 17). Despite its growing benchmark weight, MENA remains a non-core allocation for many active managers, with just 77% of funds holding exposure, resulting in a net active underweight of -2.85%.
Active positioning at the sub-regional level shows a pronounced underweights to both the EM Big Four and MENA, funding overweights to LATAM, cash, ASEAN and selective developed market exposures (chart 20). The divergence between LATAM and MENA positioning versus the benchmark is particularly stark: 81.2% of funds are overweight LATAM, compared with just 9.8% overweight MENA (chart 21).
Sub-Region Rotation
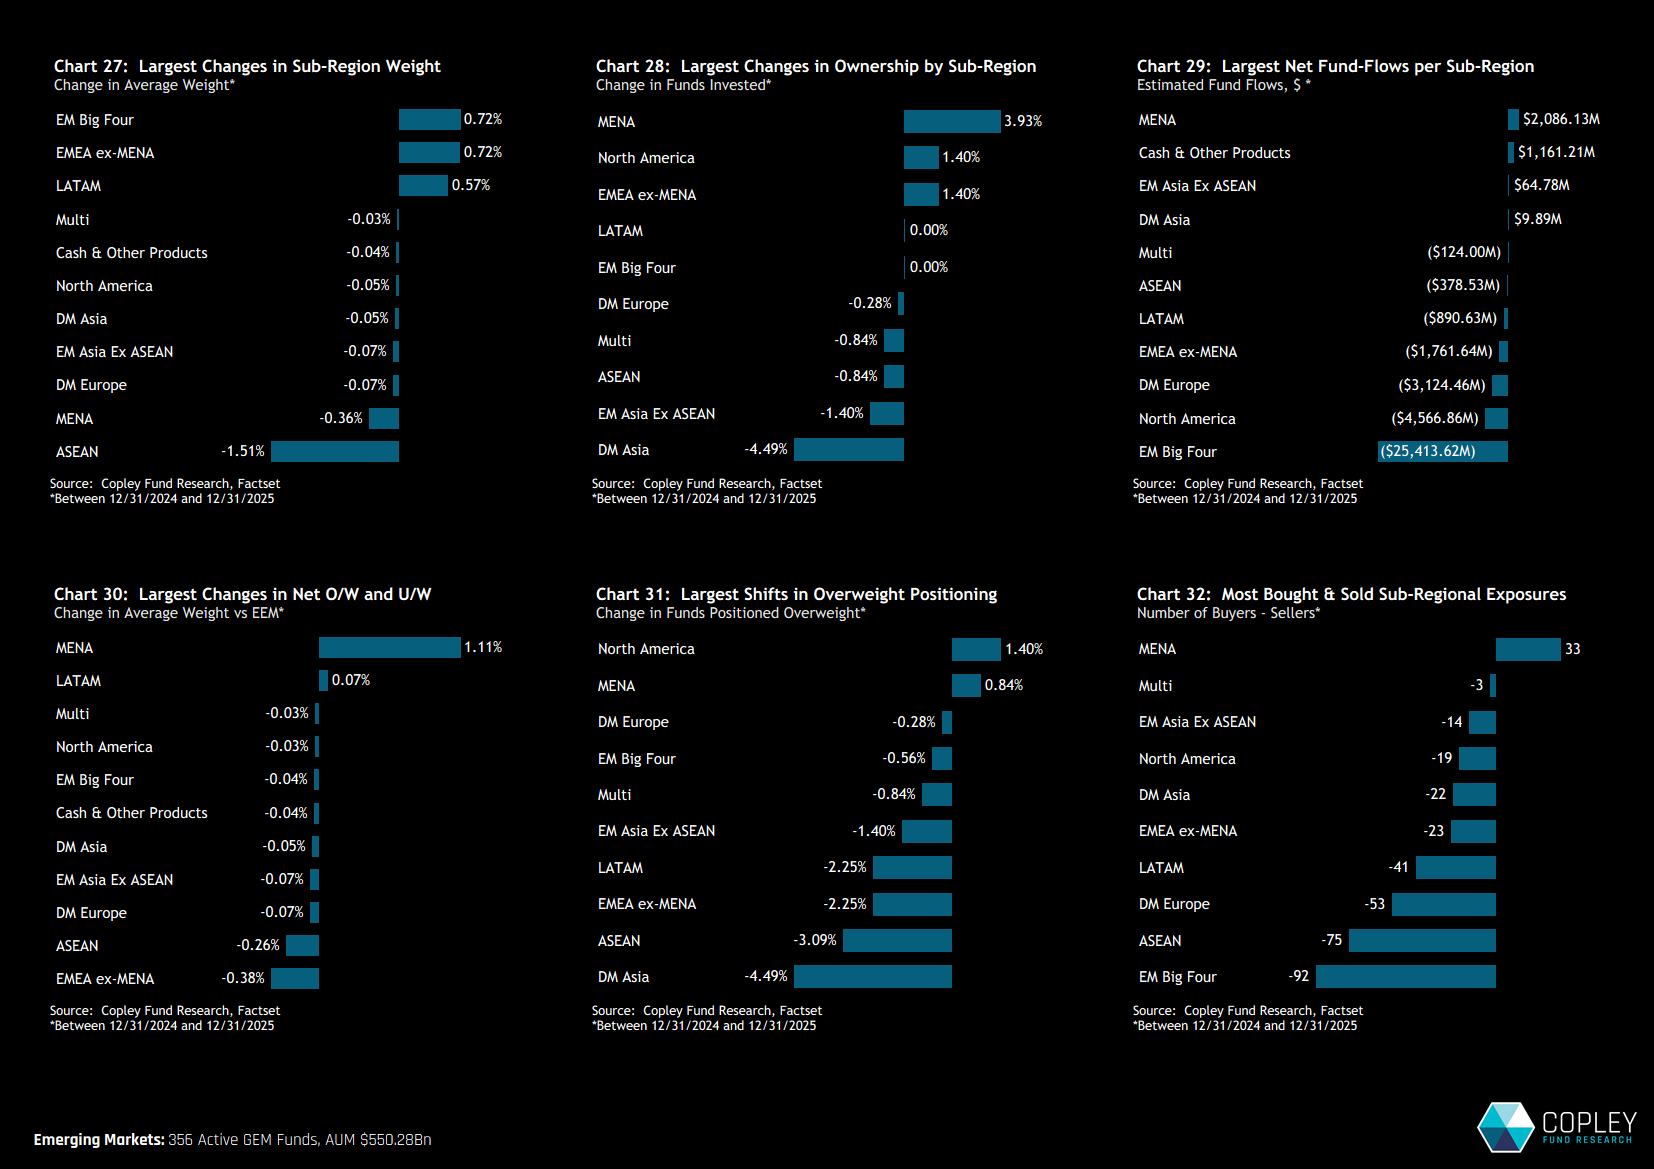
Aggregate positioning shifted meaningfully over the course of 2025. Chart 27 highlights changes in average weights between 31/12/2024 and 31/12/2025, showing a reduction in ASEAN exposure of 1.5% and a more modest 0.36% decline in MENA. These moves funded increases in the EM Big Four and EMEA ex-MENA, both up 0.72%, alongside a 0.57% rise in LATAM allocations.
Looking beyond weights to more active measures, MENA emerged as a clear beneficiary of fund rotation. The sub-region saw a 3.9% increase in the proportion of funds invested (chart 28), net inflows of $2.1bn (chart 29), and a sustained excess of buyers over sellers (chart 32). This stood in contrast to ASEAN, where all measures of ownership deteriorated over the year, pointing to a clear outward rotation.
At the asset-class level, EM equities experienced an estimated $33bn of net outflows over the year, with the larger EM Big Four absorbing the greatest share of redemptions.
Country Positioning
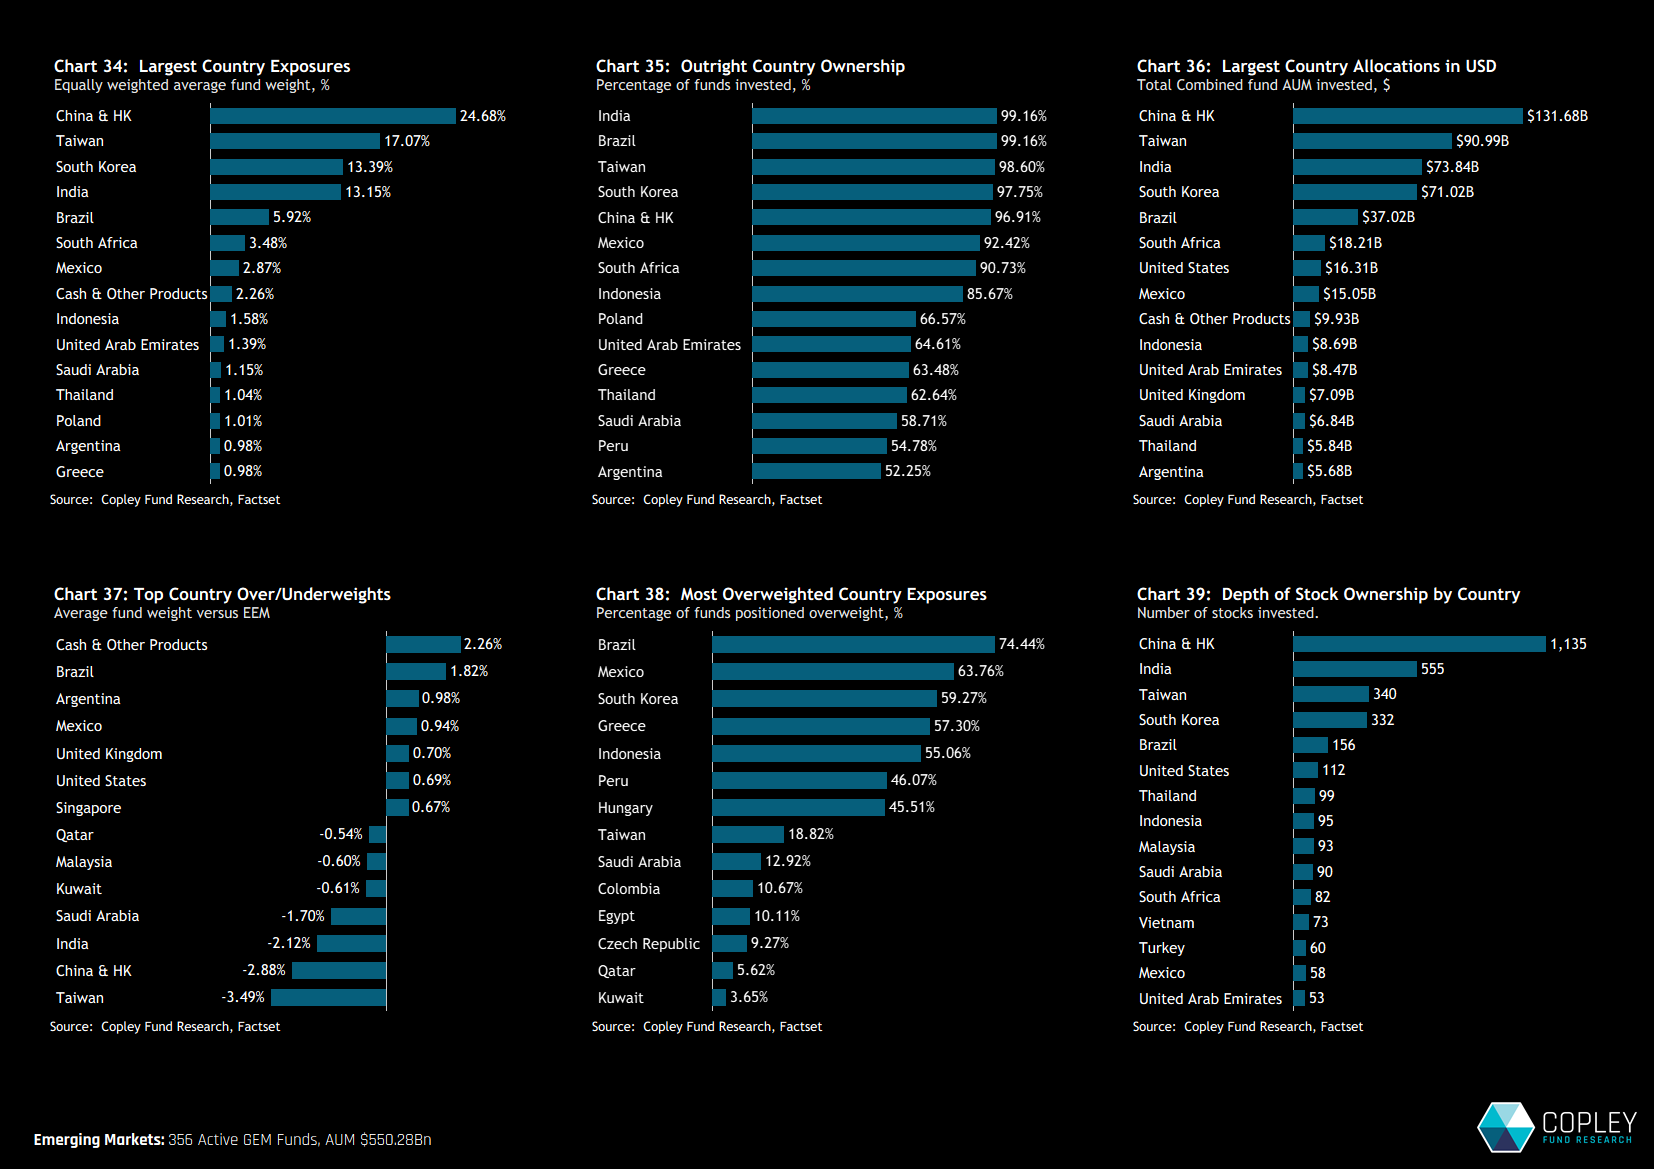
EM active investors enter the year with a clearly defined structural setup. Positioning is characterised by sizeable underweights in Taiwan, China & HK and India, reinforced by persistent structural underweights across key MENA markets, notably Saudi Arabia, Kuwait and Qatar (chart 37). These positions are offset by overweights in cash, Brazil, Argentina and Mexico, alongside selective non-benchmark exposure to the UK and US.
South Korea, Greece and Indonesia now sit alongside Brazil and Mexico as majority-held overweight positions, while appetite for the smaller MENA markets remains extremely limited — almost no funds are willing to run overweights in both Kuwait and Qatar (chart 38). On an absolute basis, Taiwan has opened a clear positioning gap relative to South Korea and India (chart 34), while participation drops off sharply beyond the top eight countries. For example, only 66% of funds currently hold Poland and just 64% have exposure to the UAE.
Country Rotation
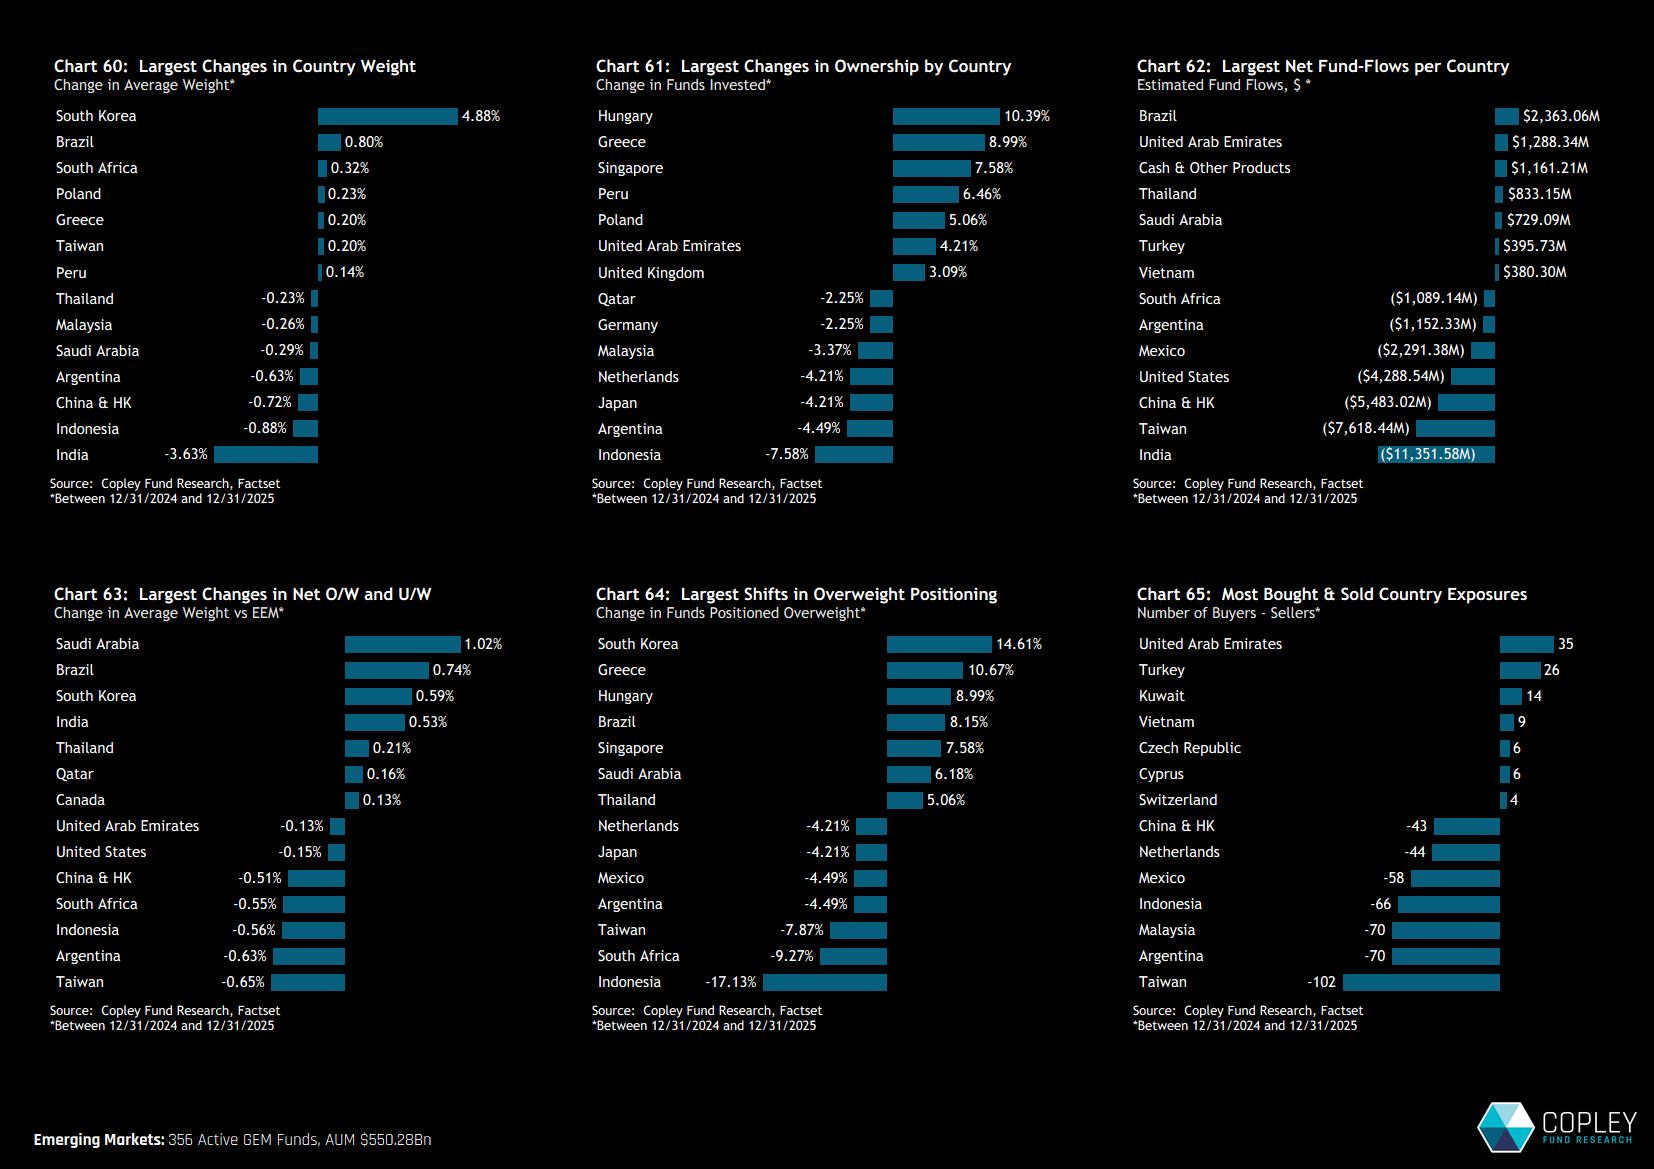
Country-level rotation in 2025 was dominated by a pronounced shift in average exposure between South Korea and India. Average weights to South Korea increased by 4.9% over the year, while India saw a 3.6% decline. While relative performance clearly played a role, there was also an active component: India experienced the largest country-level fund outflows (chart 62), while South Korea recorded the strongest shift from underweight to overweight positioning across the peer group (chart 64).
Beyond this headline rotation, several smaller EM markets saw notable increases in active participation. Hungary, Greece and Poland all recorded strong rises in outright ownership (chart 61), while the UAE saw gains across multiple ownership metrics. By contrast, Indonesia experienced meaningful outward rotation, with 7.6% of funds exiting positions entirely and a further 17.1% shifting to underweight – driving average weights lower and softening the long-standing consensus overweight.
Big Four Long-Term Dynamics
China & HK, Taiwan, South Korea and India remain at the core of EM allocations, but relative positioning within the group continues to shift.
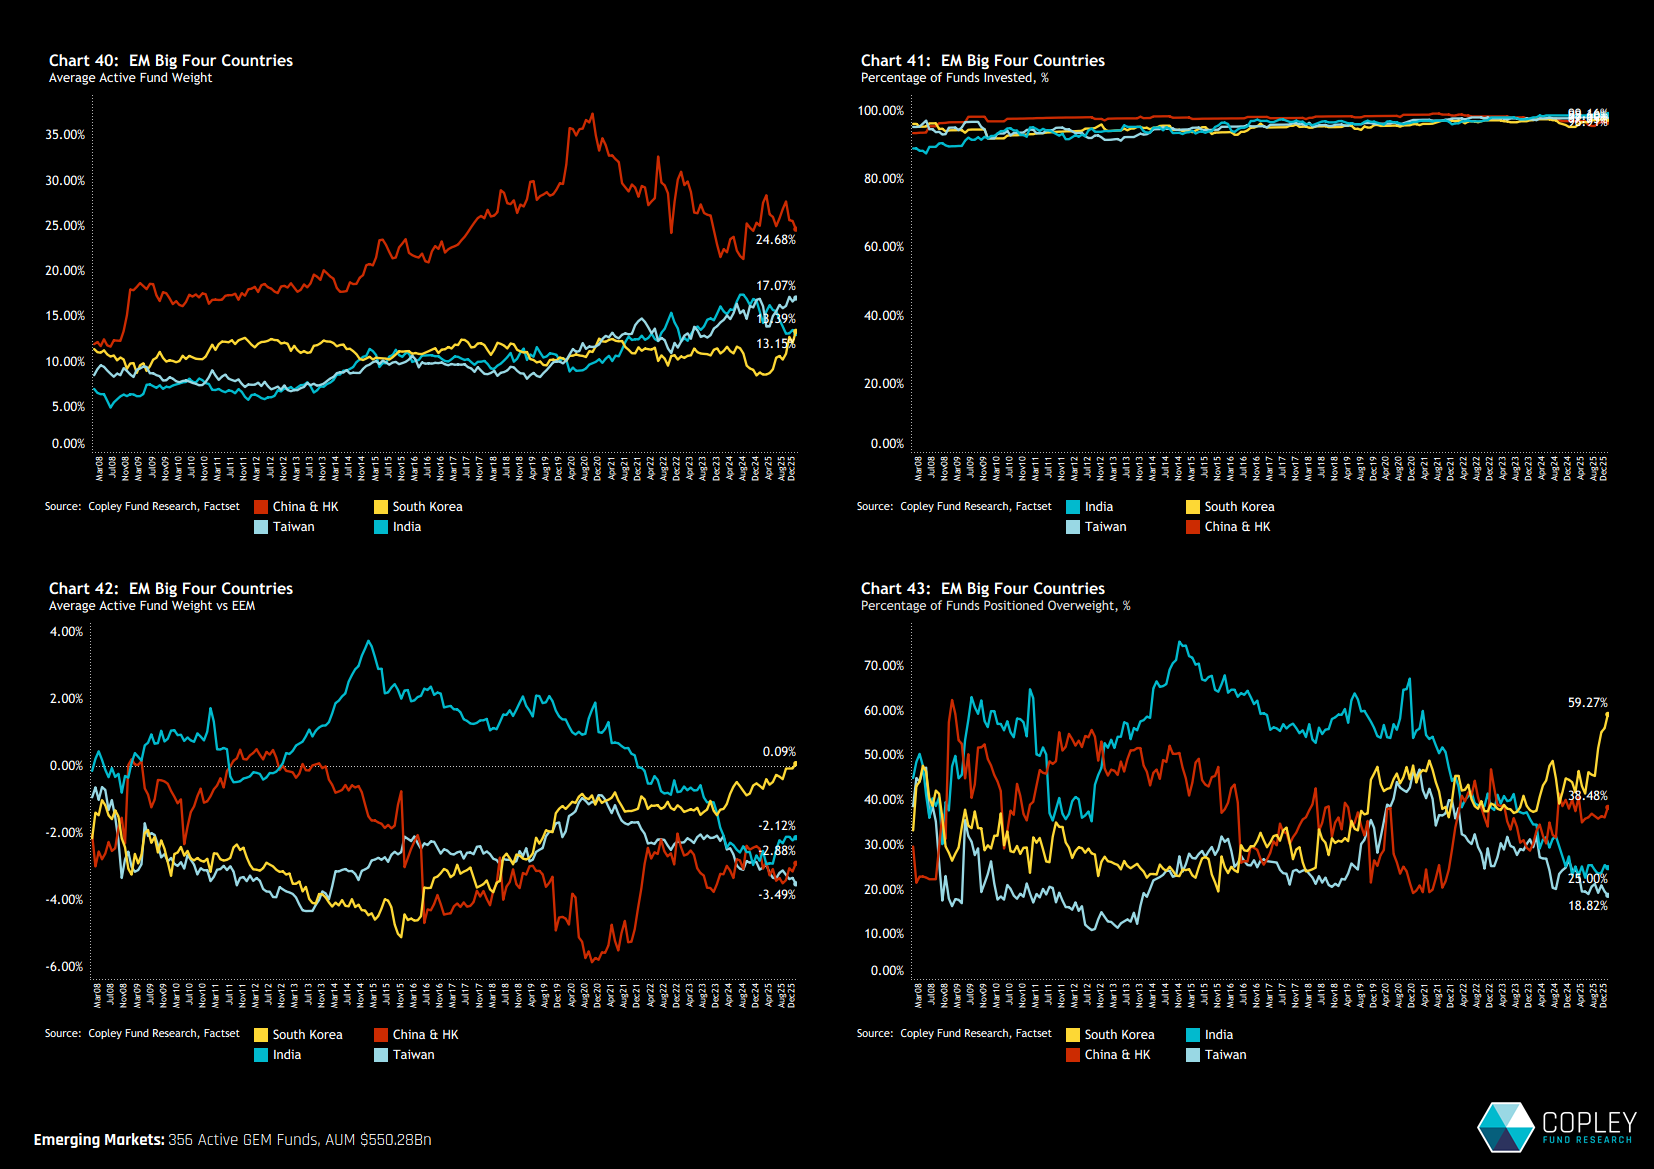
- China’s dominance has continued to fade, with average weights declining from a peak of 37.5% in late 2020 to 24.7% today (chart 40). Despite this reduction, positioning is not uniformly bearish: China & HK is no longer a clear consensus underweight, with 38.5% of funds now positioned ahead of the benchmark (chart 43)
- South Korea has moved decisively higher. Average weights have recovered from the lows and overtaken India (chart 40), positioning has shifted from underweight to roughly neutral versus the benchmark (chart 42), and the proportion of funds overweight has broken out to a new high of 59.3% — this is unchartered territory and reflects a new wave of bullishness among active investors.
- Taiwan has emerged as the largest underweight within the quartet, displacing China, with just 18.8% of funds positioned ahead of the benchmark. As we will see, this skew is largely attributable to a single stock.
- India now represents the smallest allocation among the Big Four. While sentiment has shifted meaningfully over the past two years, the current net underweight of -2.1% shows signs of stabilisation, even as positioning continues to imply expectations of relative underperformance into 2026.
Sector Positioning
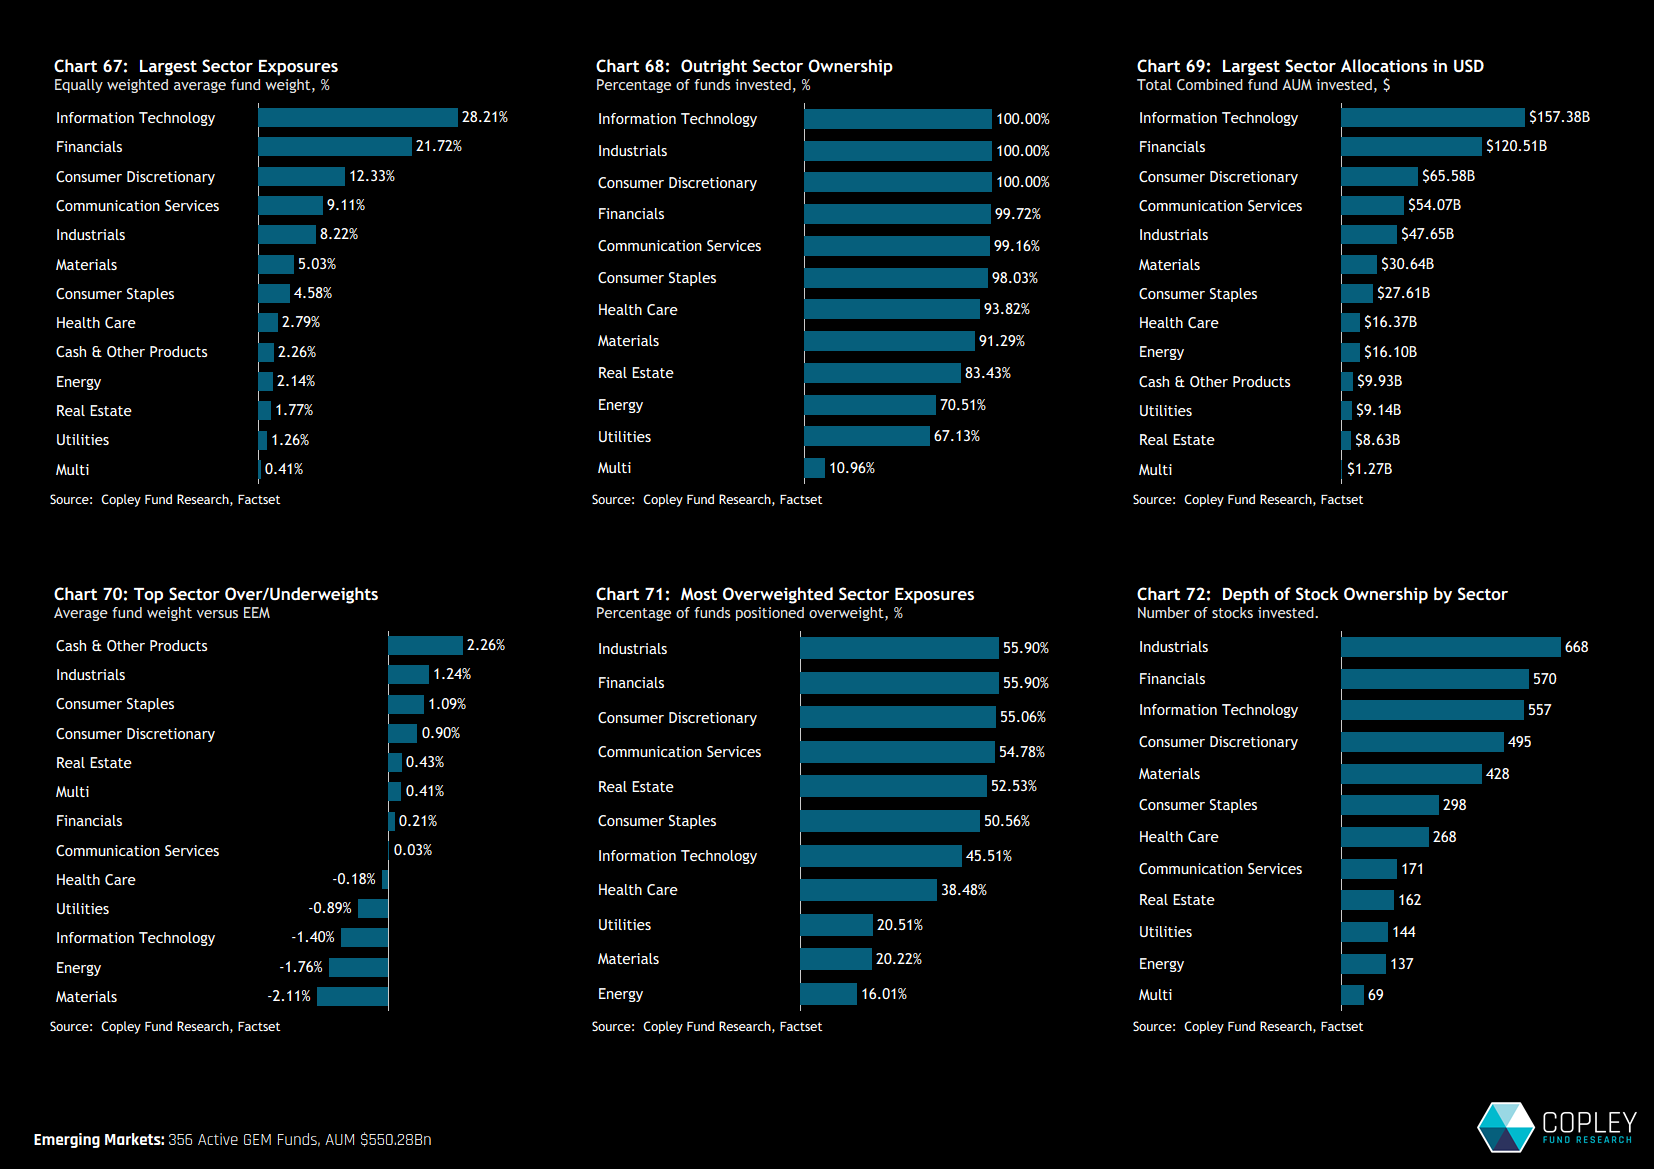
Information Technology and Financials remain the two largest sector exposures, together accounting for close to 50% of total allocations. Consumer Discretionary, Communication Services and Industrials play supporting roles, contributing a further 29.7% (chart 67). All sectors, with the exception of Real Estate, Energy and Utilities, are held by more than 90% of funds.
Relative to the iShares MSCI EM ETF, active funds are underweight both Materials and Energy (chart 70), with only 20% of funds overweight Materials and 16% overweight Energy (chart 71). Technology spent 2025 as a net underweight across active EM funds, while Industrials and the Consumer sectors are positioned at mild overweights. Cash holdings stand at 2.26% and may prove a headwind should EM deliver another year of strong returns.
Sector Rotation in 2025.
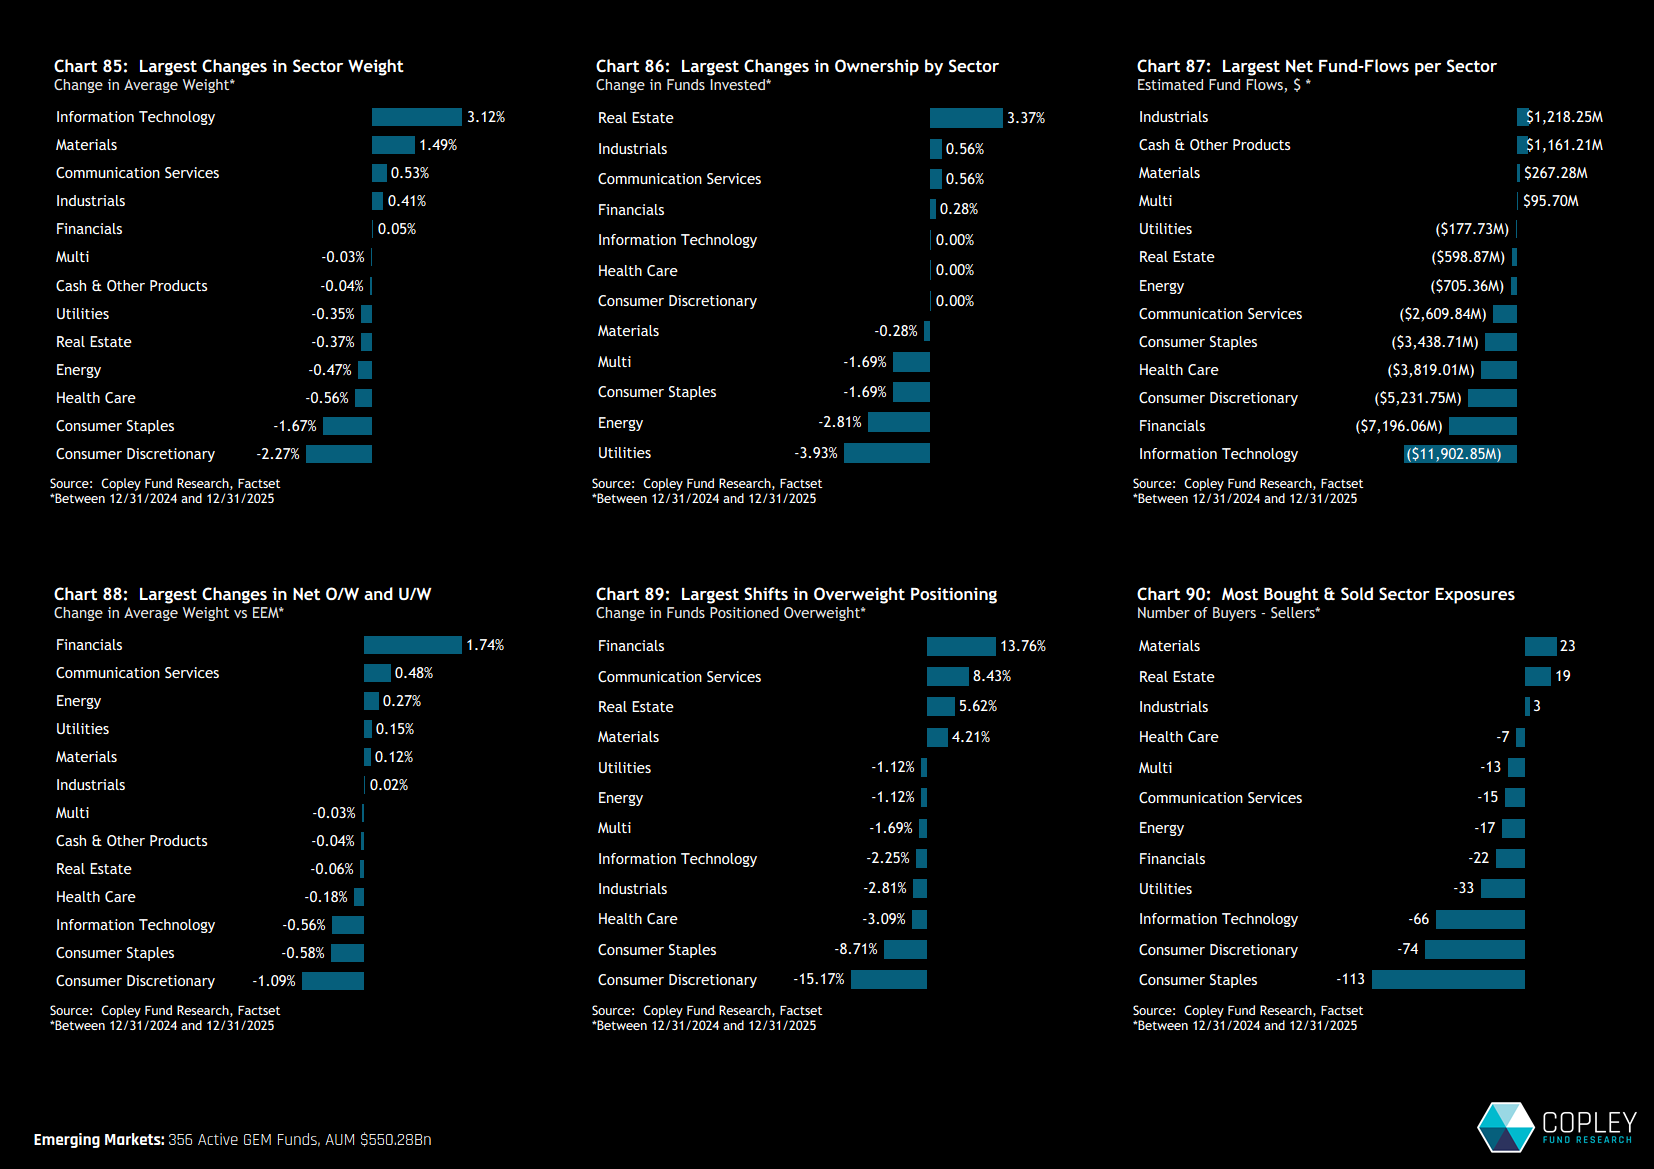
There were large shifts in sector exposures across four key sectors in 2025. Allocations to Technology increased by 3.1% and Materials by 1.5% (chart 85), offset by reductions in Consumer Discretionary (-2.3%) and Consumer Staples (-1.7%). Active ownership metrics across both consumer sectors saw significant decline over the year.
Real Estate gained new exposure, with an additional 3.4% of active EM funds initiating positions, while Utilities saw a reduction of 3.9% of funds and Energy 2.8% (chart 86). A change in Financials sentiment was notable, with managers moving from a net underweight to overweight, driven by 13.8% of funds closing their underweight positions (chart 89).
Defensive Sectors – Long-Term Trends
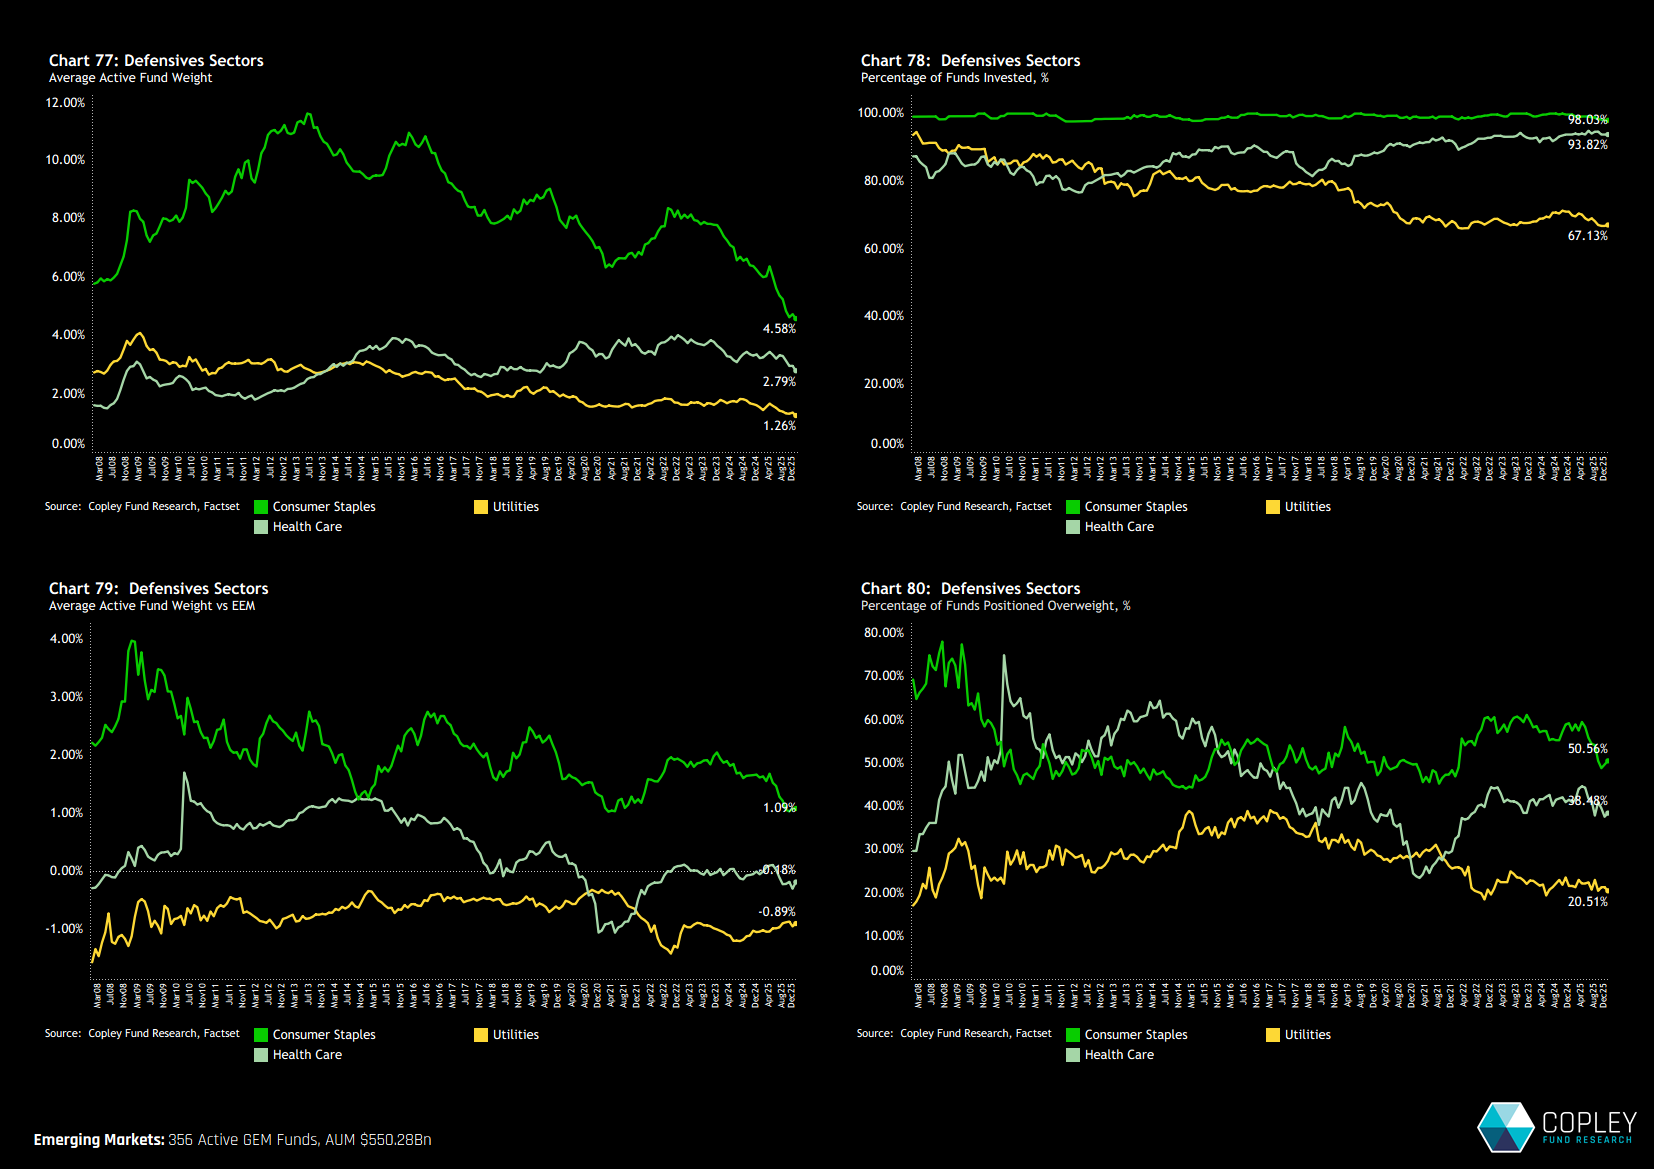
Positioning in the three defensive sectors—Consumer Staples, Health Care and Utilities—remains clearly out of favour. Exposure to both Consumer Staples and Utilities sits at record lows of 4.58% and 1.26% respectively, while Health Care saw further declines in 2025 and continues to struggle to attract meaningful allocations across funds (chart 77).
While this is consistent with a period of strong EM performance, it is notable that aggregate exposure to defensive sectors has never been lower.
Stock Positioning
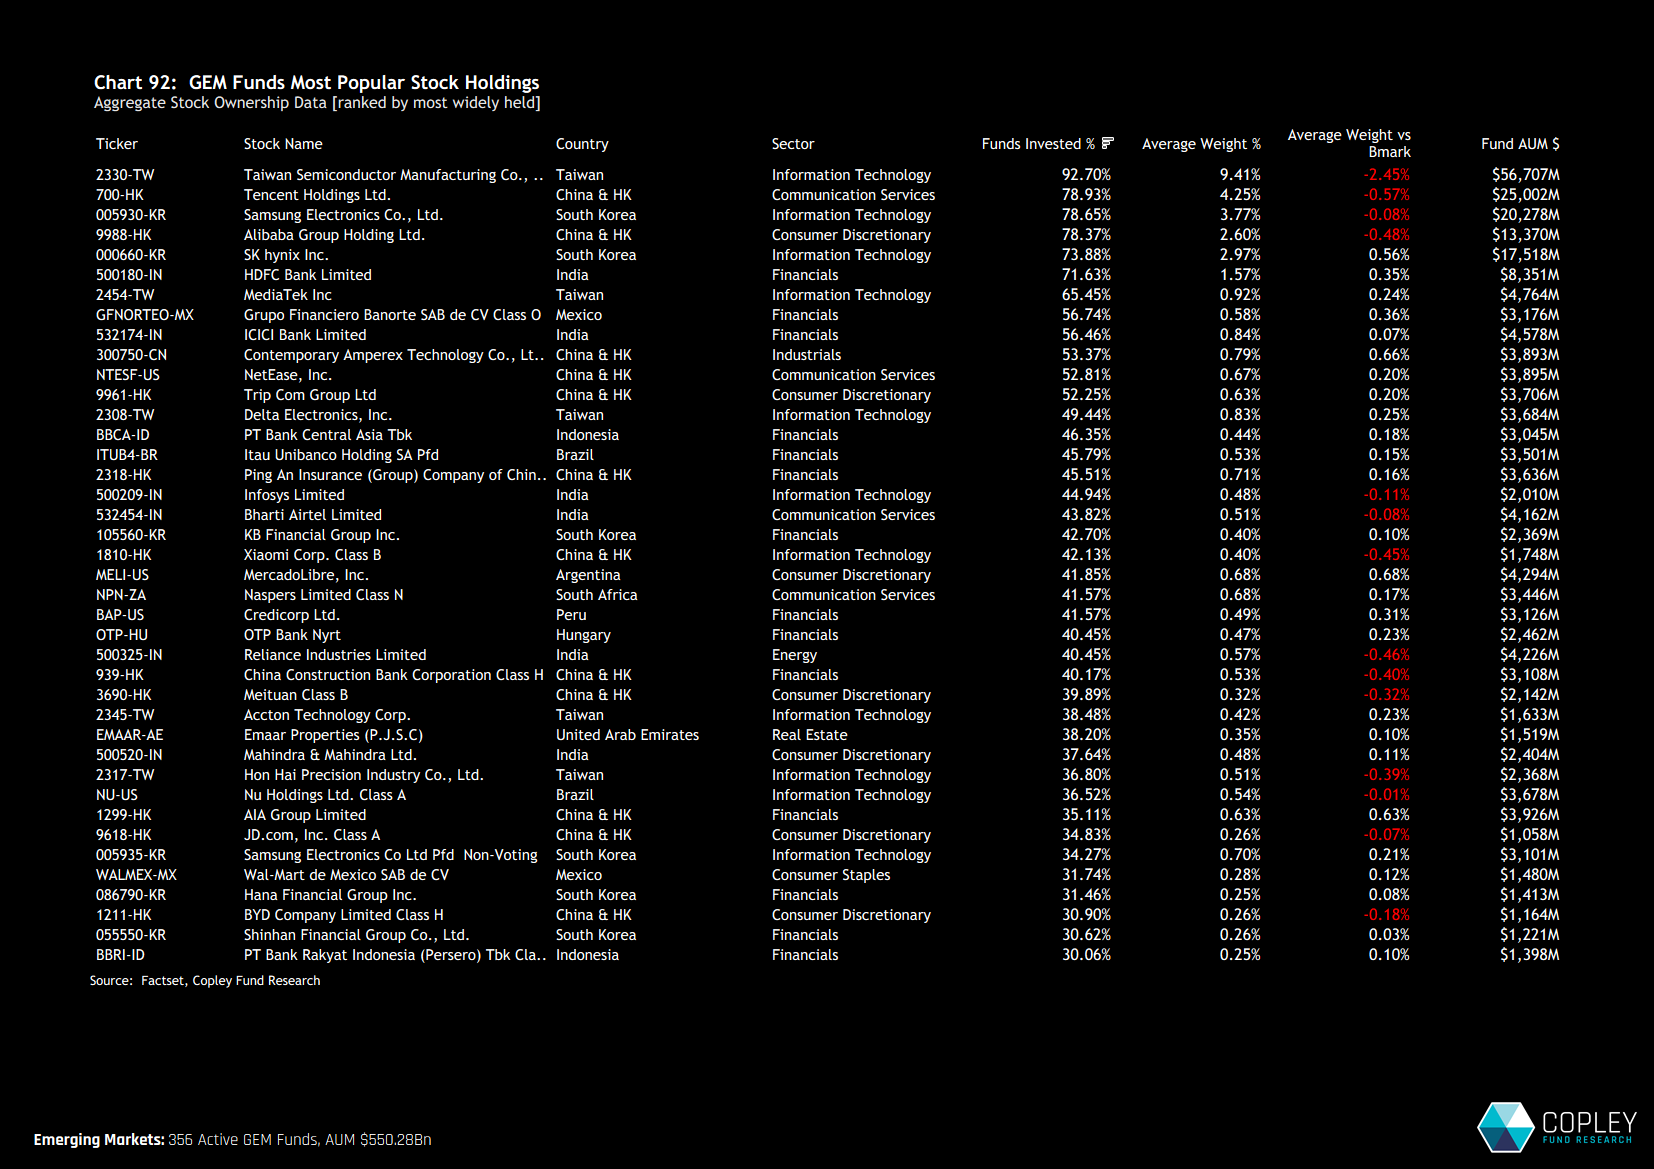
TSMC’s dominance remains firmly intact, with an average portfolio weight of 9.4%, well ahead of the next tier of Tencent, Samsung Electronics and Alibaba Group Holding. Alongside SK Hynix and HDFC Bank, these six stocks are each owned by more than 70% of funds in the analysis. A further six companies are held by more than half of funds, led by MediaTek and Banorte.
TSMC also heads the list of underweights relative to the benchmark, lagging index weights by an average of 2.45%. Tencent and Alibaba are likewise held as marginal underweights across the asset class. These positions are offset by overweights in stocks such as MercadoLibre, Contemporary Amperex Technology and AIA Group.
Stock Rotation in 2025
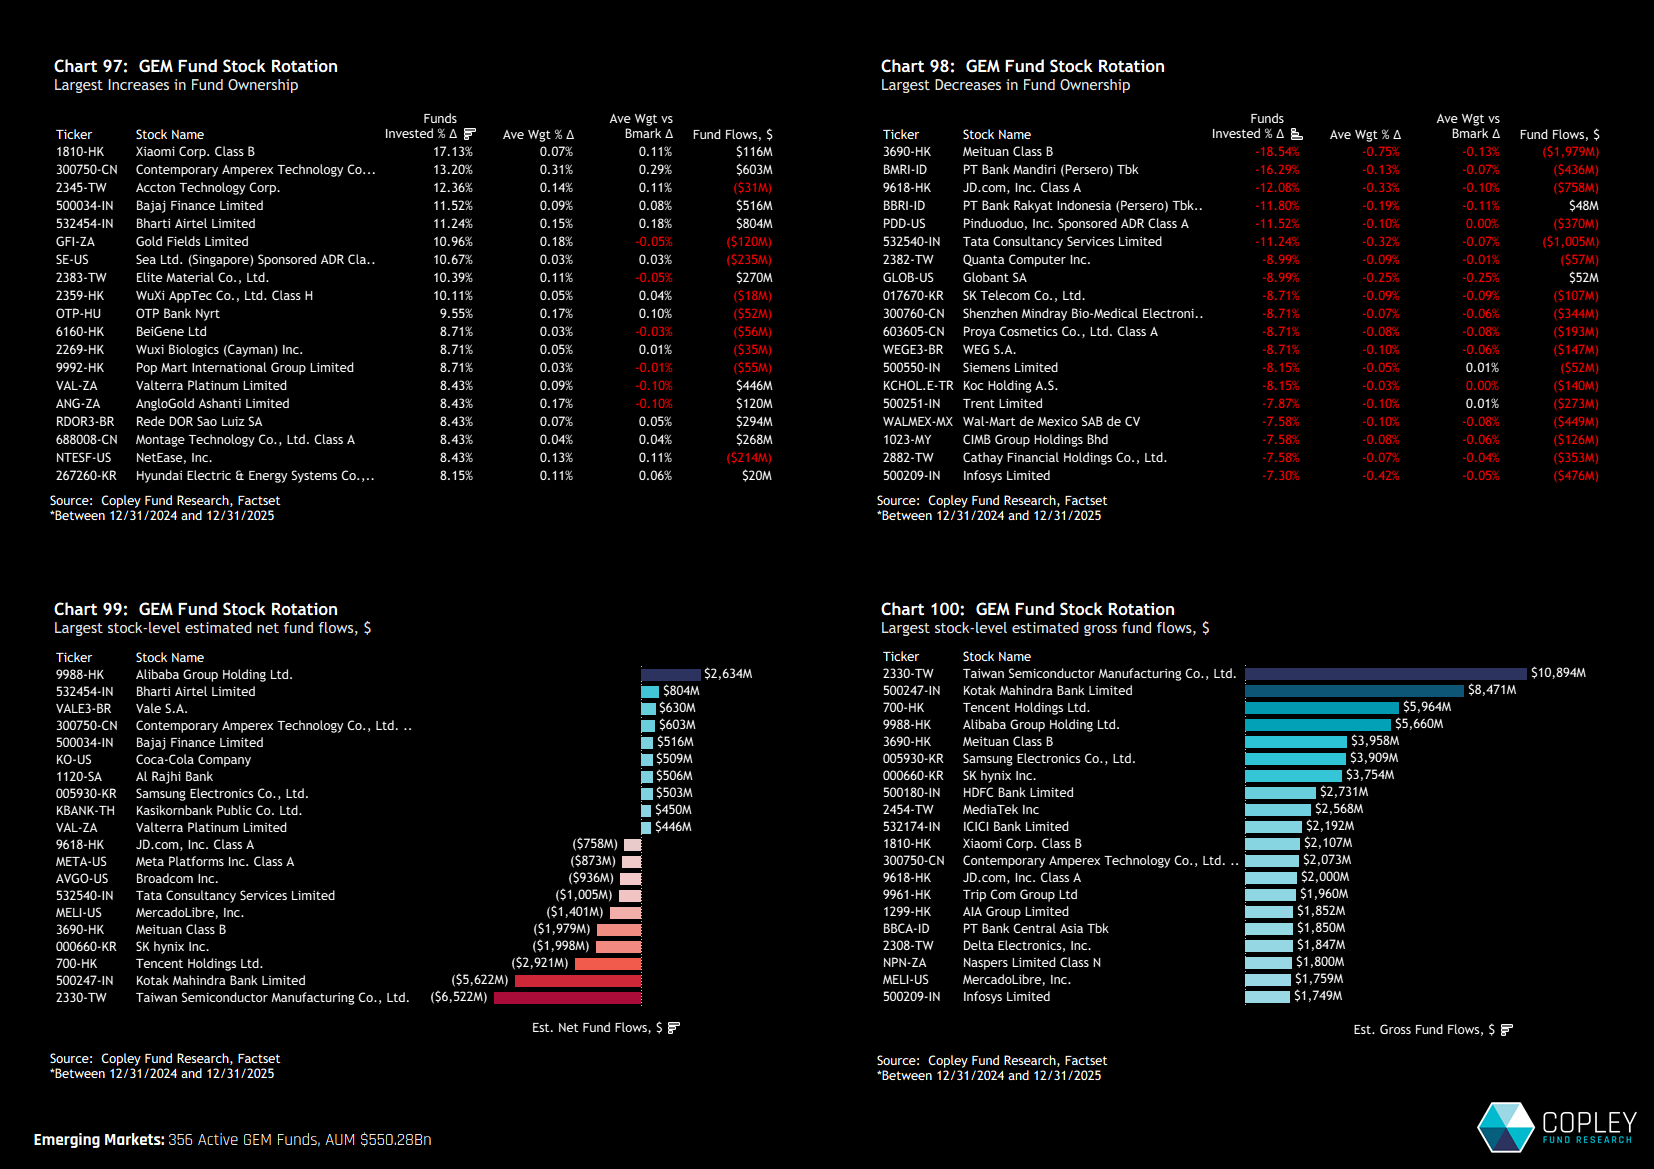
There were several significant shifts in stock-level ownership in 2025, led by sharp increases in fund participation in Xiaomi Corp, CATL and Accton Technology Corp. These three stocks sit at the head of a group of nine names that saw more than 10% of the 356 funds in the analysis initiate new positions during the year (chart 97).
By contrast, Meituan experienced the largest reduction in ownership, with 18.5% of funds exiting positions. This was followed by sizeable position closures in Bank Mandiri, JD.com and Bank Rakyat (chart 98).
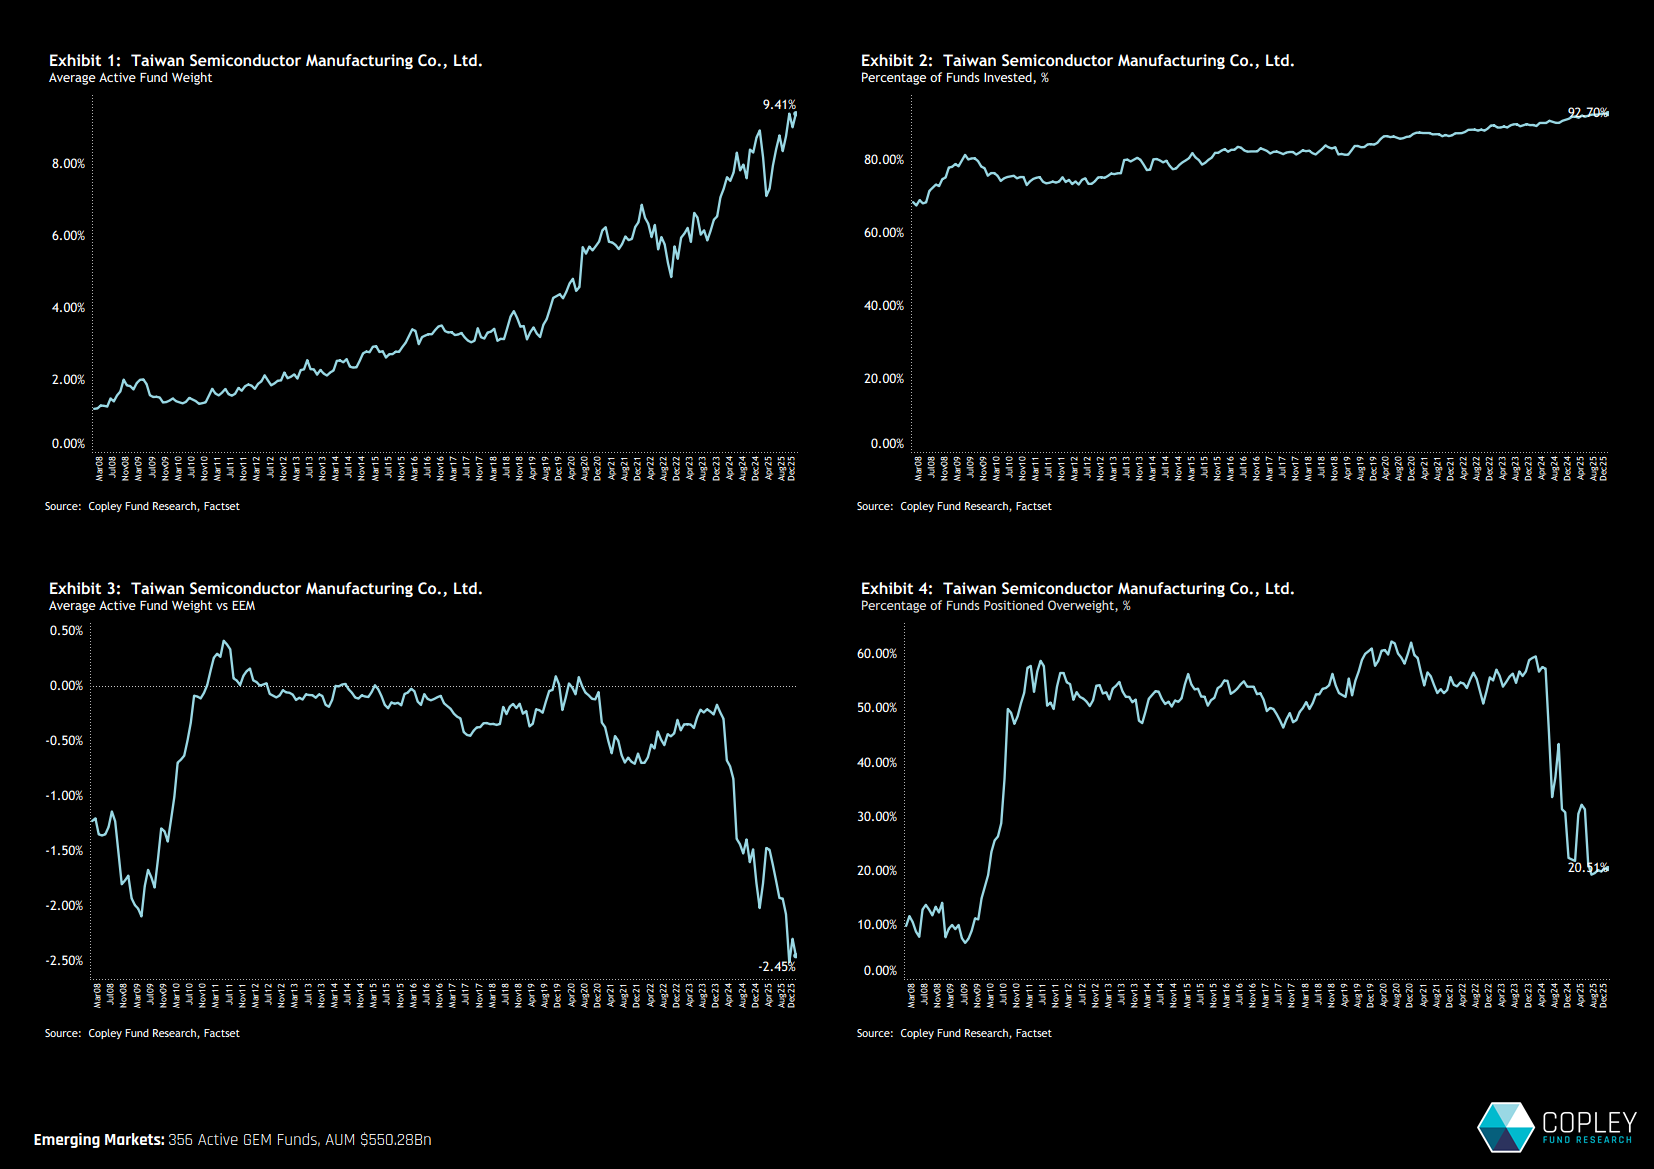
TSMC – Selling in to Strength
Two metrics stand out when plotting TSMC exposure across active EM funds. First is the rise to record highs in both ownership and portfolio weight (Exhibits 1 and 2), with a 9.41% average allocation held by 92.7% of managers, marking the peak for both measures. Second is the sharp widening of the net underweight, as managers increasingly sell into strength to remain within positioning limits, whether self-imposed or mandate-driven.
Just over 20% of managers are positioned overweight TSMC, while the asset class as a whole remains underweight by an average of 2.45% relative to the MSCI EM index. Against this backdrop, returns broadly in line with the index would likely be the preferred outcome for many managers in 2026.
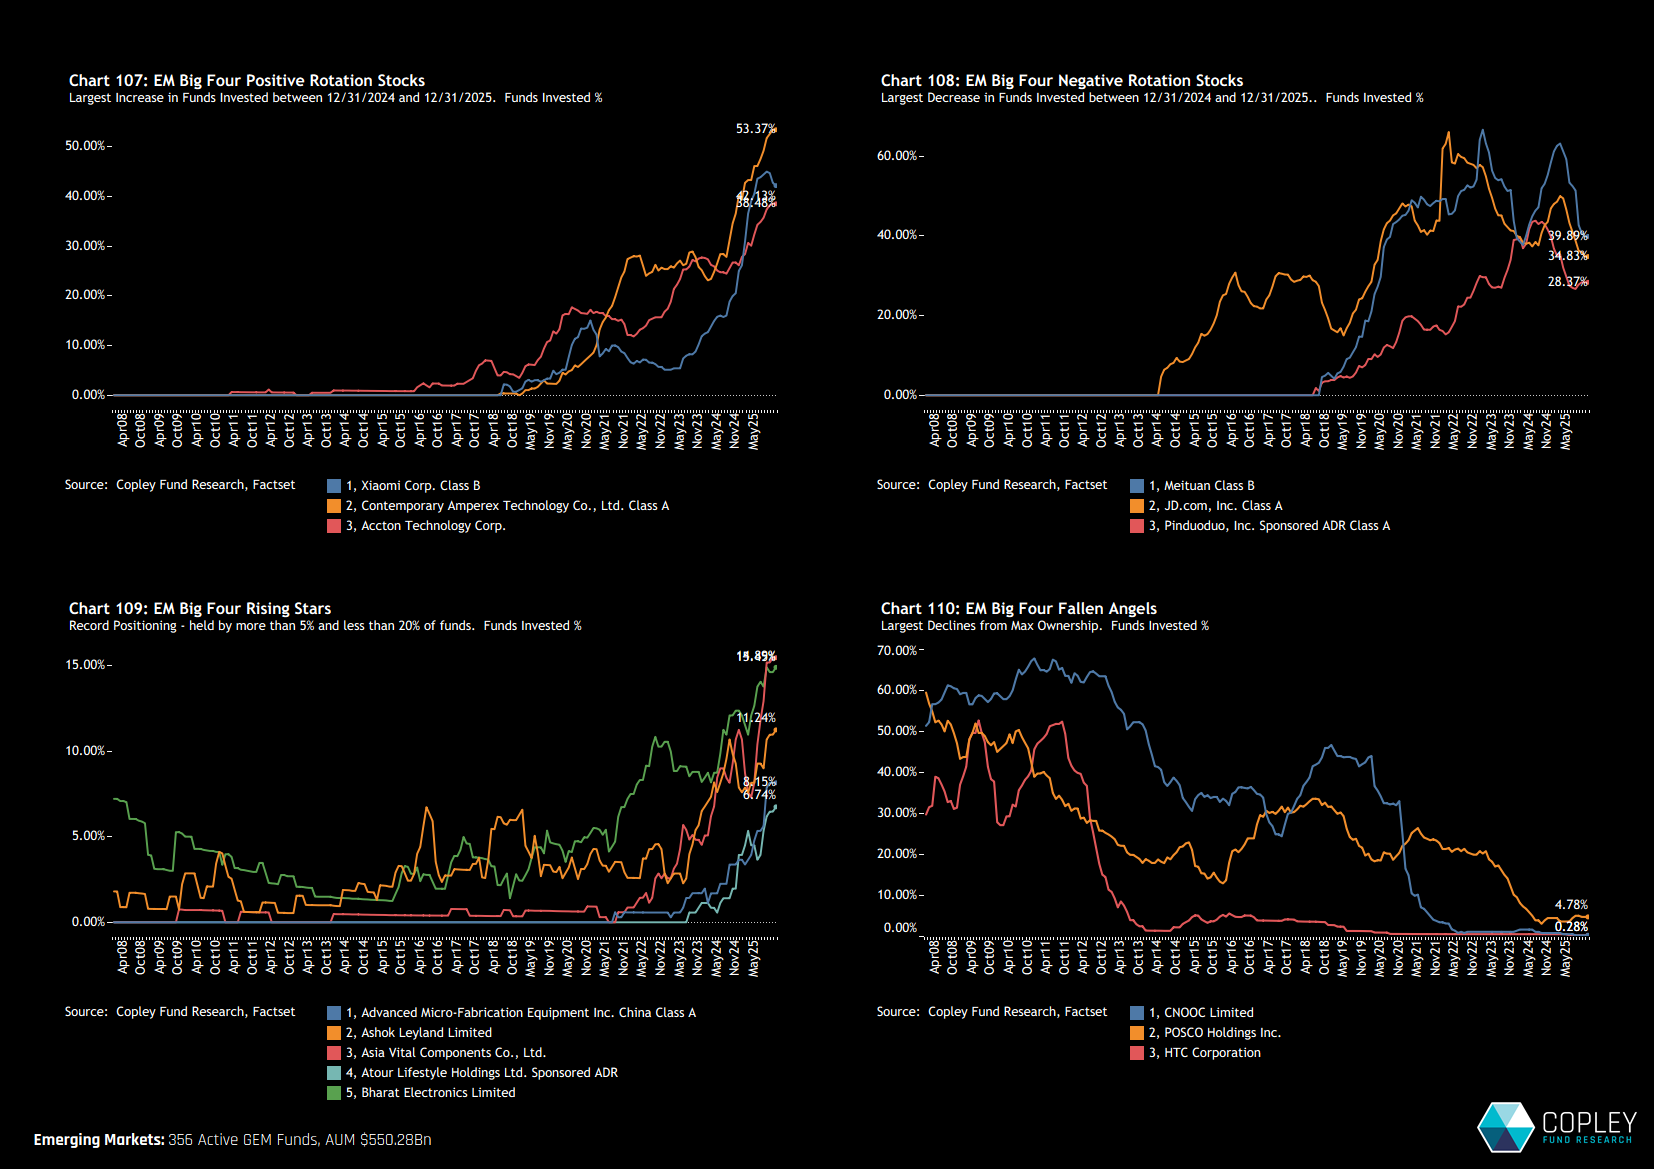
EM Big Four – Stock Trends
We highlight a group of 14 stocks that stand out across China, Taiwan, India and South Korea. Chart 107 shows the three stocks with the largest increases in ownership during 2025, with both CATL and Accton ending the year at all-time highs. Chart 108 highlights the largest reductions. Chart 109 identifies emerging companies in the region that sit at the upper end of their historical ownership ranges but are still held by fewer than 20% of managers. Could stocks such as Asia Vital Components and Bharat Electronics compound growth in the year ahead?
Finally, former mainstays of EM portfolios—CNOOC, HTC Corp and POSCO—have fallen from historically high ownership levels to near-zero representation (chart 110). Whether POSCO can re-emerge alongside a broader recovery in South Korean equities remains an open question.
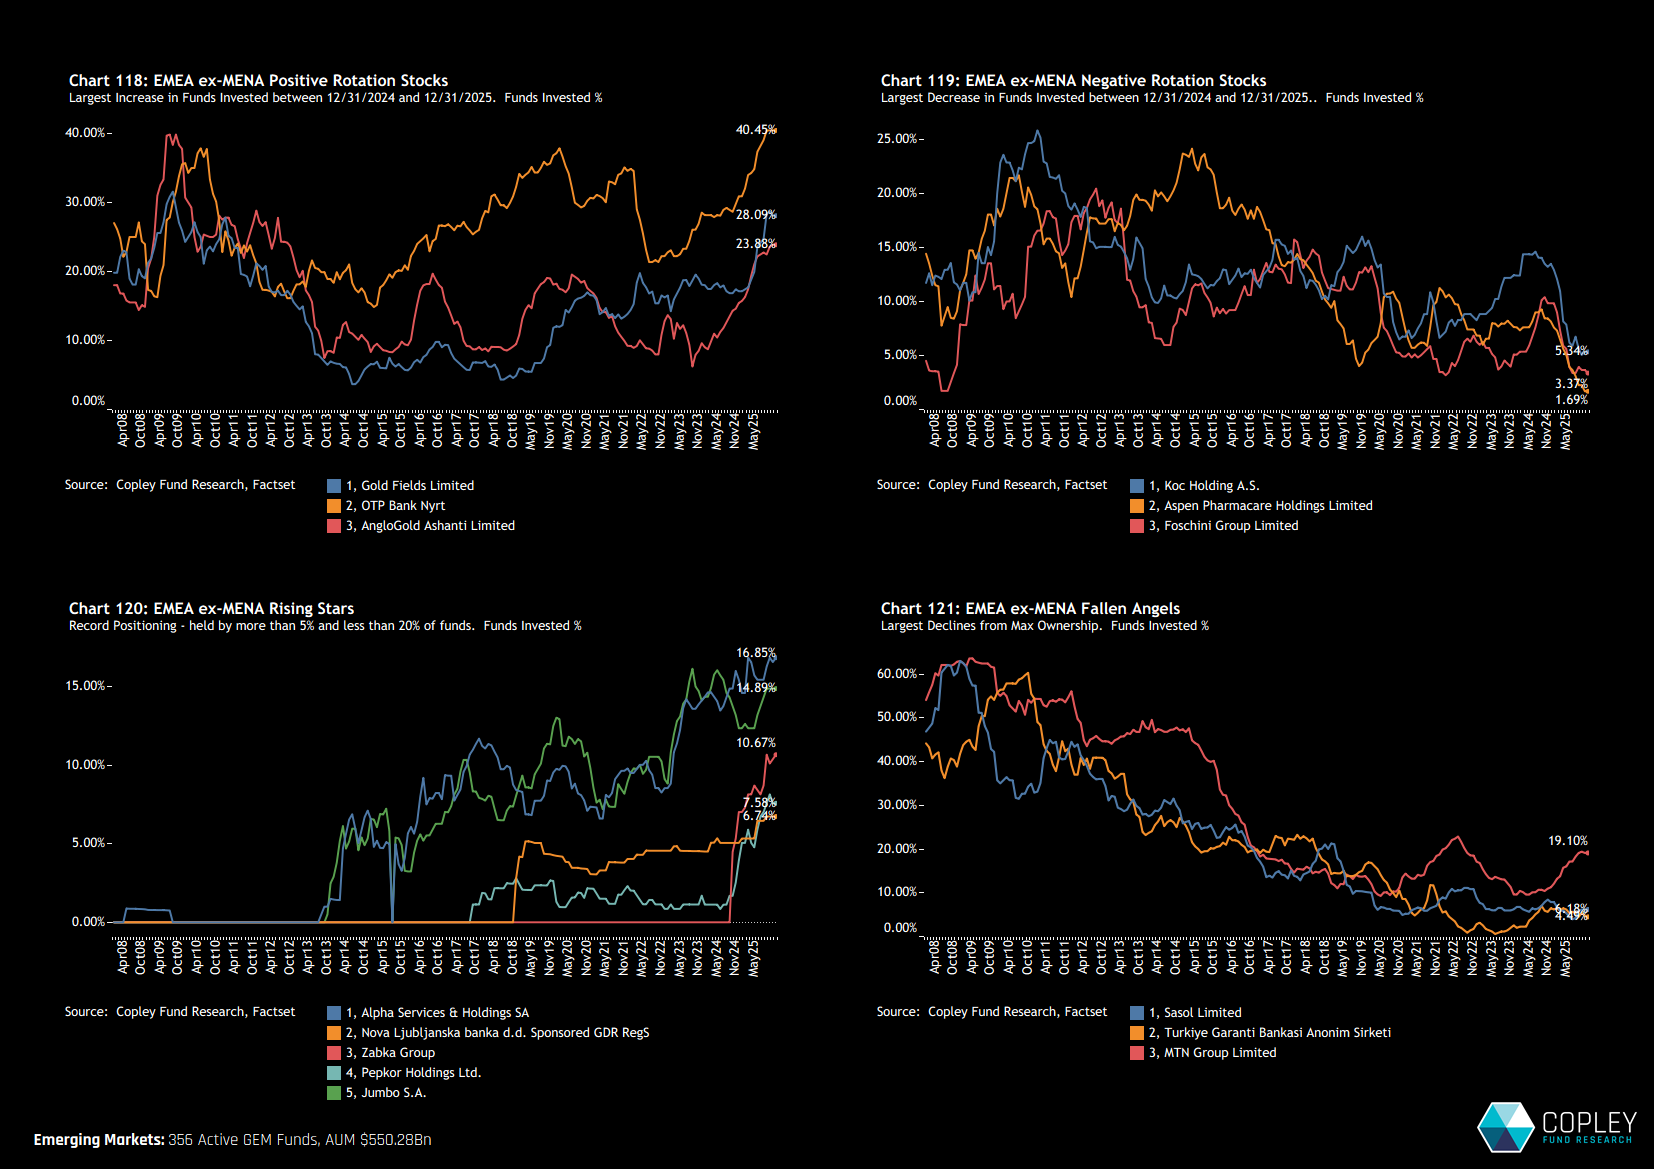
EM Ex-MENA – Stock Trends
South Africa’s major gold miners, Gold Fields and AngloGold Ashanti, have surged to decade-high ownership levels, underscoring a powerful swing back toward precious metals within EM portfolios. Even so, both still trail OTP Bank, which is rapidly closing the gap on Naspers as the most widely held stock in the region (chart 118)
At the other end of the spectrum, Żabka Group and Alpha Services stand out as lightly owned names exhibiting clear positive momentum, suggesting early-stage accumulation by active managers (chart 120). In contrast, Koç Holding and Aspen Pharmacare have fallen to new ownership lows (chart 119).
Chart 121 highlights the three stocks with the largest declines in peer ownership since 2008. While Sasol and Garanti Bank continue to grind lower, MTN Group has staged a notable recovery in ownership—raising the question of whether it can continue to close the gap back toward prior peaks into 2026.
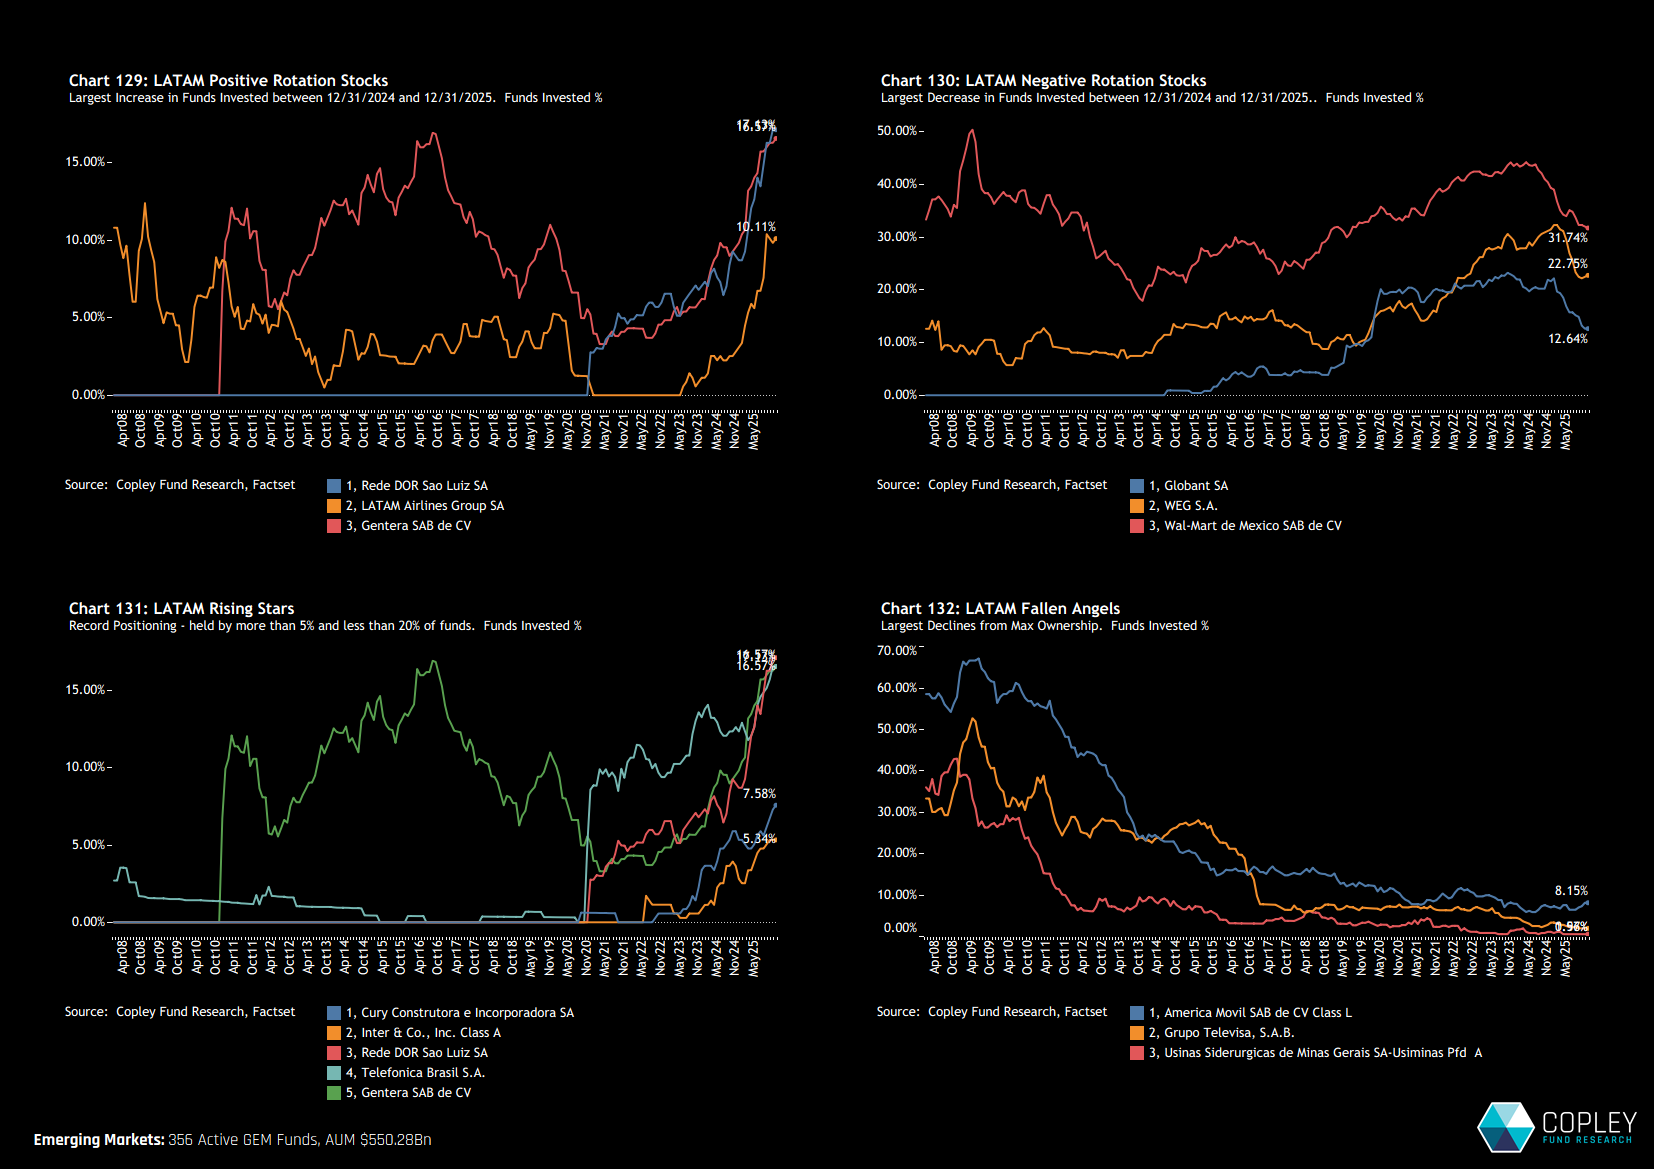
LATAM – Stock Trends
The largest positive ownership gains across LATAM in 2025 came from outside the traditional top tier of regional holdings. Reda DOR features prominently in both Charts 129 and 131, highlighting a combination of record-high ownership levels, strong positive momentum, and—critically—continued under-ownership across the broader EM universe. This profile positions it as a clear non-consensus winner within the region.
In contrast, several established LATAM names struggled into 2026. WEG S.A. and Walmart de México, alongside Globant, saw pronounced declines in EM fund ownership (Chart 130). These companies underscore the shifting nature of capital allocation within LATAM, as leadership rotates away from long-standing consensus holdings. The capitulation has been most extreme in Grupo Televisa and Usinas de Minas Gerais, both of which have been almost entirely exited by active EM investors.
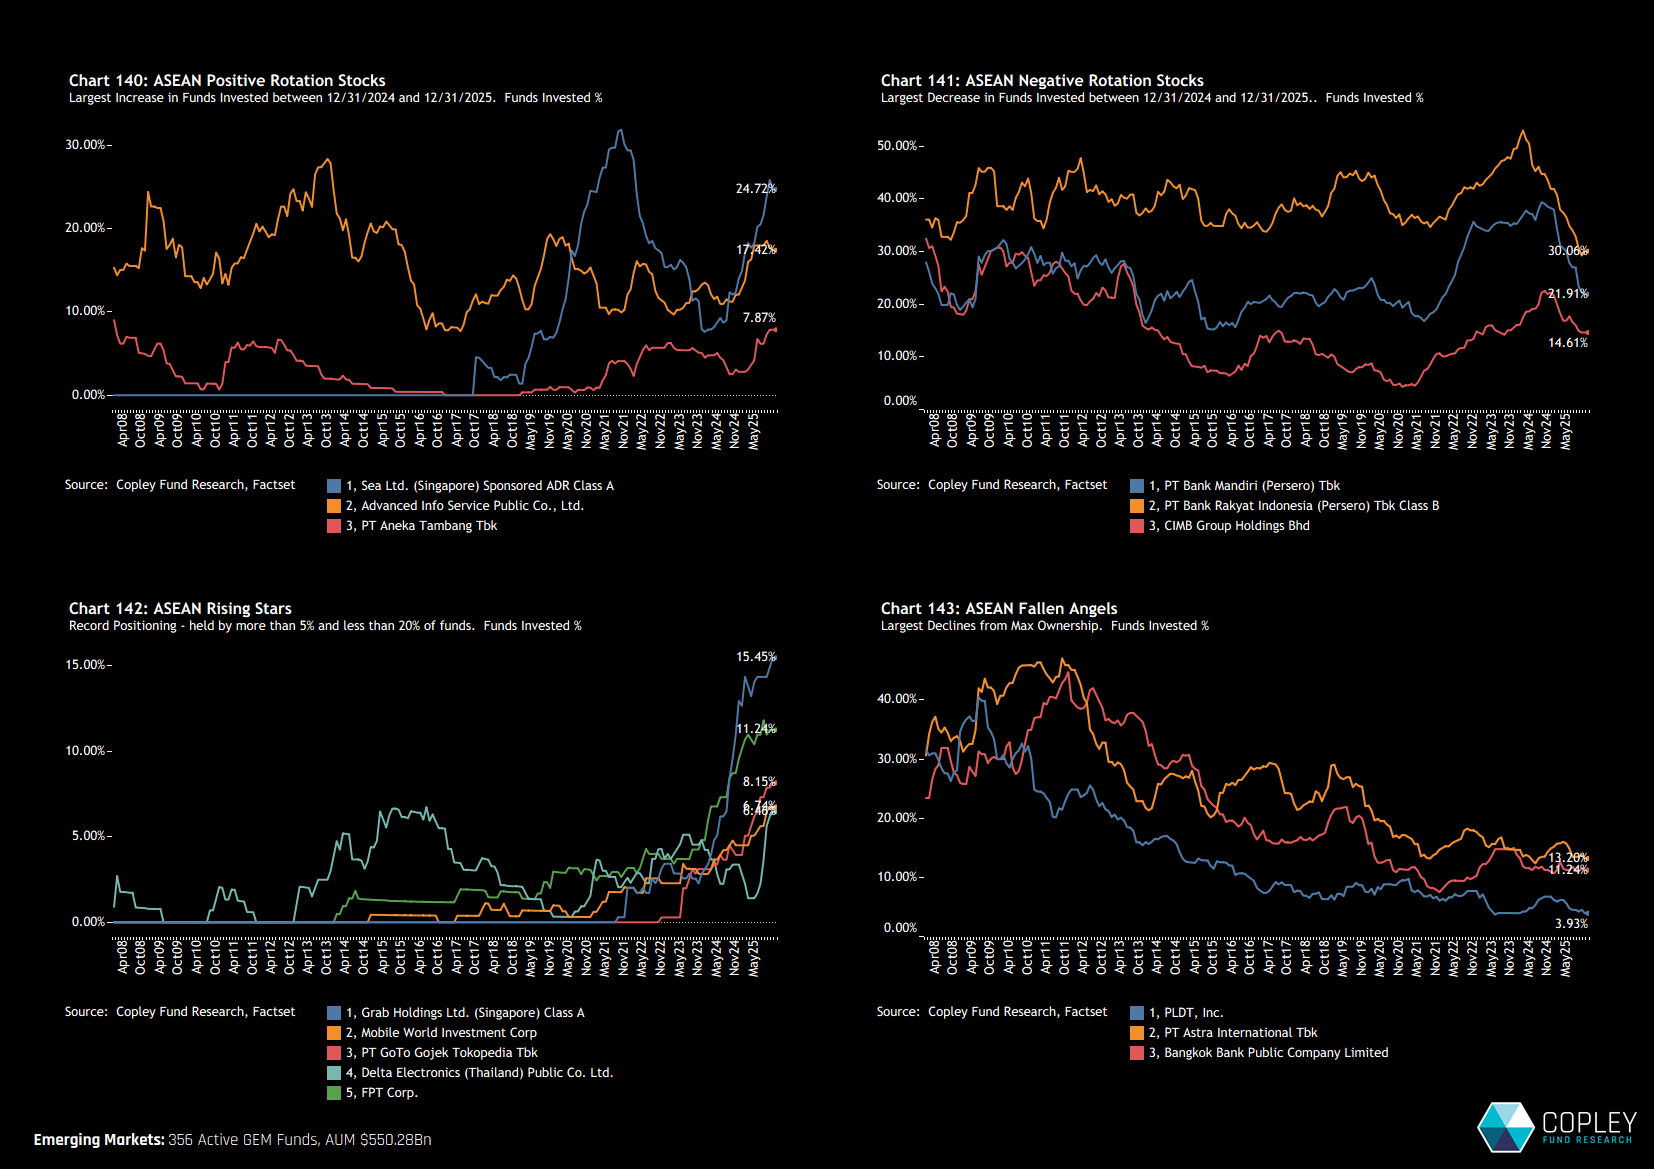
ASEAN – Stock Trends
Two dominant themes emerge from our ASEAN stock analysis. The first is the recovery in ownership of Sea Limited, which peaked at over 30% of EM funds in 2021 before collapsing to just 10% by 2023. Ownership has since rebounded sharply, signalling renewed investor willingness to re-engage with ASEAN consumer internet stocks.
Importantly, this re-engagement is no longer confined to a single name. Grab Holdings is also emerging as a rising ownership story, highlighted in Chart 142, suggesting that improving sentiment is beginning to broaden across the region’s digital leaders rather than remaining a one-stock recovery.
Offsetting this, the second theme is the aggressive unwind in Indonesian banks, which has driven much of the rotation out of Indonesia at the country level. Bank Mandiri and Bank Rakyat Indonesia have borne the brunt of the selling, marking a clear shift away from what had been core, consensus exposures.
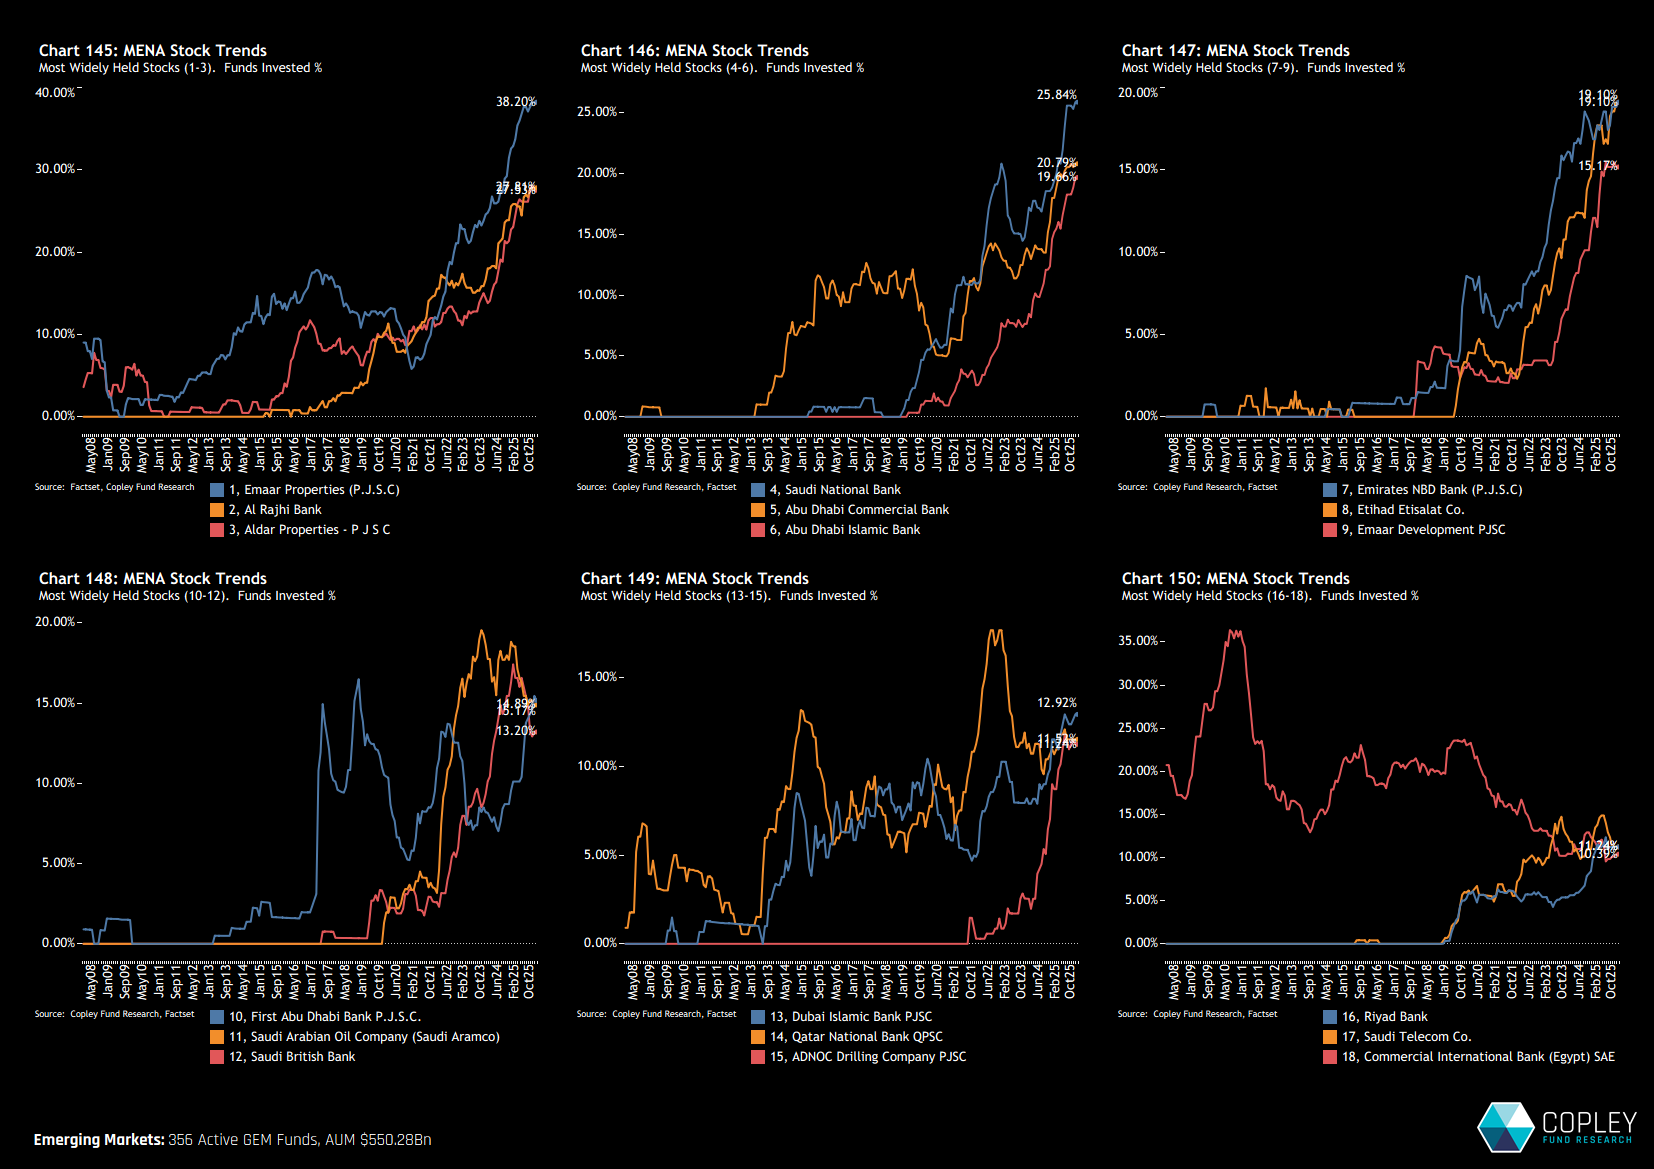
MENA – Stock Trends
The charts below track the evolution of fund ownership across the 18 most widely held companies in the MENA region. At a glance, they convey a clear message on both momentum and engagement: all of the top nine names are now at record ownership levels. MENA is rapidly establishing itself as a source of core positions within EM portfolios, with Emaar Properties having recently entered the top 30 most widely held stocks across the global EM universe.
While there have been periodic pauses along the way, these have been the exception rather than the rule. Saudi Aramco, for example, remains well below its prior ownership peak, and Qatar National Bank is consolidating after the sharp surge in ownership seen during 2021–2022. Even so, these instances stand out against an otherwise broad-based and sustained increase in investor engagement with the region.
Related Posts

- Steve Holden
- May 21, 2026
India: After the Euphoria
China allocations have recovered from the lows, but momentum has stalled—masking active shift ..

- Steve Holden
- December 14, 2025
Materials: The Recovery Trade
China allocations have recovered from the lows, but momentum has stalled—masking active shift ..

- Steve Holden
- April 28, 2026
China Industrials: Bullish Positioning Strengthens Further
China allocations have recovered from the lows, but momentum has stalled—masking active shift ..

