UK Active Equity
Active UK Funds: Performance & Attribution 2025
January 13th 2026
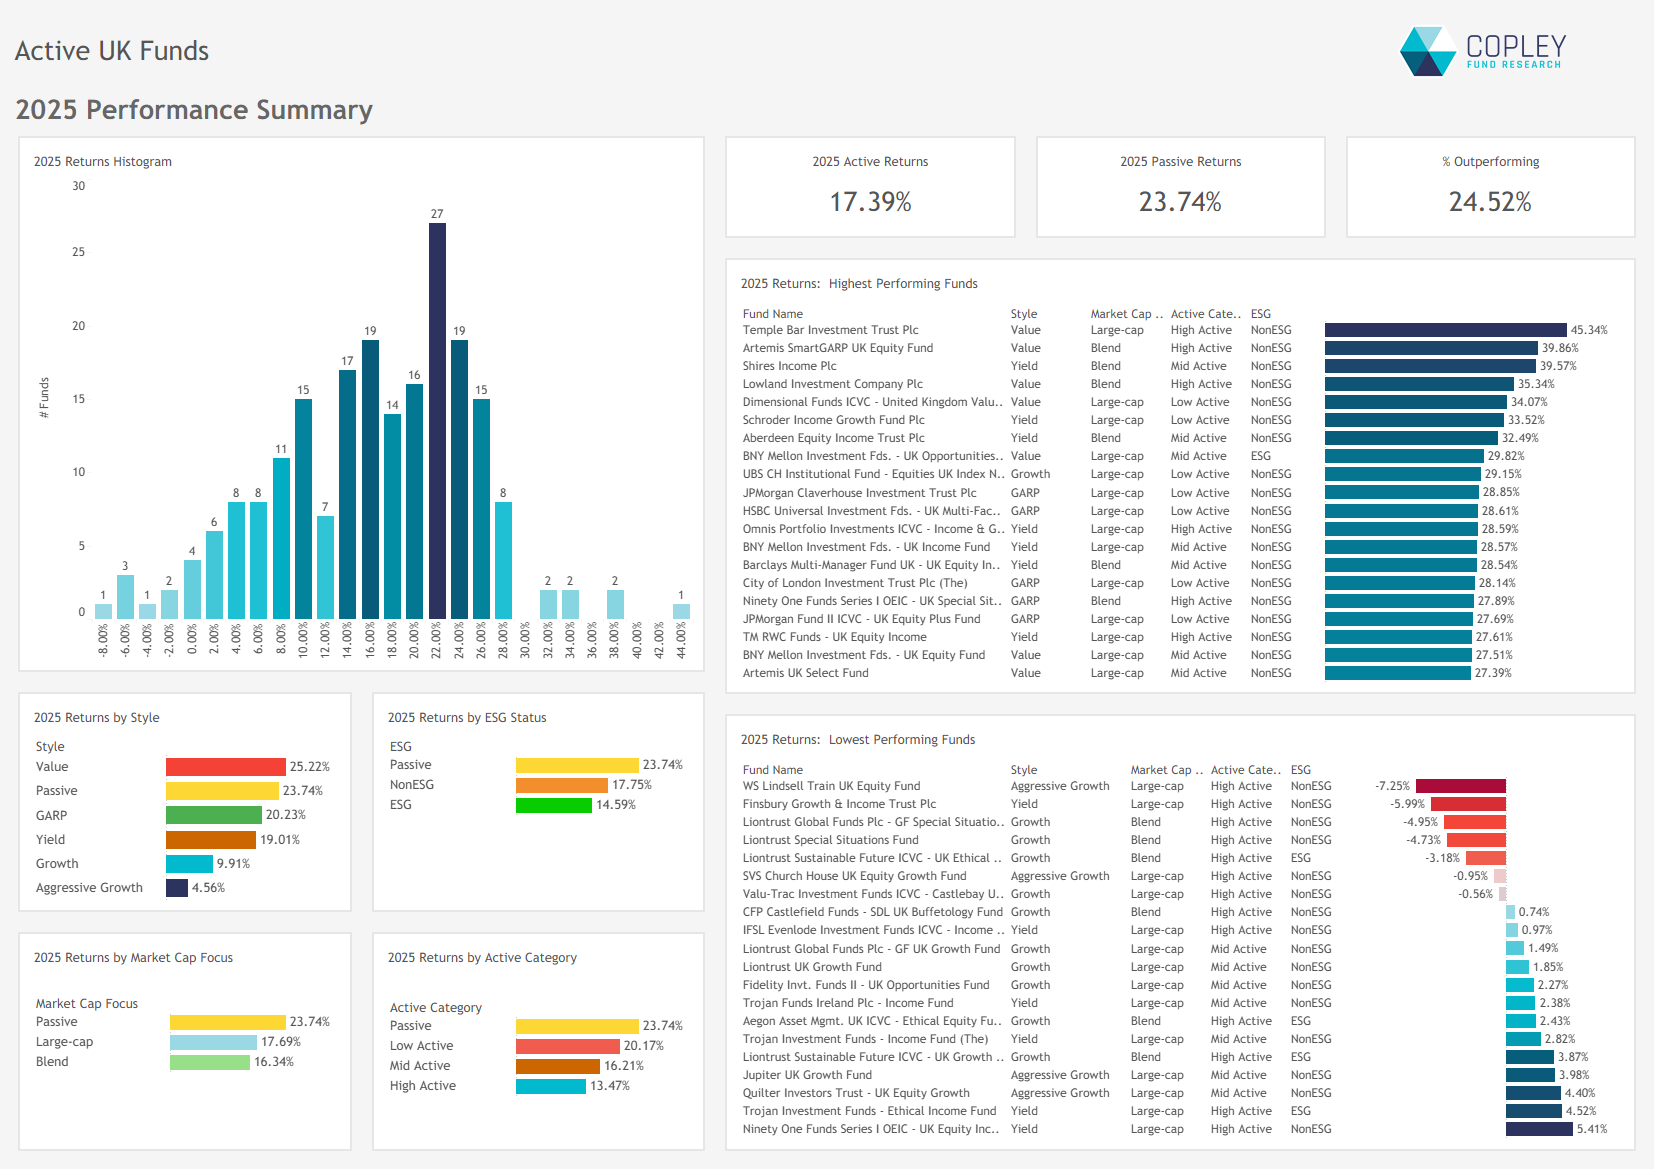
- Active UK equity funds posted strong absolute returns in 2025, averaging 17.4 percent, but lagged the FTSE All Share index by over six percentage points, with only one in four funds outperforming the benchmark.
- Performance was driven by Financials, particularly Banks and Brokers, while underweights to a handful of mega-cap stocks — notably Rolls-Royce and HSBC — significantly hurt relative returns.
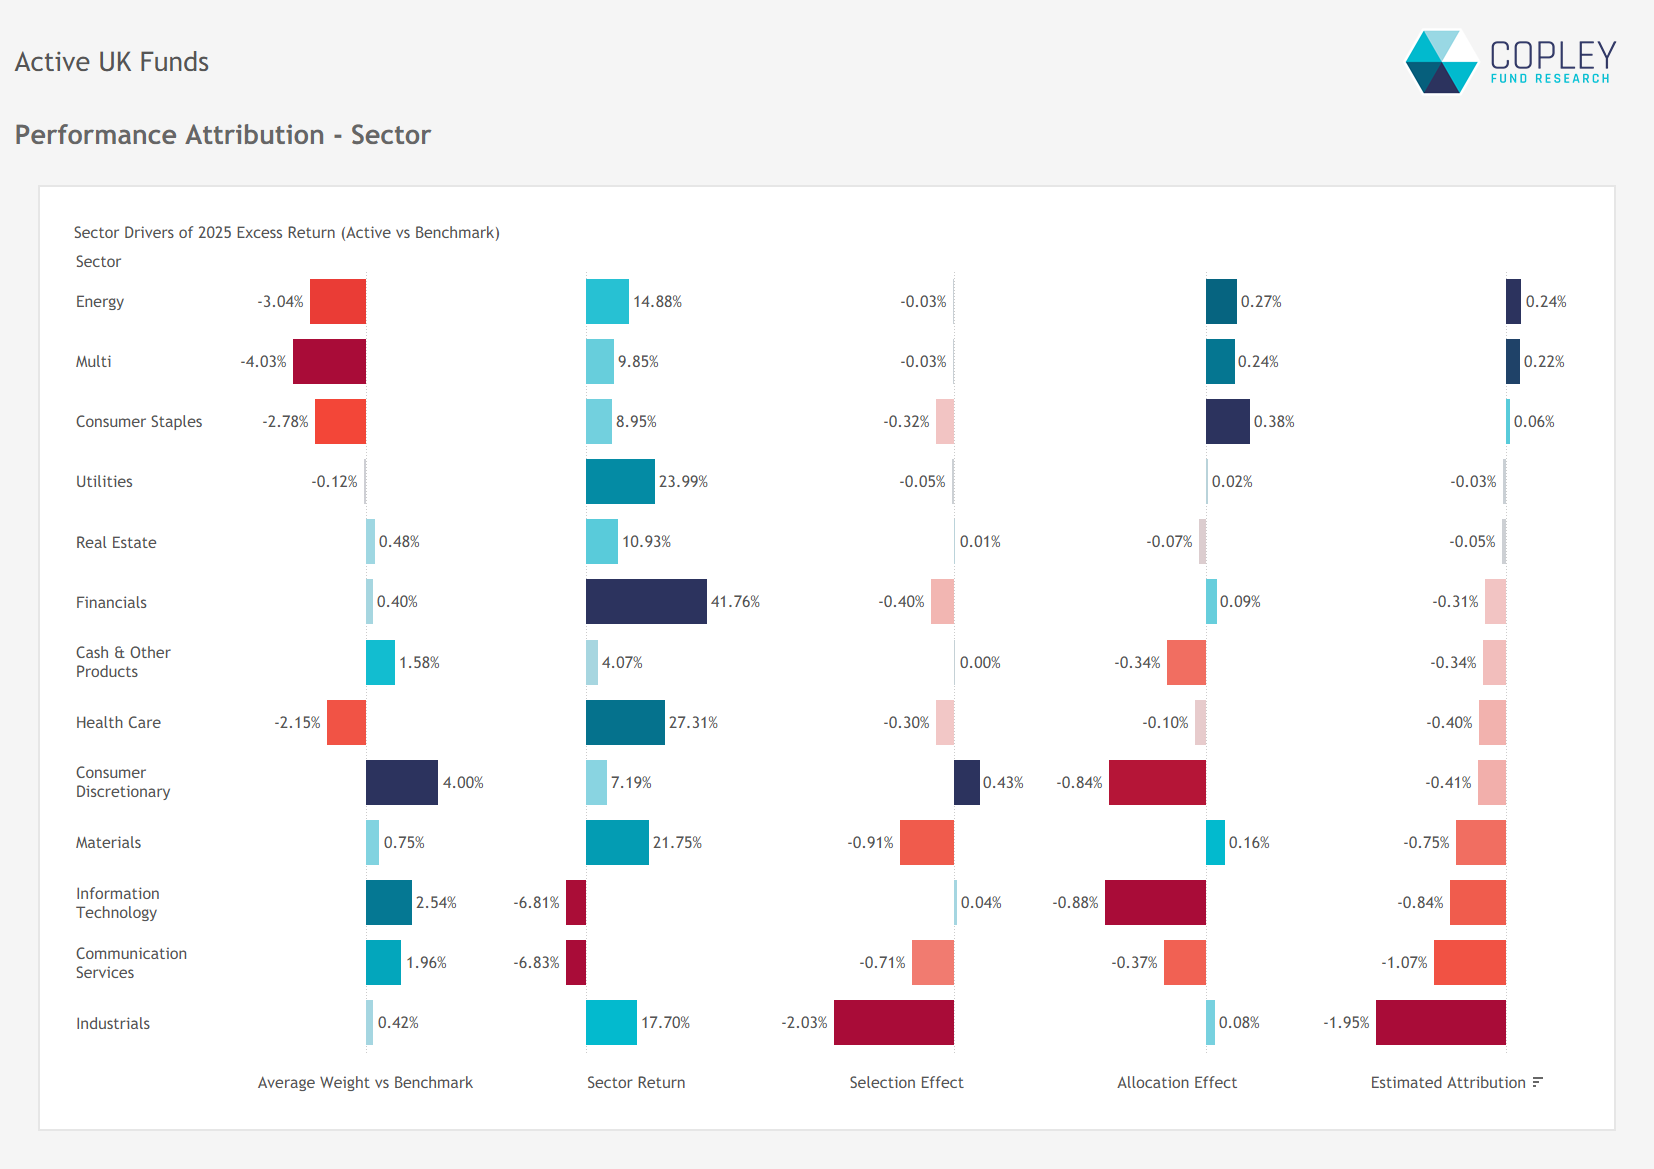
- Stock selection across most sectors detracted from performance, with Industrials, Information Technology, and Consumer Discretionary the most challenging areas for active managers.
- 2025 marked the worst year on record for relative performance, with the average fund underperforming the benchmark ETF by 6.6 percentage points — bringing the 10-year underperformance gap to nearly 29 percent.
- The FTSE All Share’s high and persistent concentration raises questions about its suitability as a benchmark, as passive exposure now mimics the concentration levels of high-conviction active portfolios, but without the intellectual framework or rationale behind those weights.
Strong returns, but a benchmark hard to beat
On the face of it, 2025 was a good year for active UK funds. Average returns came in at 17.4 percent, led by the Value cohort which averaged 25.2 percent, but weighed down by lacklustre returns from Growth (9.9 percent) and Aggressive Growth (4.6 percent). There were stellar performances from individual strategies, with Temple Bar Investment Trust, Artemis SmartGARP, and Shires Income leading a group of seven funds that posted returns in excess of 30 percent for the year.
All this would paint a positive picture, were it not for the FTSE All Share index return of 23.7 percent — more than six percentage points ahead of the average active fund. Only 24.5 percent of funds managed to outperform the benchmark over the year.
Breaking down the 2025 return: Financials drive performance
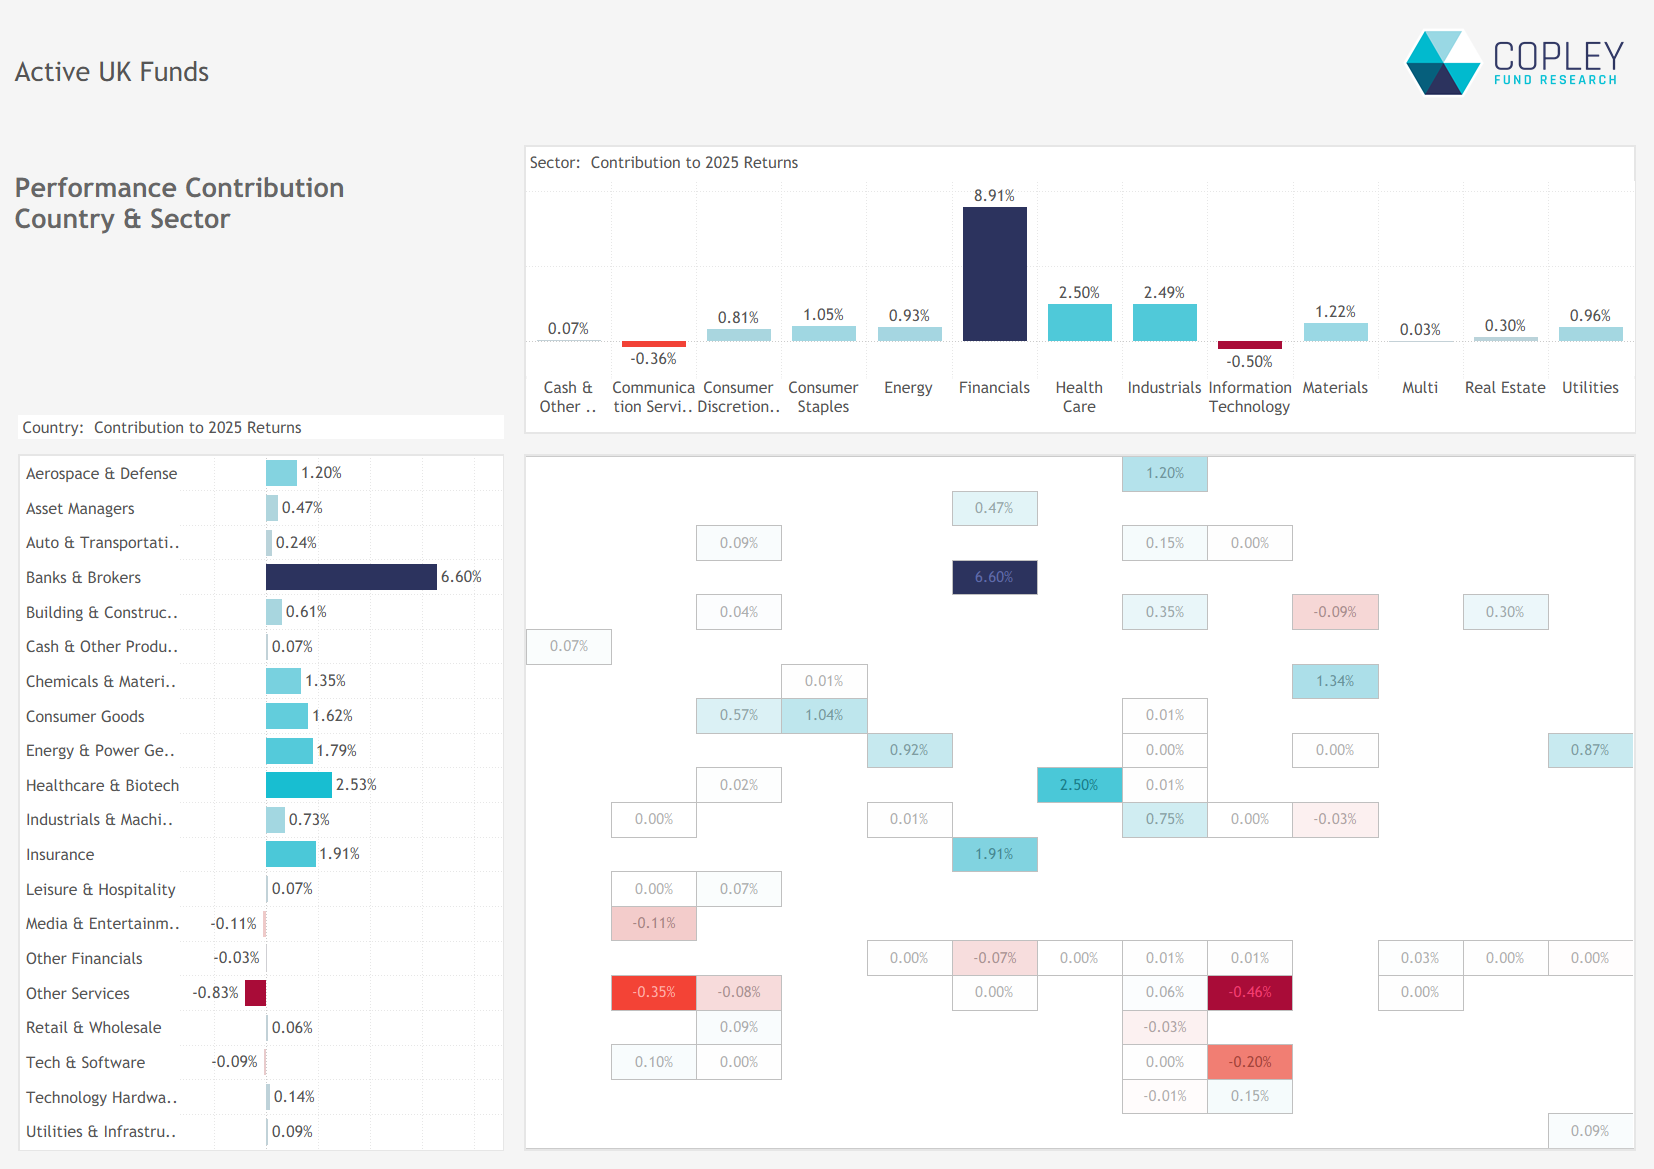
The 17.4 percent average return for active UK funds in 2025 was underpinned by strong contributions from the Financials sector, particularly Banks and Brokers. Financials alone added 8.9 percentage points to the annual return, with smaller positive contributions from Health Care, Industrials, and Materials. In contrast, both Communication Services and Information Technology detracted from performance over the year.
At the industry level, Banks and Brokers were supported by strong showings from Aerospace & Defence, Healthcare & Biotech, and Insurance. Meanwhile, the catch-all ‘Other Services’ category was the single largest detractor, taking 0.83 percentage points off the annual return.
Stock-Level Influence: The Magnificent Seven?
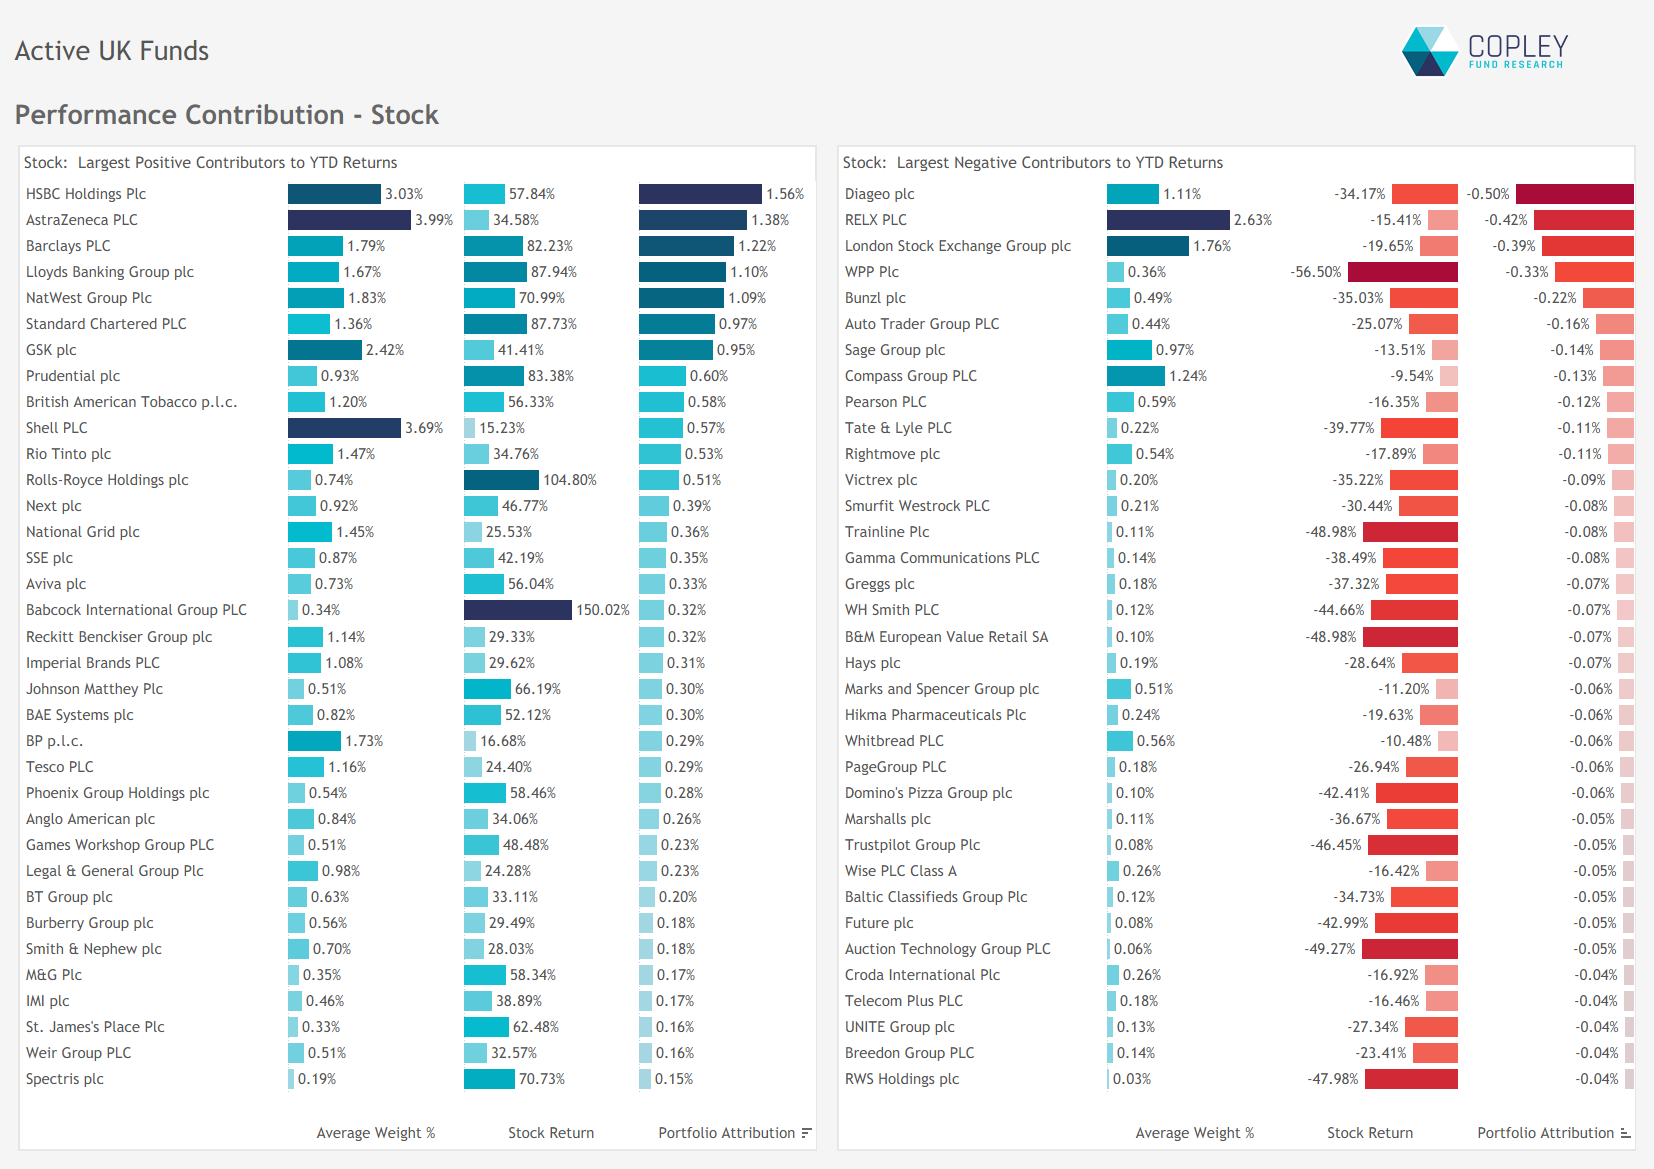
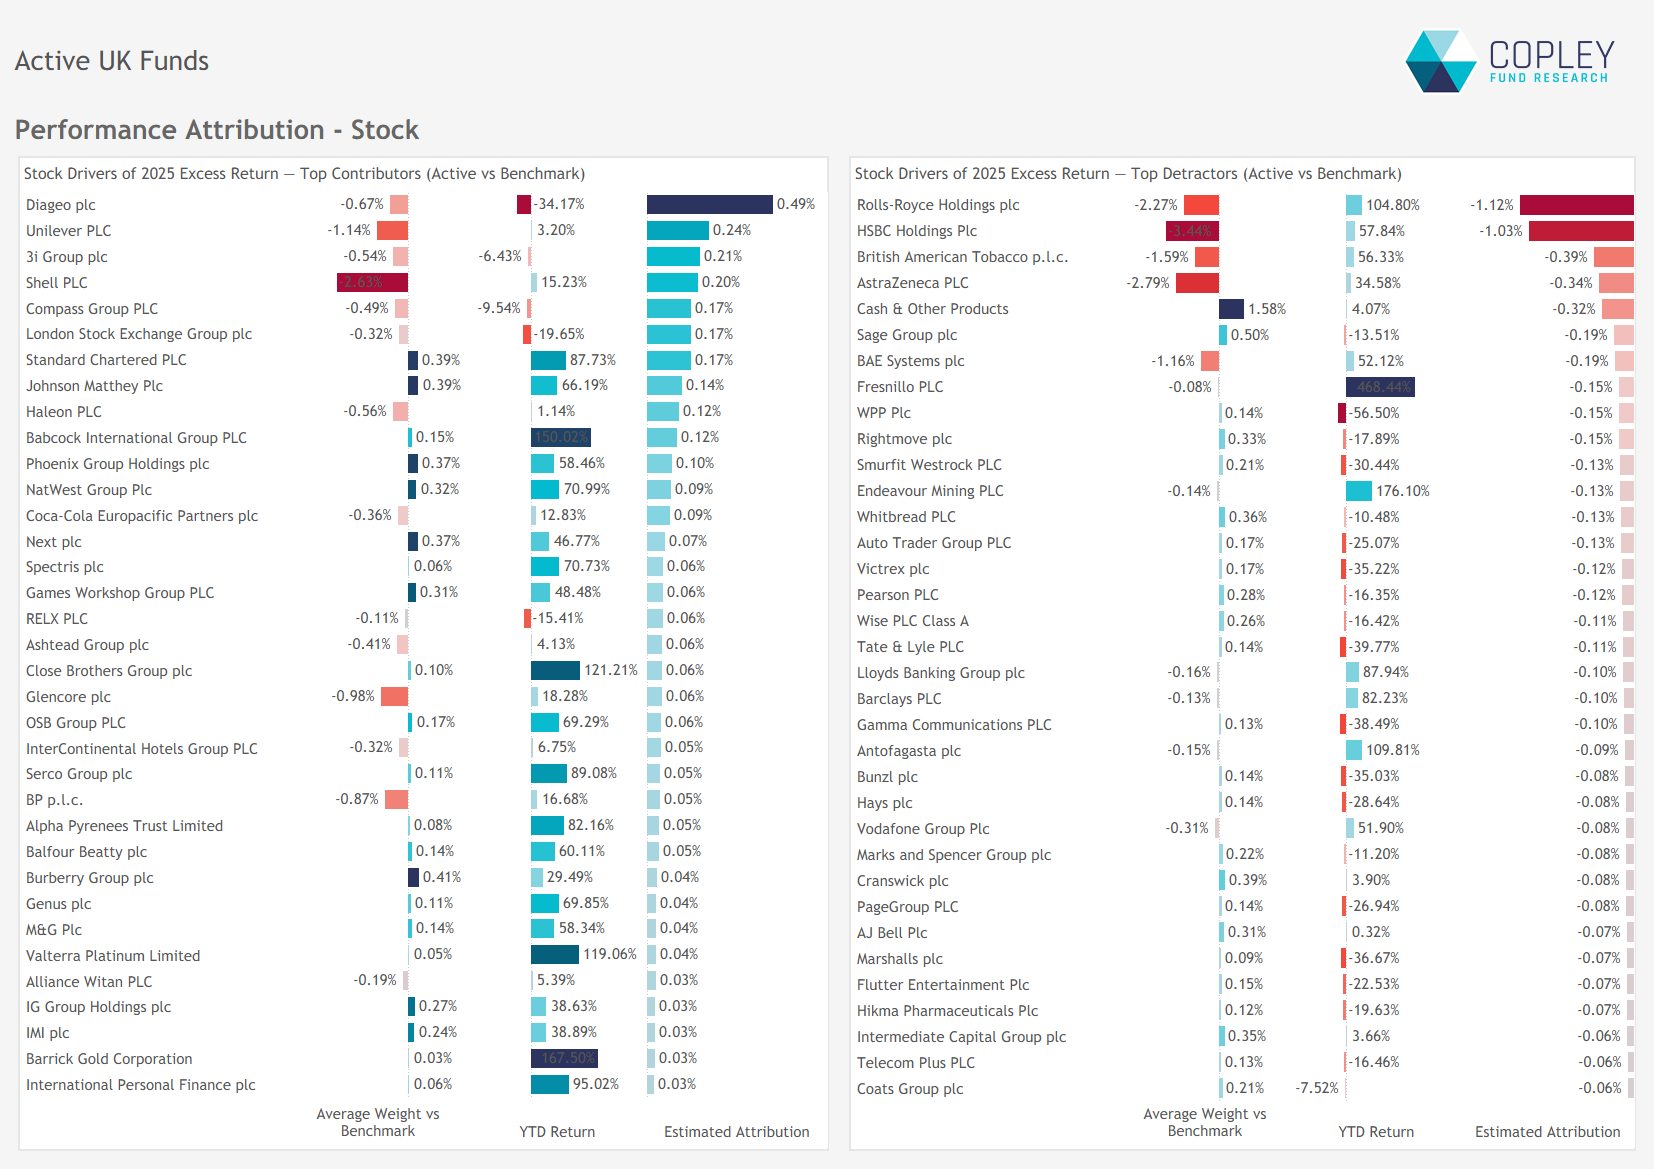
The chart below highlights the top stock-level contributors and detractors for UK active managers in 2025. On the positive side, a group of seven companies stood out, collectively contributing 8.3 percentage points to the average fund return. This group was led by large, widely held positions such as HSBC and AstraZeneca, alongside smaller holdings that delivered outsized gains, including Barclays, Lloyds Banking Group, and NatWest Group.
On the negative side, Diageo, RELX, and the London Stock Exchange were the most significant detractors. Together, they reduced average active performance by 1.3 percentage points over the year.
Performance Attribution – Where Did Active Managers Win and Lose?
At the sector level, there were few areas of outperformance for active UK funds in 2025. Stock selection was a drag across most sectors, with the largest source of underperformance coming from Industrials. This was compounded by poorly performing overweight positions in Information Technology and Consumer Discretionary.
There was some solace in the form of underweights to weaker areas of the market. Notably, active managers benefited from limited exposure to Energy, Consumer Staples, and the Multi-Sector product group — the latter primarily made up of Investment Trusts, which are typically underrepresented in actively managed portfolios.
Stock Attribution: Underweights Cause Pain
UK active managers are typically positioned with significant underweights in the largest constituents of the FTSE All Share index. For example, the top six index weights — AstraZeneca, HSBC, Shell, Unilever, Rolls-Royce, and British American Tobacco — make up 31.3 percent of the FTSE All Share, but account for just 16.7 percent of the average UK active fund. As a result, the performance of these names plays an outsized role in driving relative returns.
Unfortunately for active investors, four of these six — Rolls-Royce, HSBC, British American Tobacco, and AstraZeneca — delivered returns well ahead of the benchmark. Underexposure to this group alone cost the average fund 2.9 percentage points in lost performance, with a further 32 basis points lost due to cash drag. While underweights in Diageo, Unilever, 3i Group, and Shell provided some relief, and smaller active overweights helped at the margin, they were not enough to offset the impact of missing out on the top performers.
Long-Term Performance: Worst Year on Record for Active
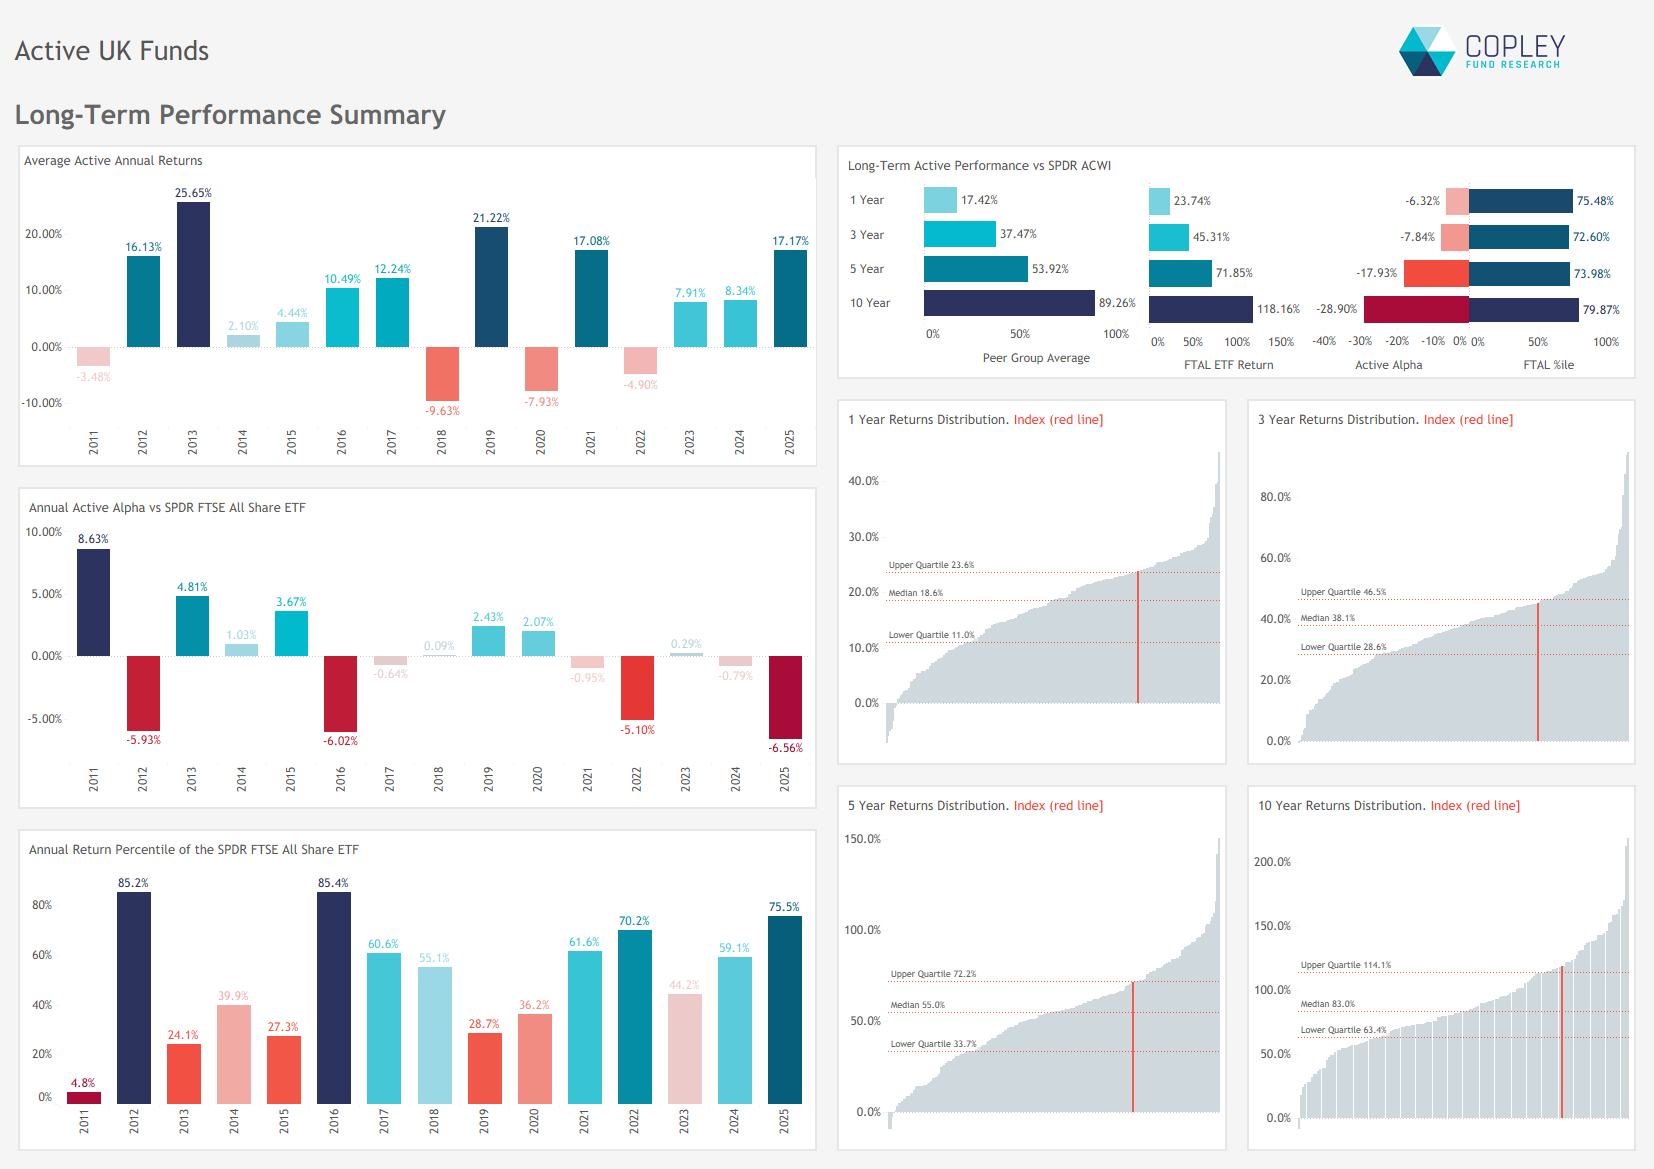
The charts below track the long-term performance of the average active portfolio of funds versus the SPDRs FTSE All Share ETF. Whilst 2025 was the third best year in absolute terms, the -6.6% underperformance was the worst on record. Indeed, over 10 years, the active fund portfolio has underperformed the FTAL ETF by 28.9%, with the ETF sitting just below the top 20th percentile when placed aside it’s active peers.
The FTSE All Share Index: Fit for Purpose as a Benchmark?
As active UK equity funds continue to close at a pace unmatched in any of our other global fund universes, it’s tempting to question whether the model is broken. But before throwing in the towel on active, perhaps it’s time to ask a different question: is the benchmark itself still fit for purpose?
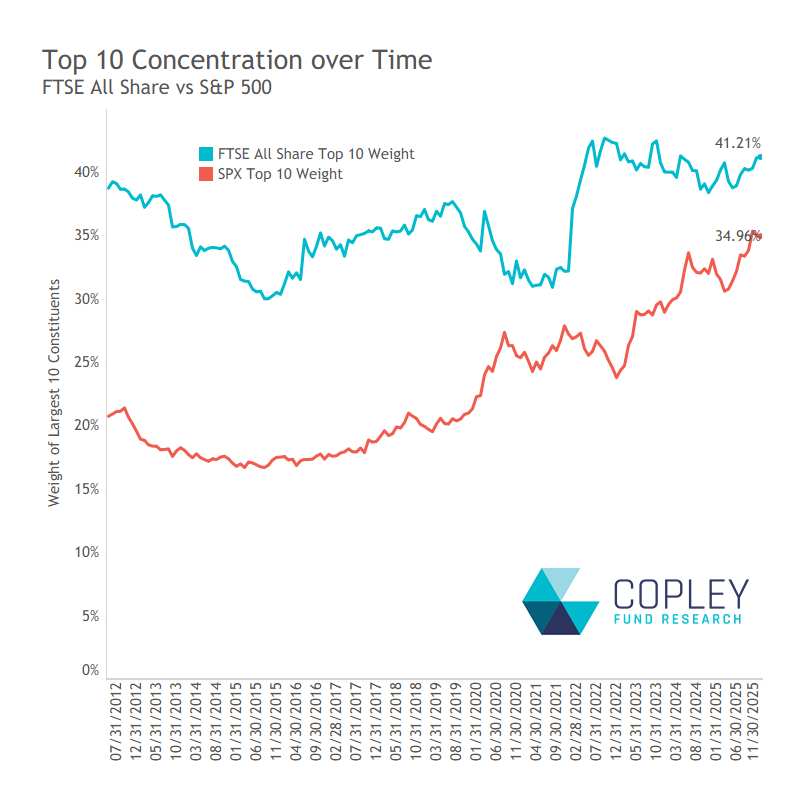
While recent commentary has focused on rising concentration in the US market, the FTSE All Share has quietly remained the more concentrated of the two. As the left-hand chart shows, the top 10 names have consistently represented a larger share of the index than in the S&P 500 — currently standing at 41.2 percent.
The second chart puts this into context. Despite comprising hundreds of stocks, the FTSE All Share sits in the middle of the pack when ranked by top-10 concentration across UK equity portfolios — and that includes active funds with far fewer holdings and deliberate stock selection frameworks. The SPDR FTSE UK All Share ETF — the passive proxy — has a top-10 exposure similar to many high-conviction, concentrated active funds, but without the intellectual framework or rationale behind those weights.
It’s easy to frame the debate as “active vs passive,” especially in a year where the benchmark has delivered such strong returns. But that often misses the deeper issue: what exactly are passive investors buying into? And is it fair to judge active managers against a benchmark whose construction is now so heavily skewed toward a small number of mega-cap names?

Performance & Attribution Report
Click the link opposite for full charts and data detailing the drivers of 2025 performance, along with a review of 3-, 5-, and 10-year results across the active UK peer group.
Related Posts

- Steve Holden
- July 16, 2025
UK Funds: Performance & Attribution, H1 2025
UK Fund Analysis UK Funds: Performance & Attribution, H1 2025 In this quarter’s UK p ..

- Steve Holden
- May 30, 2025
UK Funds: Positioning Analysis, May 2025
UK Fund Analysis Active UK Funds: Positioning Analysis, May 2025 In this month’s c ..

- Steve Holden
- August 27, 2024
Positioning Insights, August 2024
255 Active UK funds, AUM $189bn Active UK Funds: Positioning Insights, August 2024 Summary Heal ..