Active Asia Ex-Japan Funds: Performance & Attribution 2025
January 12th 2026
Key Data Points
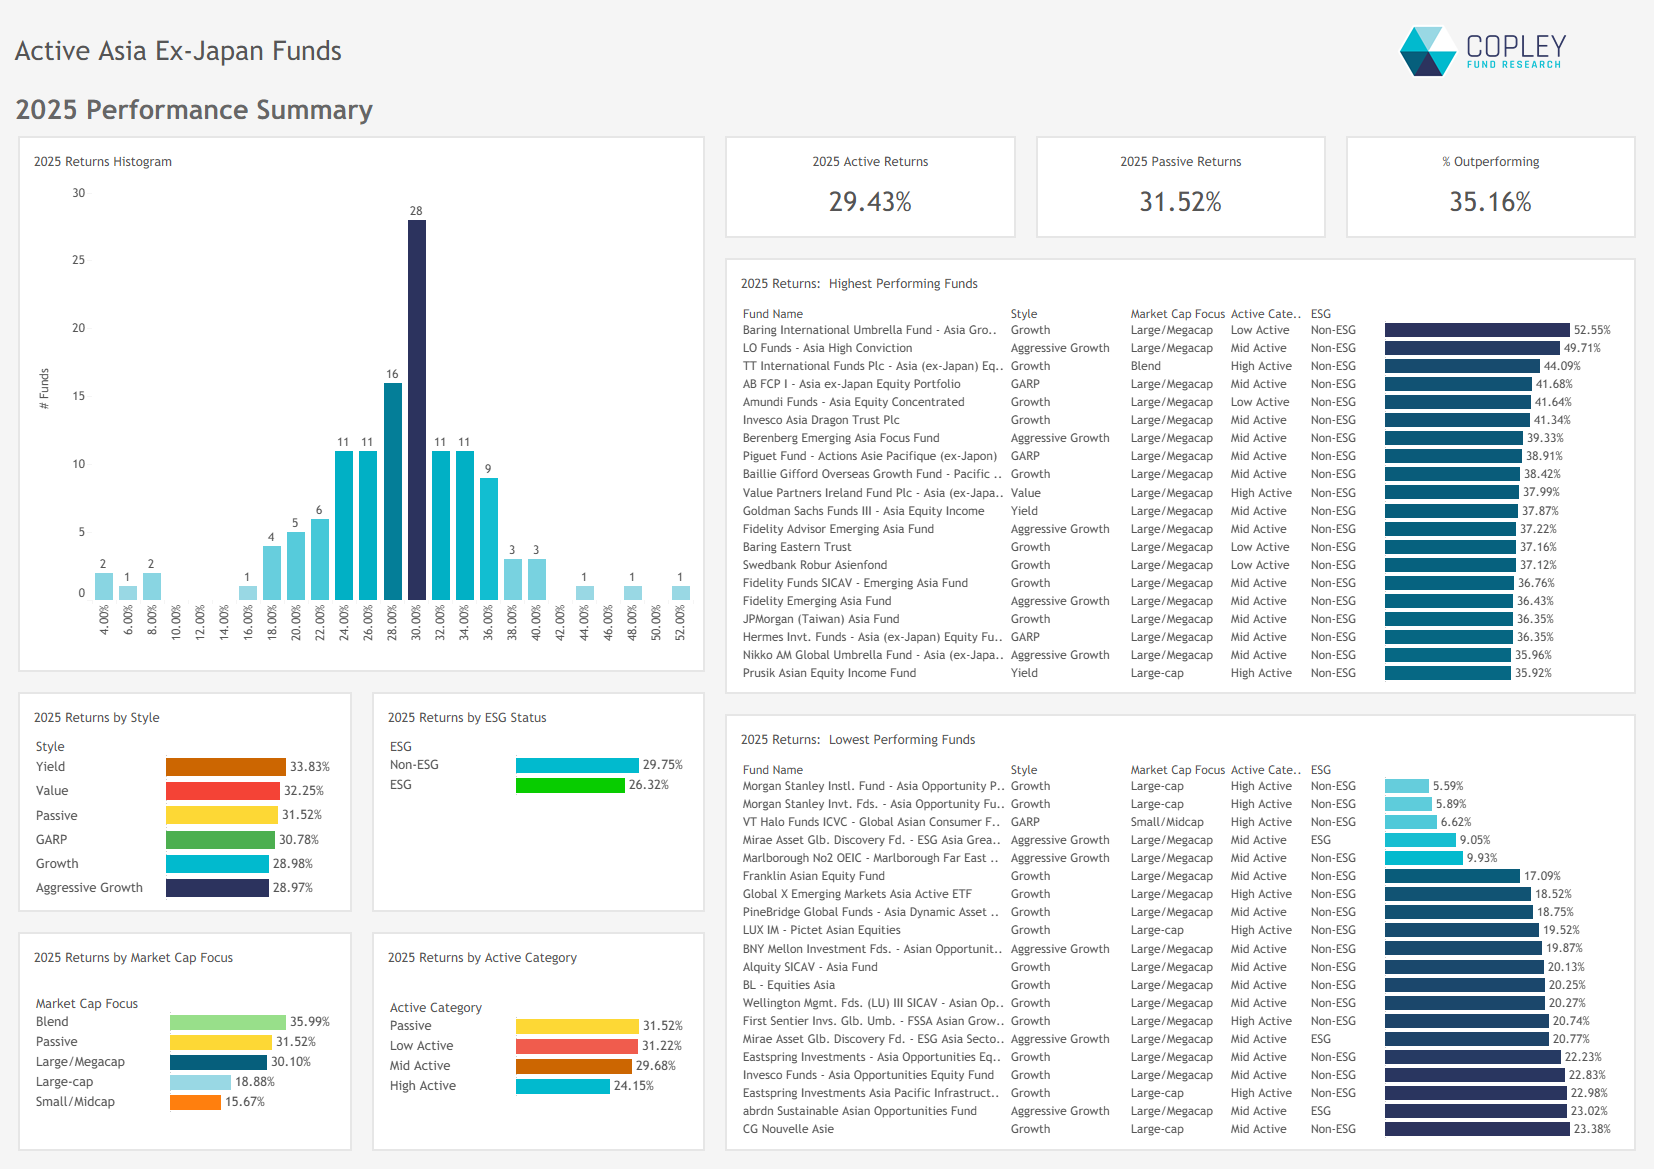
Strong Absolute Returns: Asia ex-Japan funds returned 29.4% in 2025, with a few standouts exceeding 40%. Most funds, however, clustered tightly in the 24–36% range, with little dispersion across the Style groups.
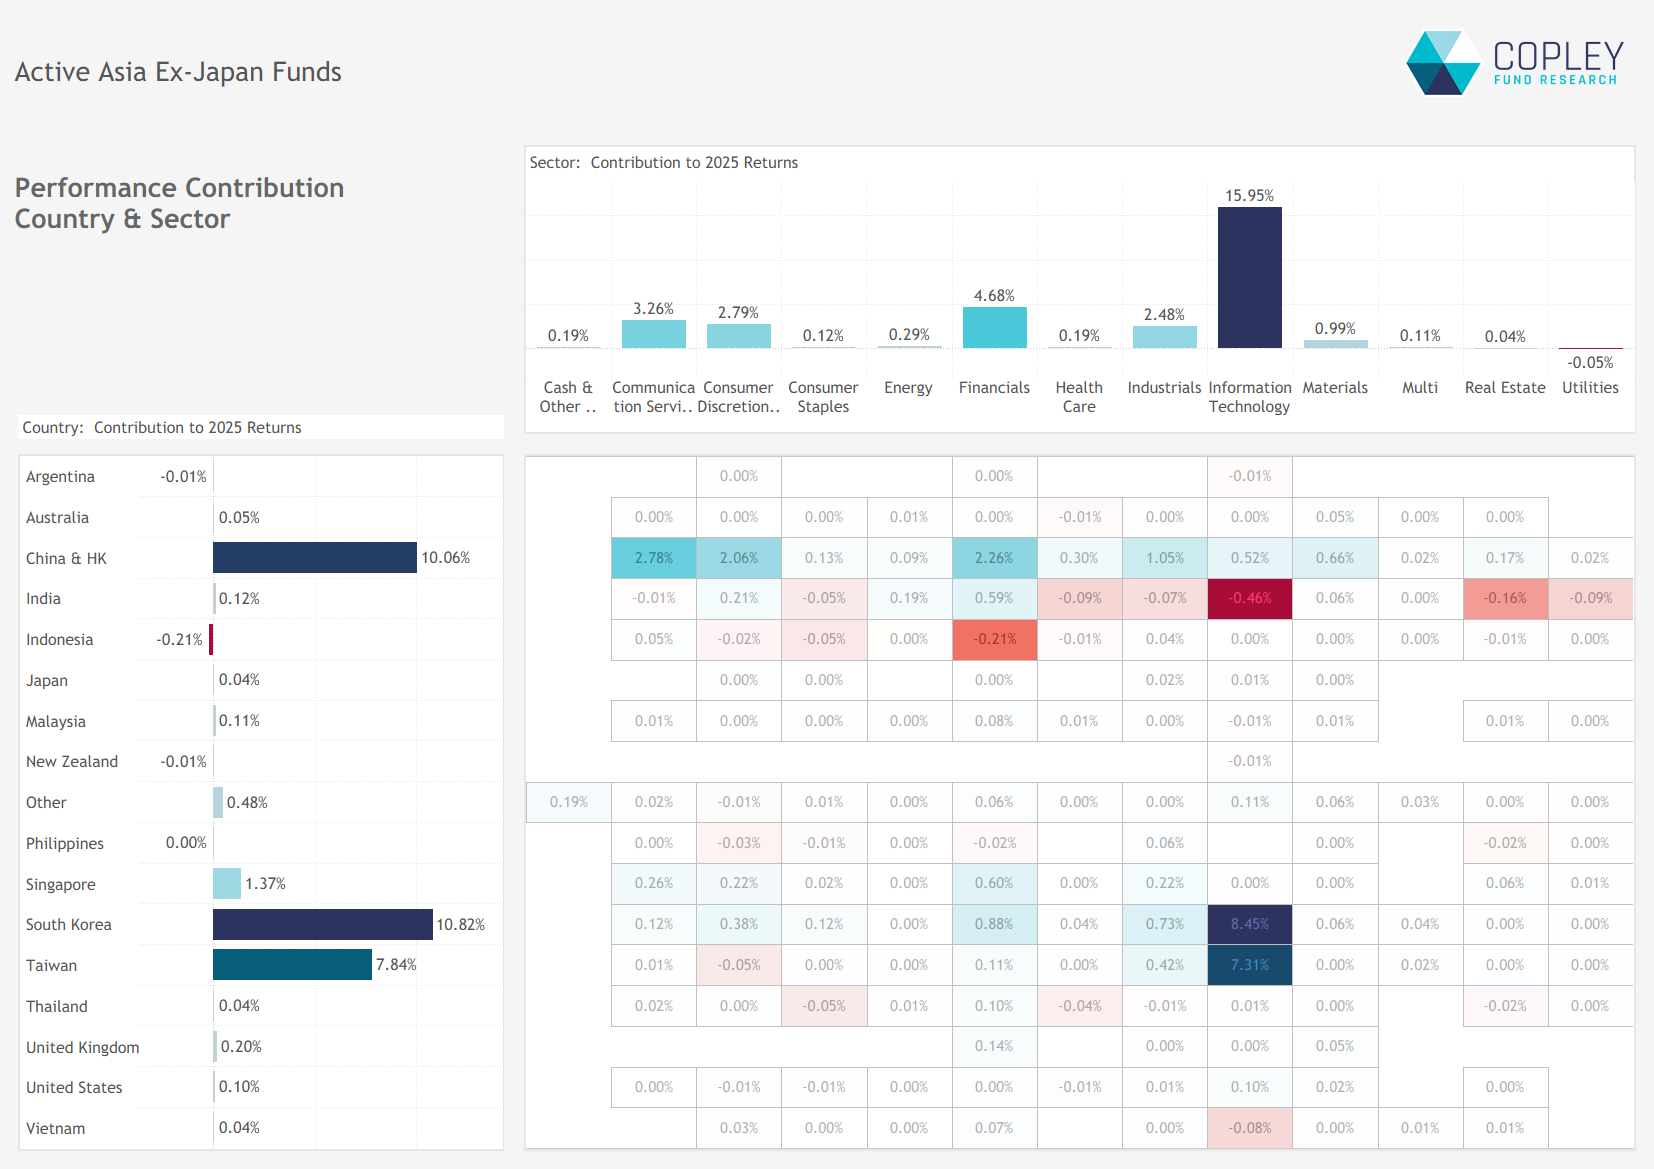
Tech and North Asia Led the Way: Technology contributed 16 percentage points to total returns, while China & HK, Taiwan, and South Korea together accounted for 93% of overall performance.
Cash and Stock Picks Weighed on Relative Returns: Despite strong selection in Korea and Taiwan, underweights in TSMC, elevated cash holdings, and weak Indian and Indonesian names dragged on performance.
Active Still Holds Its Ground: Though 2025 was another year of average underperformance, passive benchmarks like AAXJ rarely match top-tier active results — reinforcing the long-term case for active management.
High Returns and Some Big Winners 2025 was a strong year for Asia ex-Japan funds, with average returns of 29.4% — marginally behind the iShares AAXJ ETF but impressive by any standard. Performance was buoyed by standout gains from a few select funds. Barings Asia Growth, LO Funds Asia High Conviction, and TT Asia ex-Japan all returned over 40%, showing what’s possible with strong stock and country selection. The top three spanned High, Medium, and Low Active risk, but with a common Growth bias.
Style dispersion was narrow, with just a 5% point gap between Yield (top) and Aggressive Growth (bottom). The bigger driver was market cap: both Small/Mid and Large Cap funds lagged, while Blend funds led. While 65% of funds underperformed the benchmark, most clustered between 24% and 36%, pointing to a tightly packed middle and fine margins around the median.
Breaking Down the 2025 Return: Tech and China Take the Lead The 29.4% average return for active Asia ex-Japan funds in 2025 was underpinned by concentrated exposures across both sectors and countries. Technology was the dominant driver, contributing 16 percentage points to the total — reflecting both strong performance and its heavy portfolio weight. Financials, Communication Services, and Consumer Discretionary added smaller, yet positive contributions.
On the country side, China & HK, Taiwan, and South Korea accounted for 93% of total returns. India, despite its sizeable weight in regional indices, contributed just 0.1% — making it a key source of dispersion at the fund level. At a more granular level, India Tech and Indonesian Financials were the largest drags, though their overall impact was small.
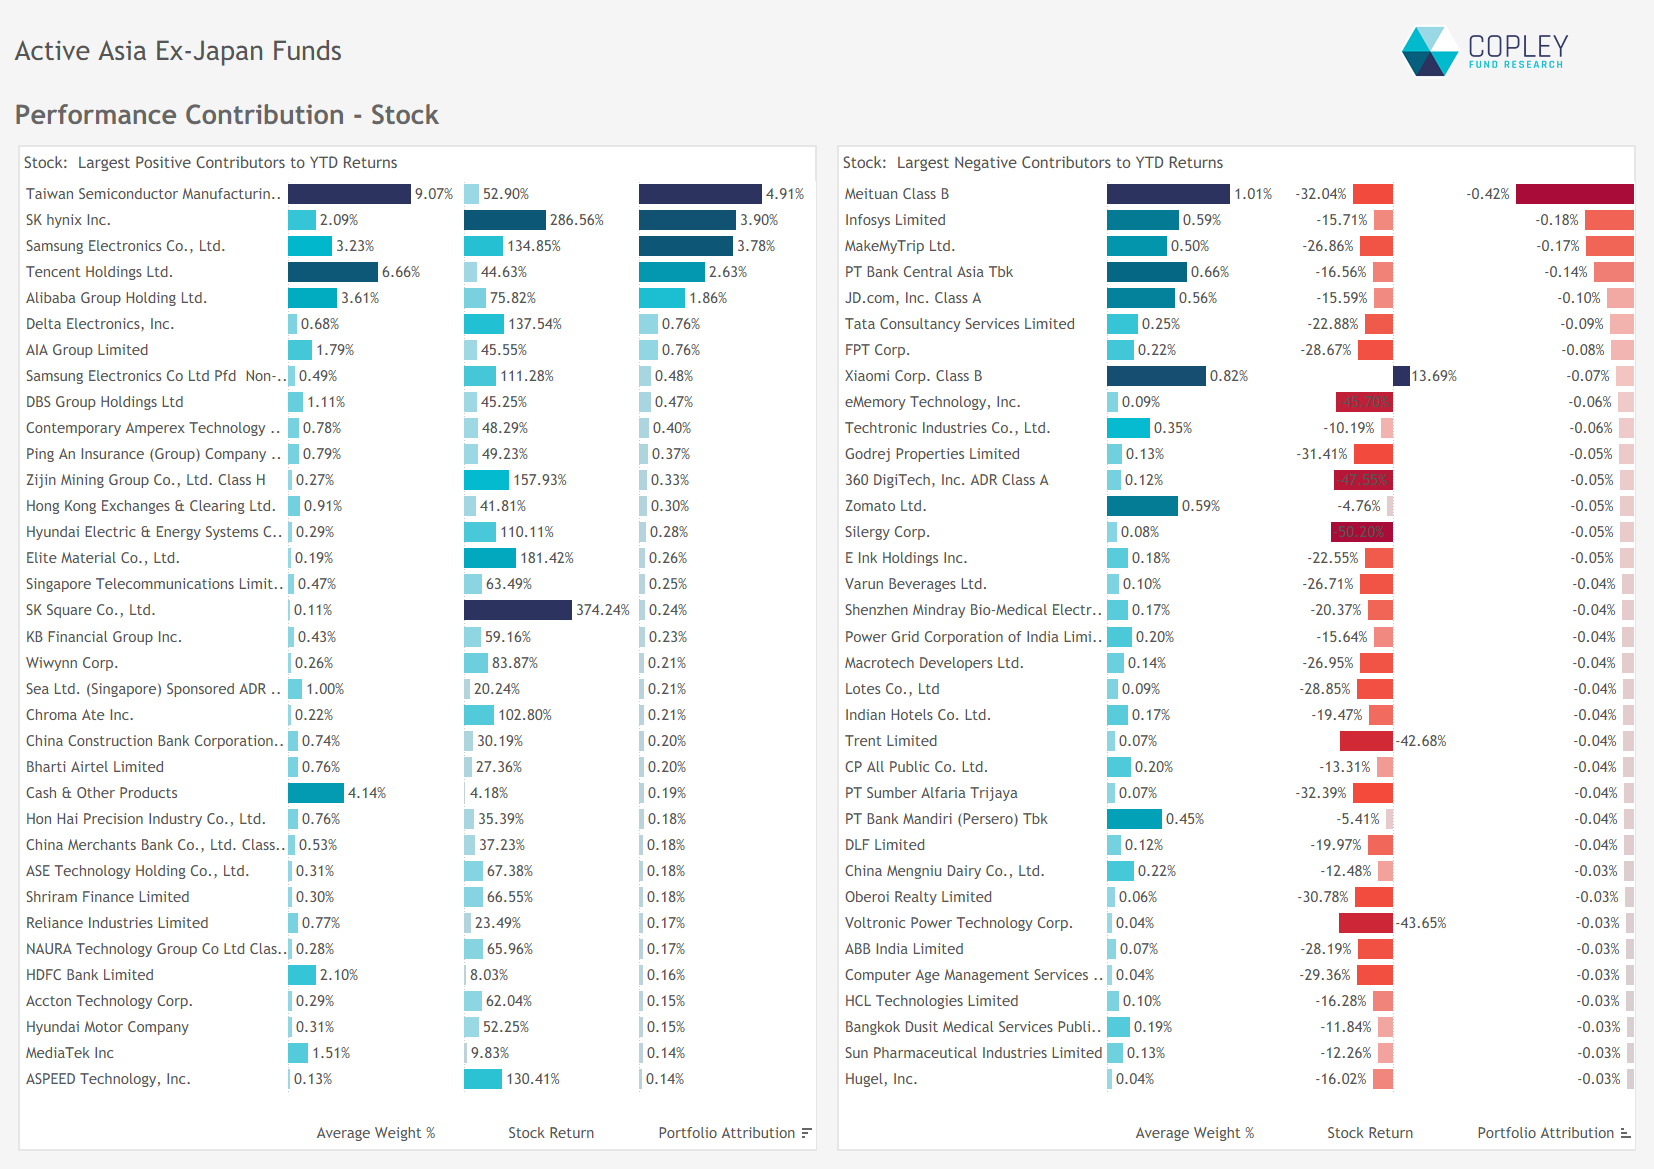
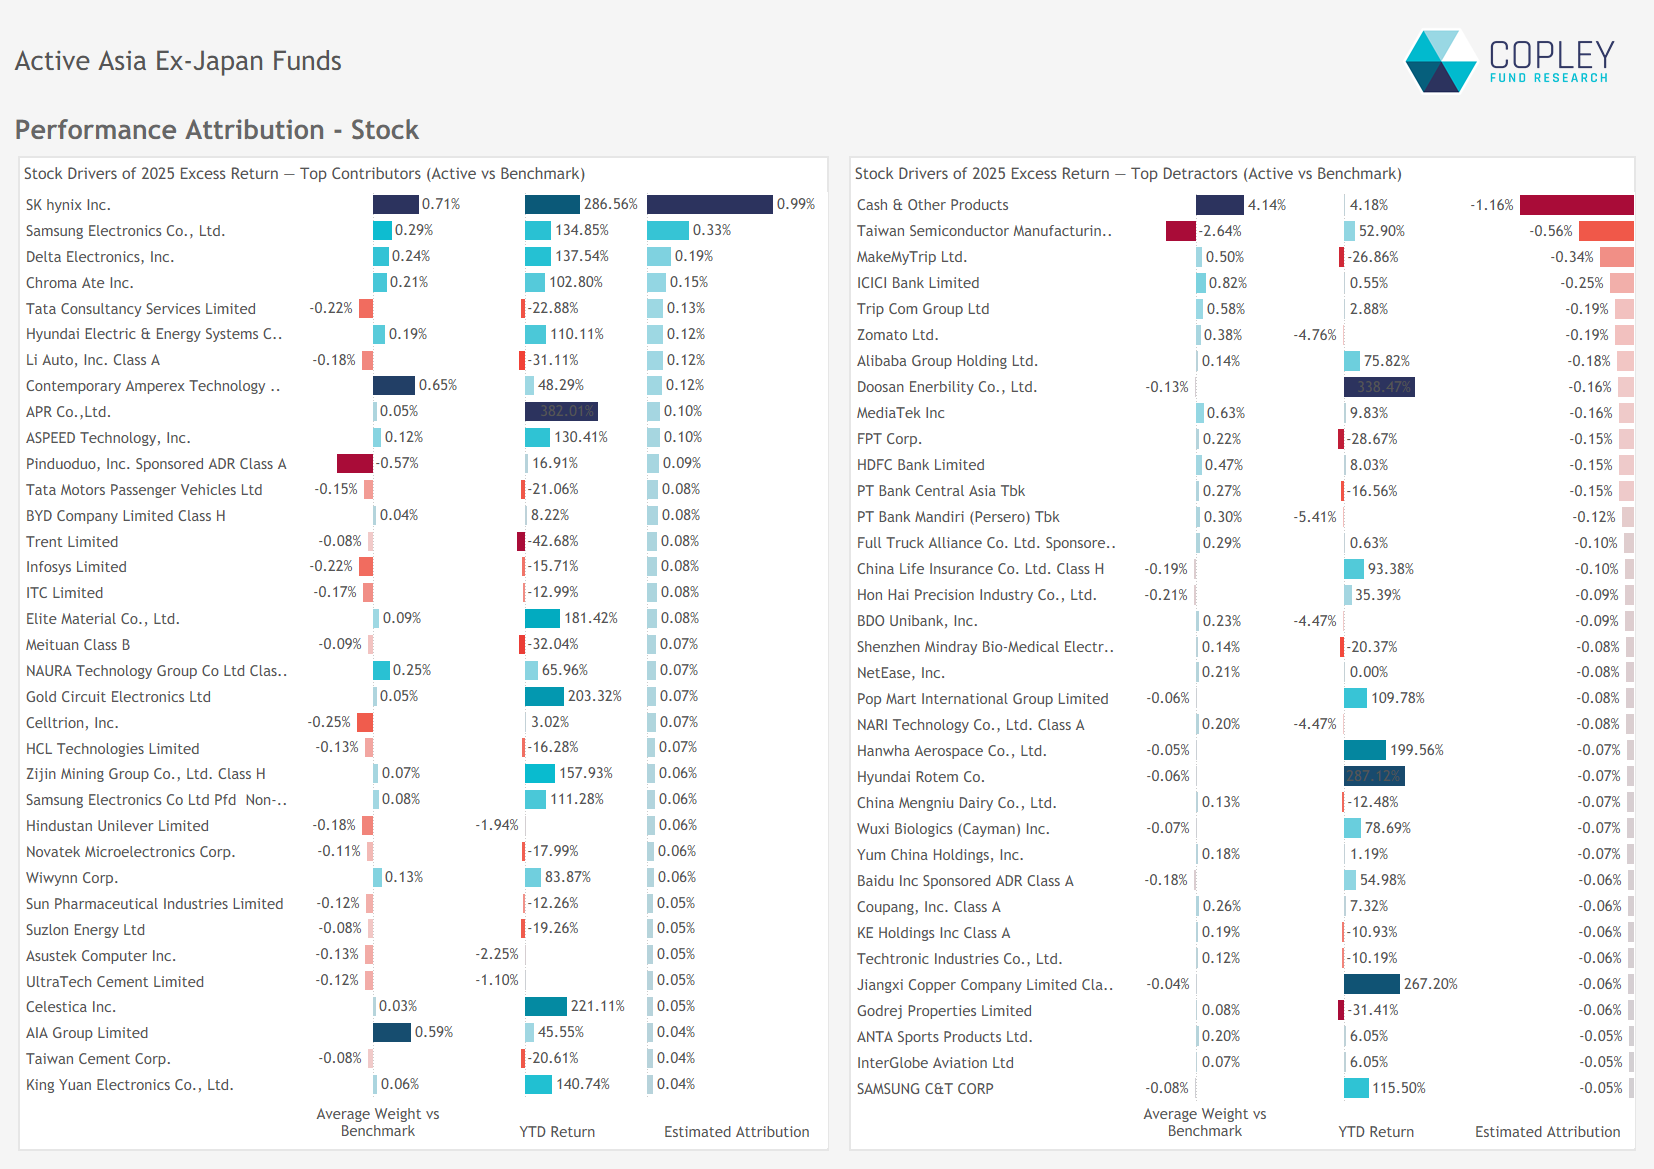
Stock-Level Influence: A broad Mix of Contributors 2025 returns were led by a mix of dominant index names and smaller high-conviction positions. TSMC, Samsung Electronics, SK Hynix, Tencent, and Alibaba were the top contributors, together driving 57% of total returns. But notable gains also came from further down the index, with names like Delta Electronics, Zijin Mining, and SK Square adding meaningful upside.
On the downside, detractors were fewer and had a more muted impact. Meituan and Infosys were among the more widely held laggards, while investor favourite PT Bank Central Asia also weighed on active returns.
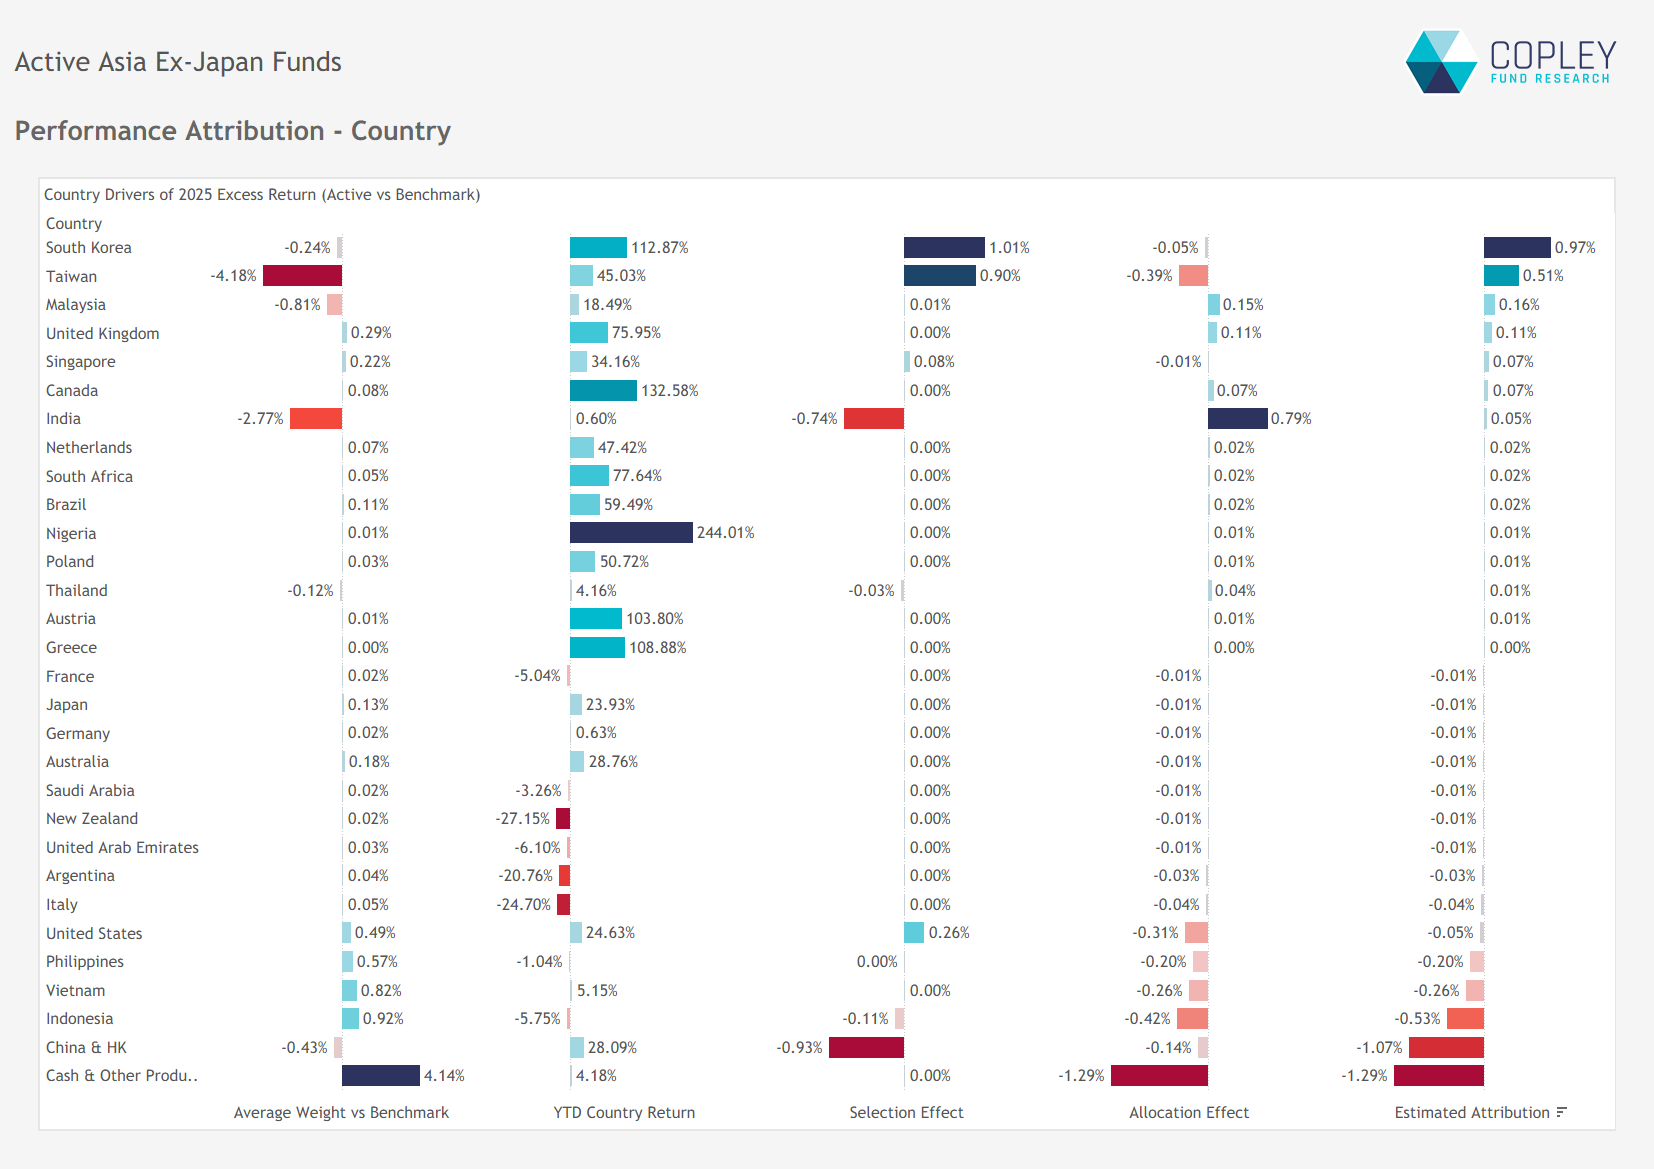
Performance Attribution – Where Did Active Managers Win and Lose? At the country level, the biggest source of outperformance was stock selection in South Korea, aided by a shift from underweight to overweight during the year that removed any allocation drag. Strong selection in Taiwan also helped, partially offsetting the impact of a near-record underweight. In India, while the underweight added value, poor stock selection largely erased the gains.
On the downside, cash holdings were a clear drag in such a strong year. Stock selection in China & HK also weighed on relative returns, while overweight exposures to Vietnam, Indonesia, the Philippines, and the US added further underperformance.
Stock Attribution: Gains at the Top, but Losses Added Up Active Asia ex-Japan managers saw strong stock-level gains from overweights in SK Hynix, Samsung Electronics, Delta Electronics, and Chroma Ate.
However, losses marginally outweighed the gains. Underweights in TSMC and elevated cash holdings together cost 1.74% in relative performance. Pain also came from overweights in weaker India names like MakeMyTrip, ICICI Bank, and Zomato, while positions in Indonesian banks added to the underperformance.
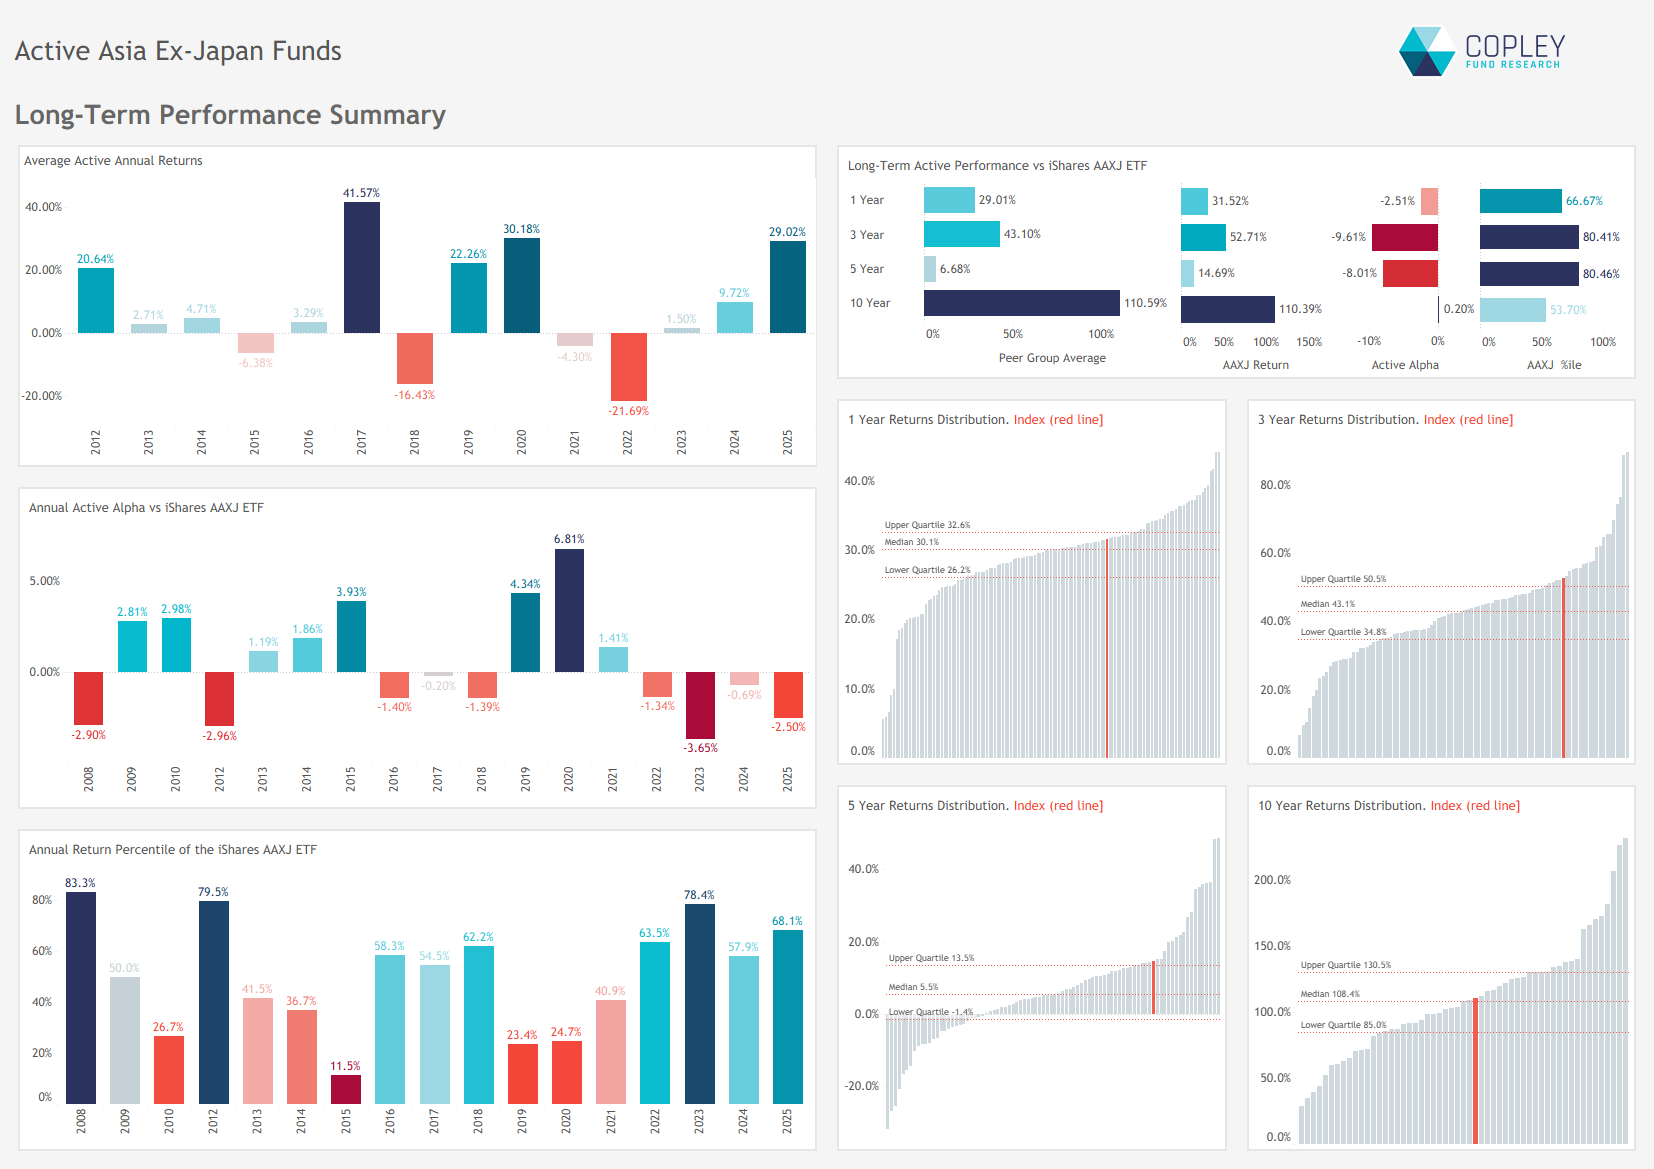
Long-Term Performance: 3rd Best Year, but Another Underperformer 2025’s 29.5% return was the third-highest since 2012, yet it marked the fourth year of average underperformance for Asia ex-Japan managers. Still, aside from 2023, the iShares AAXJ ETF has rarely ranked in the top third of the peer group and consistently trails the top performers. The case for active management remains intact.
Performance & Attribution Report
Click the link opposite for full charts and data detailing the drivers of 2025 performance, along with a review of 3-, 5-, and 10-year results across the active Asia Ex-Japan peer group.