Active Global Funds: Performance & Attribution 2025
January 8th 2026
Key Data Points
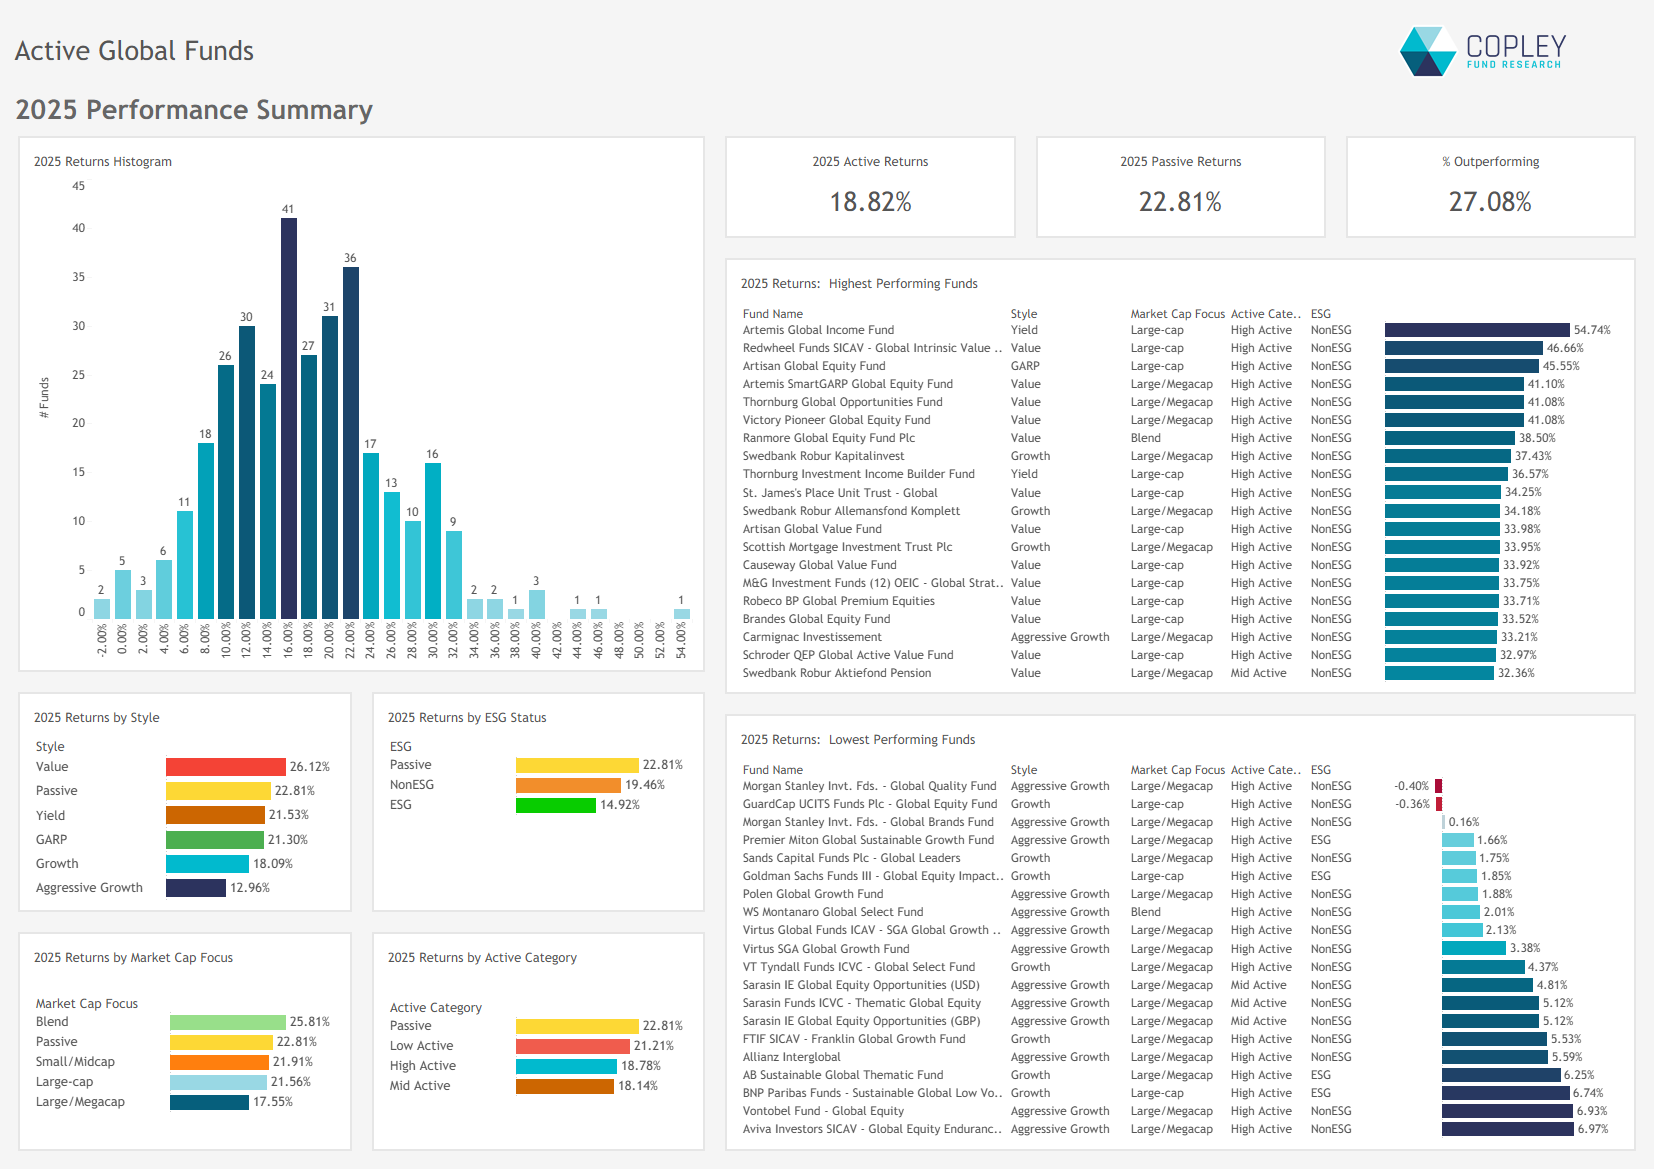
Strong Absolute Returns, Weak Relative Results: Global equity funds returned 18.8% in 2025, but only 27.1% outperformed the SPDR ACWI ETF, which gained 22.8%.
Value-Led Outperformance at the Top: Top performers were driven by Value strategies, with the cohort averaging 26.1% — well ahead of the peer group.
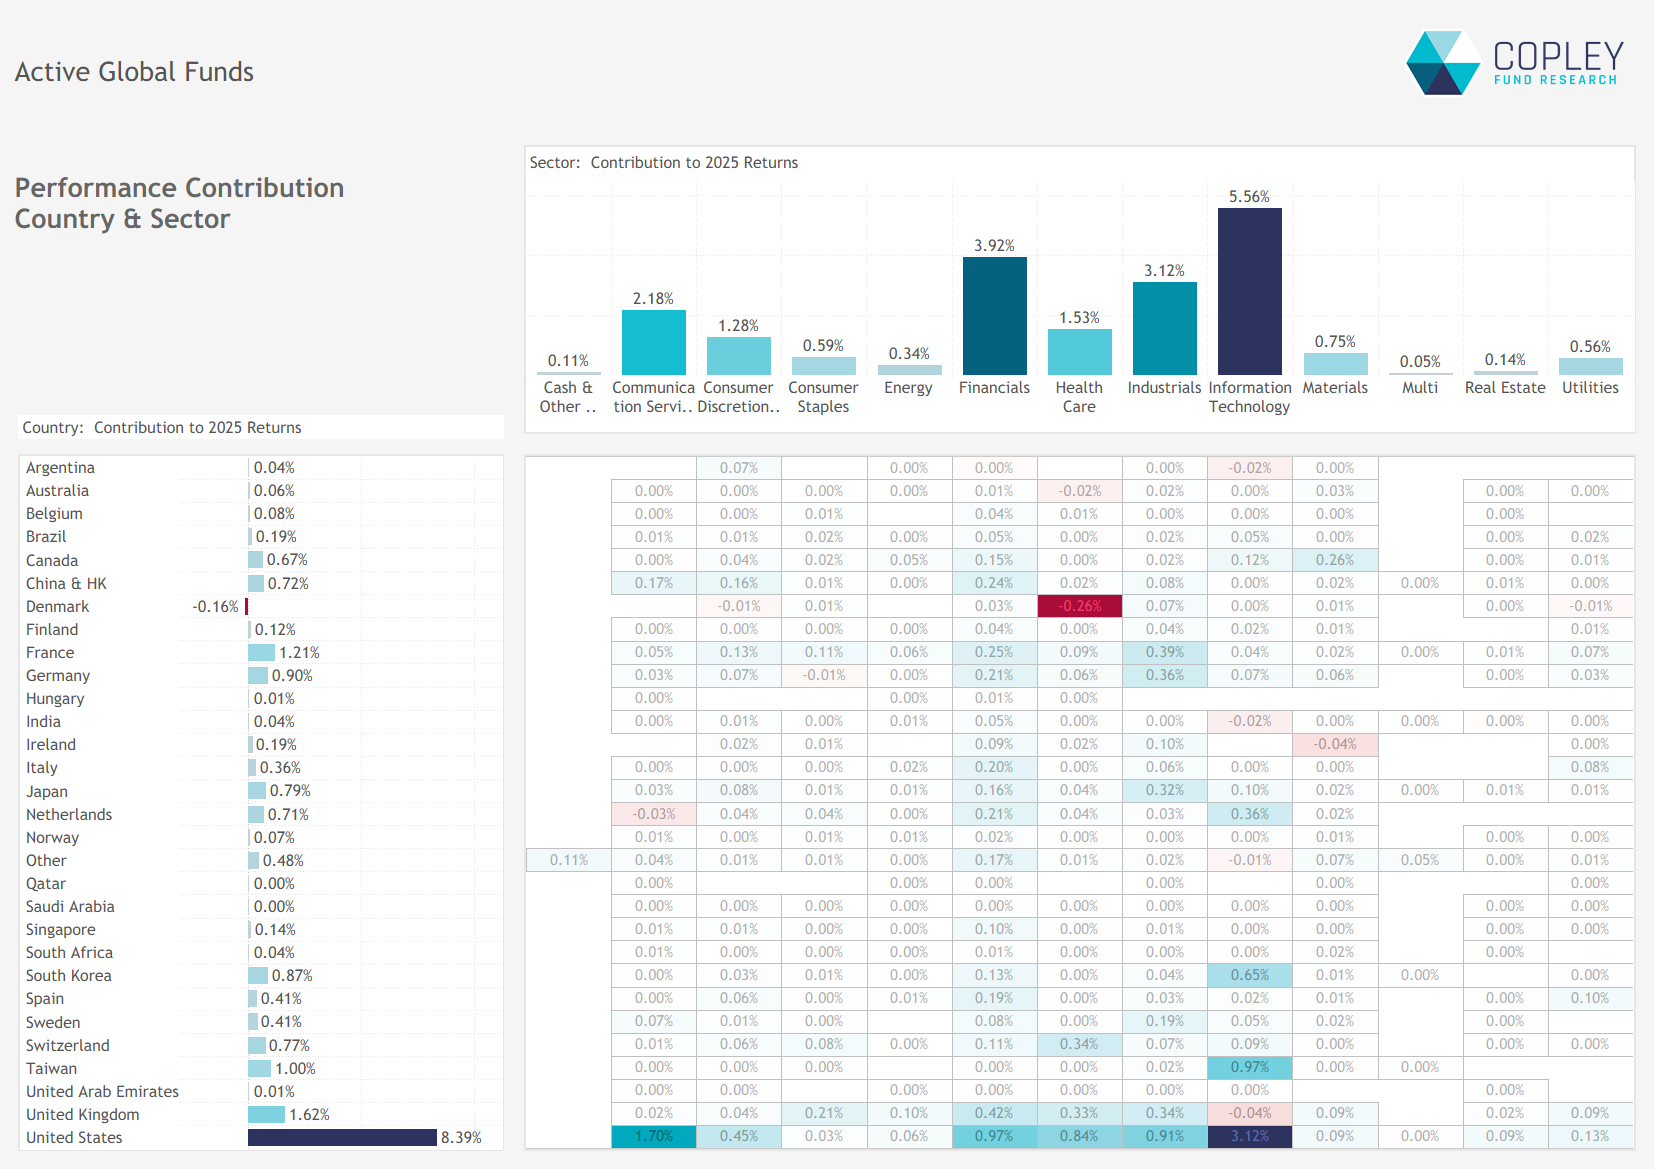
Tech and US Exposure Dominated: Technology contributed 5.6% to returns, with the US accounting for 8.4% overall — reinforcing their central role in portfolio performance.
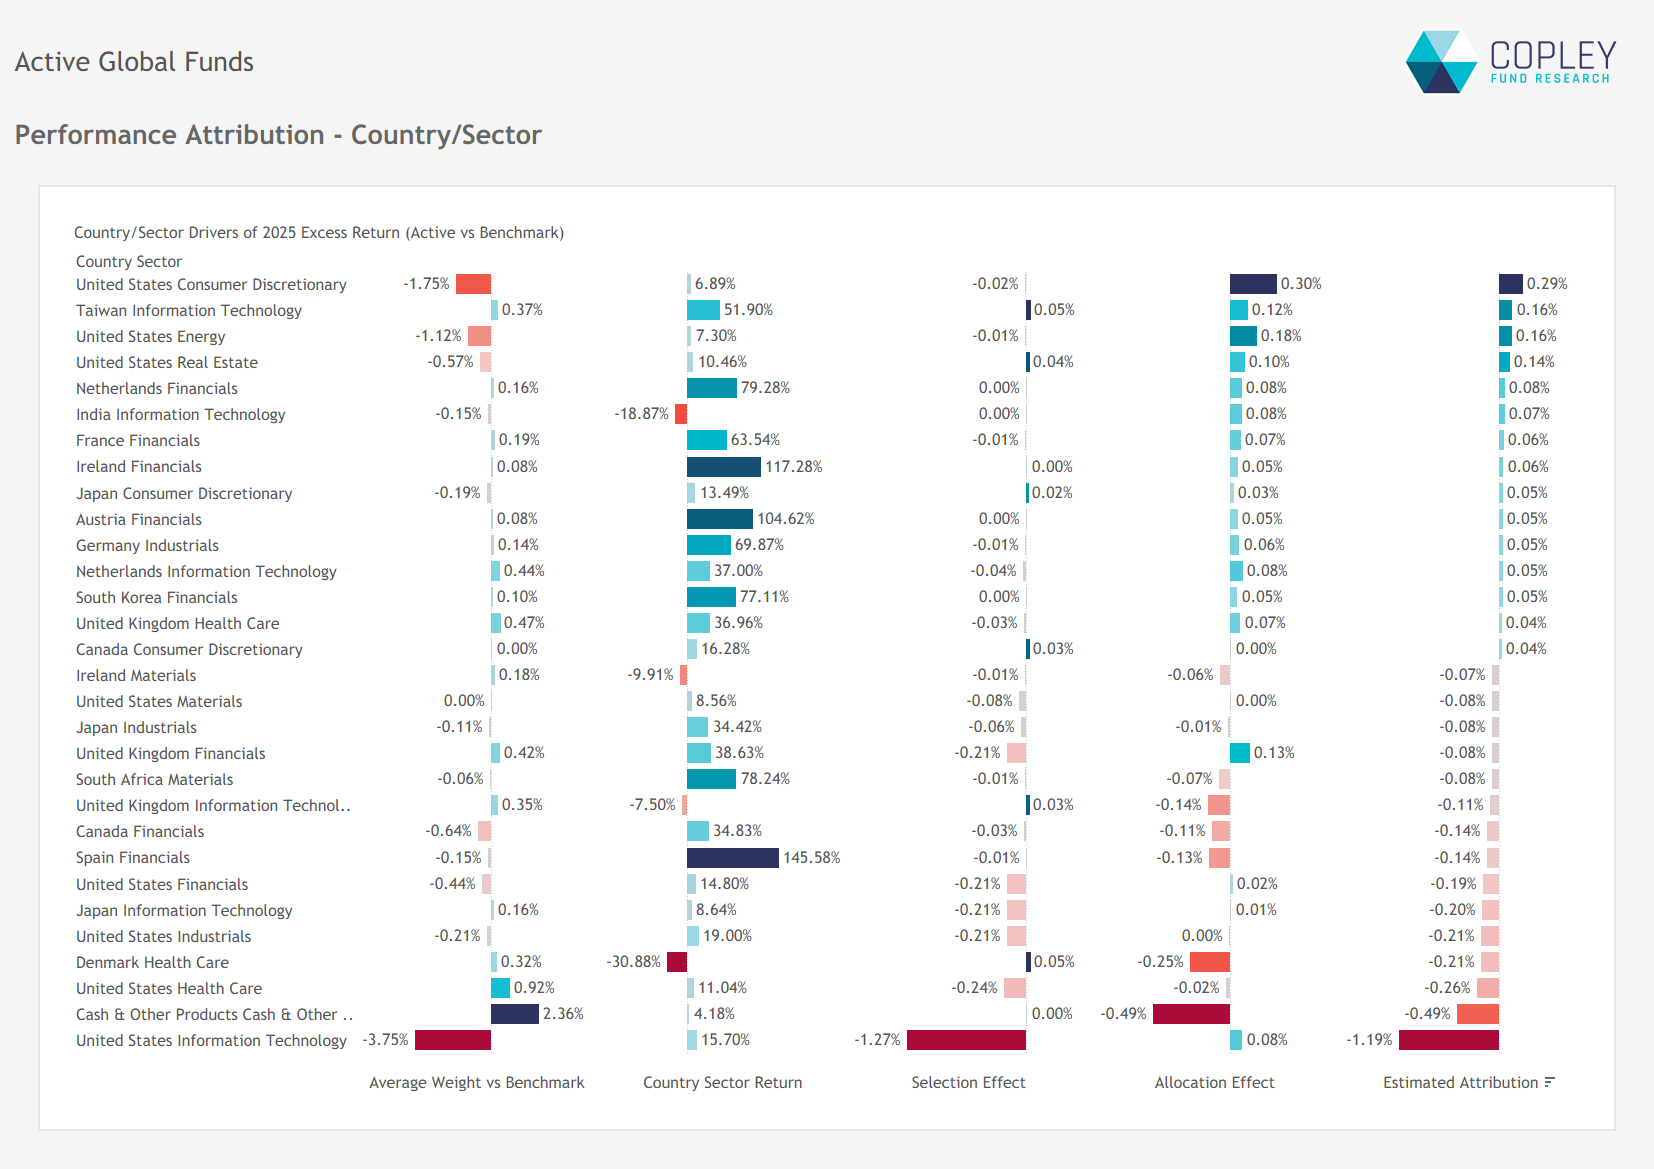
Benchmark Beats on Stock Selection: US Tech stock selection was the biggest source of underperformance, despite the correct underweight call.
Underweights in US Consumer Discretionary and Energy, and overweights in Taiwan Tech, added modest outperformance.
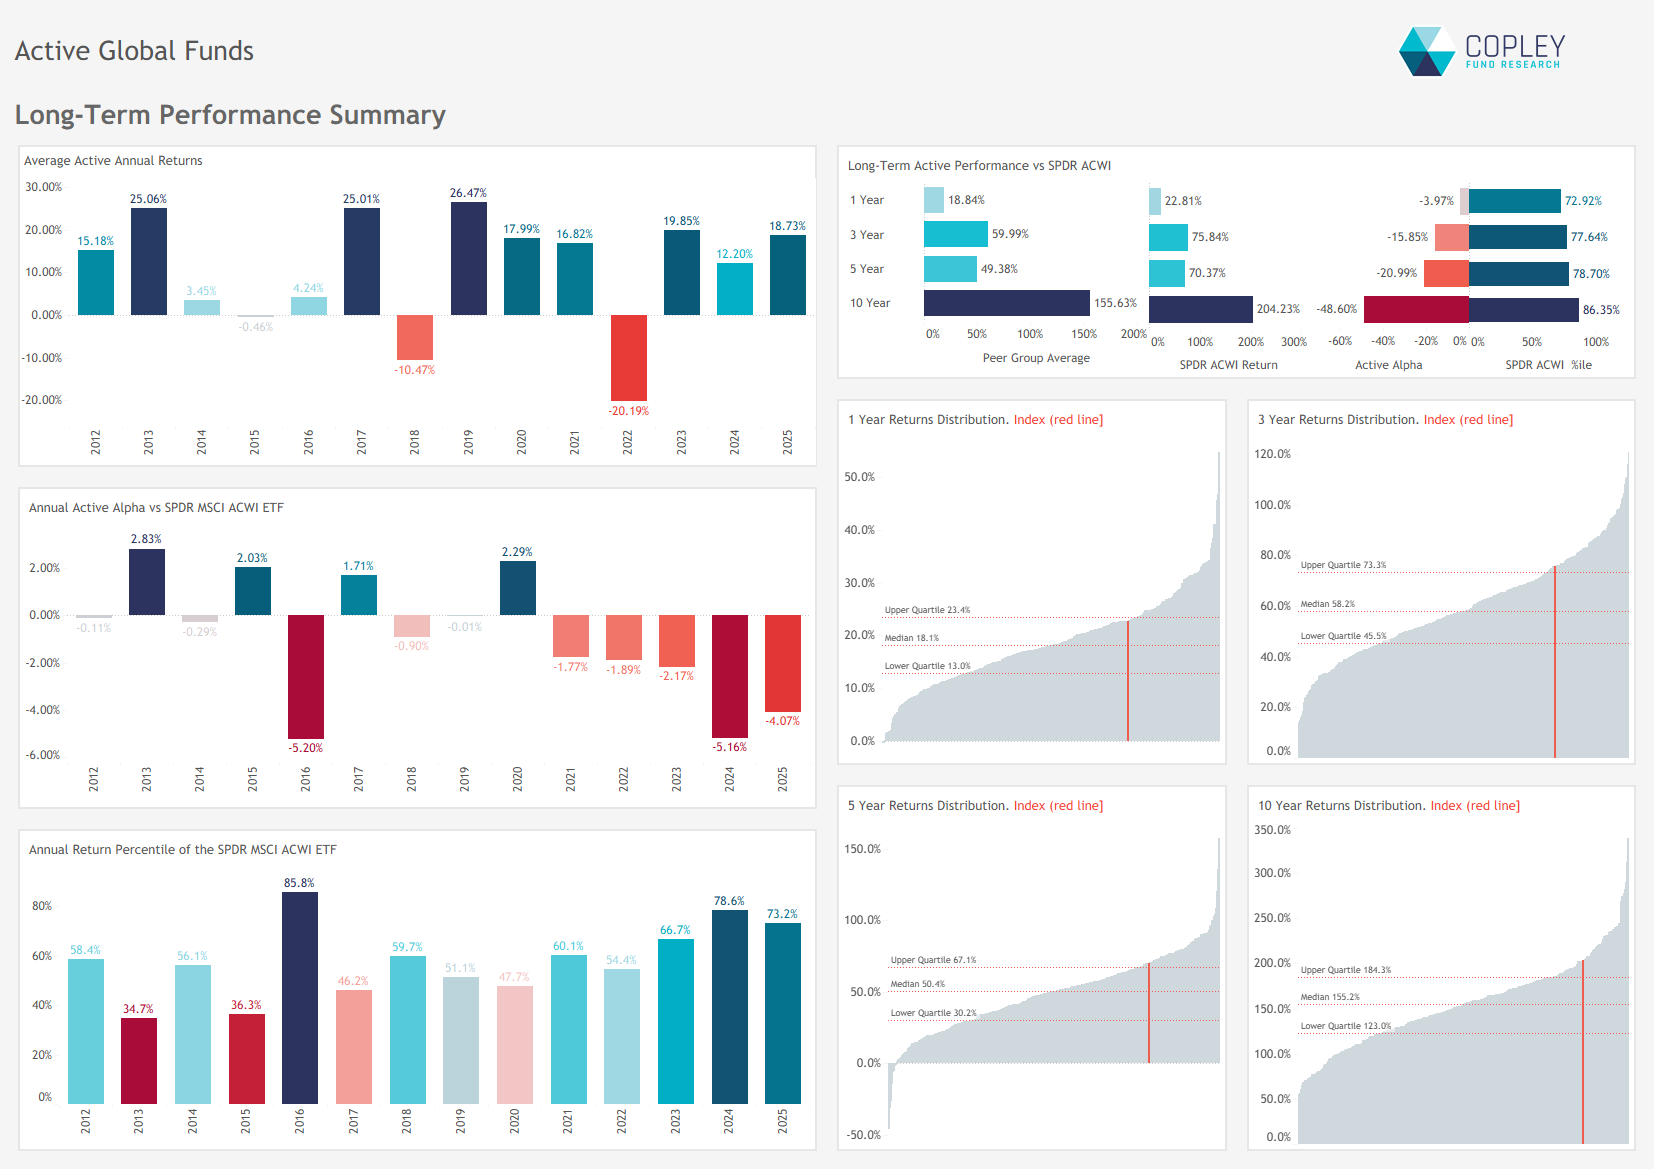
Long-Term Struggles Continue: 2025 marked the fifth straight year of underperformance vs. the benchmark; the ETF’s 10-year lead now stands at 48.5%.
A Solid Year, but the Benchmark Spoils the Party On the surface, 2025 delivered compelling returns for Global equity funds, with the average fund posting an 18.8% gain — a solid outcome in its own right. Standout performers like Artemis Global Income and Redwheel Global Intrinsic Value finished the year with returns exceeding 40%, fueled by a pronounced Value tailwind that lifted the entire Style group. In fact, the Value cohort outpaced the broader fund universe with an average return of 26.1%.
Yet, perhaps the most striking figure comes from the benchmark: the SPDR ACWI ETF returned 22.8% in 2025, comfortably ahead of the average active manager. Only 27.1% of funds surpassed this benchmark return, underscoring an ongoing challenge for active strategies in the global equity space.
Breaking Down the 2025 Return: Tech and the US Take the Lead The 18.8% average return for active Global equity funds in 2025 can be unpacked by examining the underlying exposures across sectors and countries, based on active managers’ aggregate holdings. Technology stood out as the dominant driver, contributing 5.6 percentage points to overall returns — a reflection of both strong performance in the sector and its outsized weighting in portfolios. Financials added a further 3.9%, while Industrials and Communication Services contributed 3.1% and 2.2%, respectively.
At the country level, the USA — particularly through its exposure to Technology — accounted for 8.4% of the total return. EMEA delivered a more muted, but still material, contribution of just under 7%. On the downside, Danish Health Care shaved off 0.26% from performance — the only meaningful drag in an otherwise strong year for global allocations.
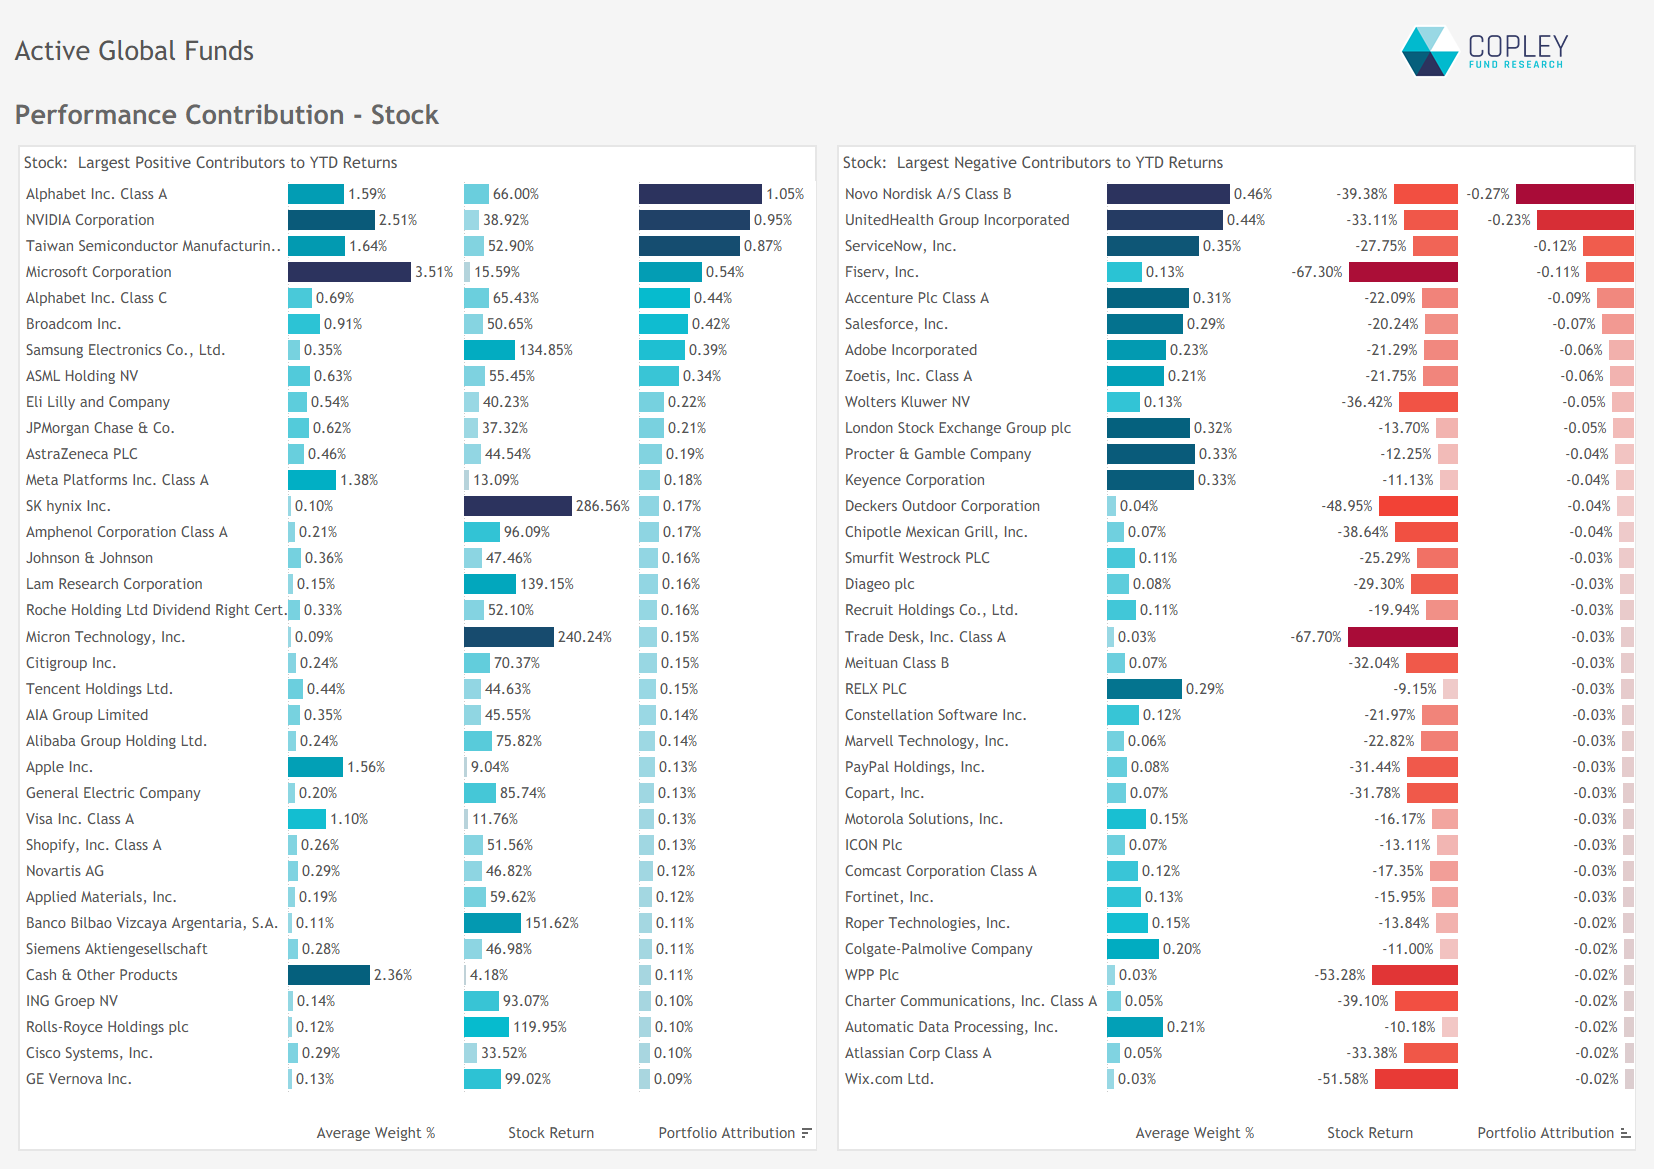
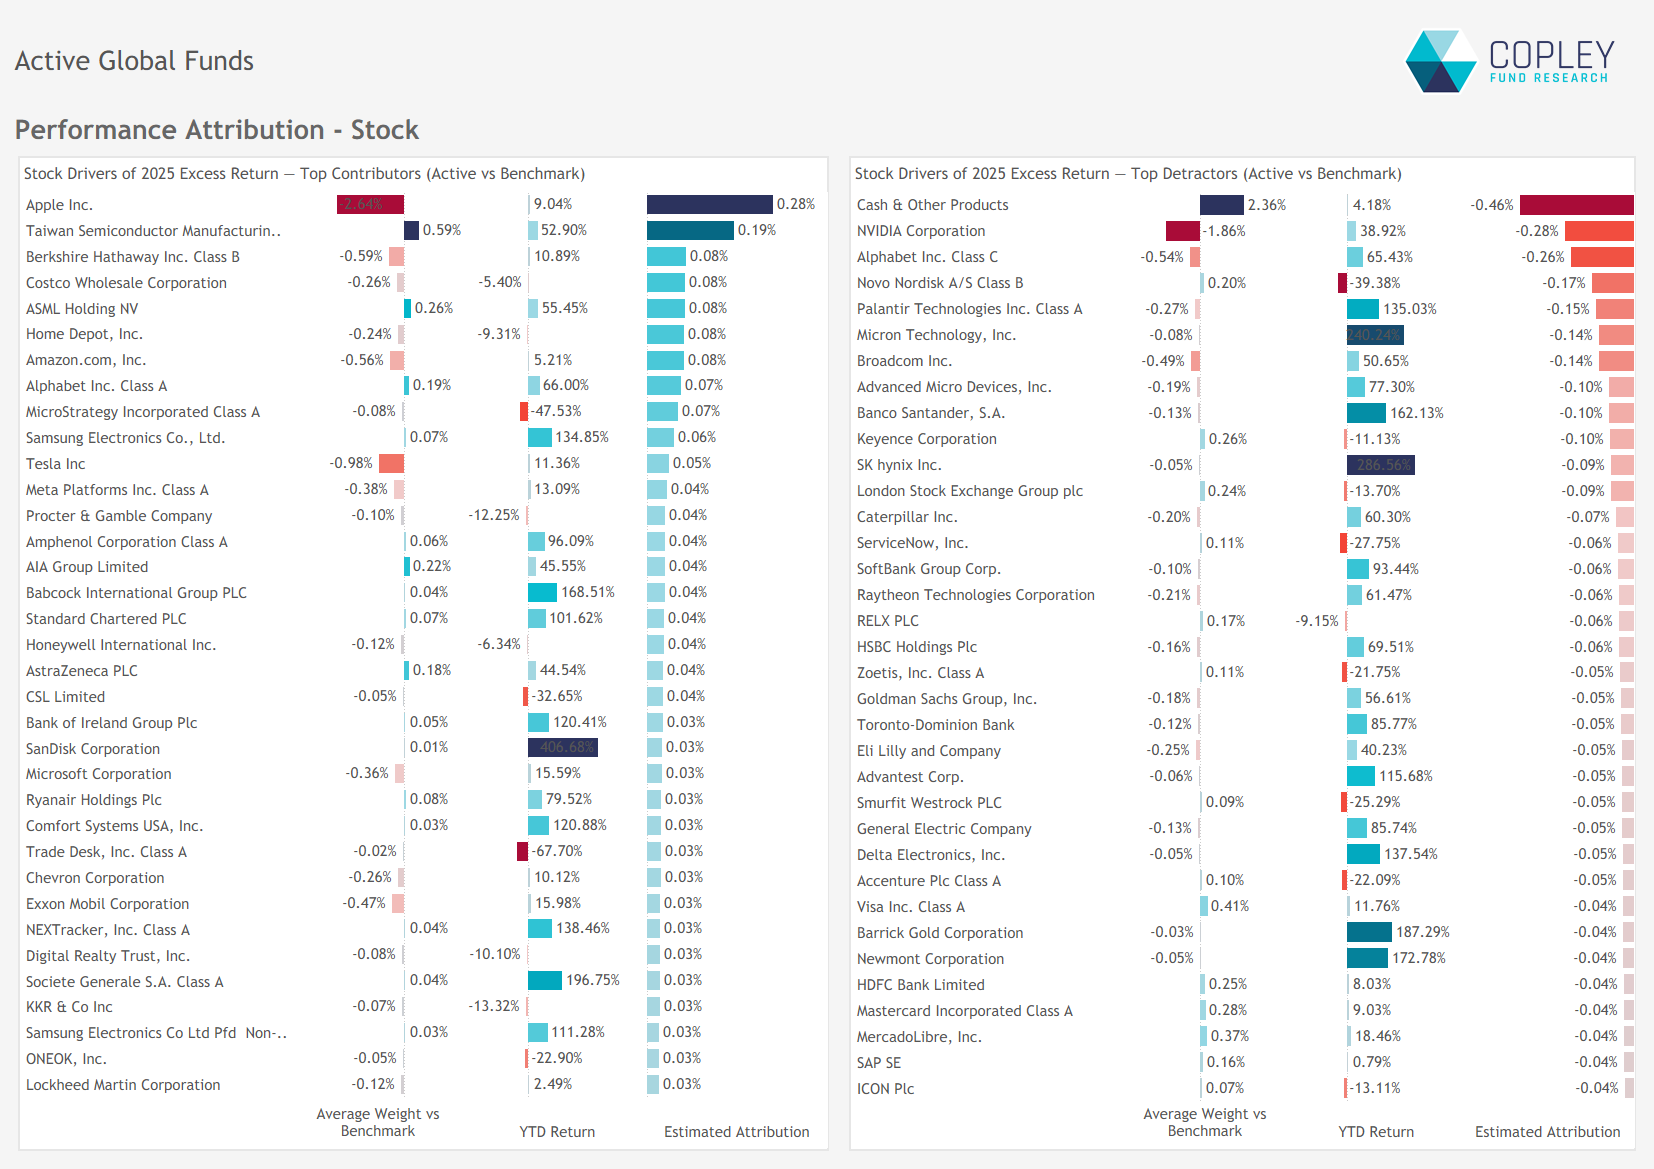
Stock-Level Influence: A Broad Base of Winners, Few Detractors At the stock level, returns in 2025 were driven by a wide range of contributors, with gains led by key members of the “Mag 8” alongside strong performances from TSMC and Samsung Electronics. The breadth of positive contributions was notable, with the top 10 contributors accounting for just 27% of total fund returns for the year — underscoring the diversified nature of stock-level performance.
Detractors, by contrast, were fewer and less impactful. The ratio of stocks with positive versus negative contributions stood at roughly 2:1. Among the laggards, Novo Nordisk led the losses with a 39.4% decline, followed by UnitedHealth Group at -33% — the most significant individual drags on performance.
Performance Attribution – Where Did the Losses Come From? The chart below highlights the main sources of outperformance and underperformance versus the benchmark at the country/sector level. The largest single driver of fund losses versus the benchmark was poor stock selection in US Technology. The underweight call was the correct one, but individual over and underweights were misplaced and the benchmark won out. We mustn’t understate the influence on Cash holding on Global performance, which during strong markets are an obvious drag – last year costing the average manager 0.5%.
Pockets of outperformance were smaller in magnitude, with the US Consumer Discretionary underweight leading the winners, alongside Taiwan Tech Overweights and US Energy Underweights.
Stock Attribution Active Global managers made marginal gains from their underweight in Apple, alongside overweights in TSMC and ASML, and smaller contributions from underperformers like Costco and Berkshire Hathaway.
But losses outweighed gains. Underweights in NVIDIA and Alphabet — along with smaller underweights in high-return names like Palantir and Micron — hurt performance versus the benchmark. On top of that, overweights in Novo Nordisk, Keyence Corp, and London Stock Exchange further extended relative losses.
Long-Term Performance: Benchmark dominance persists, but for how long? This year’s underperformance marks the fifth consecutive year active Global equity funds have lagged the MSCI ACWI ETF — and ranks as the third-largest relative loss since 2012. The ETF has now landed in the top third of the fund universe for three straight years, with its 10-year return sitting a substantial 48.5% ahead of the average active manager.
For those who have managed to outperform, this backdrop offers compelling evidence to support fund marketing and asset gathering — highlighting just how rare benchmark-beating performance has become.
For the rest, there’s perhaps some consolation in the fact that US Technology continues to dominate benchmark returns. If that trend were to reverse or fade, the relative landscape could shift. Still, the consistency of underperformance makes it clear: the challenge of beating the passive default has rarely been higher.
Performance & Attribution Report
Click the link opposite for full charts and data detailing the drivers of 2025 performance, along with a review of 3-, 5-, and 10-year results across the active Global peer group.