Is South Korea back in favour? The data suggests a decisive shift. After a prolonged period of underweight positioning, Asia ex-Japan managers have moved South Korea to the largest country overweight in the region. It is now the second-largest allocation overall and sits at record levels of aggregate exposure.
What is driving the move? The answer is clear: Samsung Electronics and SK Hynix. The two stocks account for 63.4% of total South Korea exposure — a record concentration — and are held at a combined +2.8% overweight versus the index. By contrast, the rest of the country remains underweight on average.
So is this a country story or a stock story? The evidence points to the latter. South Korea’s return to overweight status is real, but it is narrowly led. This is a two-stock phenomenon rather than a broad-based reappraisal of the market.
Click above for the full South Korea Market Intelligence report, featuring detailed fund-level breakdowns of country, sector and stock exposure, plus time-series trends and positioning gap analysis.
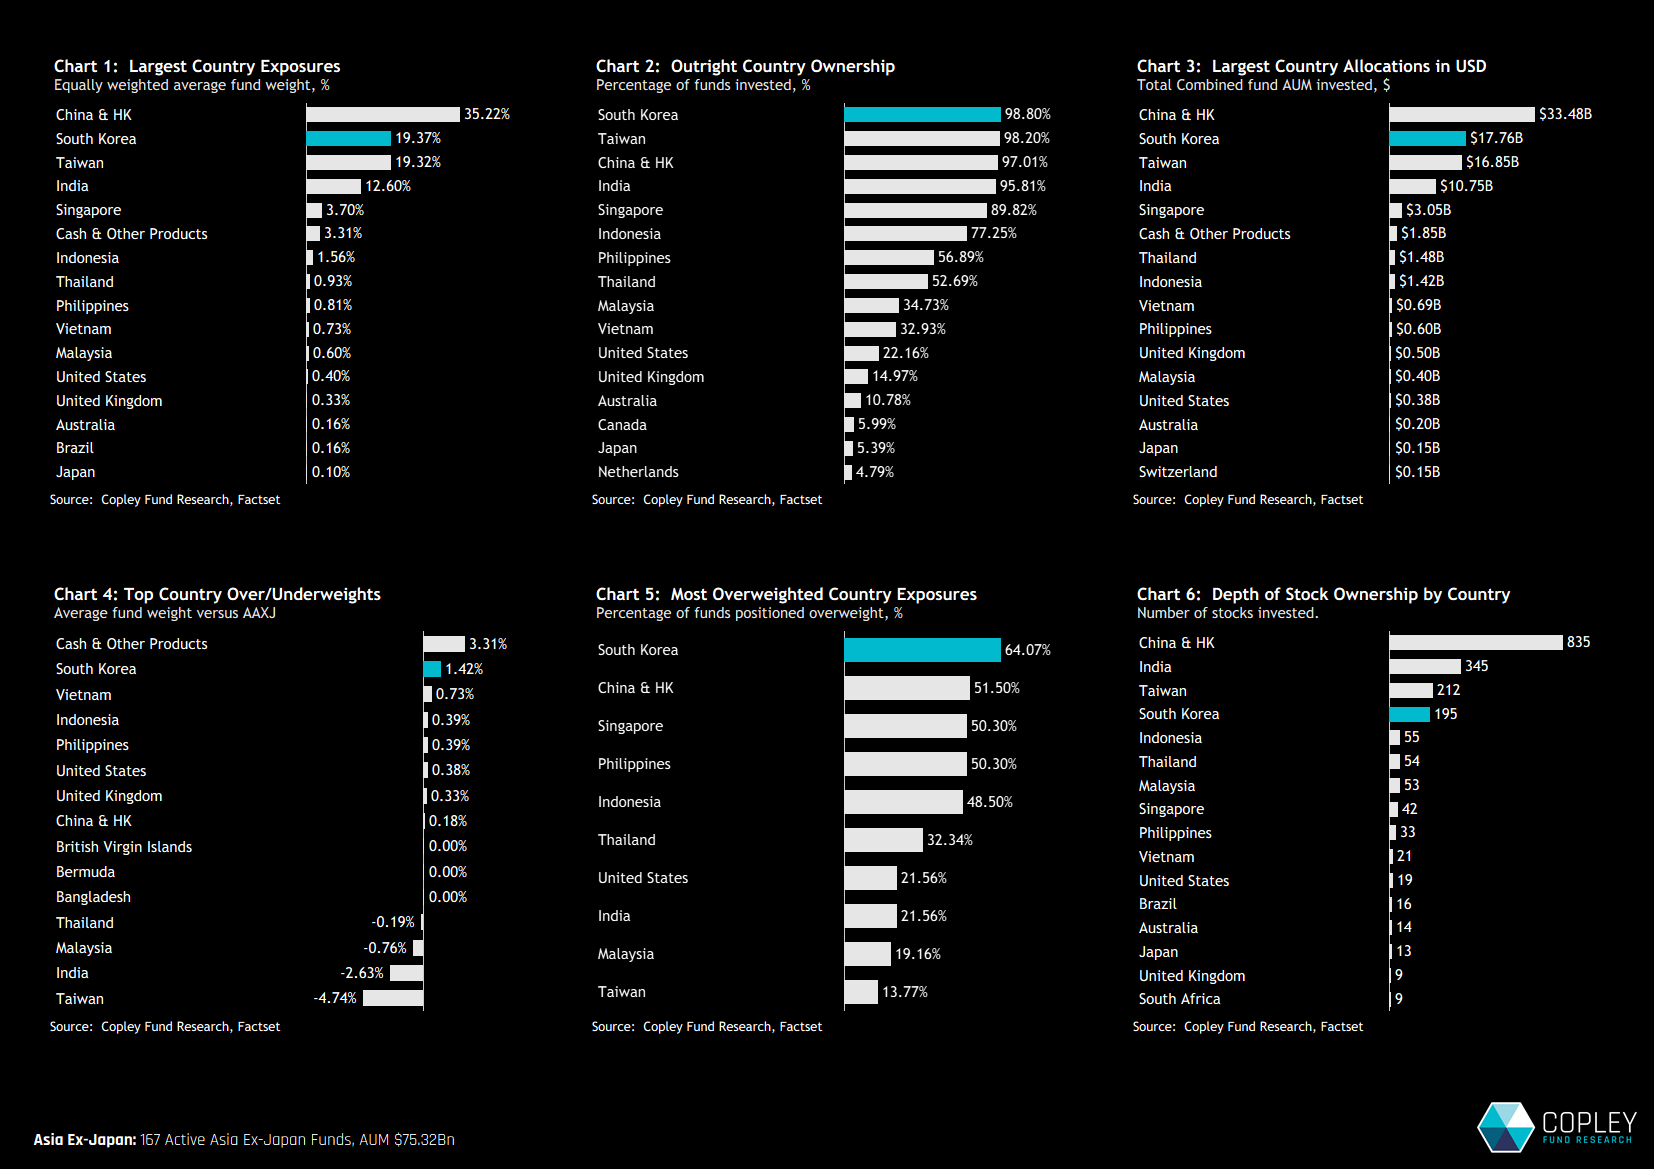
Country Positioning The charts below show current ownership dynamics at the country level for Asia ex-Japan active equity funds. Chart 1 shows the average country weight across managers. South Korea is now the second-largest allocation in the region at 19.37%, marginally ahead of Taiwan (19.32%) and India (12.60%), but still well behind China & HK (35.22%). Together, these four markets dominate active allocations in Asia ex-Japan.
Relative to the benchmark, South Korea is starting to see clear support. It is currently the largest country overweight at +1.42% versus the index (Chart 4), with 64.1% of funds positioned overweight (Chart 5). This contrasts sharply with Taiwan, where 86% of funds are underweight, at an average of -4.7% versus the benchmark.
Asia Big Four – Long-Term Dynamics
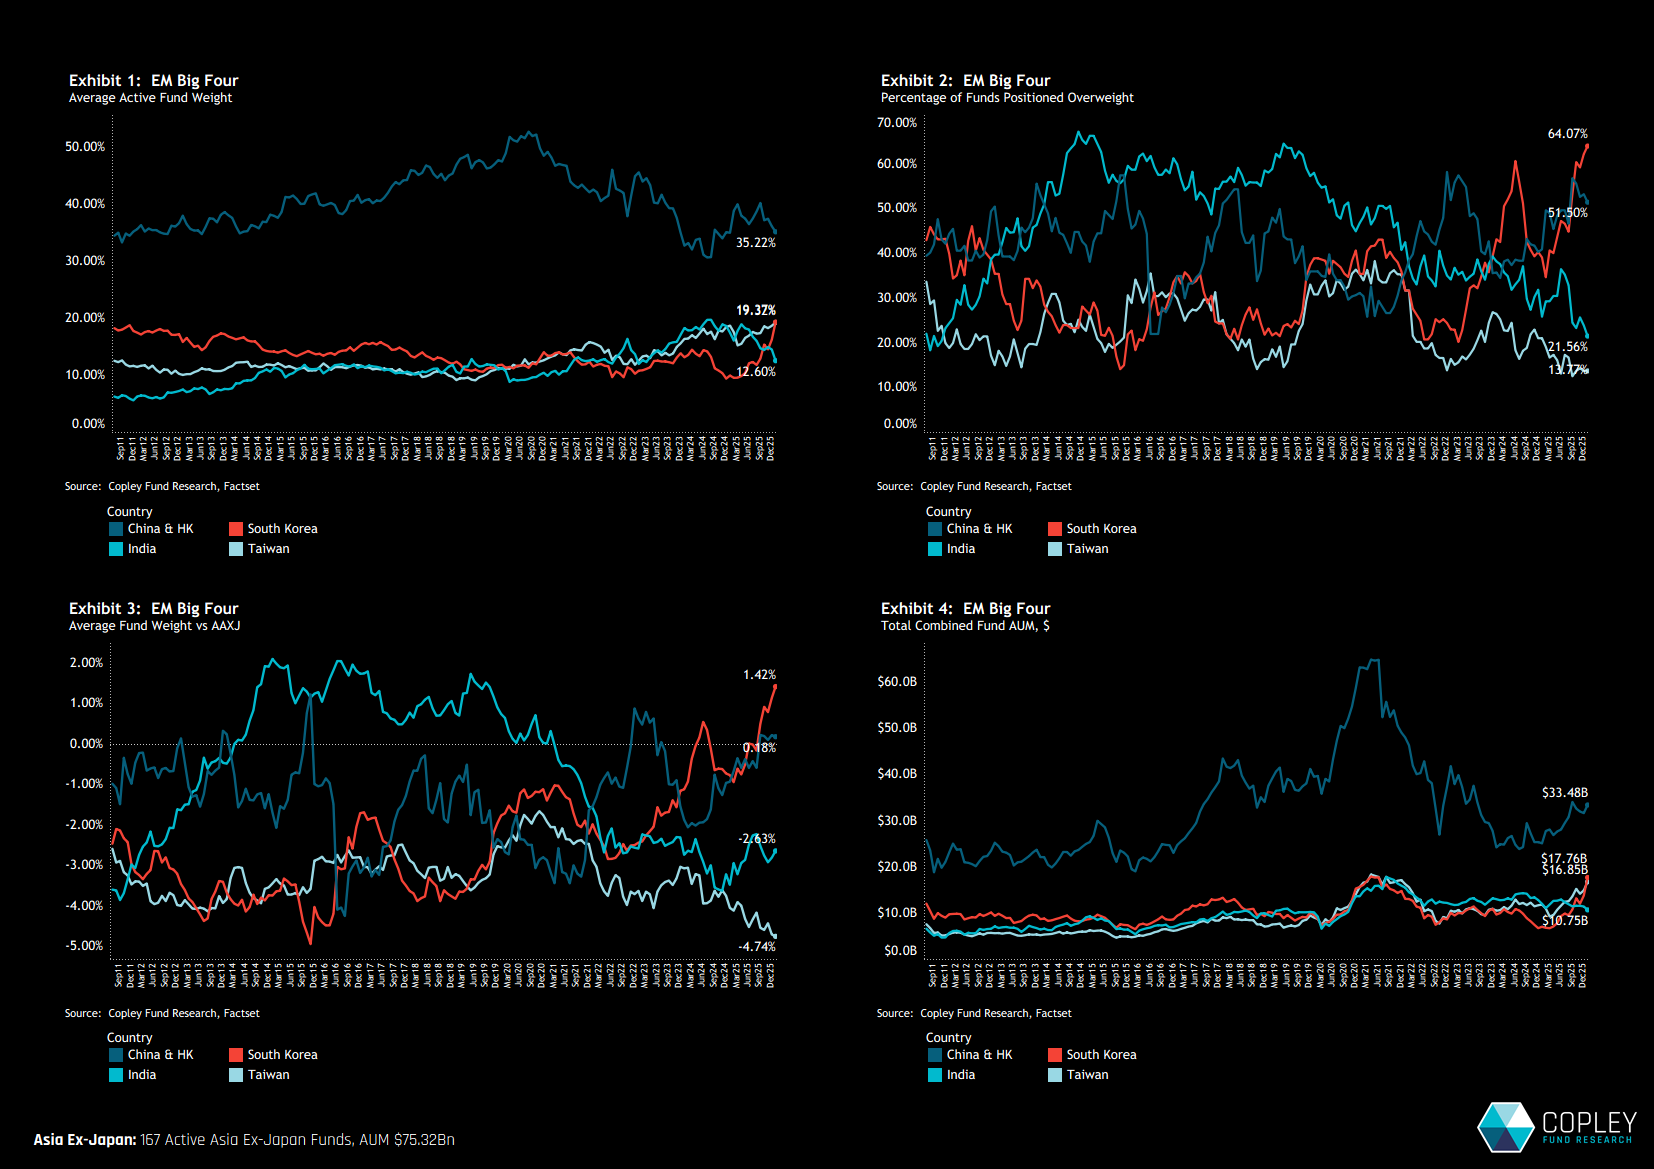
Regular readers will know this has not always been the case. The time-series charts below show South Korea’s rise through 2025. Exhibit 1 shows South Korea overtaking both India and Taiwan to become the second-largest allocation in just 12 months. Over the same period, Asia ex-Japan funds moved from a net underweight to a clear overweight position (Exhibit 3), alongside a marked increase in the percentage of funds positioned overweight (Exhibit 2).
This was a deliberate active reallocation in favour of South Korea.
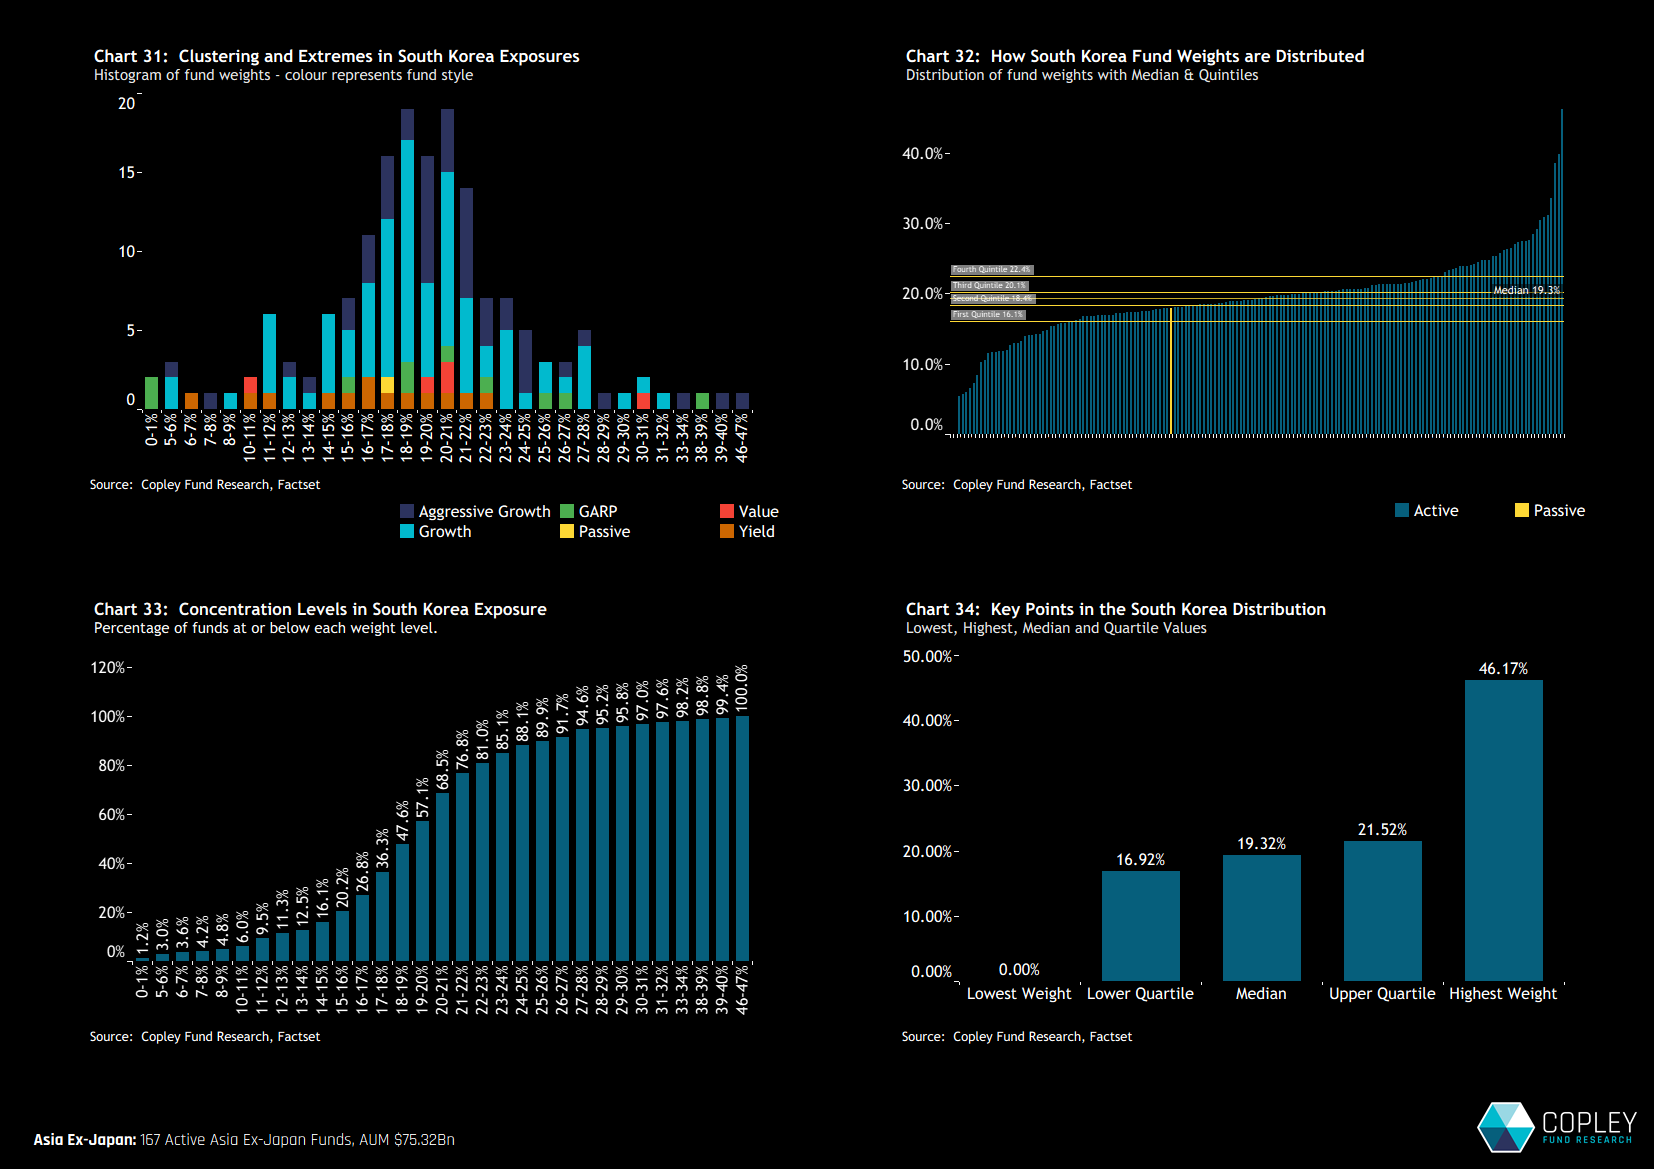
Fund-Level Positioning Chart 31 shows the distribution of fund weights in South Korea. The bulk of allocations sit between 16% and 22%, with a broadly normal distribution and a smaller tail extending to more bullish positions above 30%.
Chart 32 shows that 60% of funds hold weights between the lower and upper quintiles of 16.1% and 22.4%. Importantly, overweight positions are clustered just above the 18% benchmark weight rather than skewed aggressively higher. Only a smaller cohort of funds sits at the top end of the range.
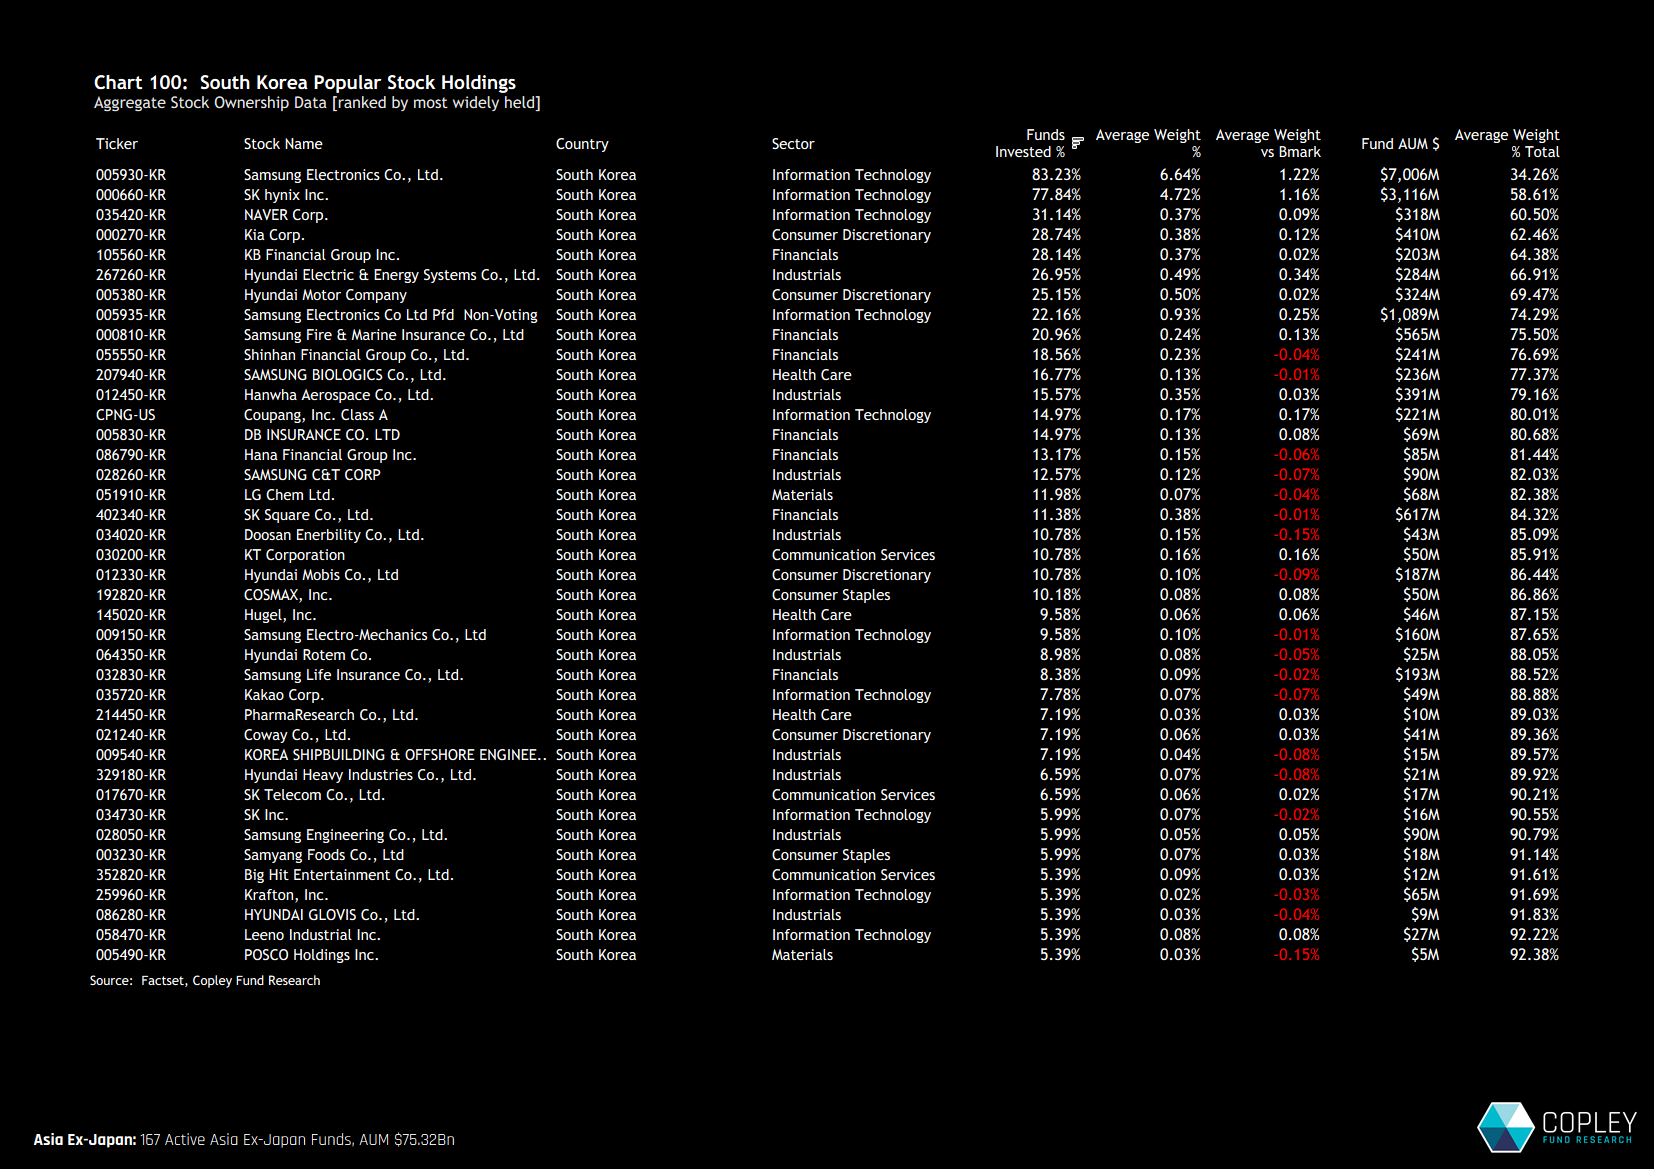
Stock-Level Positioning Chart 100 breaks down South Korean ownership at the stock level. On an average weight basis, Samsung Electronics and SK Hynix dominate allocations. Combined, they account for 12.44% of average fund weight and 63.4% of total South Korea exposure (including Samsung ordinary and preferred shares).
Beyond these two names — which are also the largest overweight positions — ownership falls away sharply. A distinct second tier has emerged, with 25–32% of funds holding positions in stocks such as Naver Corp, Kia Corp and KB Financial. A further 15 companies are owned by more than 10% of funds
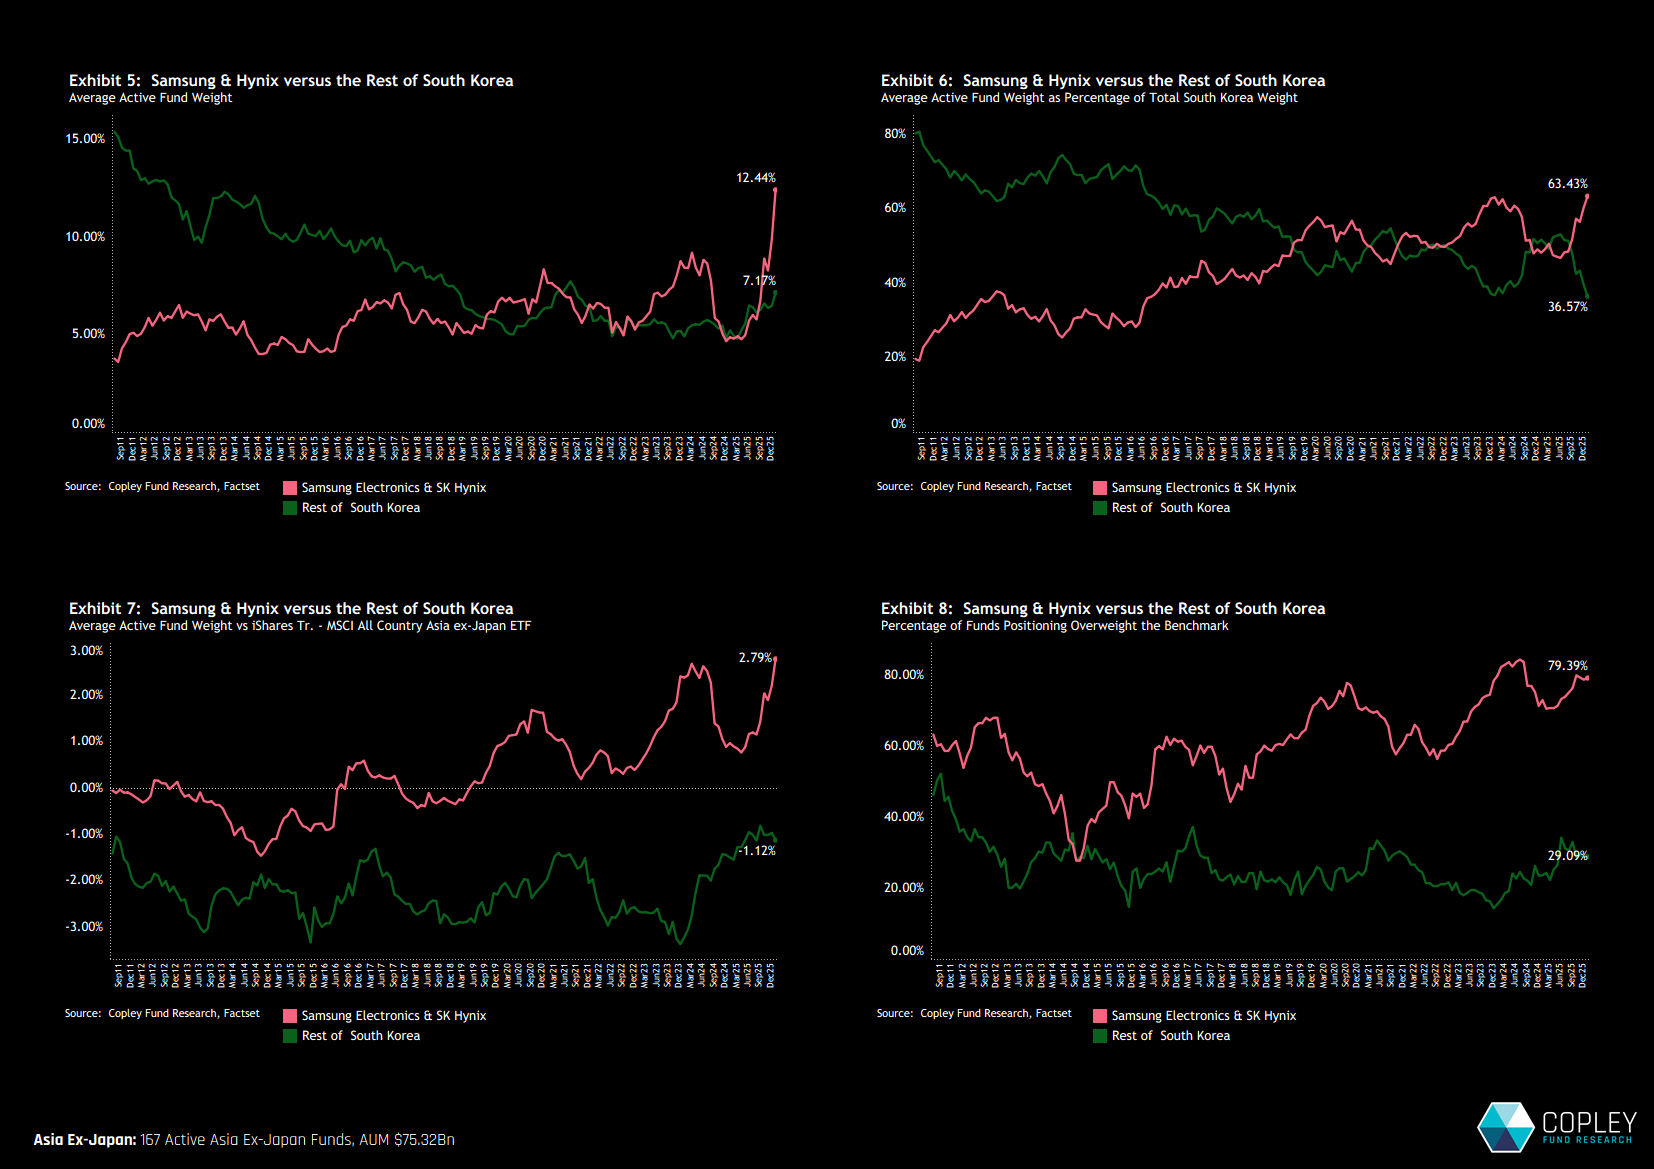
South Korea’s Concentration Risks The charts below highlight the growing reliance on Samsung Electronics and SK Hynix within total South Korea exposure. Much of the recent increase in country weight has been driven by these two companies, while the “Rest of South Korea” (shown in green) has only recovered marginally from the lows in late 2024 (Exhibit 5).
The top two stocks now account for 63.4% of total South Korea exposure — a record high, although comparable to the concentration seen in early 2024 (Exhibit 6). Positioning versus the AC Asia ex-Japan index is even more revealing. Managers hold the top two stocks at an average +2.8% overweight, while the remainder of the country is, on average, -1.12% underweight (Exhibit 7).
We should not interpret South Korea’s new overweight status as a broad-based shift in country conviction. This is a two-stock phenomenon.
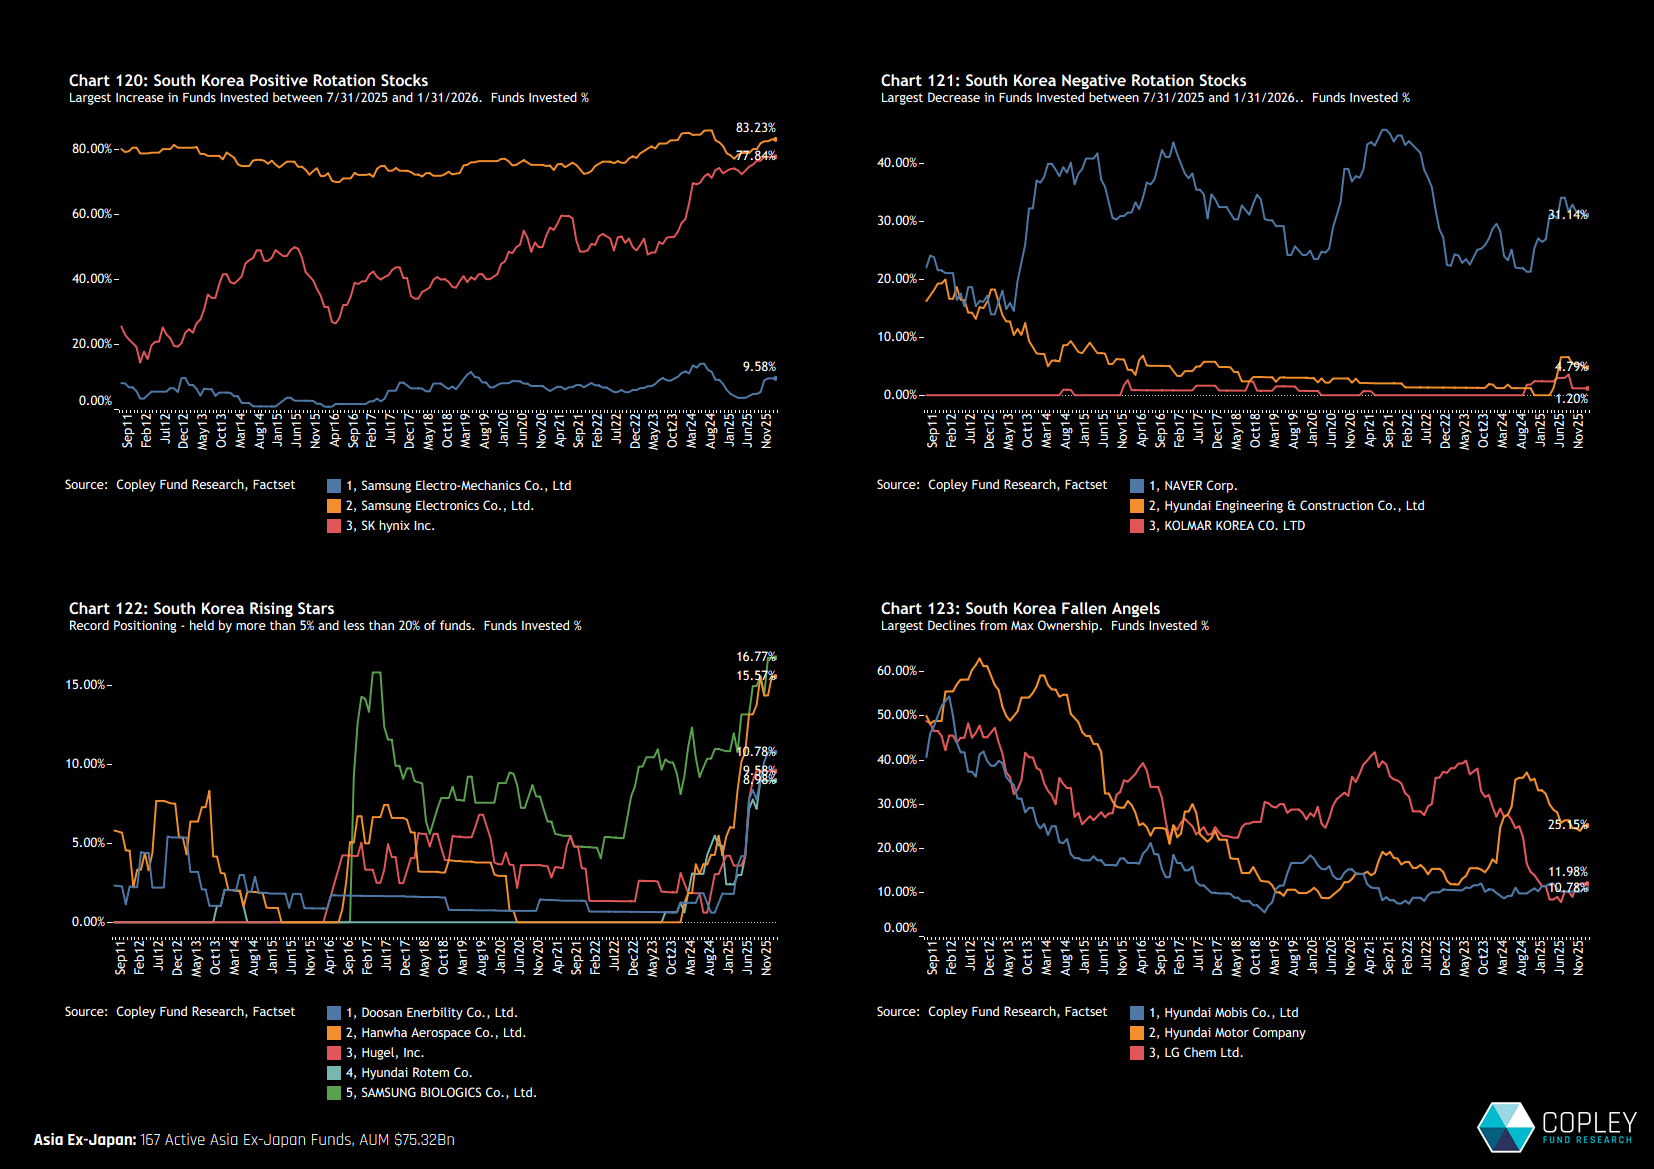
Stock to Watch We highlight 14 stocks that stand out in our analysis. Chart 120 shows the long-term percentage of funds invested in stocks seeing the largest short-term increases in ownership. SK Hynix is at new highs, while Samsung Electronics is moving back towards prior peak ownership levels. Samsung Electro-Mechanics, meanwhile, has seen a notable uptick from a much lower base.
Chart 121 highlights the largest declines in ownership. Naver Corp has clearly lost momentum in recent months. Hyundai Engineering & Construction and Kolmar Korea have also failed to gain traction among managers.
South Korea’s “rising stars” are shown in Chart 122. These are stocks at record ownership levels but still held by only 5–20% of managers — meaning they are not yet fully established positions. Hanwha Aerospace and Samsung Biologics lead this group, both showing significant increases in fund ownership over the past 12 months.
Finally, Chart 123 identifies South Korea’s “fallen angels” — stocks that were once core holdings but have seen sustained declines in ownership over the past decade. LG Chem and Hyundai Mobis stand out here, now largely absent from Asia ex-Japan active portfolios.