Emerging Markets Stock Radar: Positioning Concentrates as the Middle Hollowes Out

Global Emerging Markets

March 26th 2026

Executive Summary

Active GEM portfolios are becoming increasingly concentrated in a narrow set of high-conviction names, with limited breadth beyond the top tier. While the overall universe remains large (~3,900 stocks), ownership is highly skewed, with the majority of names held by only a small fraction of funds and at low weights. Capital has continued to migrate toward the most widely owned stocks, with the >70% ownership cohort reaching record weight levels, driven primarily by TSMC and Samsung. At the same time, the mid-ownership segment (30–70%)—historically the core of portfolios—has seen its relevance decline, with weights falling to cycle lows despite stable breadth.
Importantly, positioning at the top end is becoming self-reinforcing. As ownership broadens, the cost of not holding these names increases, encouraging further inflows and reinforcing their dominance in portfolios. Further down the spectrum, the 15–30% and 0–15% cohorts remain broad but low conviction, though select names are emerging where strong position sizing suggests potential for future adoption. Overall, positioning is increasingly barbelled: concentrated at the top, fragmented at the bottom, and thinning in the middle.

How Many Companies Do Active GEM Investors Own?
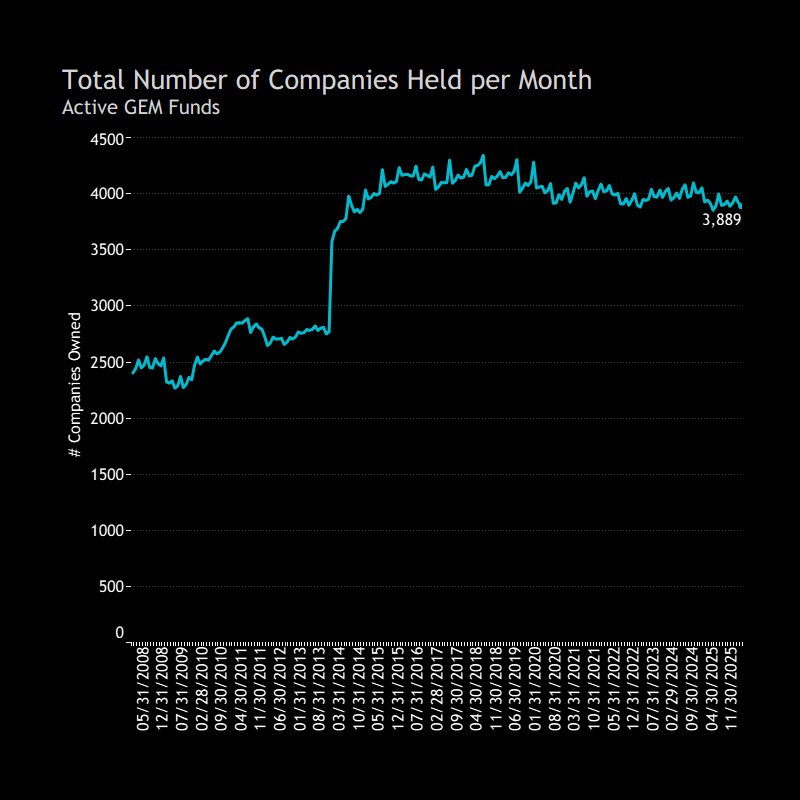
The total number of companies held by active GEM funds was broadly stable at 2,500–3,000 through 2008–2013, before rising to ~4,000 following the introduction of a large quant-style strategy. Since then, it has remained within a relatively tight range. Today, 353 funds hold 3,889 companies.

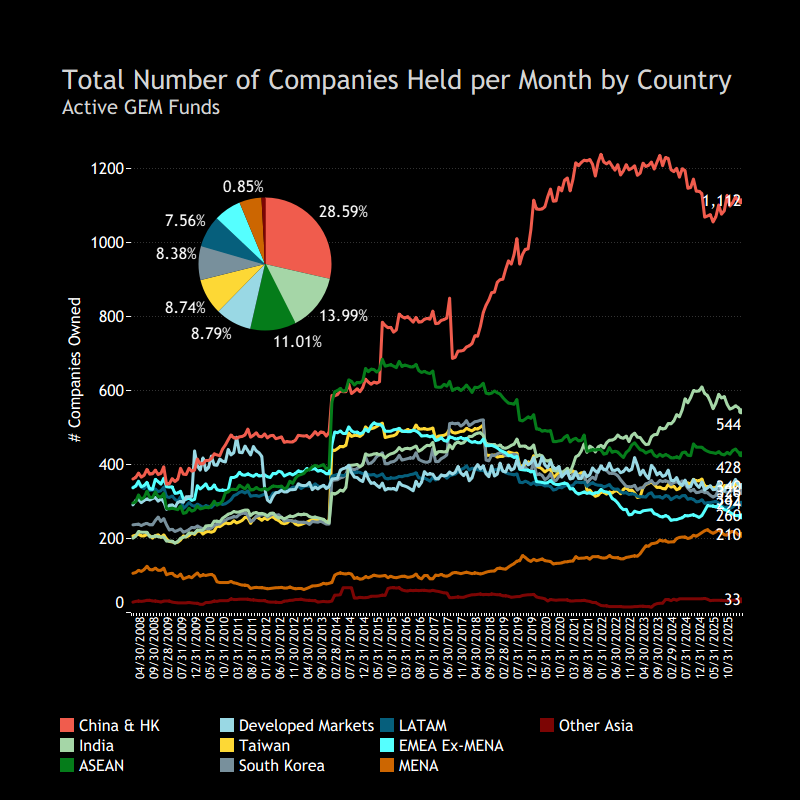
By region, China & Hong Kong accounts for the largest share (1,112 companies), followed by India (544) and ASEAN (428). Together, these three regions represent 53.6% of all holdings. Exposure to MENA has increased, while the number of companies held in ASEAN and EMEA ex-MENA has declined.

Ownership Breadth
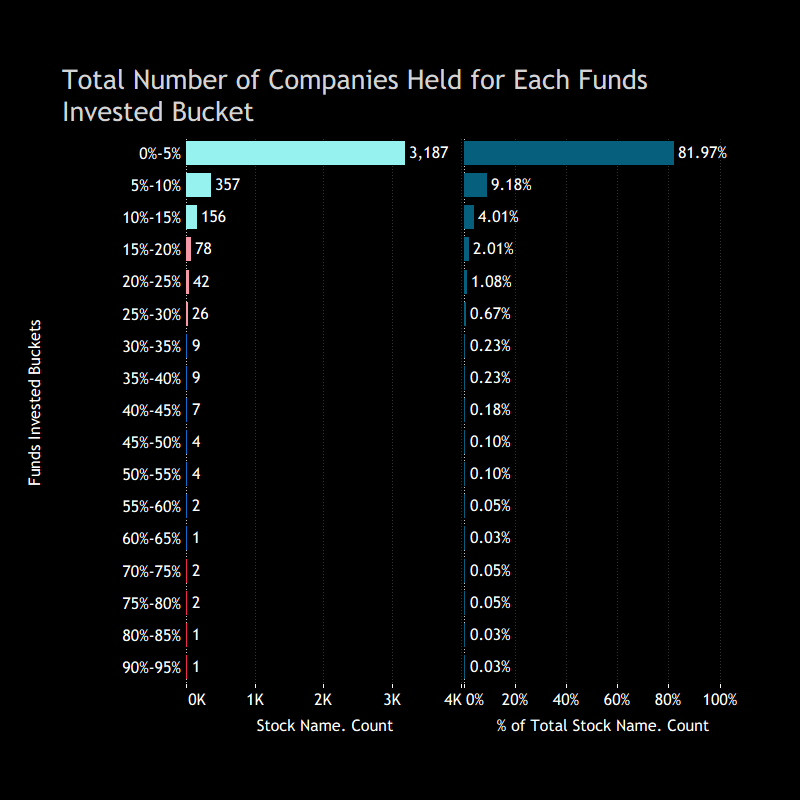
Ownership breadth is highly skewed. The majority of stocks are held by only a small fraction of funds, with 3,187 names owned by fewer than 5% of investors each. Beyond this, the number of stocks declines rapidly as ownership broadens, indicating that only a limited subset of companies is widely held.

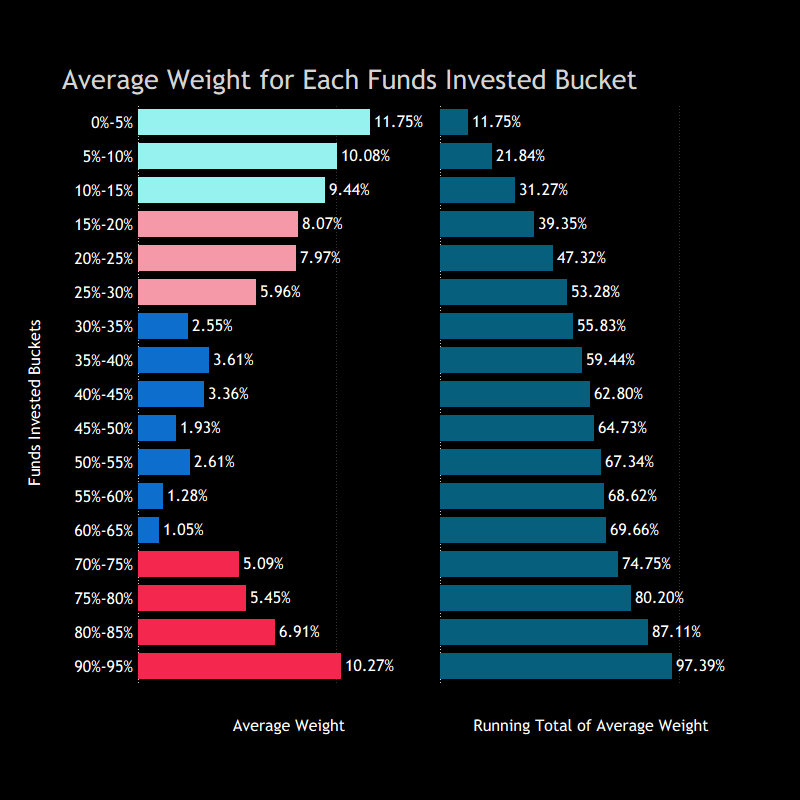
Importantly, these low-ownership names also carry relatively small weights. Stocks held by fewer funds tend to be held at lower average positions, while higher-ownership buckets are associated with larger weights. This reinforces the concentration of capital in a narrow group of widely held names, with the long tail of stocks remaining both under-owned and low conviction.

Concentration on the Rise
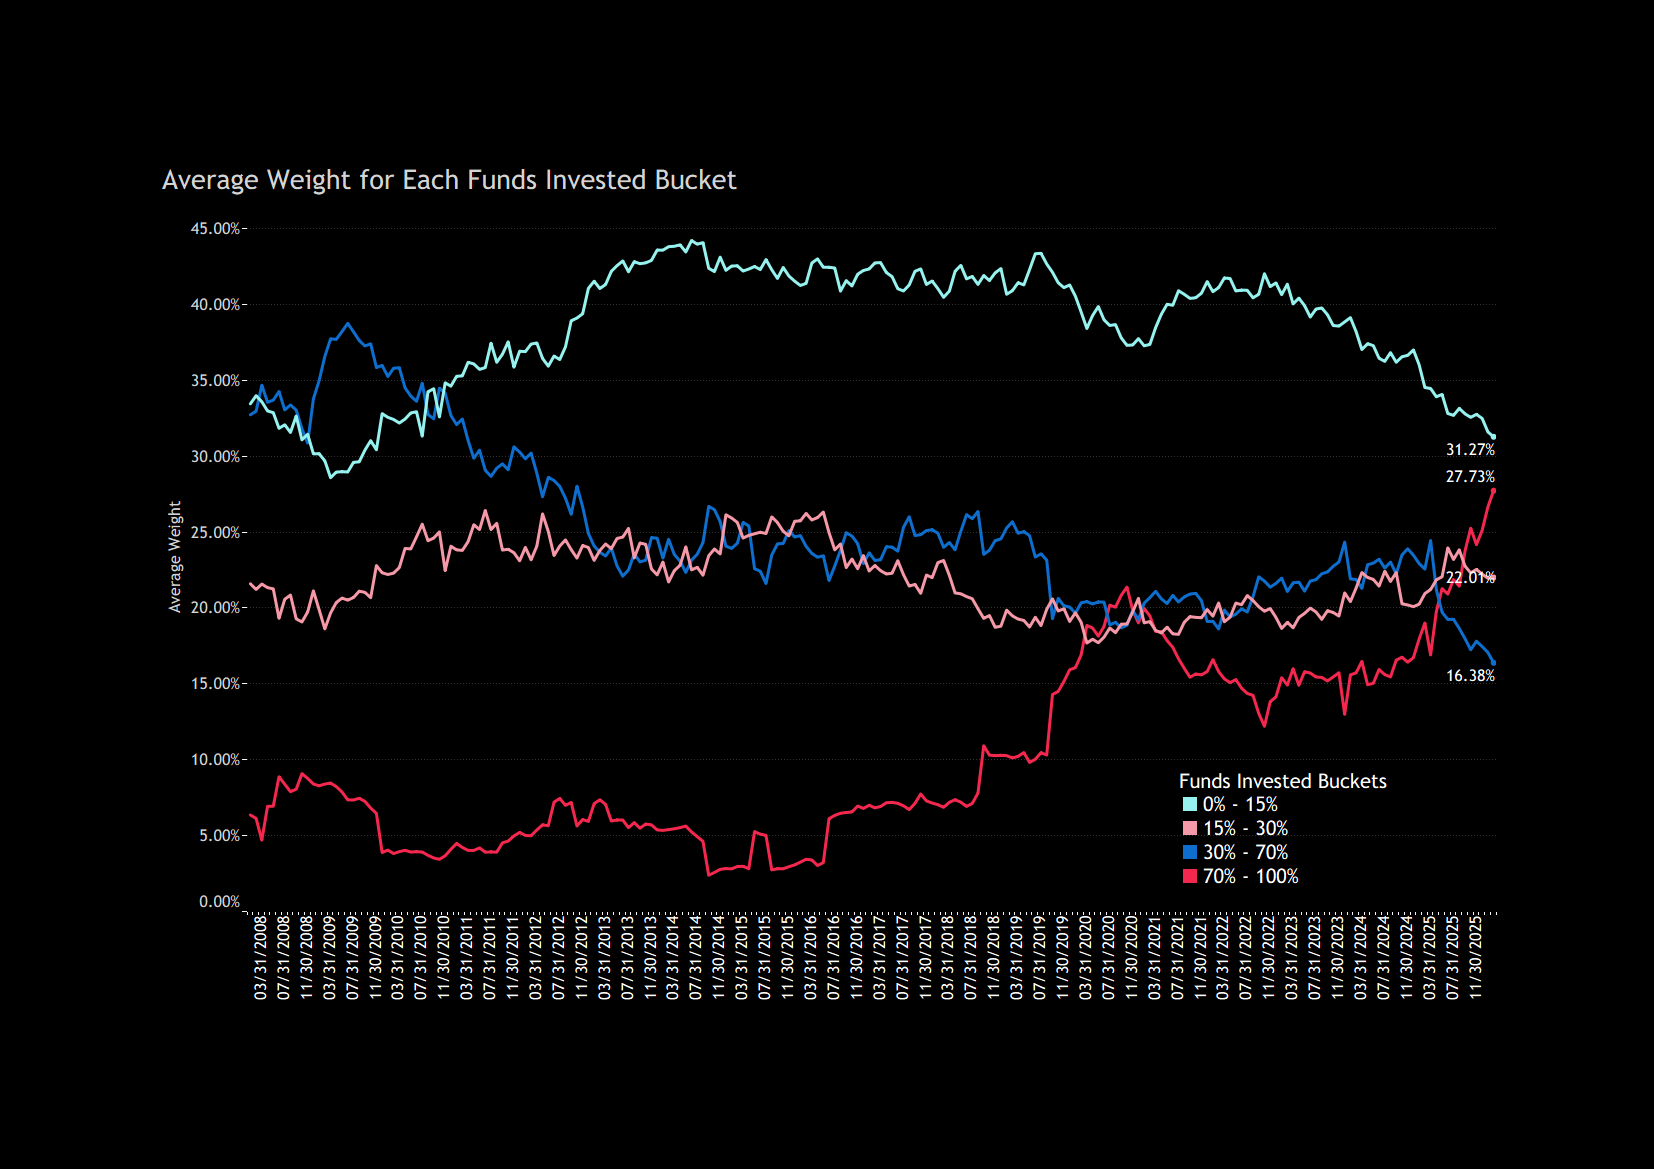
Over time, capital has become increasingly concentrated in the most widely held names. Stocks owned by more than 70% of funds have seen a steady increase in their share of average portfolio weight. In contrast, stocks held by fewer than 15% of funds have continued to lose weight, reinforcing the lack of depth in the long tail. Weights in the mid-ownership buckets (30–70%) have also trended lower, suggesting a hollowing out of positioning between high-conviction crowded names and the under-owned universe.

Stocks held by more than 70% of funds

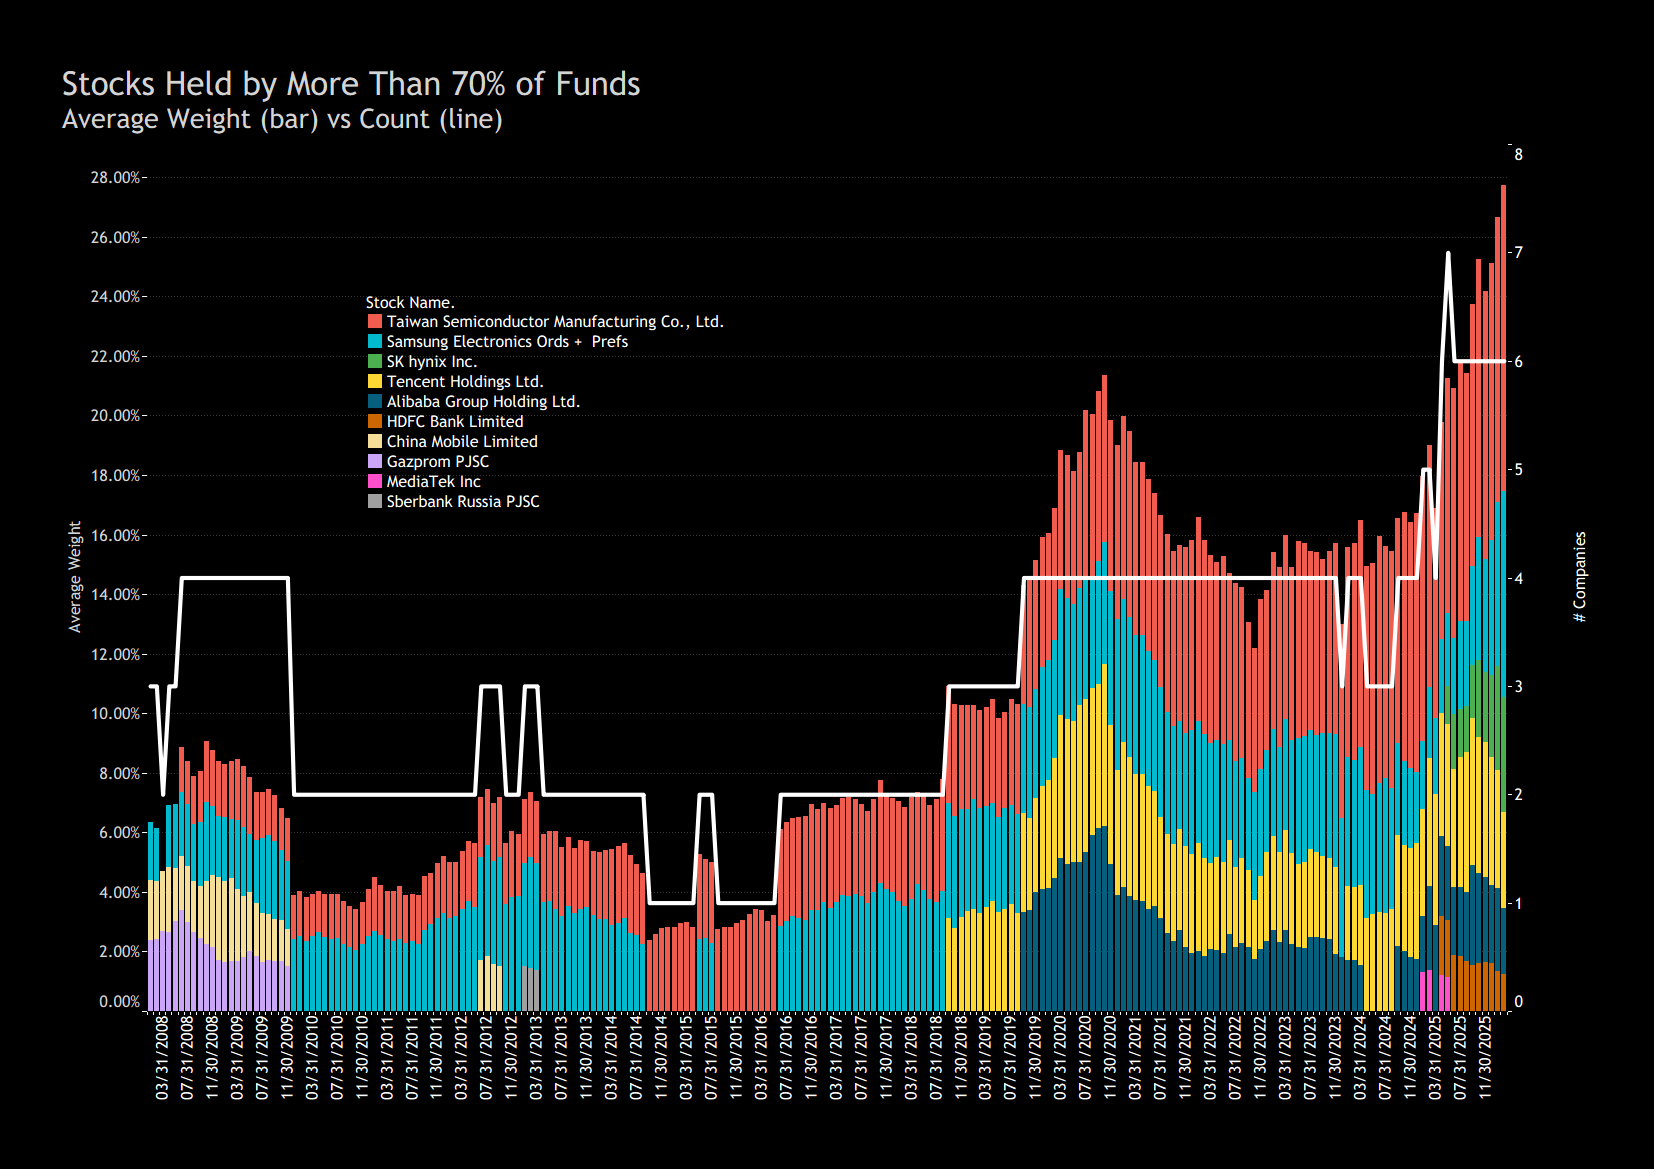
The number of stocks reaching such a broad ownership base remains very limited. Since 2008, only 10 companies have ever been held by more than 70% of funds at any one time, with the count never exceeding four in any month prior to 2025.

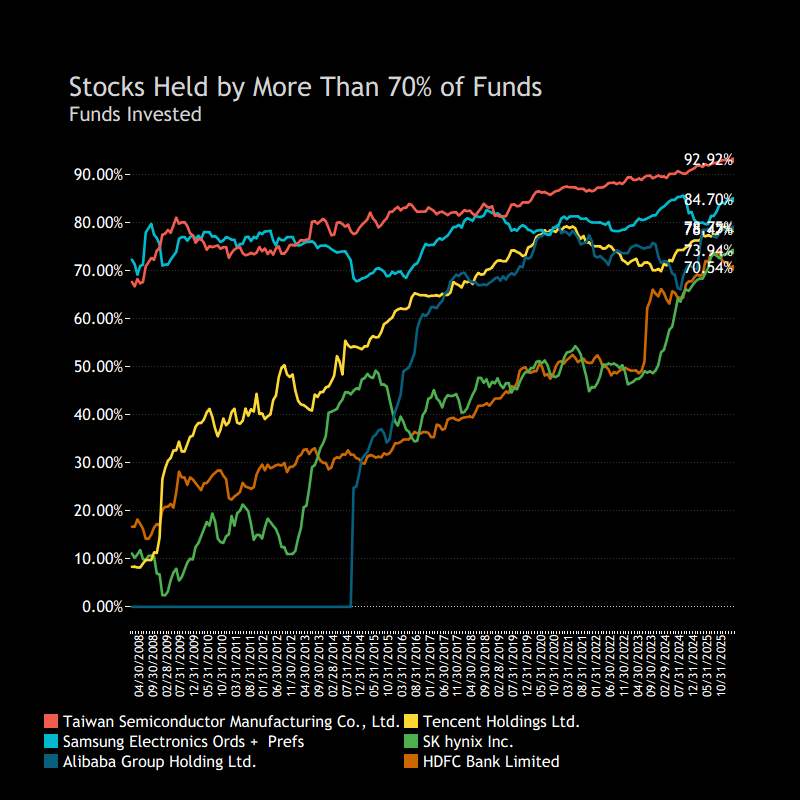
Today, that number has increased to six, with TSMC, Samsung Electronics, SK Hynix, Tencent, Alibaba and HDFC Bank also carrying record combined weights. This points to a growing reliance on a very small group of widely held stocks.

Ownership Trends within the 70% Club
All six names have steadily moved into the 70% club, signaling increasingly crowded and consensus positioning across funds.

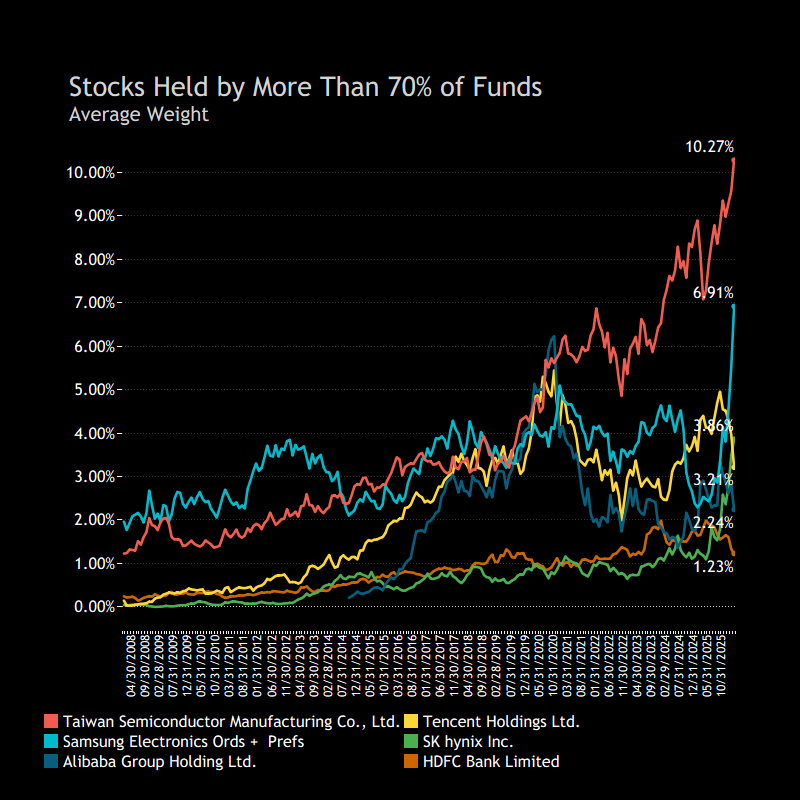
However, positioning strength is not evenly distributed. The rise in portfolio concentration has been driven primarily by TSMC and Samsung, where average weights have moved meaningfully higher—elevating both to almost ‘must own’ holdings.

In contrast, the rest of the cohort has seen ownership catch up, but weights remain comparatively muted, indicating broader participation without the same level of conviction.

The 30% - 70% Cohort

Hollowing Out – Is the middle losing its relevence?
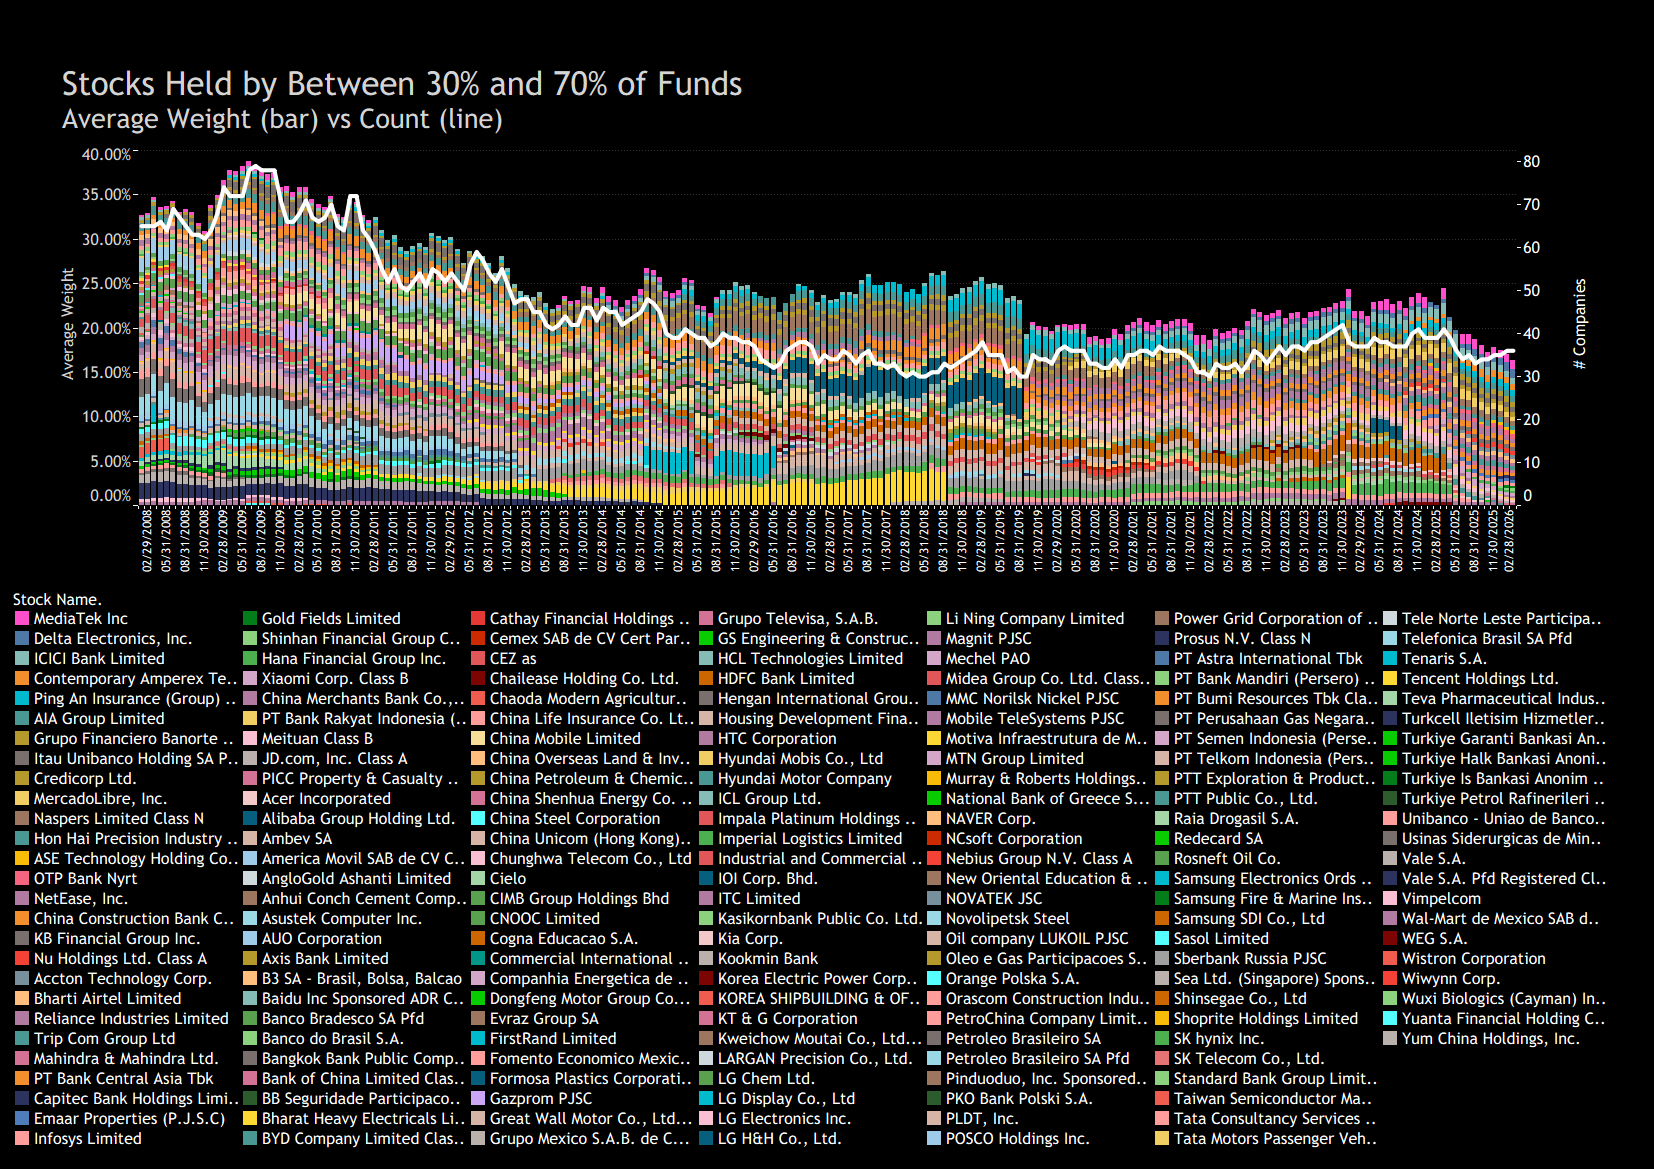
The 30–70% ownership bucket is a far less exlusive club, with ~180 companies reaching the milestone at some point since 2008. But despite this breadth, its portfolio relevance has been steadily eroding.

Historically, this cohort represented a meaningful share of fund allocations—the “core middle” of portfolios. Today, that is no longer the case. Average weights have compressed to all-time lows, even as the number of names remains stable.

30–70% Cohort: Snapshot & Turnover Dynamics
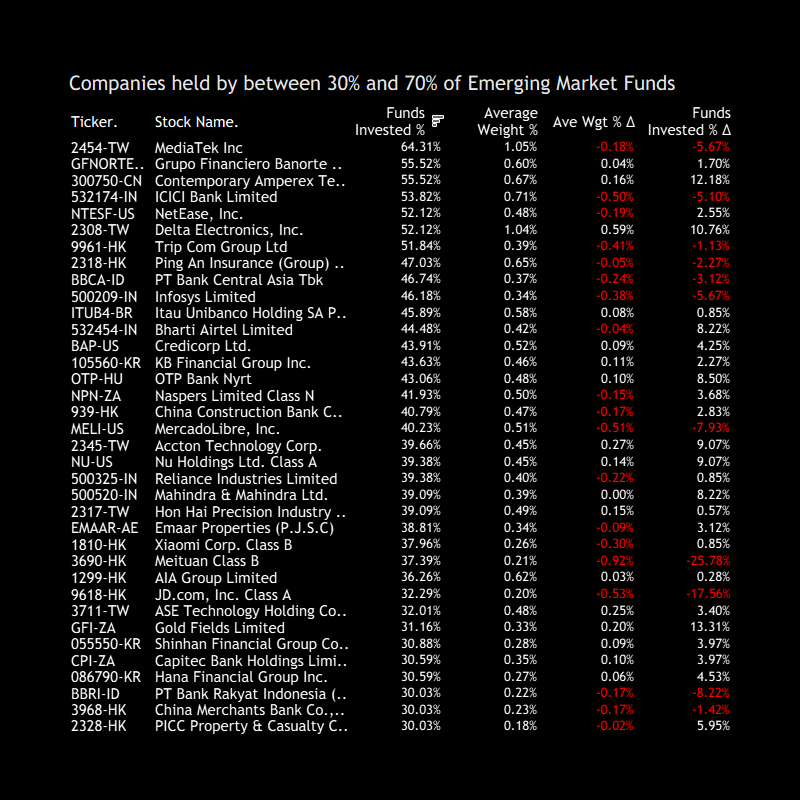
The left chart highlights the current 36 members of the 30–70% ownership cohort, led by MediaTek and Grupo Financiero Banorte as the most widely held names in the group.

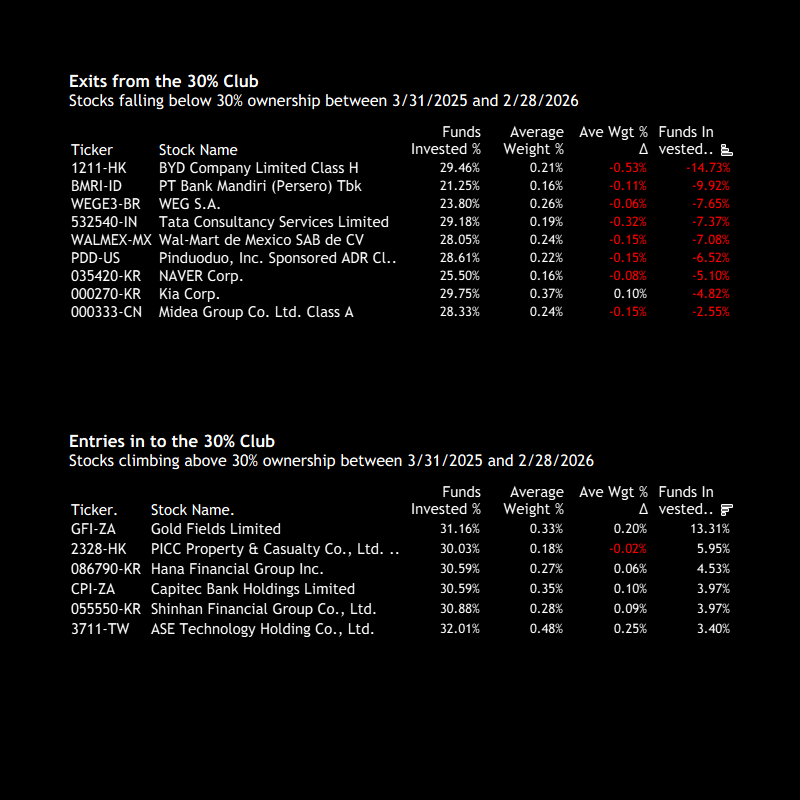
Over the period, turnover has remained active. Nine names have exited, including BYD, Bank Mandiri, and Walmart de Mexico, while six have entered, led by Goldfields, PICC Property & Casualty, and Hana Financial.

Diverging Paths Within the Middle Cohort
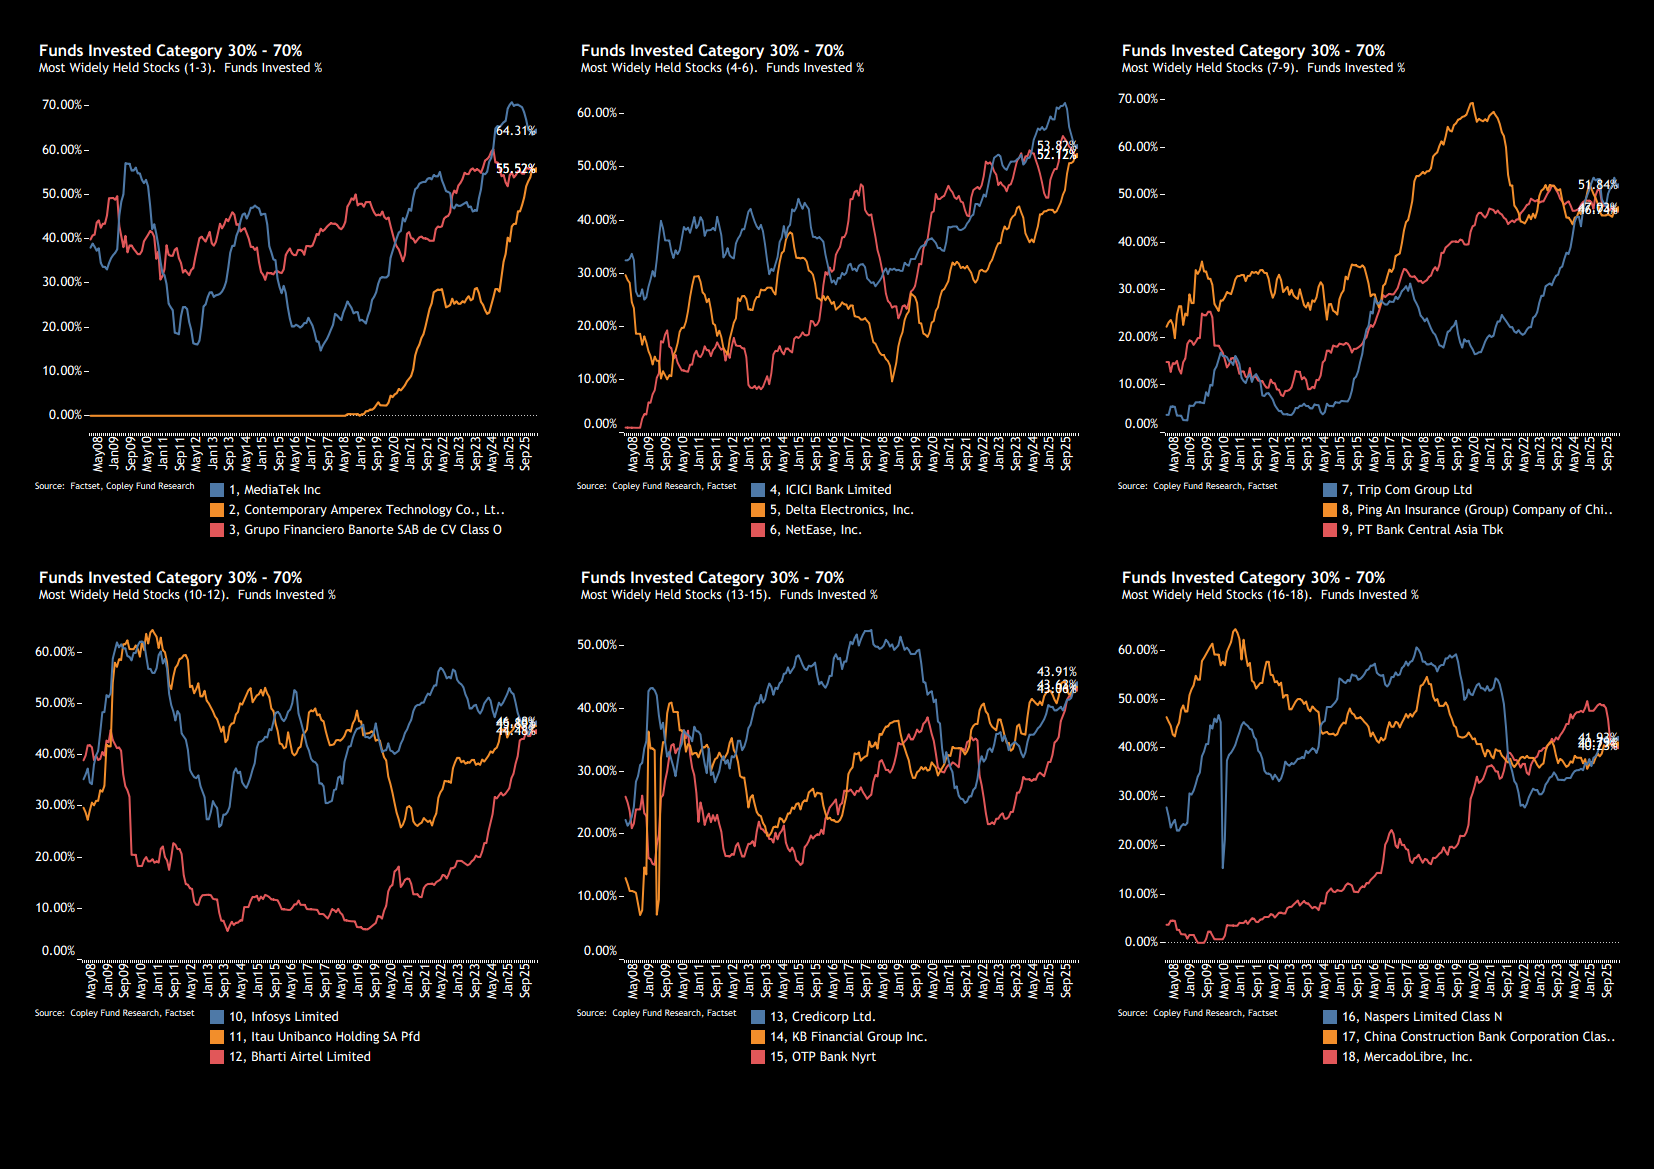
Ownership trends within the 30–70% bucket show some clear divergences. Record highs are evident in CATL, Delta Electronics and OTP Bank, while ownership has reversed in MercadoLibre, MediaTek and ICICI Bank.

Recoveries in Credicorp, Itaú Unibanco and Naspers are also notable.

The 15% - 30% Cohort

Broad but Lower Conviction
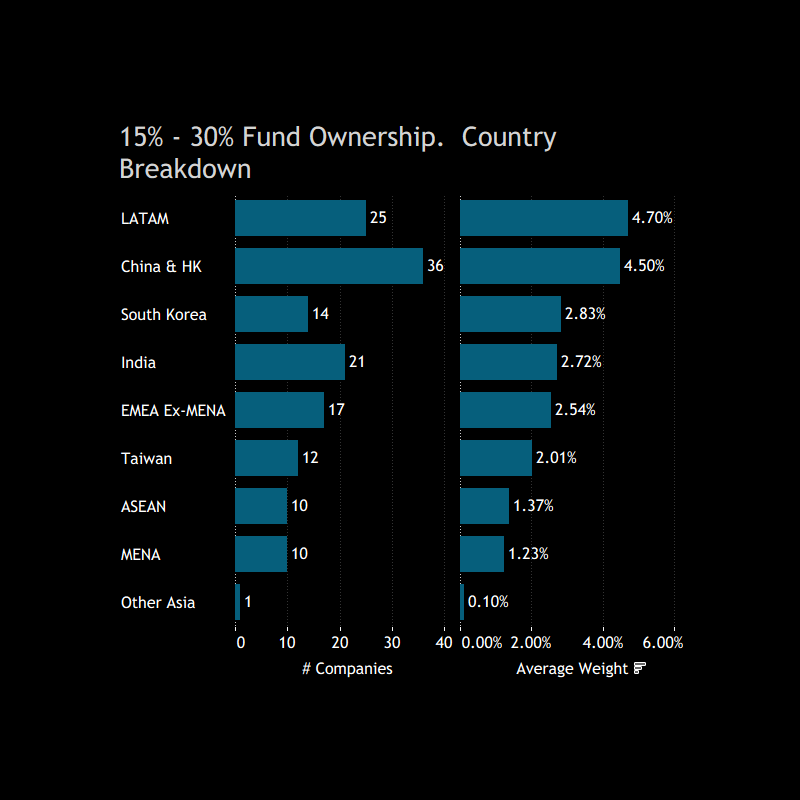
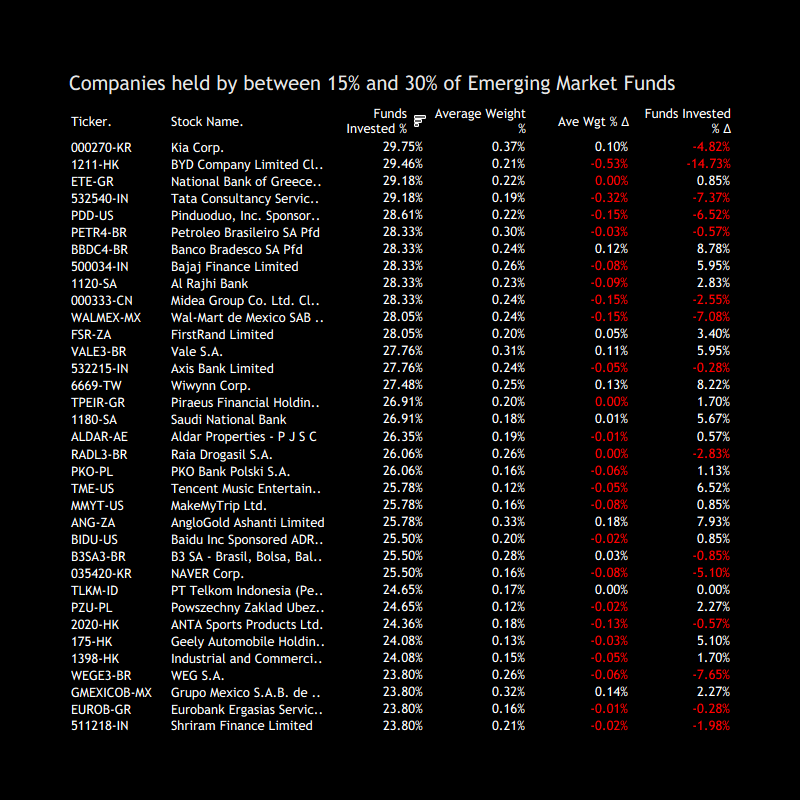
Containing 146 companies, this group has maintained a relatively stable share of EM portfolios over time. With a combined weight of 22.0%, the average position size is small (~0.15%), though leading names are meaningfully larger.

While China & Hong Kong accounts for the largest number of stocks, LATAM commands the highest average allocation, led by names such as Petrobras and Banco Bradesco.

Intra-Cohort Rotation
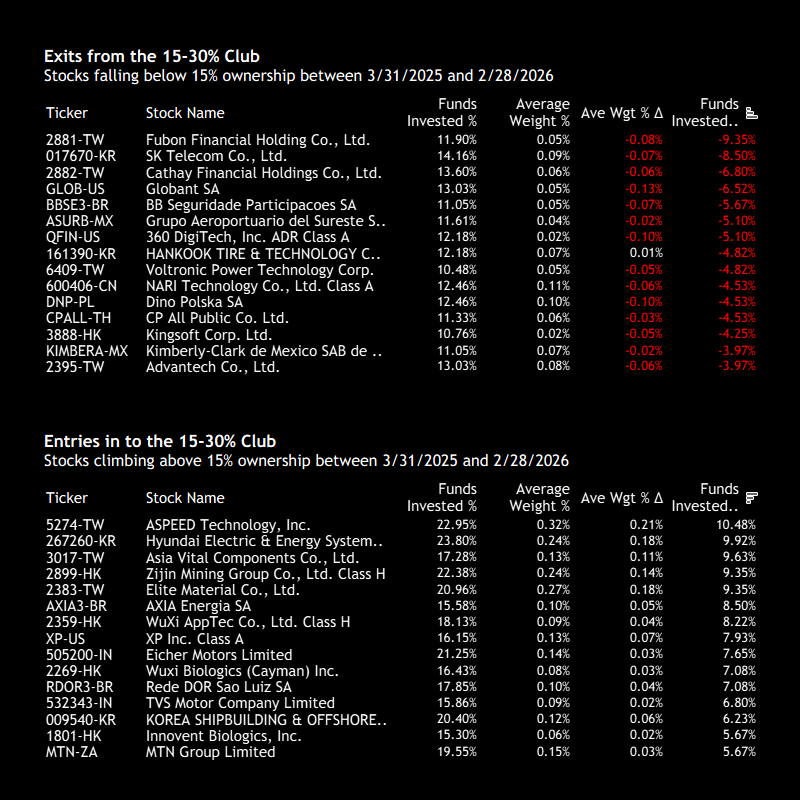
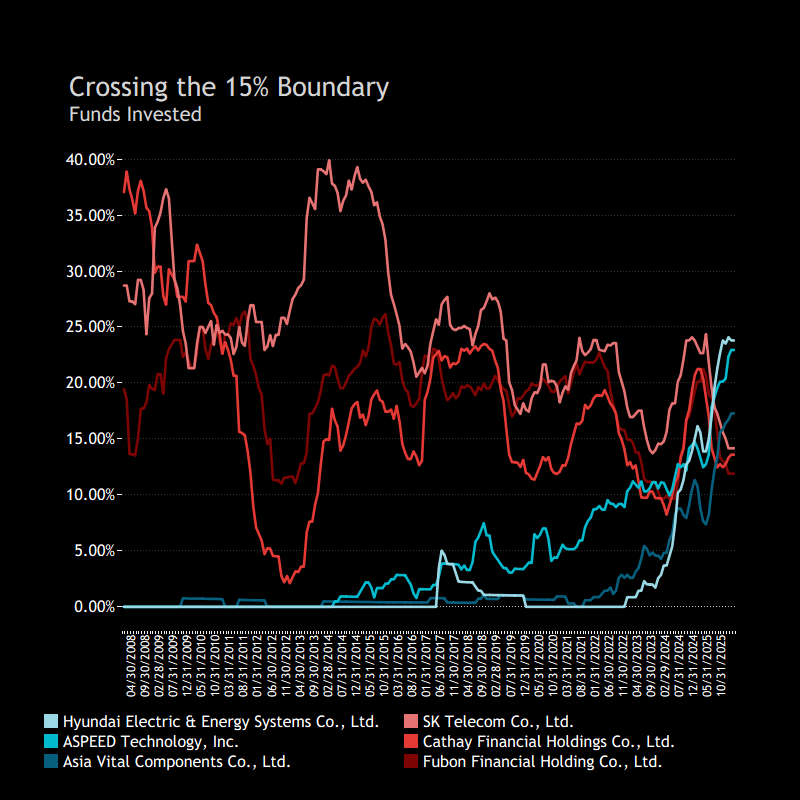
Rebalancing in and out of the group since March 2025 has been relatively balanced. Names such as Fubon Financial, SK Telecom and Cathay Financial have exited, while Hyundai Electric & Energy Systems, ASPEED Technology and Asia Vital Components have entered.

Screening for High Conviction Names in the 15% – 30% Cohort
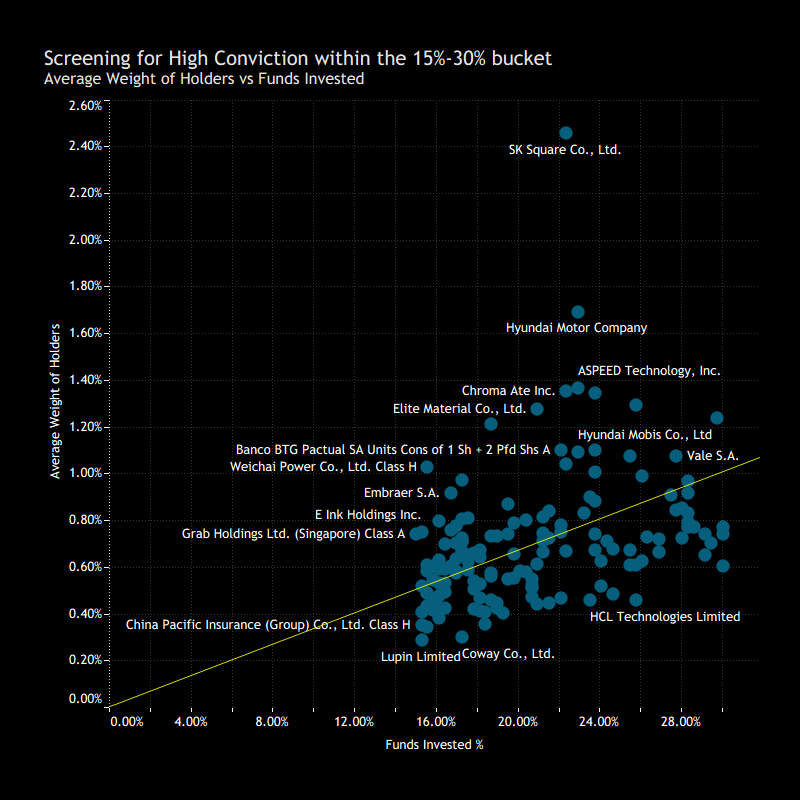
Screening within the 15–30% bucket highlights a subset of names where position sizes are high relative to ownership breadth. Stocks plotting above the trend line on the left chart below indicate higher conviction among existing holders, despite not yet being widely owned. Standouts include SK Square, Hyundai Motor, ASPEED Technology, Chroma ATE and Elite Material, all of which exhibit elevated average weights for their level of fund penetration. Names such as AngloGold Ashanti and Group Mexico S.A.B also screen positively on this basis.

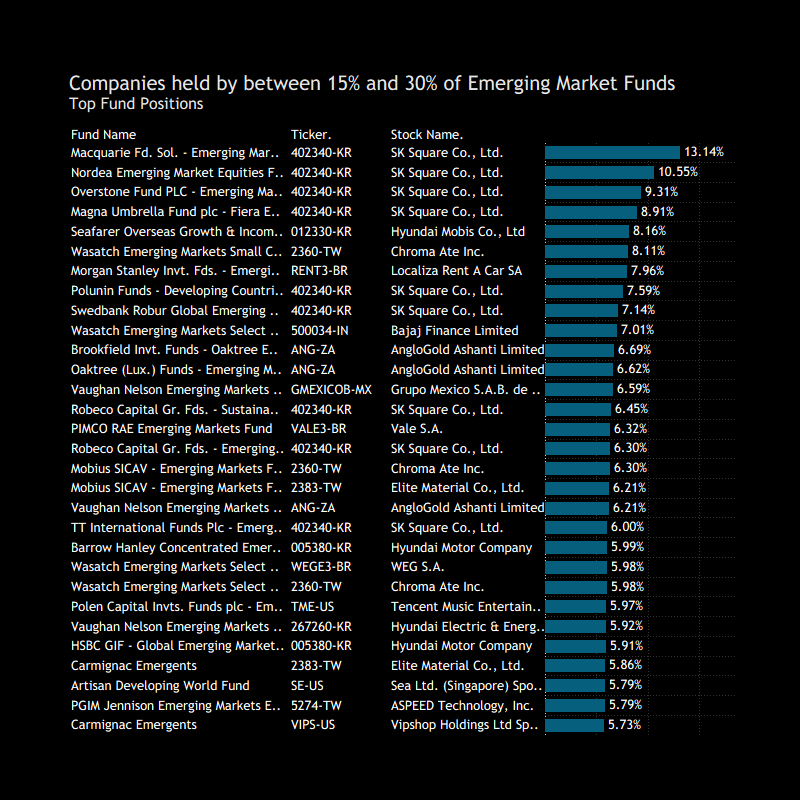
The chart on the right reinforces this dynamic, showing large individual fund positions in many of these stocks—particularly SK Square, Hyundai Motor and Chroma ATE—suggesting strong underlying conviction.

Together, these names represent potential candidates for broader adoption, where high conviction among a smaller holder base could translate into increasing ownership over time.

The 0% - 15% Cohort

The Long Tail
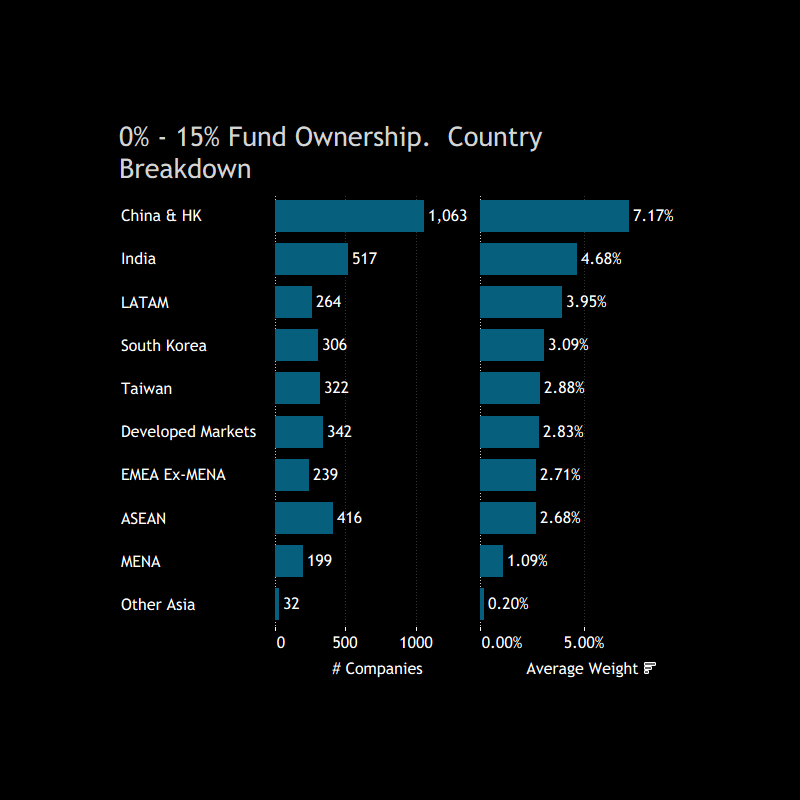
The 0–15% ownership cohort represents the long tail of EM portfolios, with over 1,000 names in China & Hong Kong alone and broad representation across all regions.  Despite this scale, position sizes are minimal, with low average weights across the board, reflecting limited conviction and fragmented ownership.

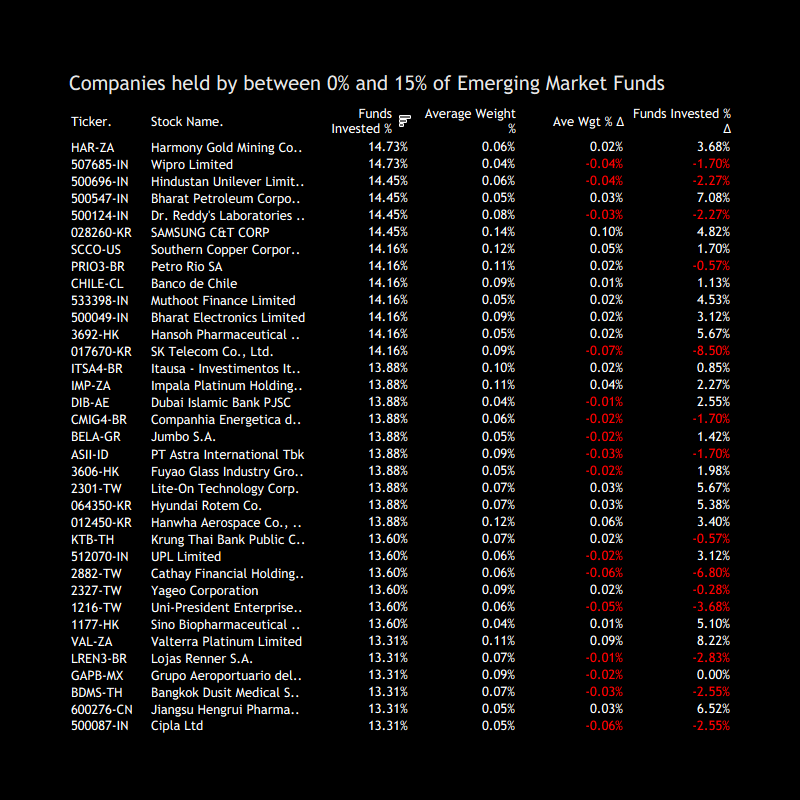
The most widely held names in the group—such as Harmony Gold, Wipro and Hindustan Unilever—sit at the upper end of the range but remain small, non-core positions within portfolios.

Rotation within the group
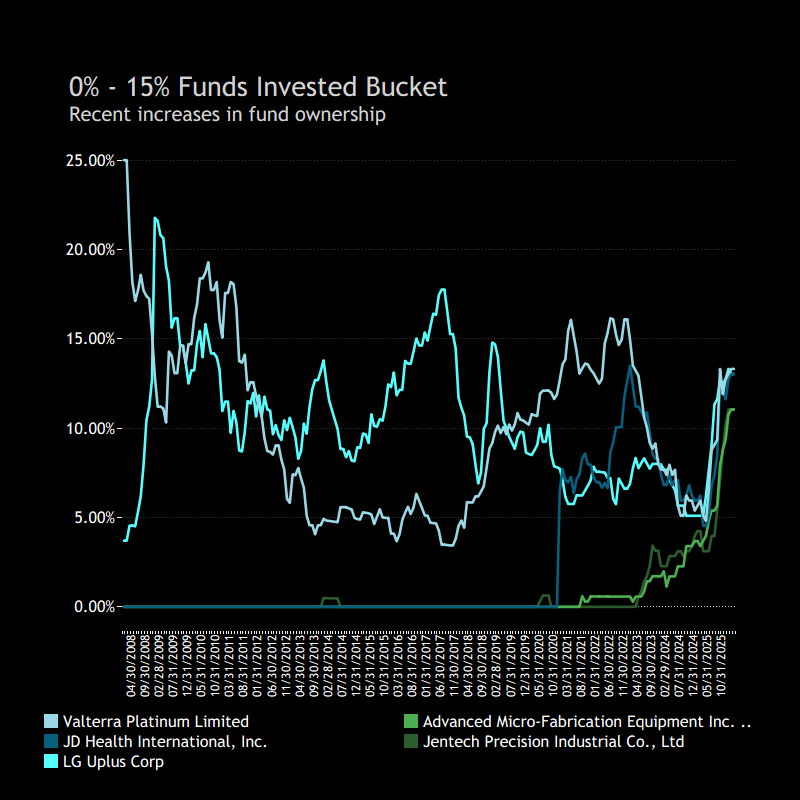
Within the 0–15% cohort, a handful of names are seeing notable shifts in ownership at the margin. On the upside, Valterra Platinum, JD Health and LG Uplus stand out with recent increases in fund participation, alongside newer additions such as Advanced Micro-Fabrication Equipment and Jentech Precision gaining traction from a low base.

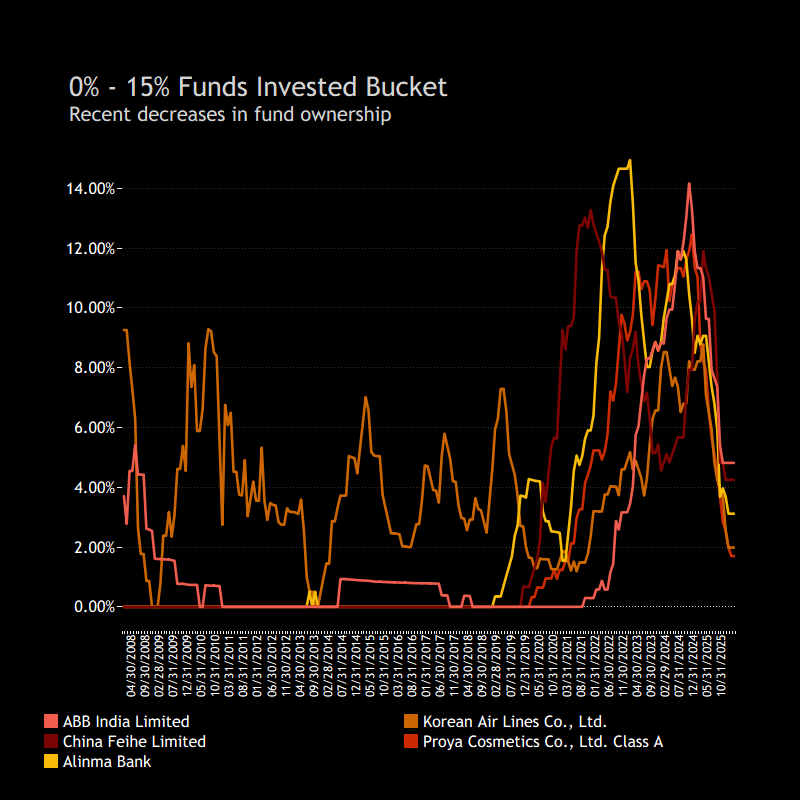
On the downside, ABB India, Korean Air and Proya Cosmetics have seen sharp pullbacks in ownership, while China Feihe and Alinma Bank also show clear declines from recent peaks.

Early-Stage Conviction: Candidates for Broader Adoption
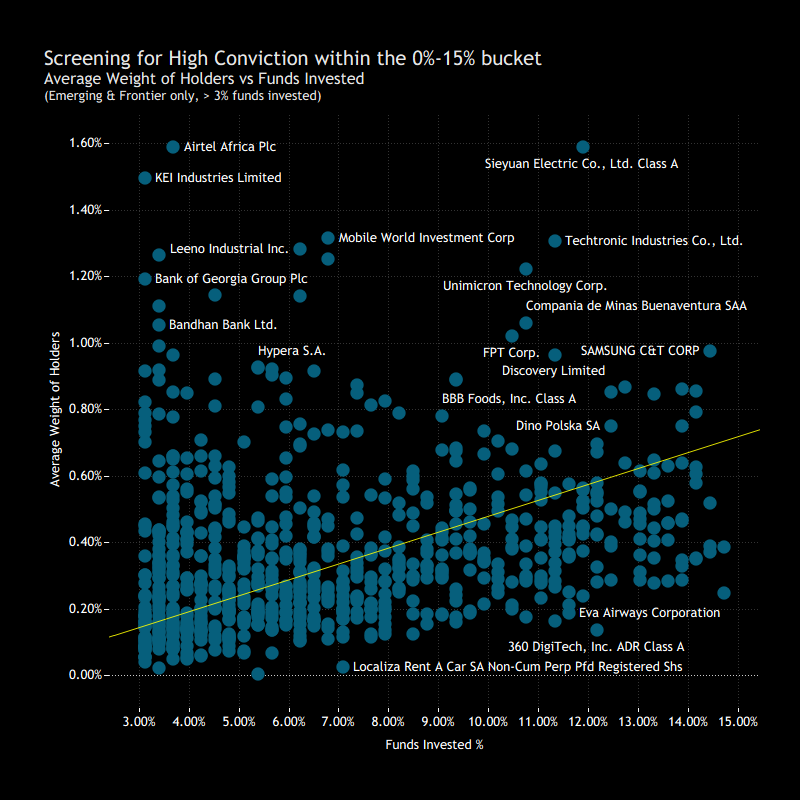
Applying the same screening framework to the 0–15% cohort highlights a subset of names with high conviction despite limited ownership breadth. Stocks in the upper portion of the chart—such as Sieyuan Electric, Airtel Africa, KEI Industries and Techtronic Industries—are held with elevated weights by existing investors, suggesting stronger underlying conviction.

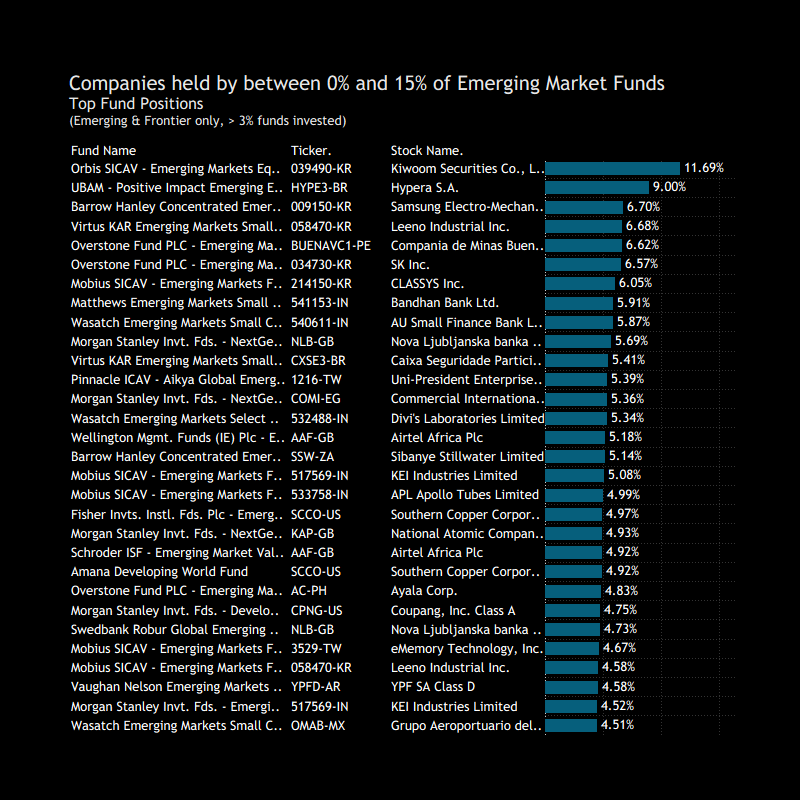
The chart on the right reinforces this, showing large individual fund positions in many of these names, including Kiwoom Securities, Hypera and Samsung Electro-Mechanics.  Together, these stocks represent early-stage ideas, where strong conviction among a smaller holder base could translate into broader adoption over time.

Conclusion

The evolution of GEM positioning points to a clear structural shift in how portfolios are constructed.

Funds are allocating more capital to a small group of crowded, high-conviction names, while reducing exposure to the traditional “core middle” of portfolios. This hollowing out leaves a more top-heavy structure, increasing sensitivity to a narrow set of stocks.

Importantly, within the >70% ownership cohort, positioning is increasingly reinforced by benchmark and career risk considerations. As these names become near-universal holdings, the cost of not owning them rises, encouraging further capital concentration and creating a self-reinforcing dynamic.

At the same time, the lower-ownership cohorts highlight a pipeline of potential future leaders, where high conviction among a smaller set of investors may drive broader adoption over time.

Terms and Conditions

Investor Positioning Report — Copley Fund Research Ltd  ·  Last updated: July 2026  ·  Registered in England and Wales

1. Who we are

Copley Fund Research Ltd provides proprietary institutional fund intelligence to listed companies and investor relations professionals. These terms govern every purchase of an Investor Positioning Report. By completing a purchase you confirm you have read, understood, and agreed to these terms in full.

2. What you are purchasing

The Investor Positioning Report is a bespoke PDF report mapping the institutional fund universe around your stock. It covers current investors, past investors, competitor investors, and white space investors. Every report is built from scratch for the specific company ordered and is not a standardised or templated product.

3. Delivery and process

Following payment or invoice issuance, Copley Fund Research will contact you within one working day to agree your competitor set. Production begins once the competitor set is confirmed in writing. The completed report will be released to you within 48 hours of production starting, provided payment has been received in full; where payment is outstanding, the report will be withheld until payment clears. If the requested company falls outside our covered fund universes, or a competitor set cannot be agreed, Copley Fund Research will issue a full refund or cancel the outstanding invoice.

4. Competitor set agreement

The competitor set is agreed with you in writing prior to production, and the report is built to that agreed specification. Requests to amend the competitor set after delivery, based on a change of preference rather than an error, may be treated as a new order.

5. Refund policy

Because each report is produced individually for your company, orders are non-refundable once production has begun, except as set out in clauses 3 and 5a below. By purchasing, you agree not to dispute the charge with your card provider on the basis that the service was not as described, provided the report has been delivered to the agreed specification or corrected under clause 5a.

5a. Quality remedy

If a delivered report contains a material error caused by Copley Fund Research — for example, an incorrect company analysed, a competitor omitted from the agreed set, or content missing from the specification in clause 2 — Copley Fund Research will correct and redeliver the report at no additional charge, within a reasonable timeframe. This is your sole remedy for such errors.

6. Data and accuracy

All fund positioning data in the report reflects holdings as disclosed at the most recently available reporting date at the time of compilation. The timing of fund holdings disclosures is determined by regulatory requirements applicable to each fund and is outside the control of Copley Fund Research Ltd. This data may not reflect current fund positions. Copley Fund Research takes reasonable care to ensure accuracy but makes no warranty, express or implied, as to the completeness or current accuracy of the underlying data — though this does not affect the quality remedy in clause 5a for errors in how that data was analysed or presented. Past fund positioning is not indicative of future fund behaviour or investment decisions.

7. Not investment advice

The Investor Positioning Report is produced for investor relations intelligence purposes only. It does not constitute investment advice, financial advice, or a recommendation to buy, hold, or sell any security. The data reflects historical fund positioning and must not be relied upon as a prediction of future fund behaviour or investment decisions. Copley Fund Research Ltd is not authorised or regulated by the Financial Conduct Authority for the provision of investment advice.

8. Permitted use and confidentiality

The report is licensed for internal use by the purchasing organisation only. You may share it with employees and directors of your organisation. You may not: reproduce, redistribute, publish, or resell the report or any part of it; share it with any third party outside your organisation without prior written consent; use the fund or portfolio manager names contained in the report to approach those individuals on behalf of Copley Fund Research or in a manner that could damage Copley Fund Research's relationships with those funds; or use the data for any purpose other than your own investor relations strategy. The data, analysis, and methodology contained in the report are the intellectual property of Copley