Executive Summary Indonesia has seen a sharp decline in fund positioning, with both exposure and participation falling to their lowest levels in over 15 years. Once a key overweight, it has shifted to a marginal, more benchmark-aligned position as managers actively reduce or exit holdings.
Over the past six months, 7.2% of funds have sold out entirely, and average weights have dropped sharply. Exposure is now concentrated in five stocks, which account for 75% of all Indonesia allocations—but ownership in these names has also fallen. The median weight sits well below the average, skewed by a handful of high-conviction holders.
In short, Indonesia enters 2026 at the weakest positioning levels on record.
Click on the Report Link below for access to the latest Indonesia Market Intelligence Report.
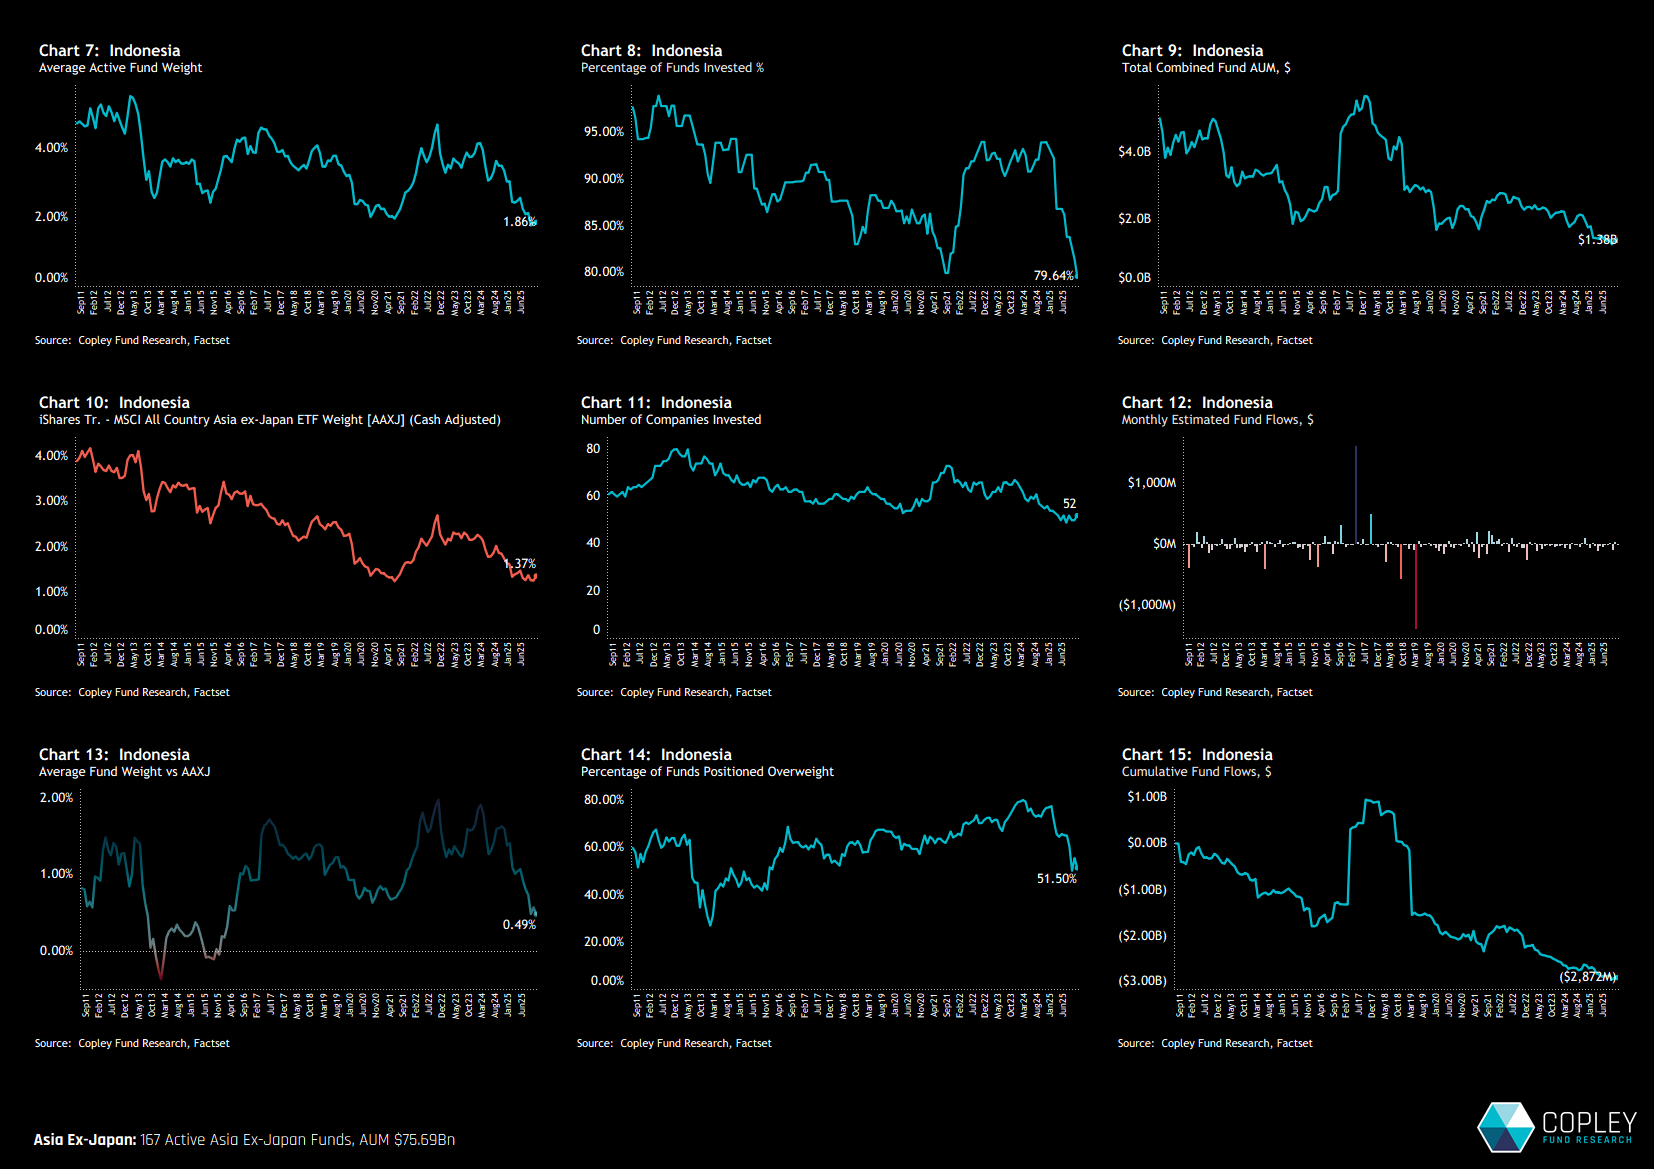
Indonesia Fund Positioning: Falling to New Lows Fund positioning in Indonesia has deteriorated, reaching its weakest levels in over 15 years. Average portfolio weights have plunged from a recent peak of 4.7% in late 2022 to just 1.86%—the lowest point since our records began (Chart 7). This decline has been mirrored by a sharp drop in participation, with only 79.6% of Asia ex-Japan funds currently holding any exposure to Indonesia, another record low (Chart 8). This coordinated exit reflects a clear shift in sentiment. Indonesia has moved from being a key and broadly held overweight to a more marginal, benchmark-aligned position. Both the net overweight and the share of funds positioned ahead of the benchmark have declined in tandem, underscoring a widespread retreat from the market (Charts 13 & 14).
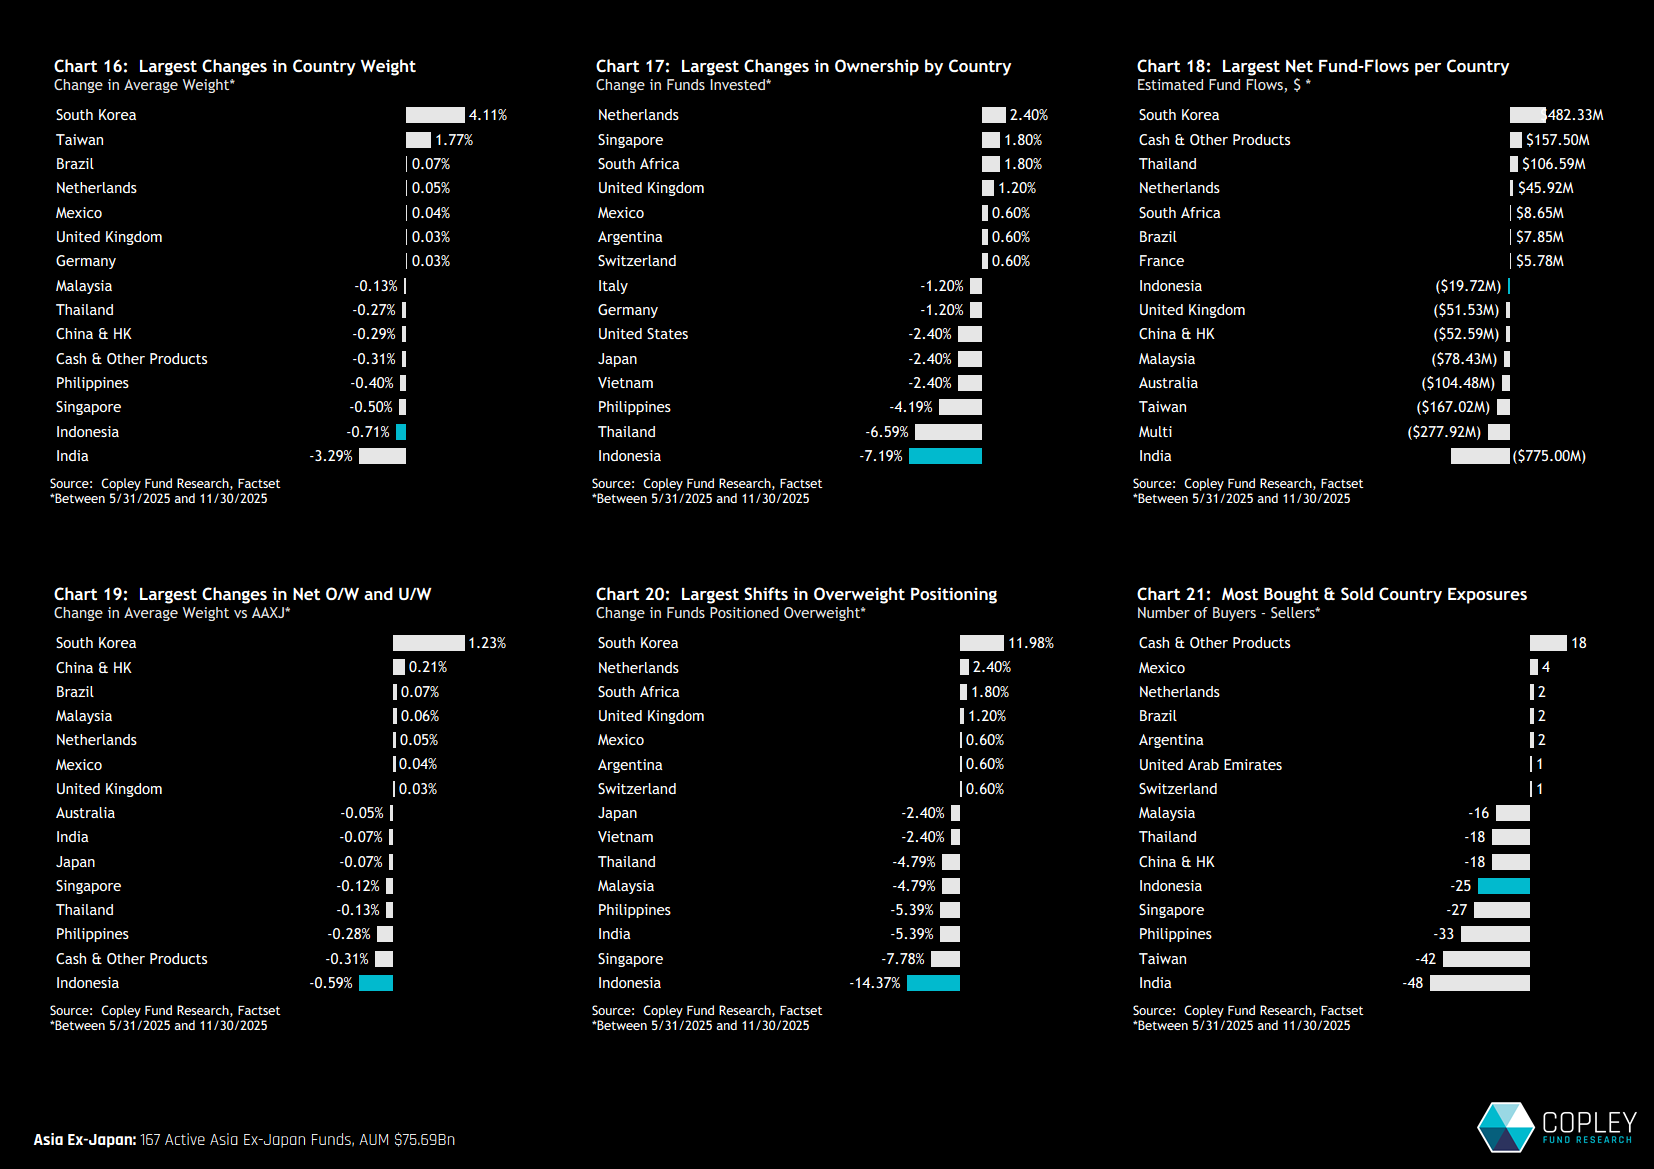
Country Activity: Heaavy Rotation Over the past six months, Indonesia has experienced the sharpest decline in fund ownership across the Asia ex-Japan universe. Of the 167 active strategies tracked, 7.2% fully exited their Indonesia positions between May 31 and November 30, 2025 (chart 17). The average weight dropped by 0.71%, the second-largest decline after India (chart 16). Indonesia also saw the steepest reduction in both the percentage of funds positioned overweight and the aggregate net overweight (charts 19&20). These shifts were driven by persistent net outflows and a consistent tilt toward selling activity, highlighting a broad-based rotation out of the market. Beyond Indonesia, India, Thailand, and the Philippines also faced similar selling pressure. In contrast, South Korea emerged as the key beneficiary, attracting inflows and increased fund interest during the same period.
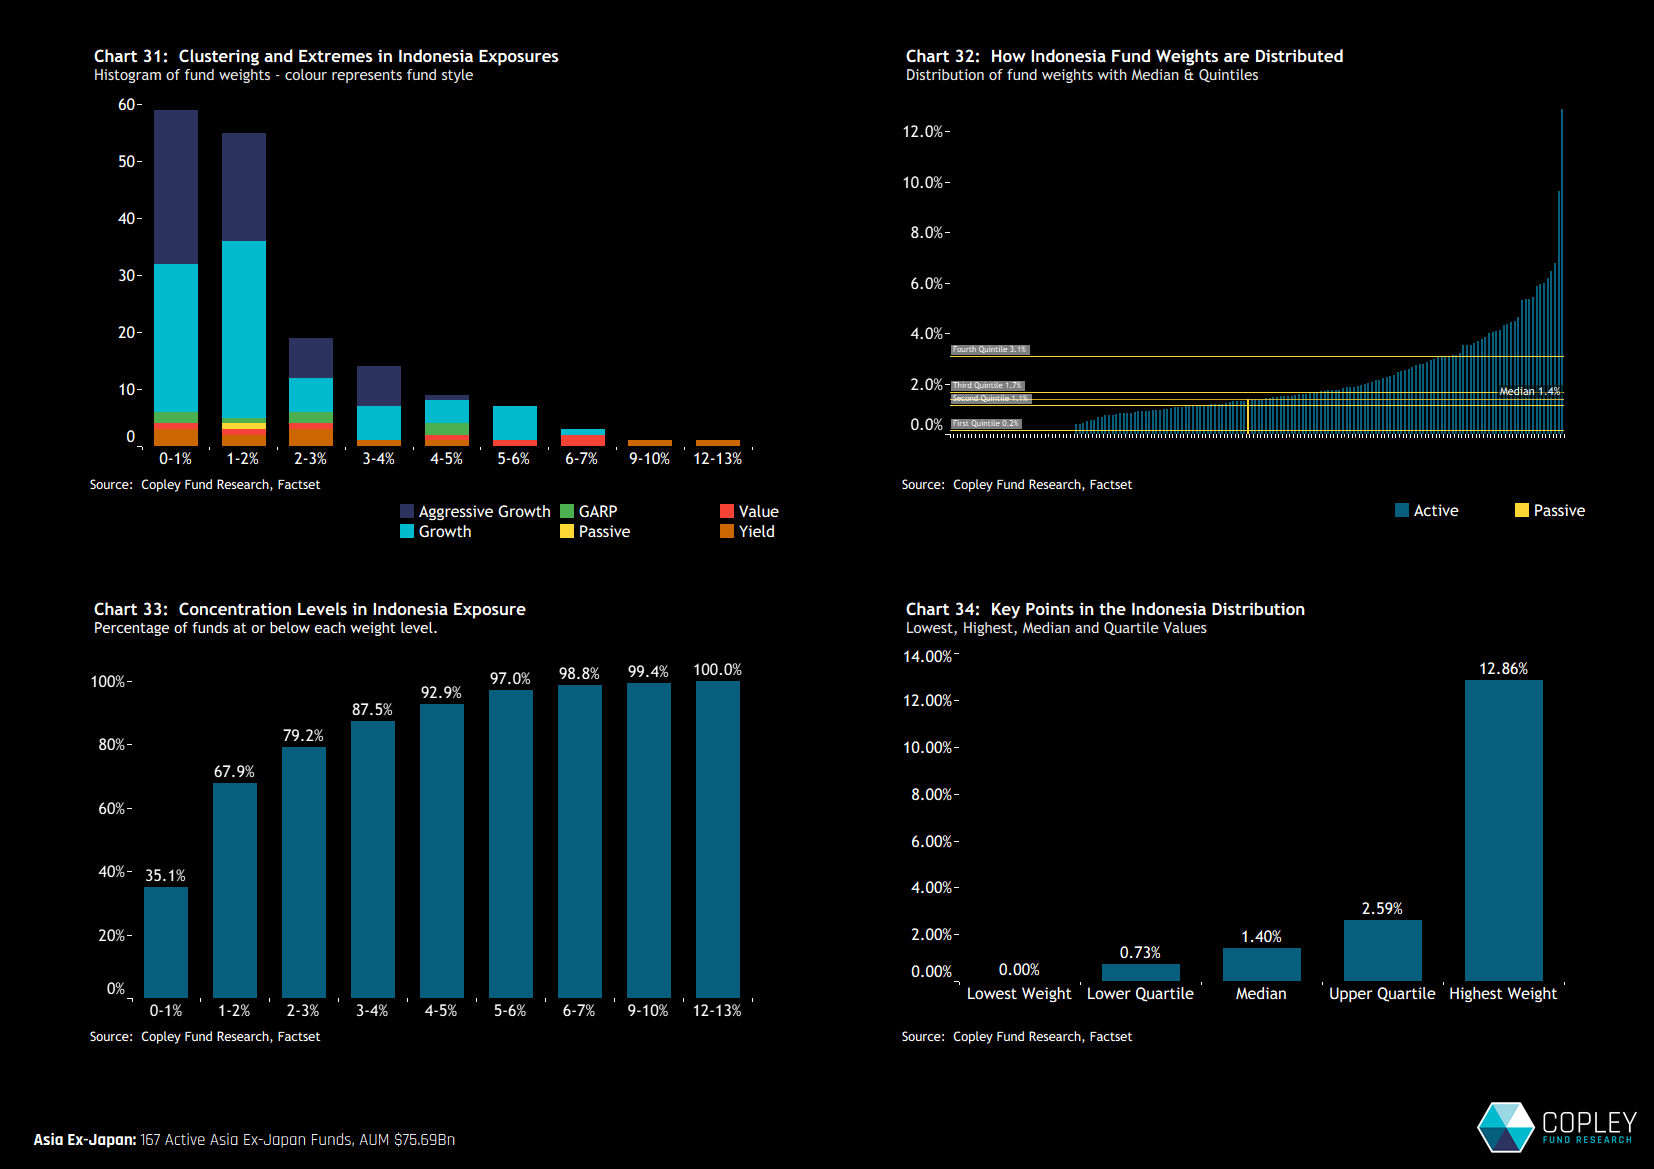
Fund Weights and Distributions Fund allocations to Indonesia remain modest for most managers. As shown in Chart 31, the majority of funds hold between 0% and 3%, with the distribution heavily concentrated at the low end and a long right-sided tail. In fact, 93% of all allocations are below 5% (Chart 33), highlighting how few funds are willing to take high-conviction positions. The median fund holds just 1.4% in Indonesia, well below the average of 1.86%, highlighting the influence of a few outsized fund positions.
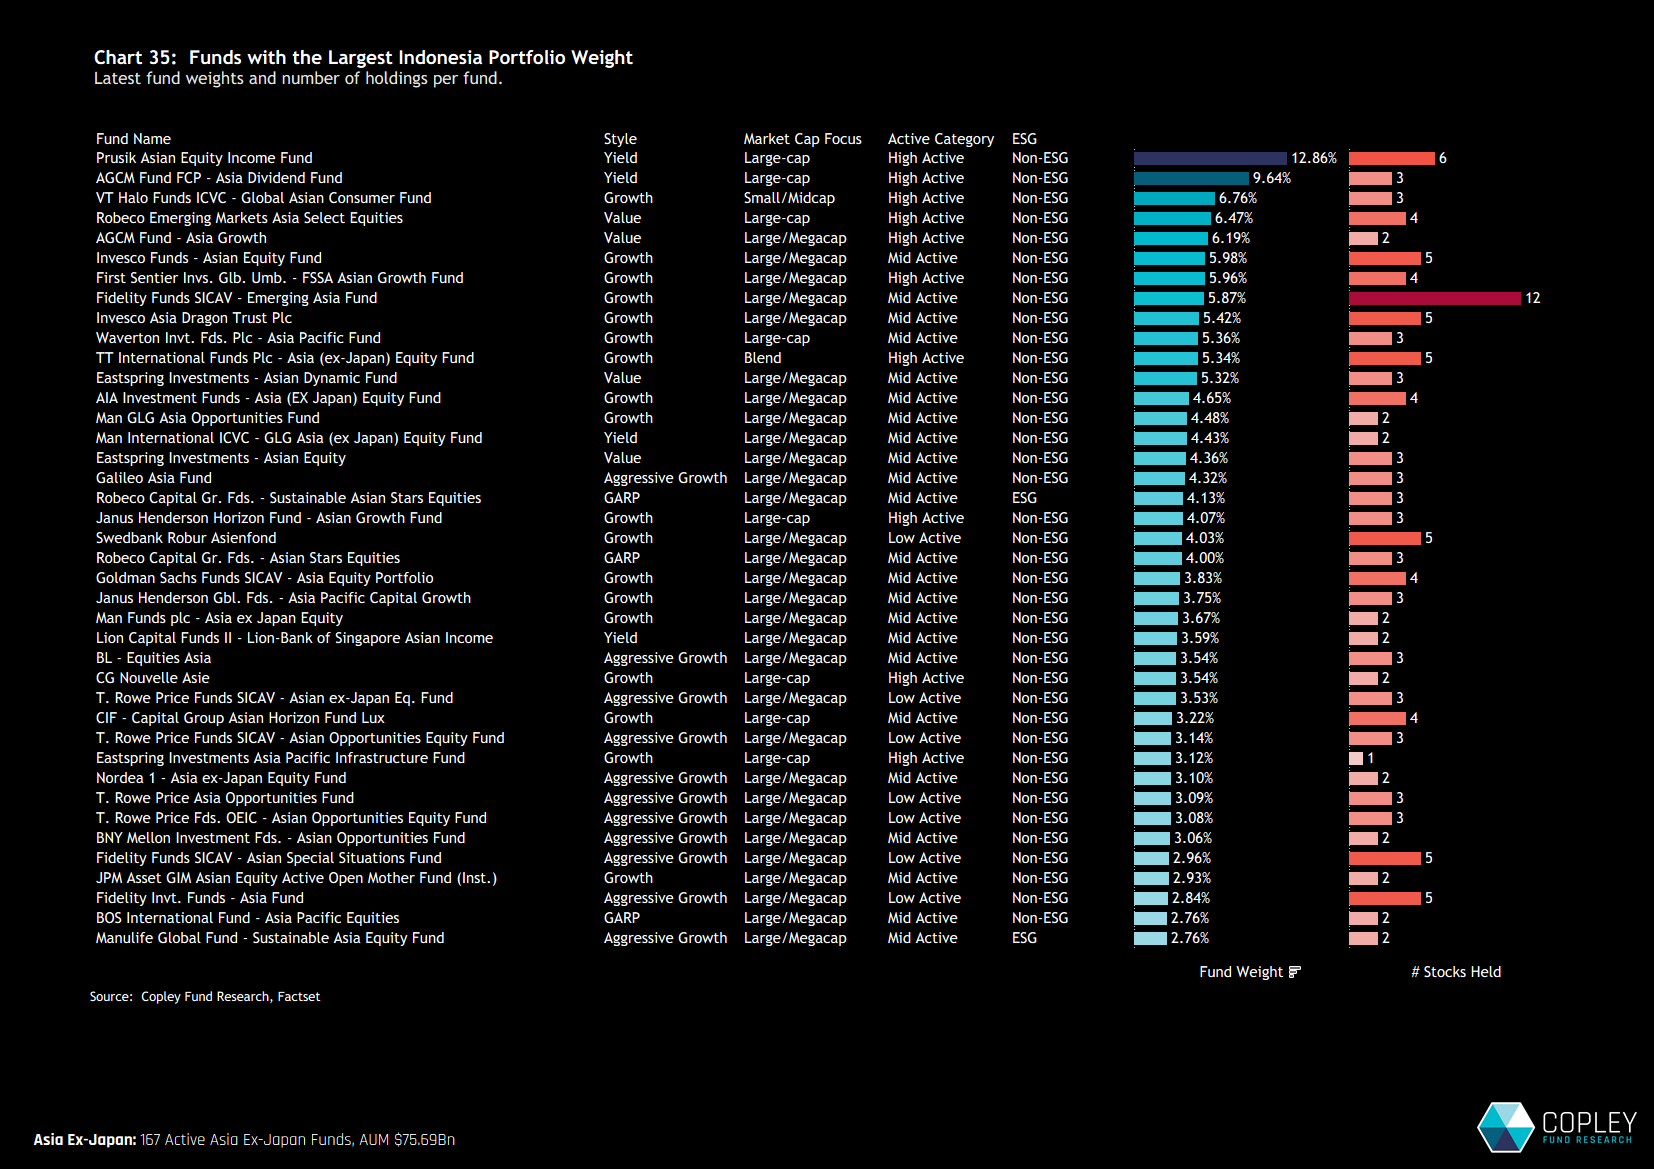
Top Holders The extended right-hand tail in Indonesia fund exposure is driven by a handful of high-conviction positions. At the top of the distribution are two income-focused strategies – Prusik Equity Income and AGCM Asia Dividend – with Indonesia weights of 12.9% and 9.6%, respectively. Beyond these outliers, only 10 funds hold exposures above 5%. Most of these positions are narrowly focused, typically concentrated in just three to four stocks.
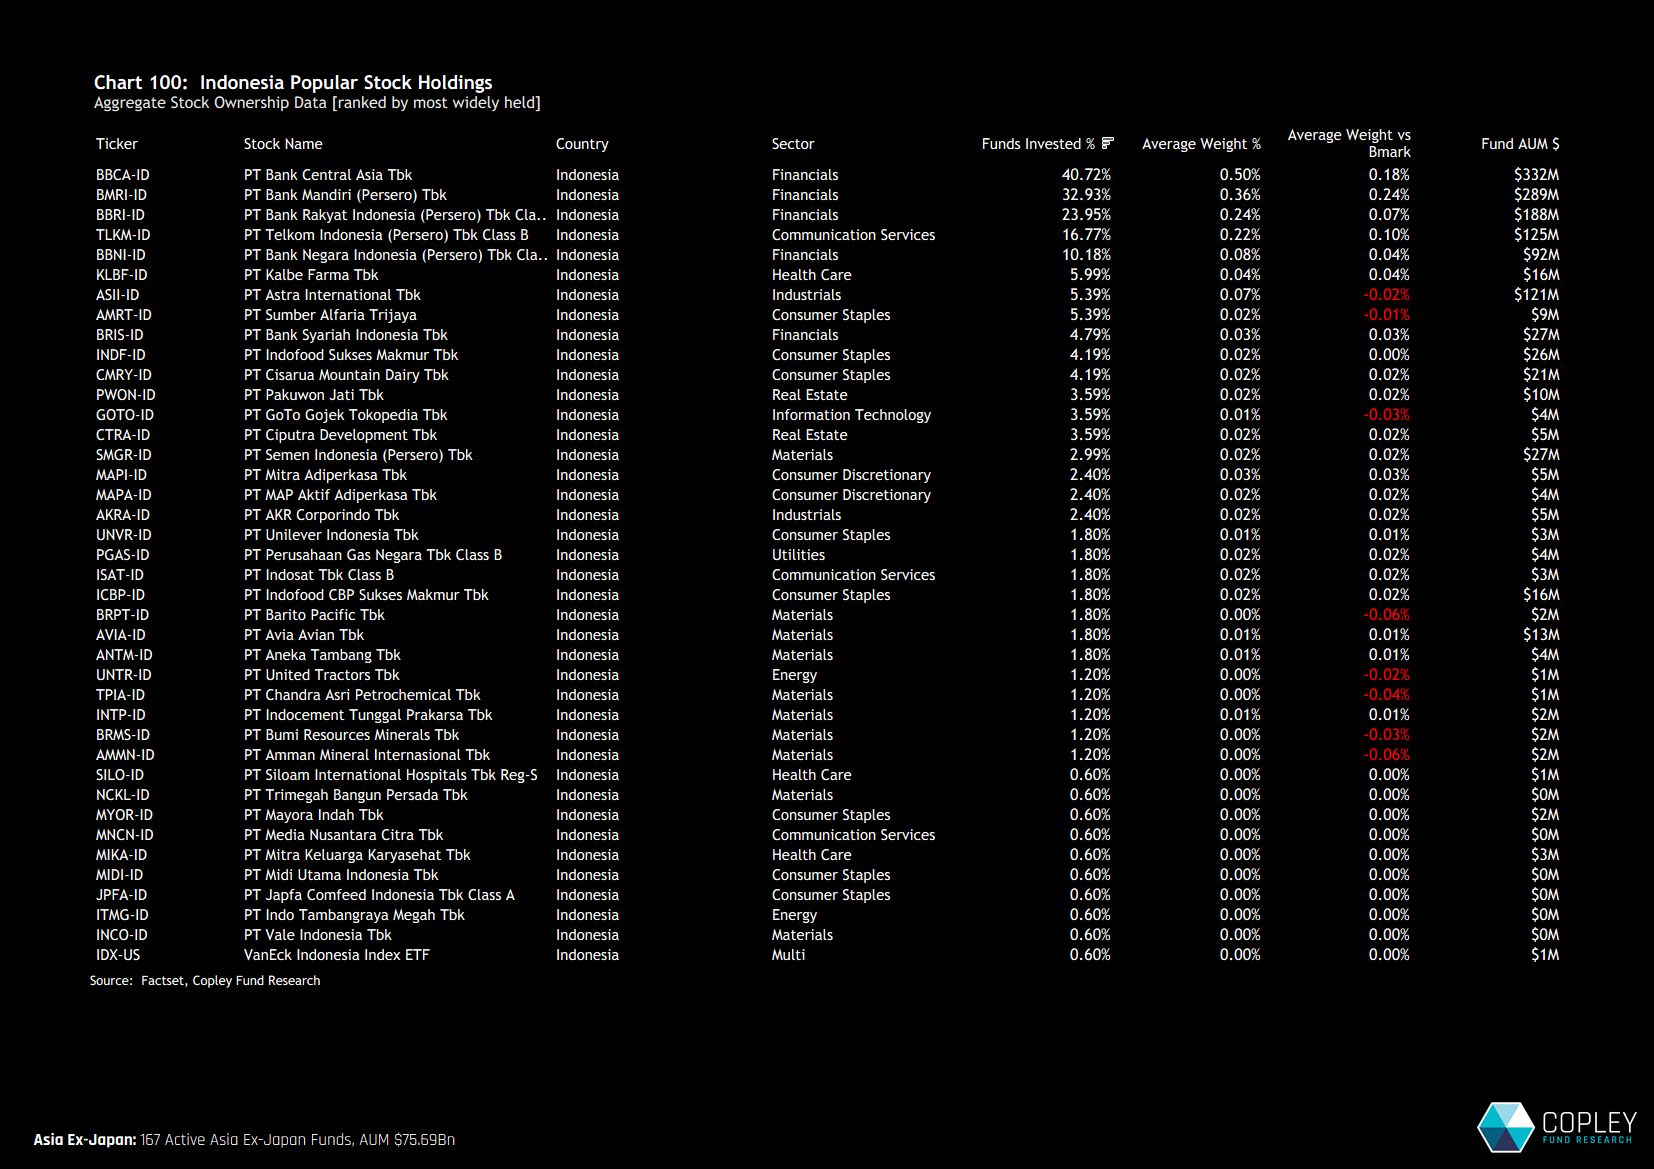
Stock Holdings Picture Chart 100 highlights the most widely held stocks in Indonesia, revealing a highly concentrated picture. Bank Central Asia leads on all metrics—held by 40.7% of funds with an average weight of 0.5%. It is followed by Bank Mandiri and Bank Rakyat in second and third place, respectively, with Telkom Indonesia and Bank Negara rounding out the top five. These five names dominate Indonesia allocations, collectively accounting for around 75% of all fund exposure to the country. Beyond this core group, no other Indonesian stock is held by more than 6% of Asia ex-Japan funds, underscoring the narrow breadth of positioning at the stock level.
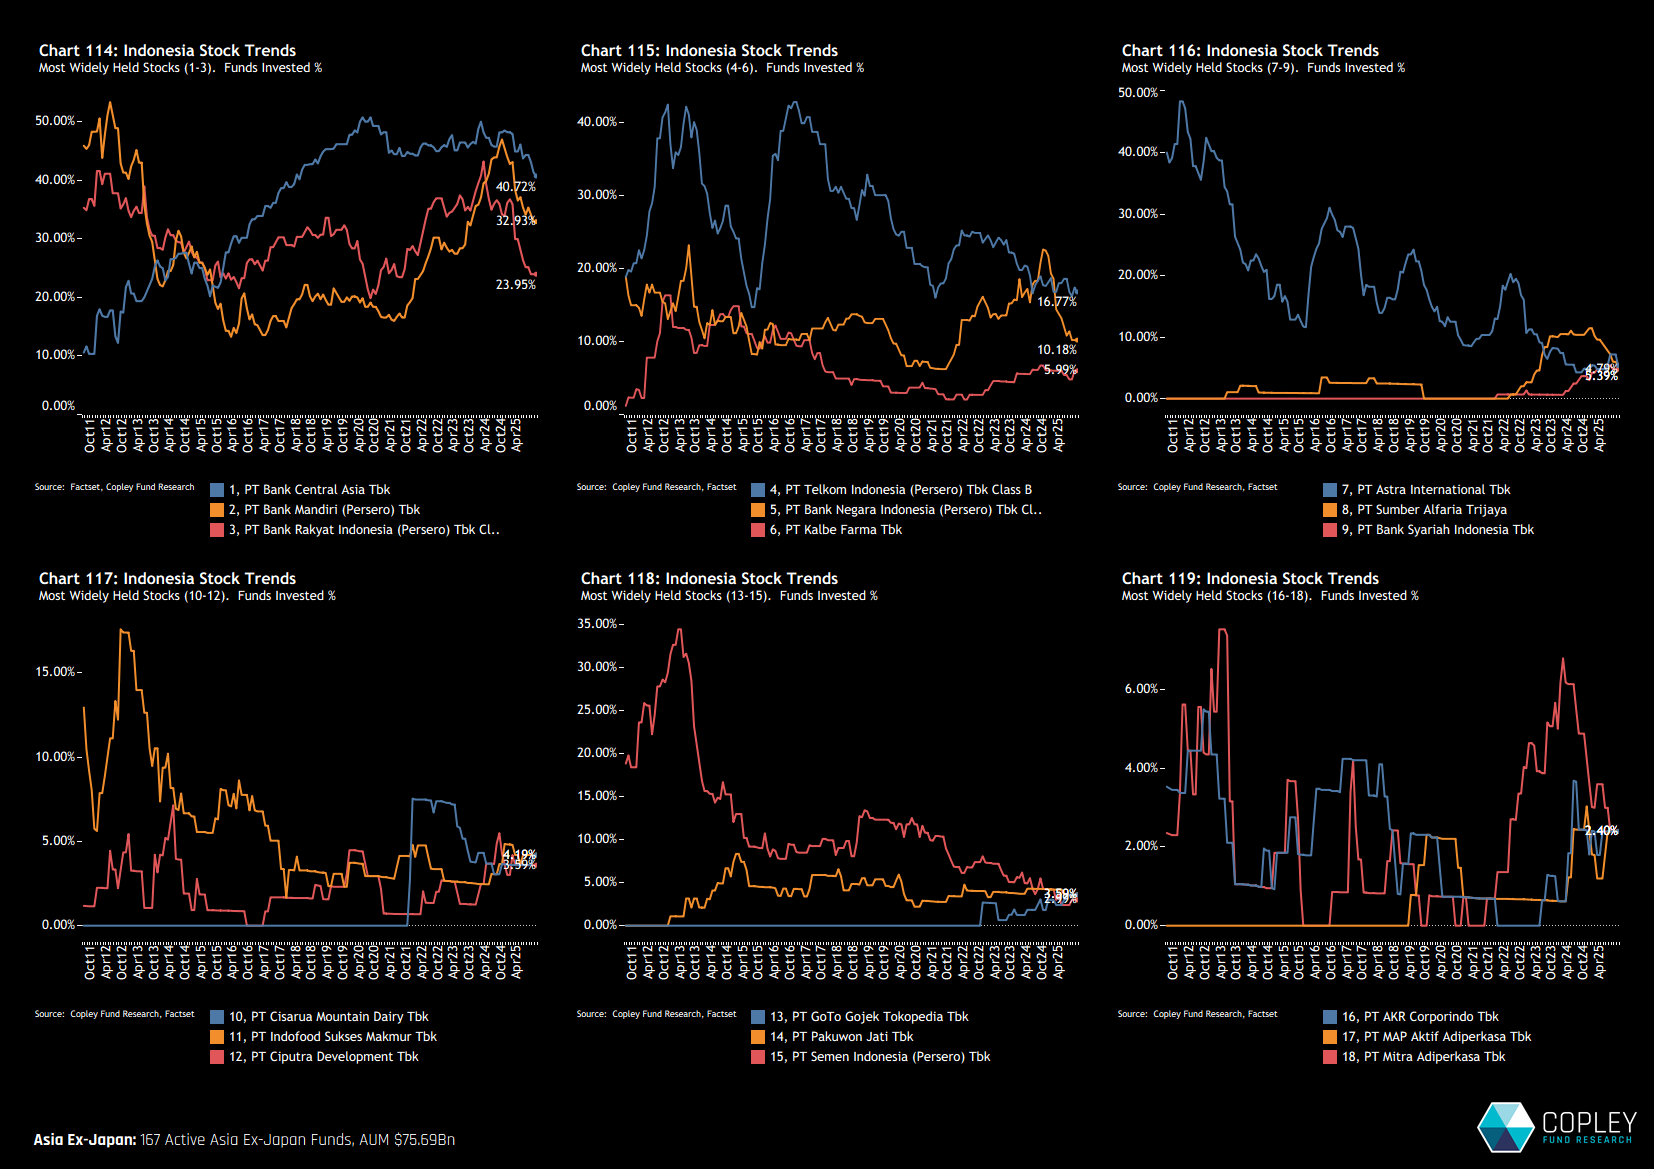
Stock Ownership Trends: Broad-Based Decline The chart set below tracks the evolution of fund ownership in the 18 most widely held Indonesian stocks. Charts 114 and 115 highlight where the bulk of the recent exodus has taken place—particularly among the top five names. Bank Central Asia, Bank Mandiri, Bank Rakyat, Telkom Indonesia, and Bank Negara have all seen steep drops in fund ownership from their peaks at the end of 2024. This weakness extends beyond the top names. Longer-term declines are evident in other once prominent stocks such as PT Astra International and PT Semen Indonesia. Overall, there are few signs of renewed interest or positive activity at the stock level in recent months.
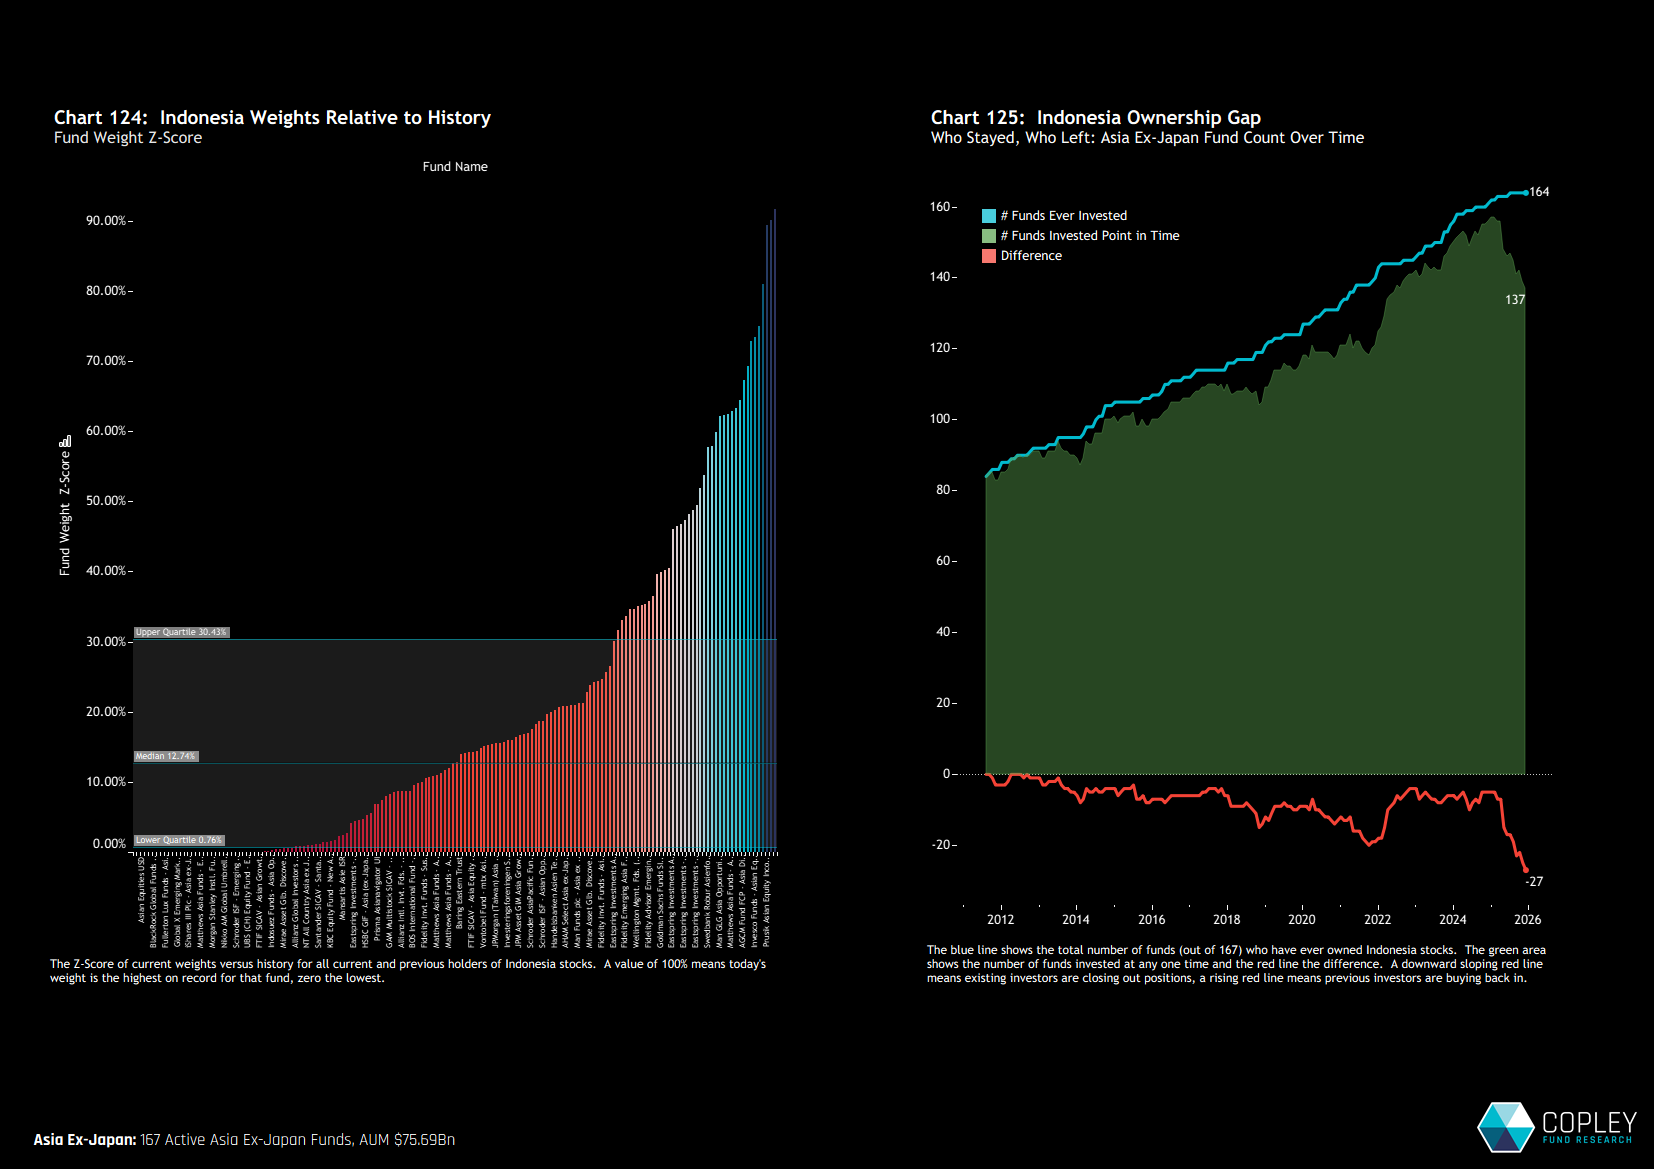
istorical Positioning and Gap Analysis The rotation out of Indonesia has left current positioning near historical lows. Chart 124 illustrates this at the fund level via a Z-Score analysis of current Indonesia weights versus each fund’s historical range. A Z-Score of 100% indicates a fund’s highest-ever allocation; 0% represents its lowest. Three-quarters of funds now have a Z-Score below 30%, underscoring just how low Indonesia exposure sits in a historical context for the majority of managers.
Chart 125 reinforces this picture from a breadth perspective. The blue line tracks the total number of funds (out of 167) that have ever held an Indonesian position, while the green area shows how many are currently invested. The red line—representing the gap between the two—has declined steeply and now sits at a record low. This marks the first time that such a large share of historically active managers have chosen to exclude Indonesia entirely as we head into 2026.
AFI – Market Intelligence Report: Indonesia
Please click on the link opposite for the full positioning report on Indonesia. It contains 133 charts, including fund-level detail at the country/sector, industry and stock level, breakdowns by Style, Market Cap Focus and Benchmark Independence, together with a full gap analysis on past holders and potential buyers in the country.