07 January
Emerging Markets
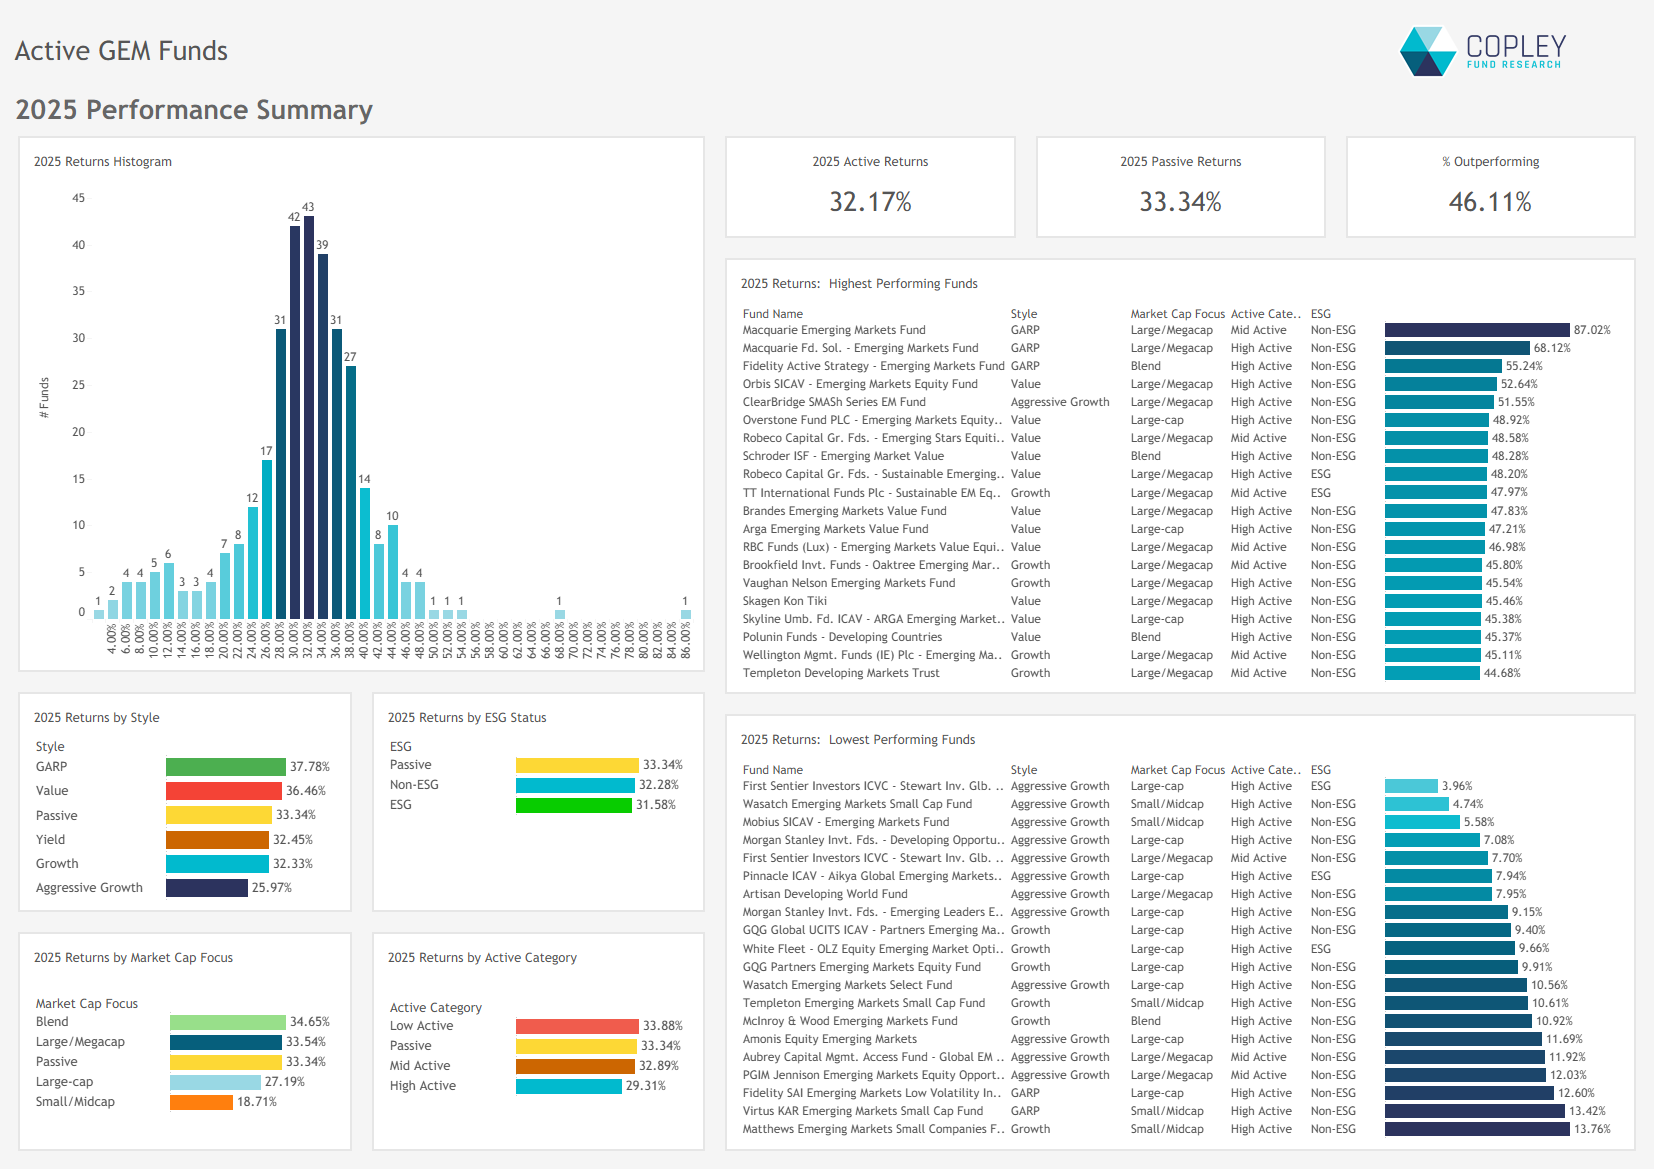
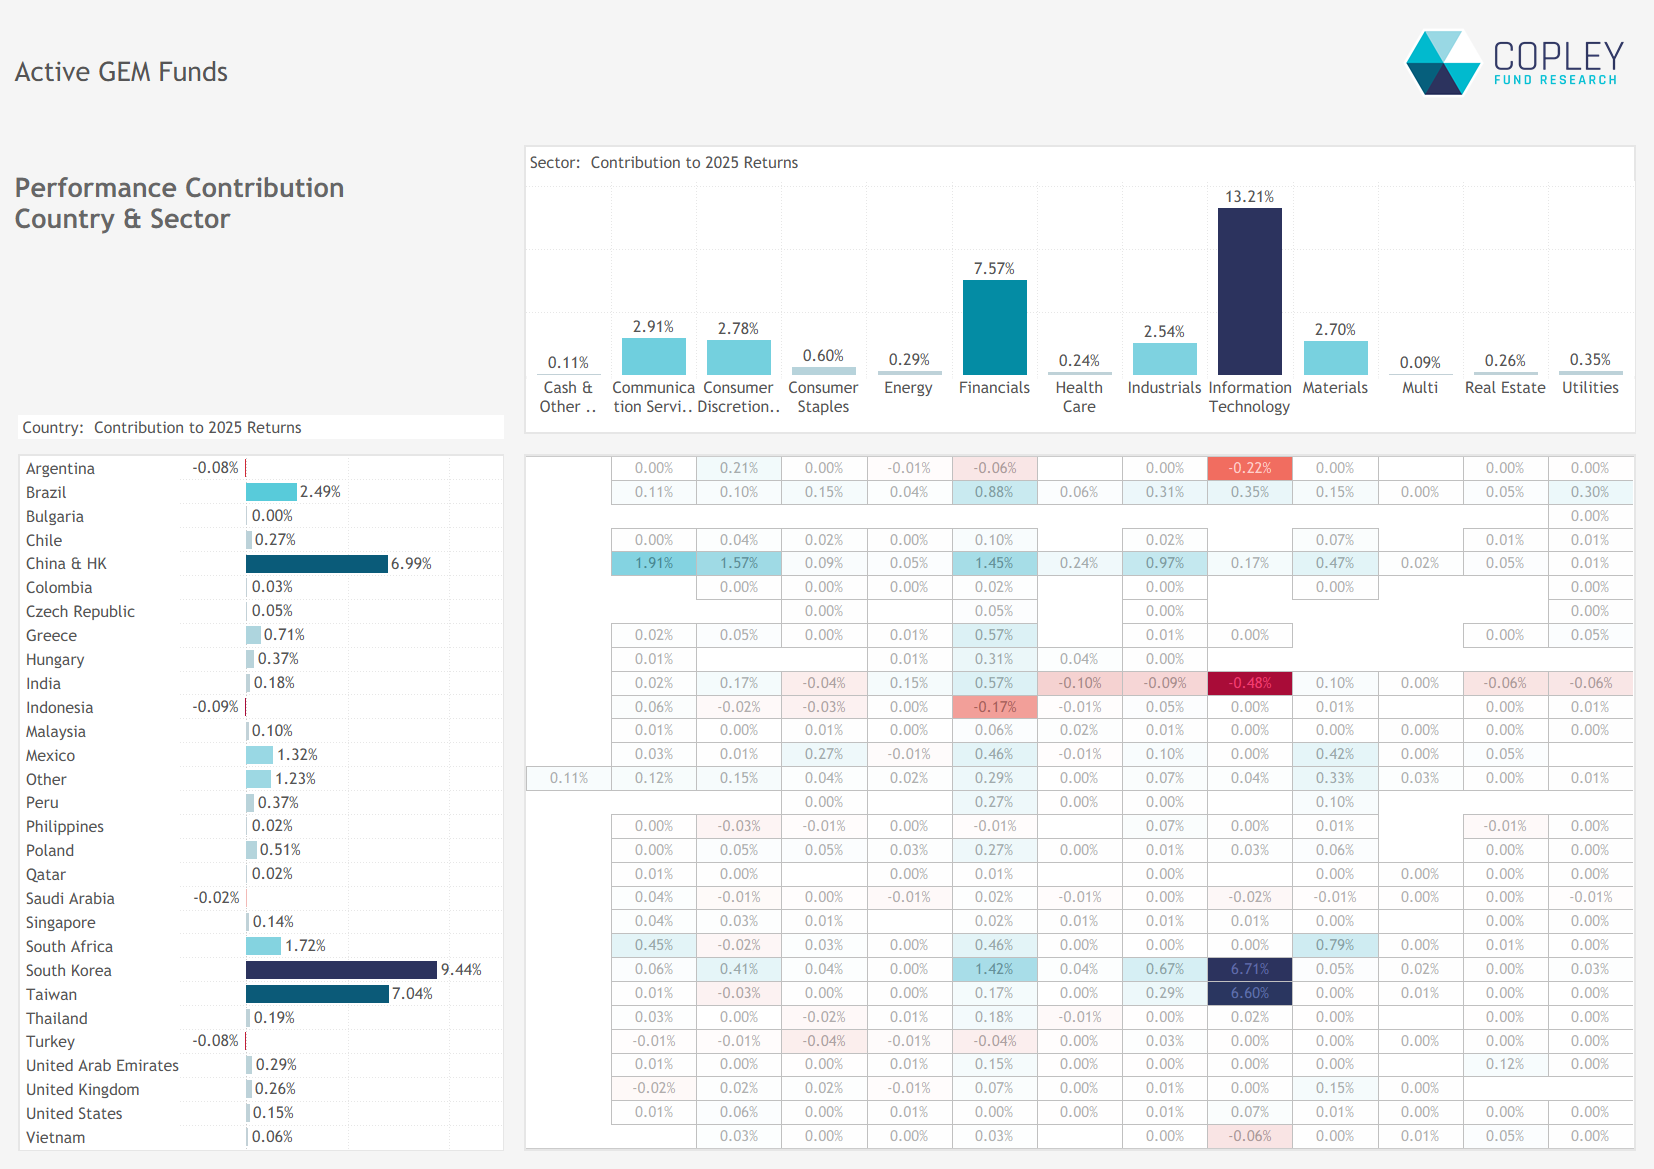
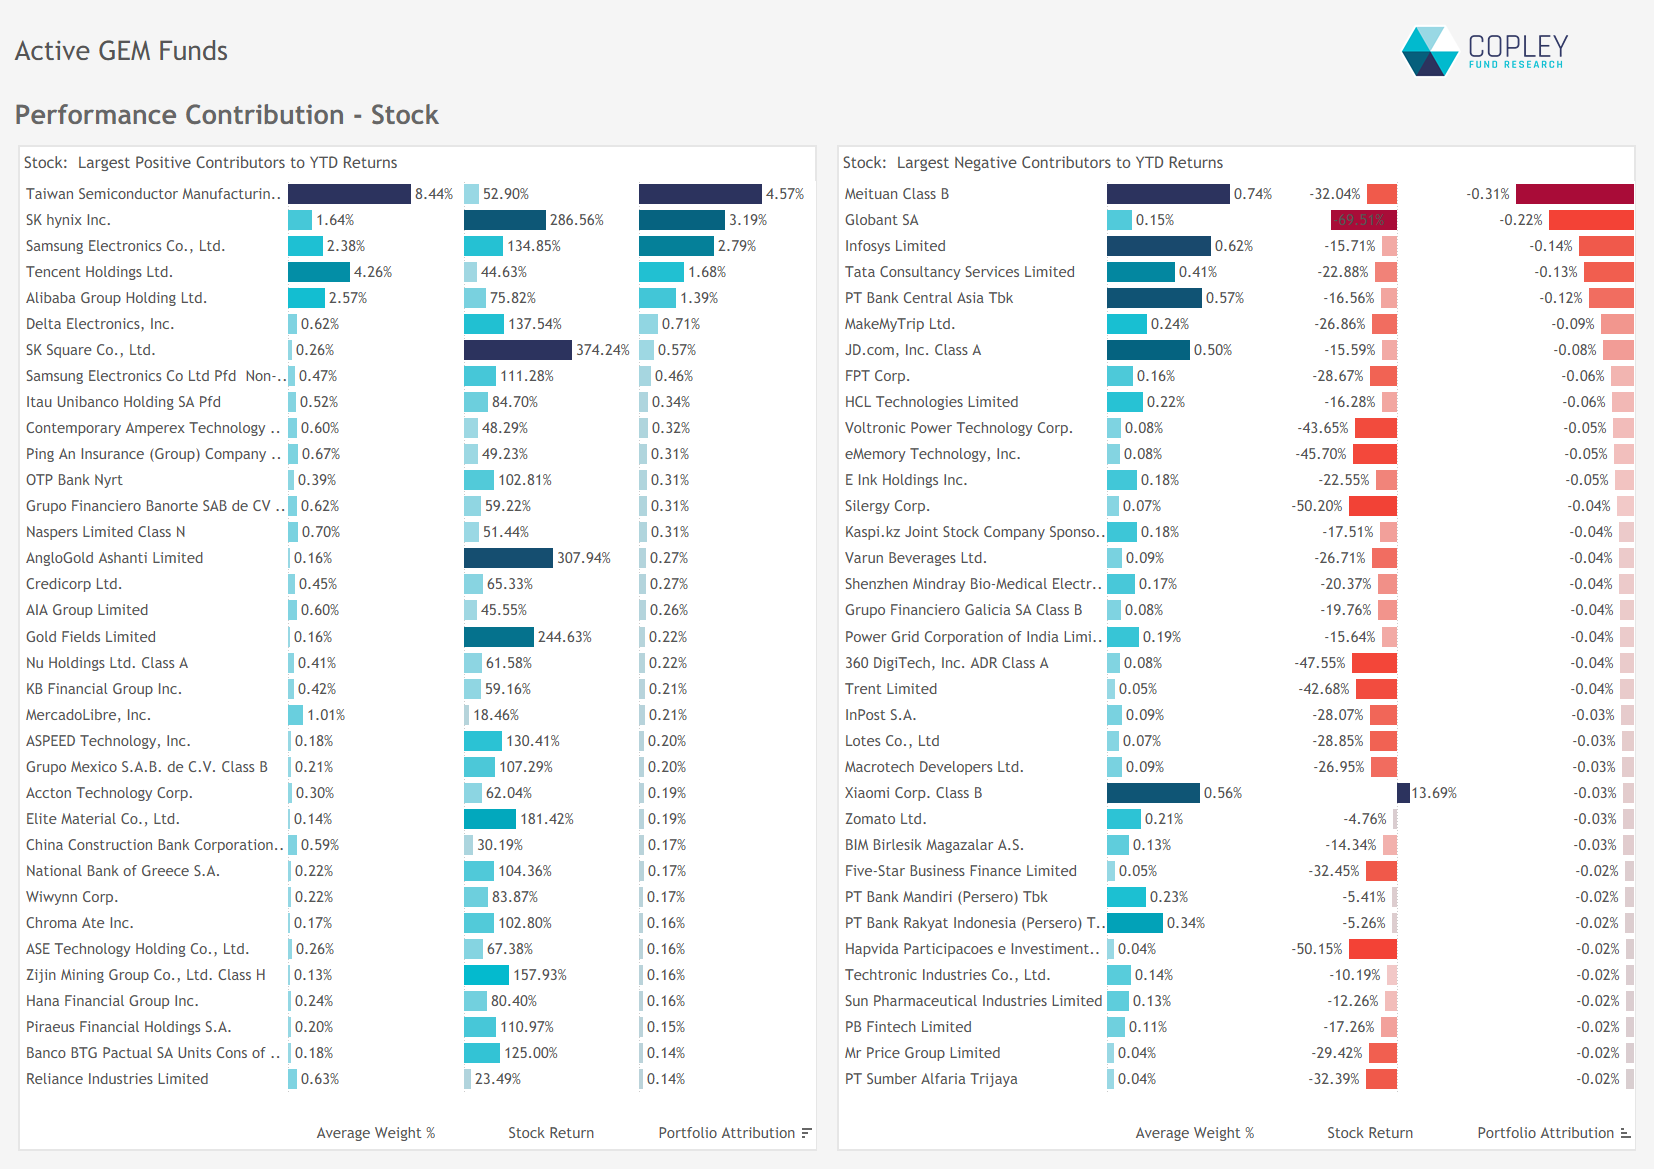
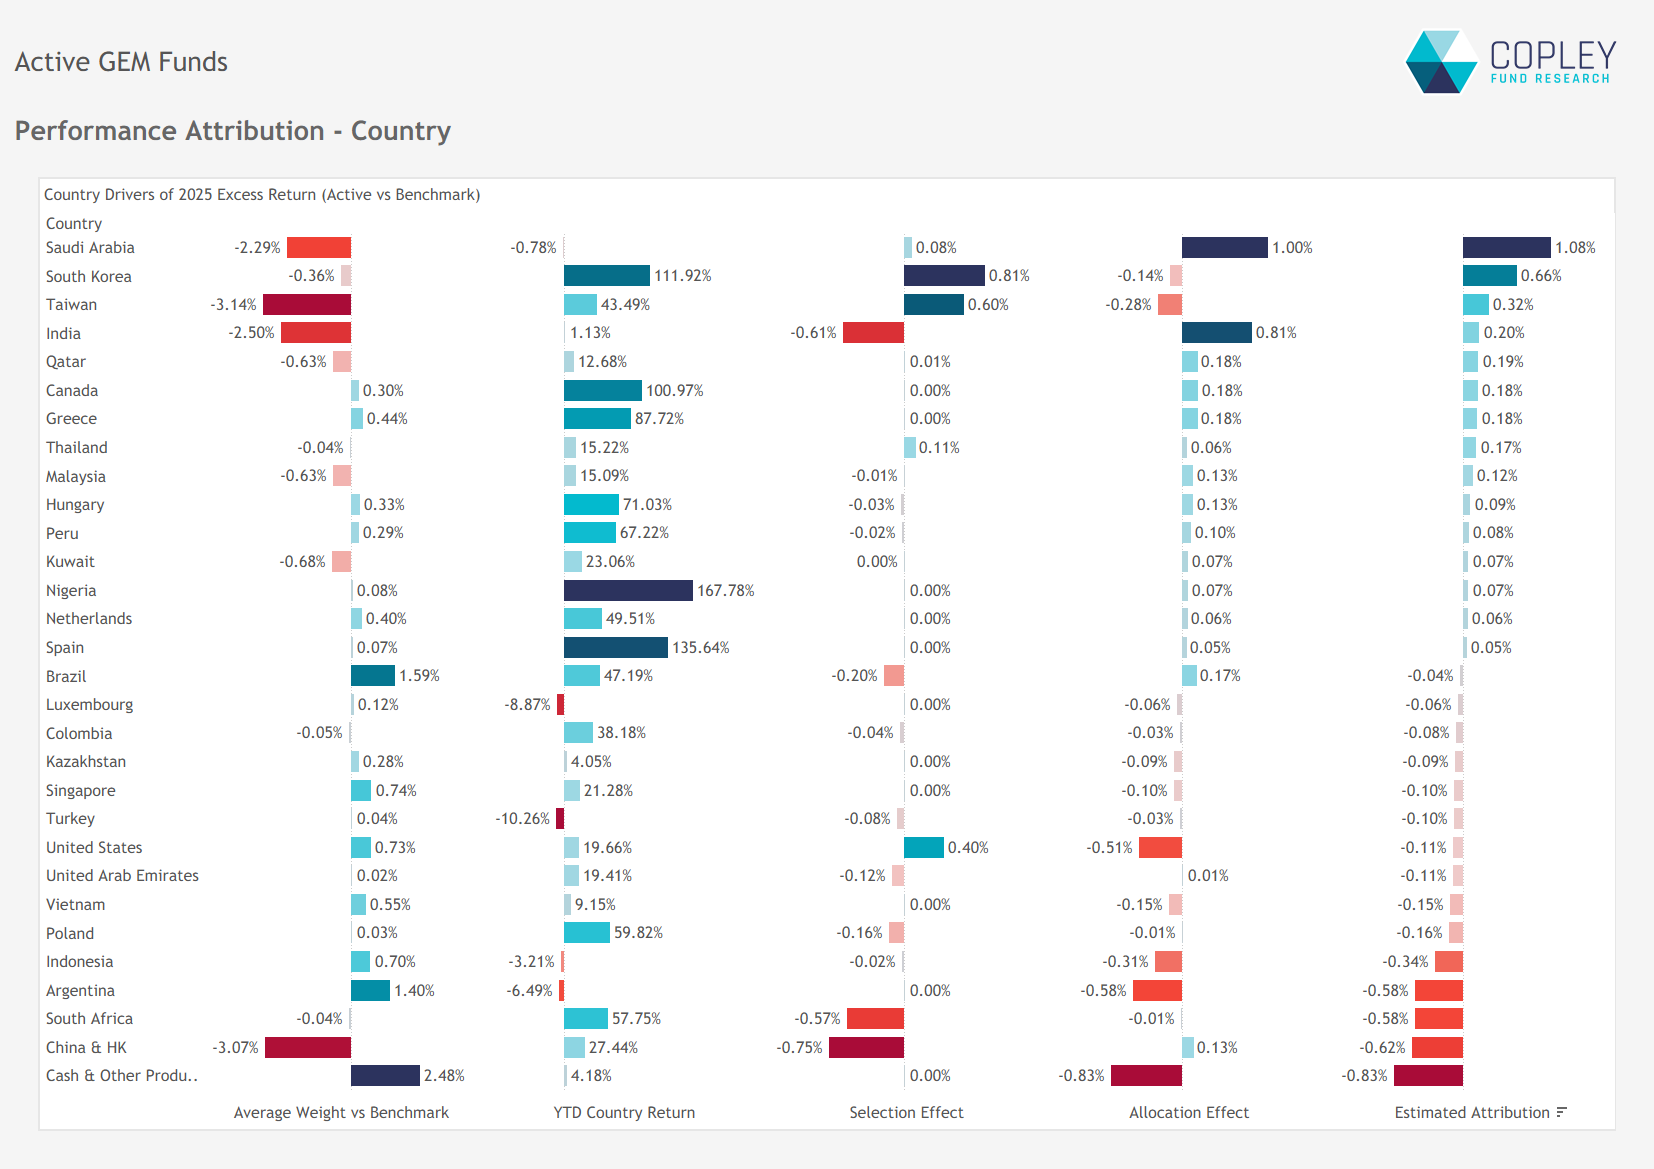
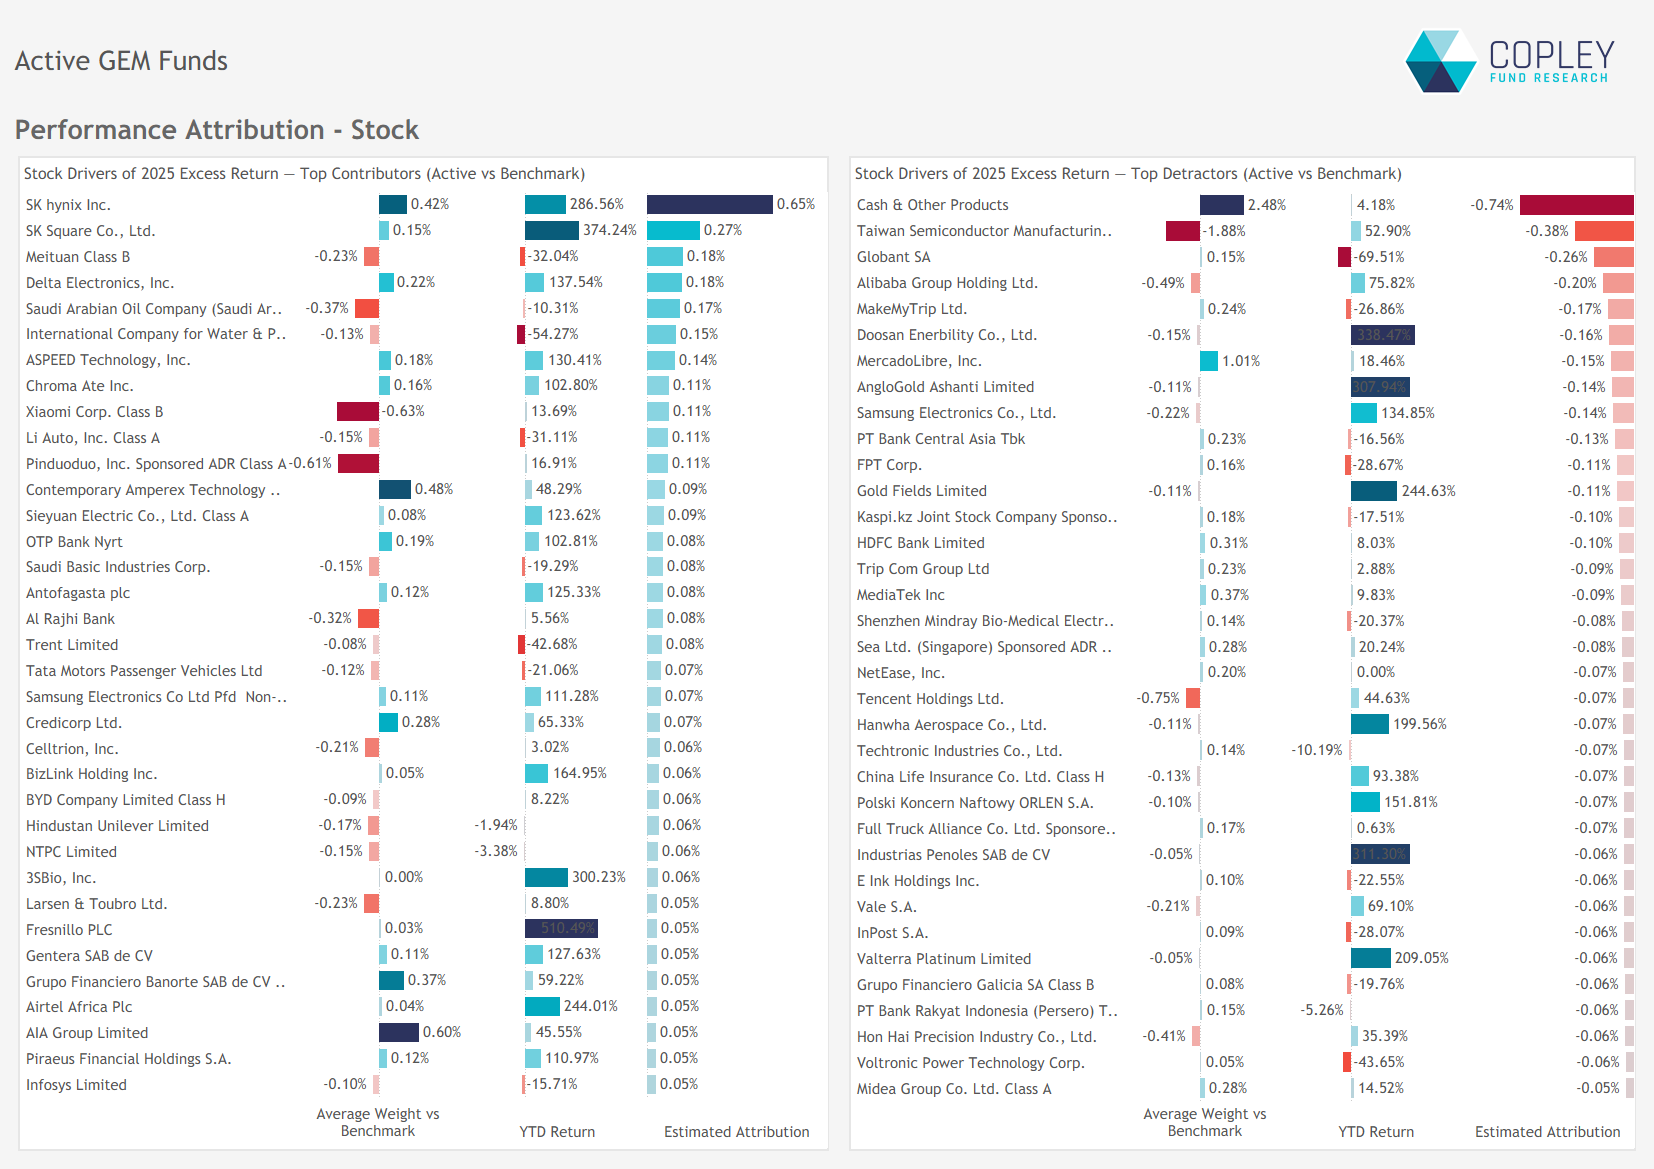
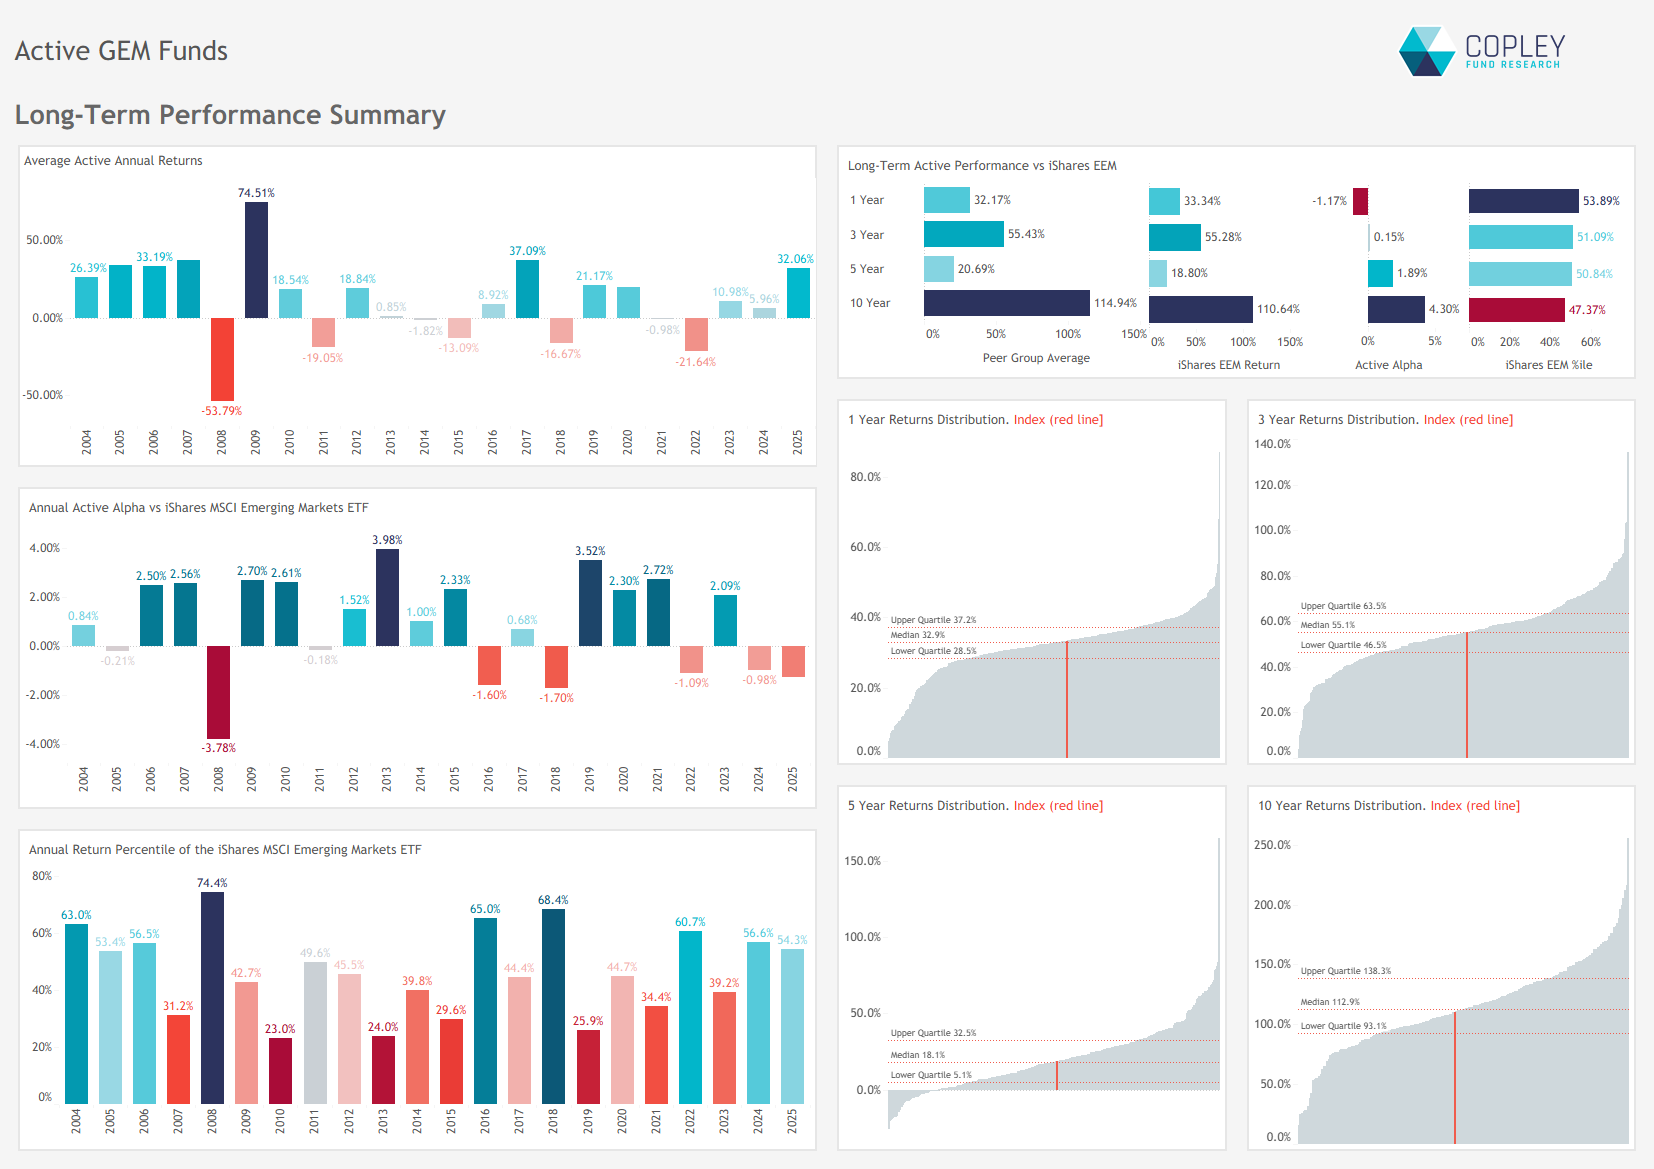
Active GEM Funds: Performance & Attribution 2025
- Steve Holden
- 0 Comments
Related Posts


