24 November
Emerging Markets
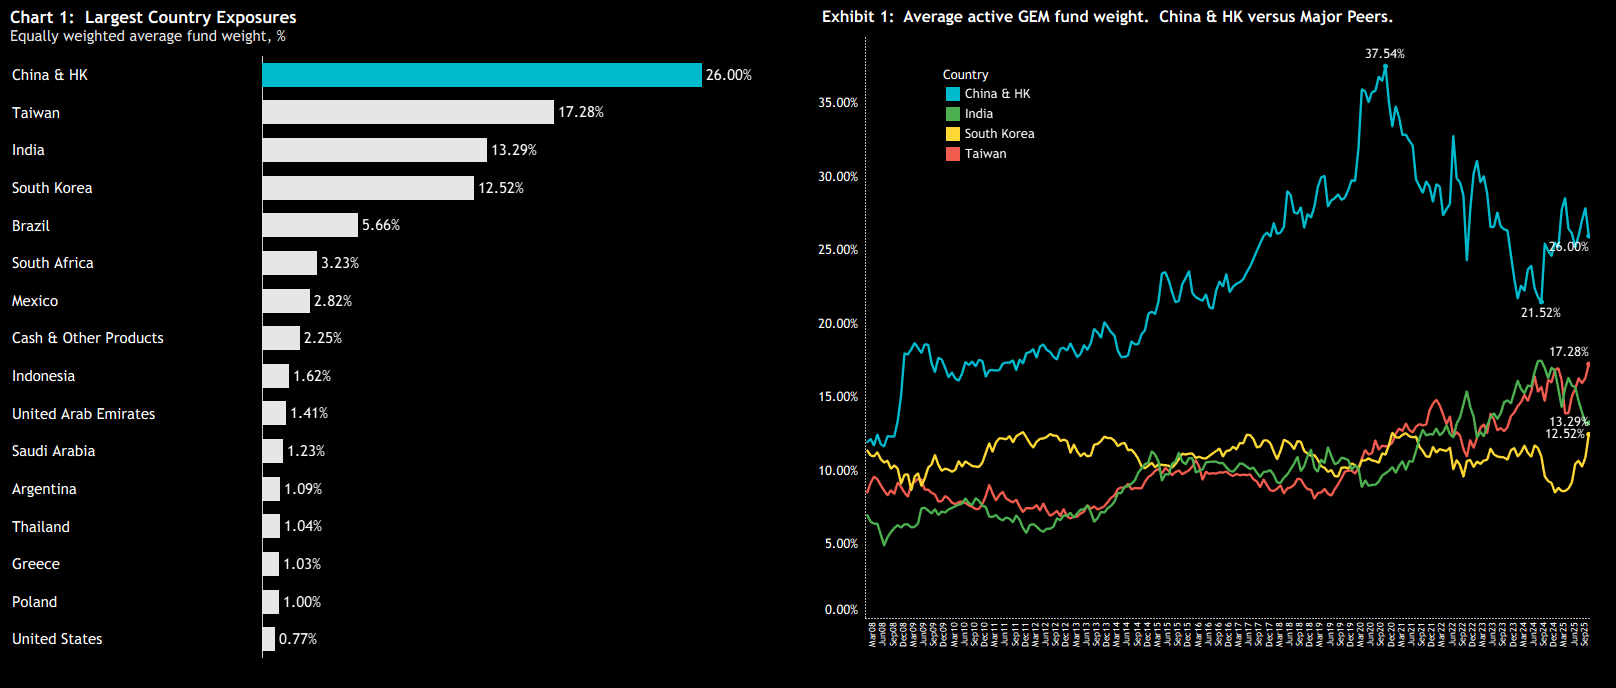
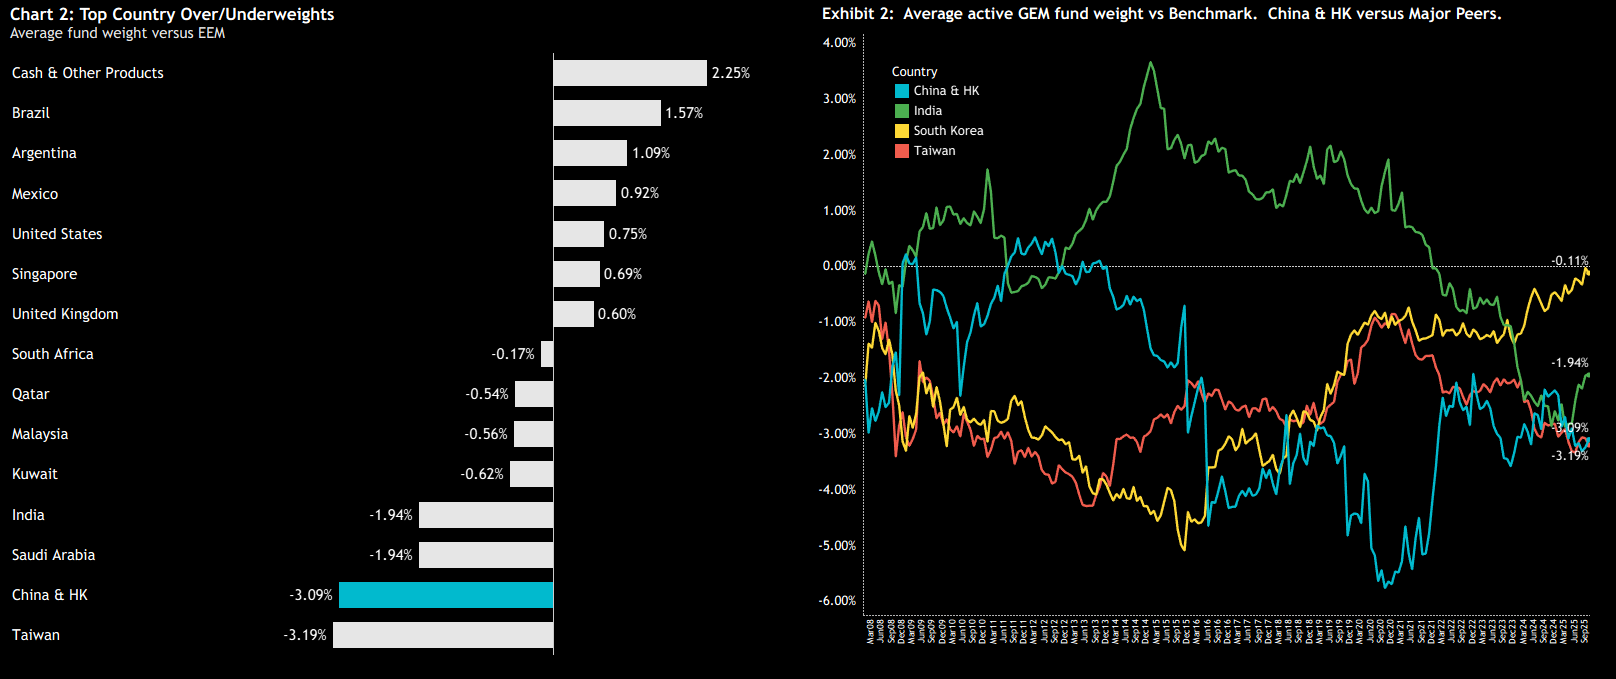
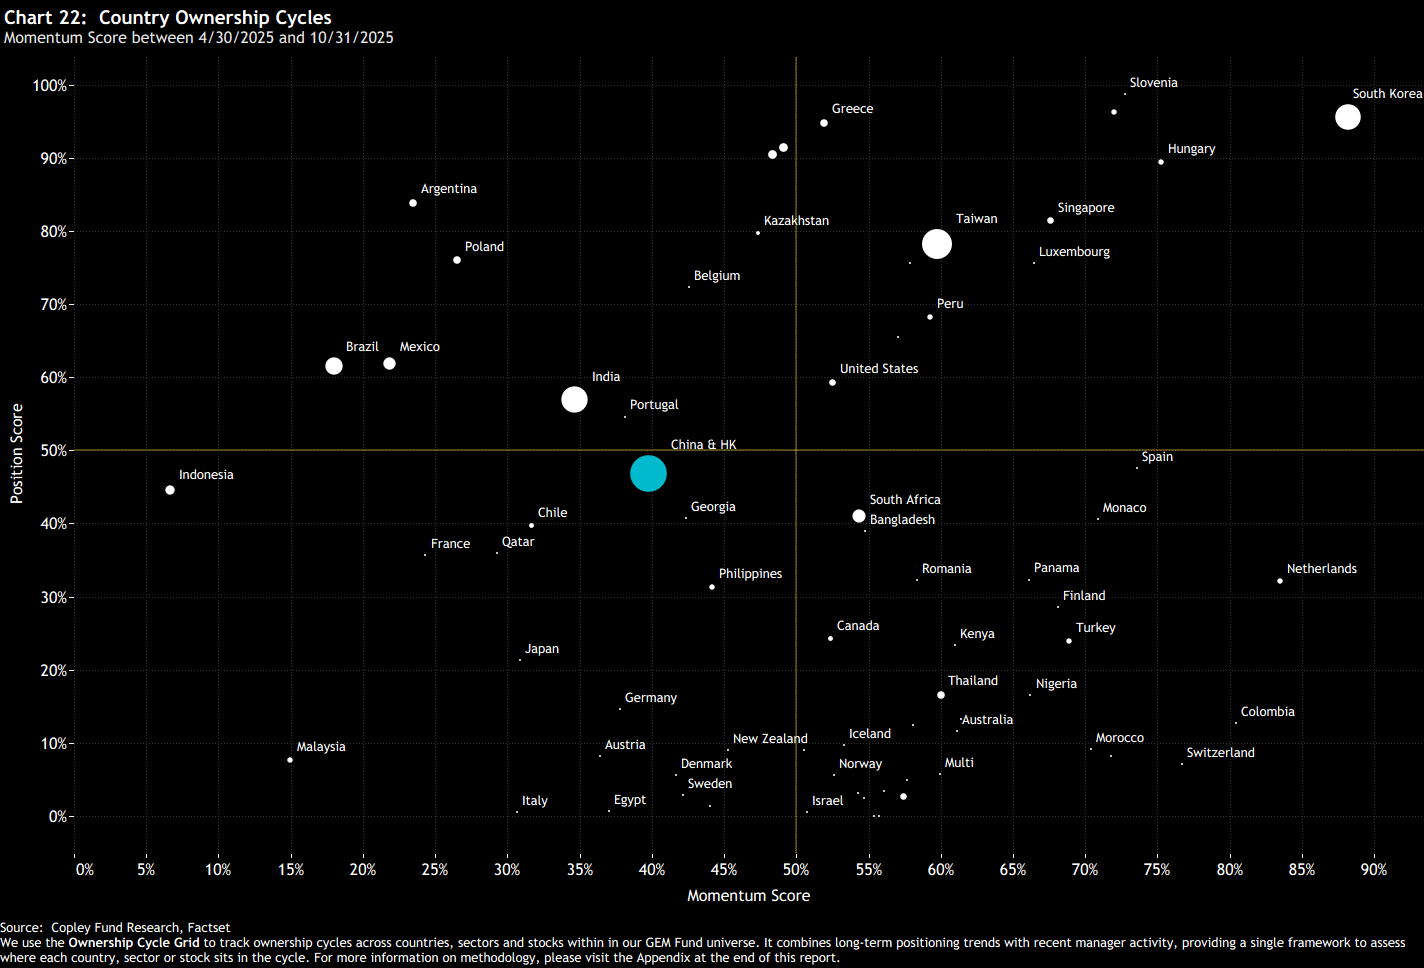
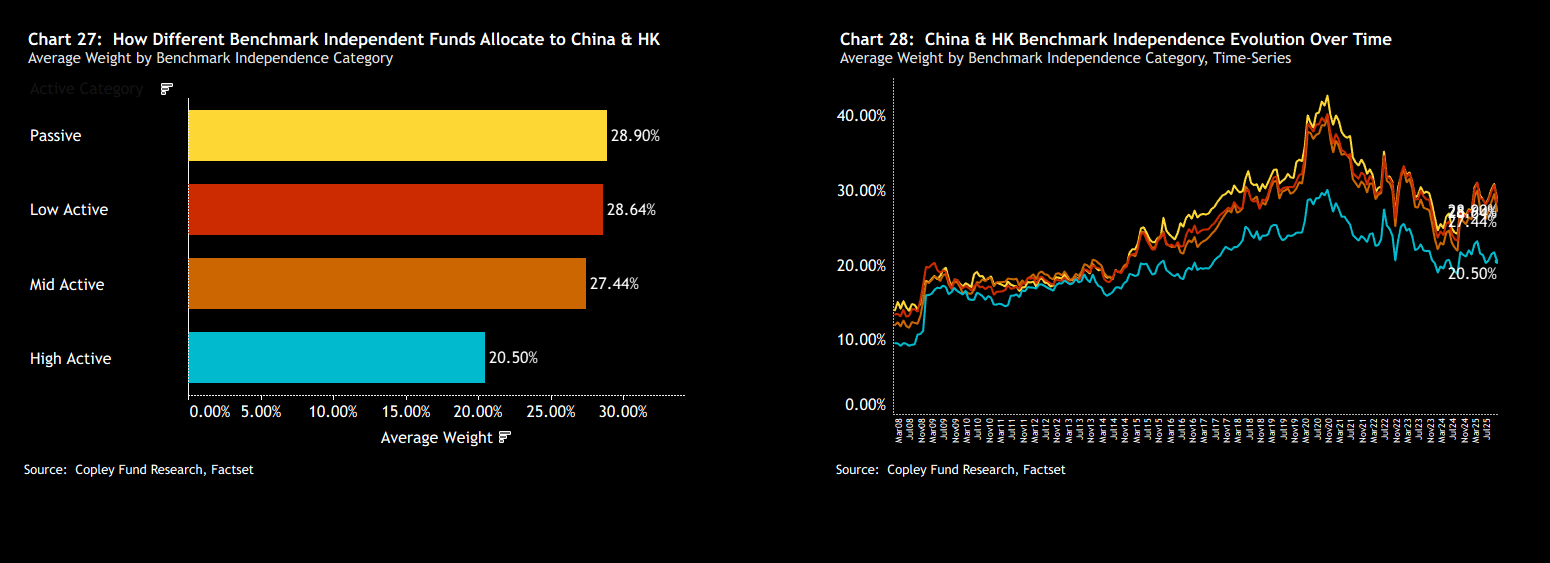
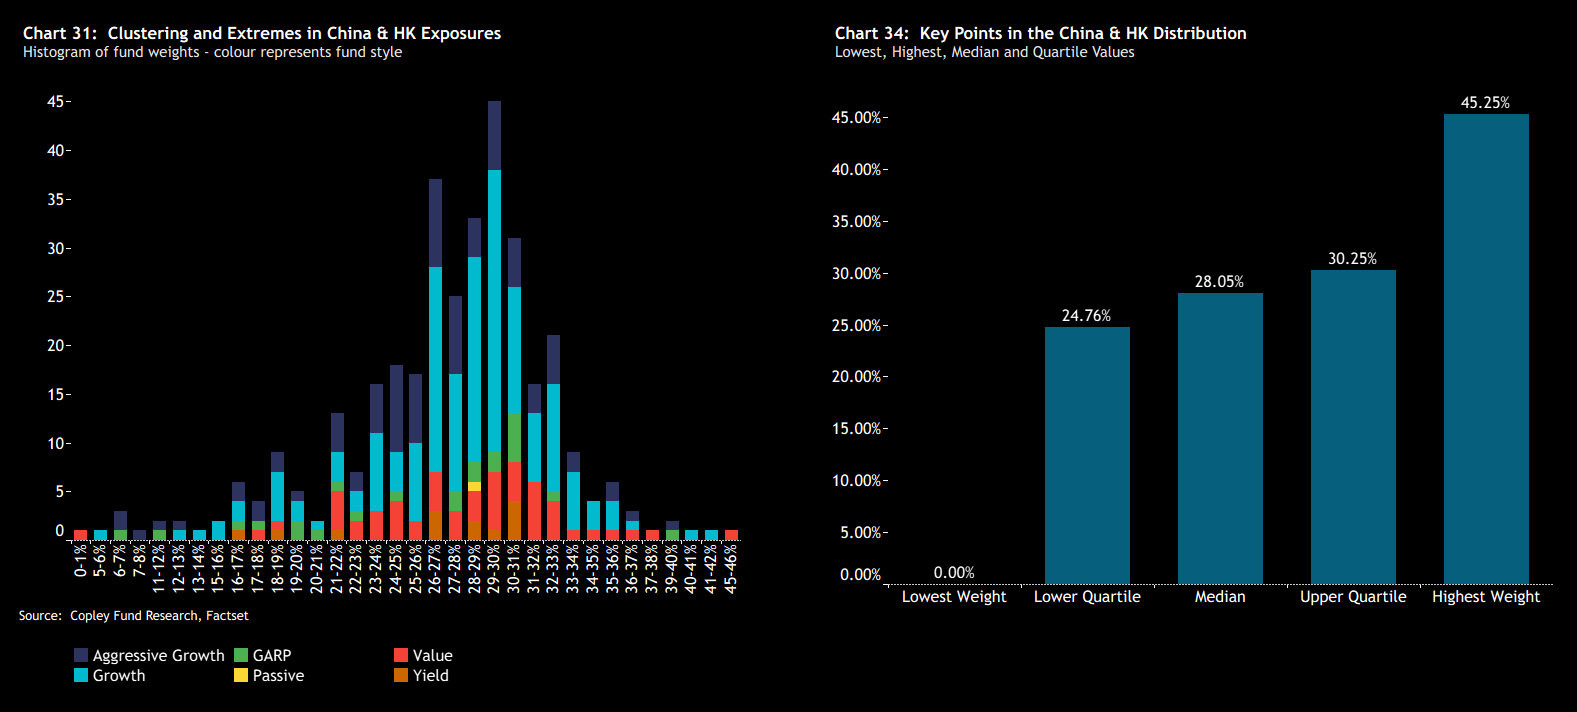
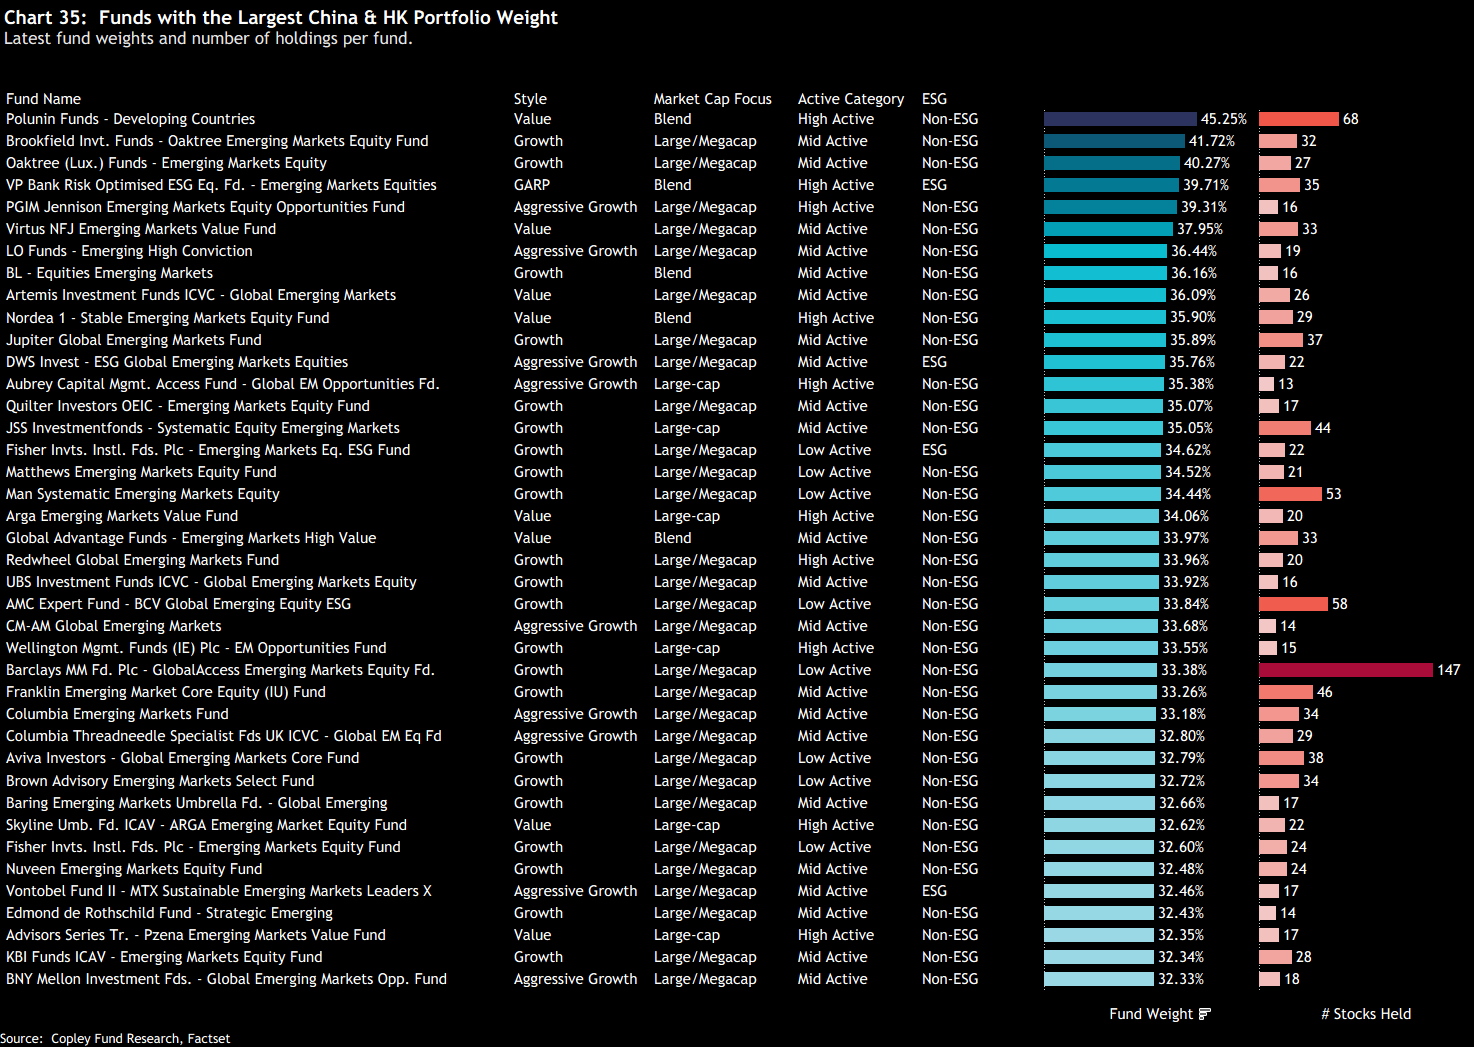
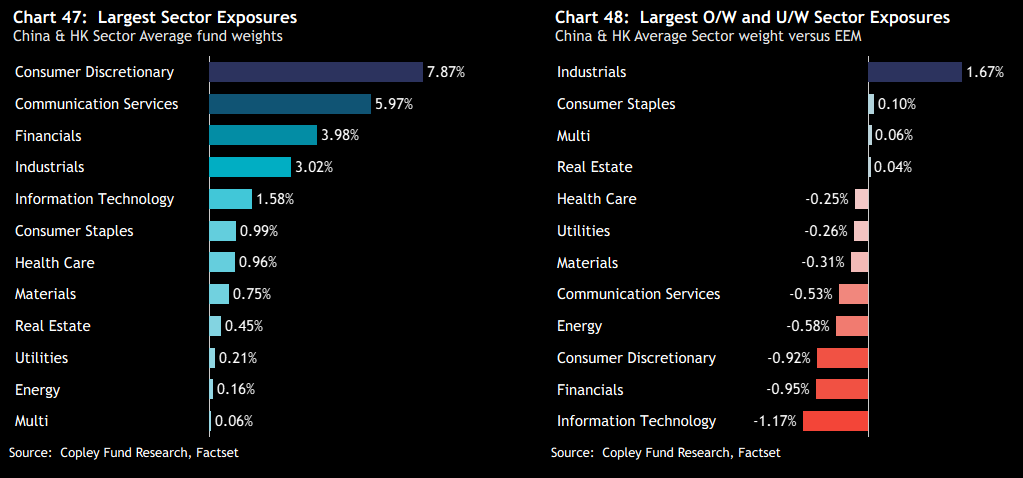
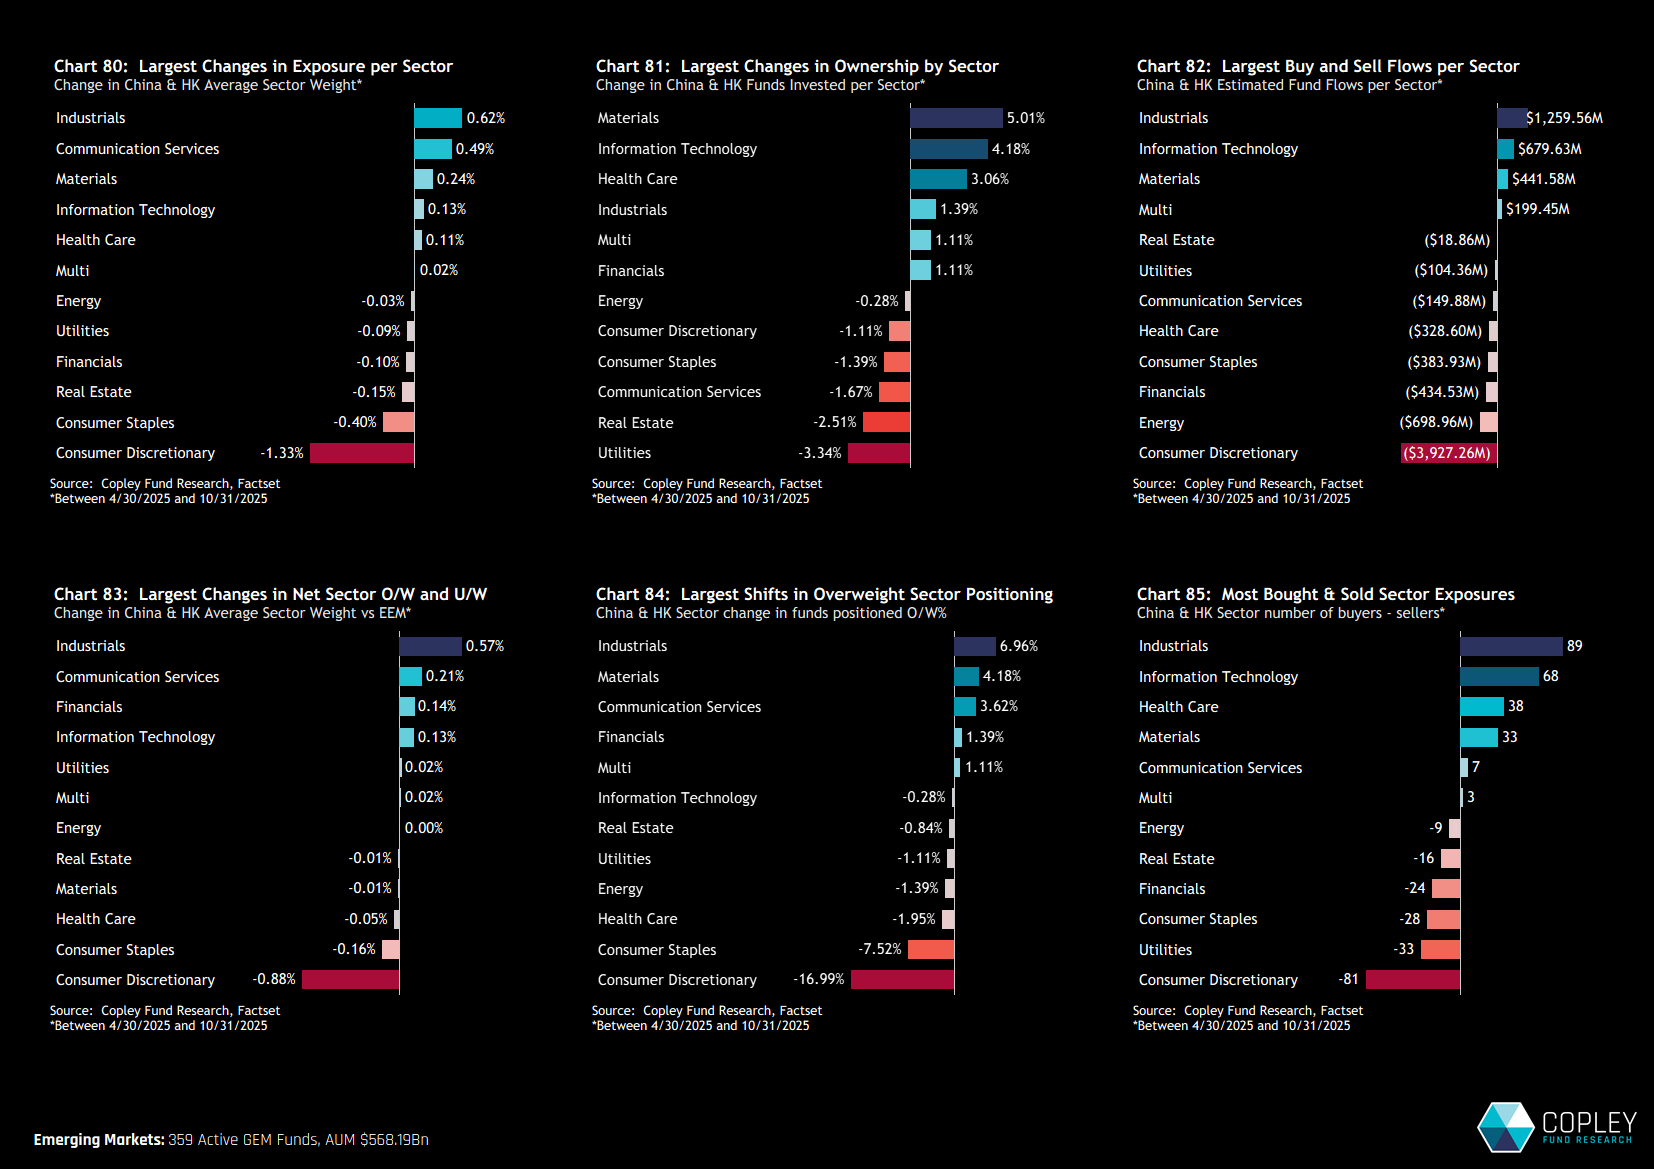
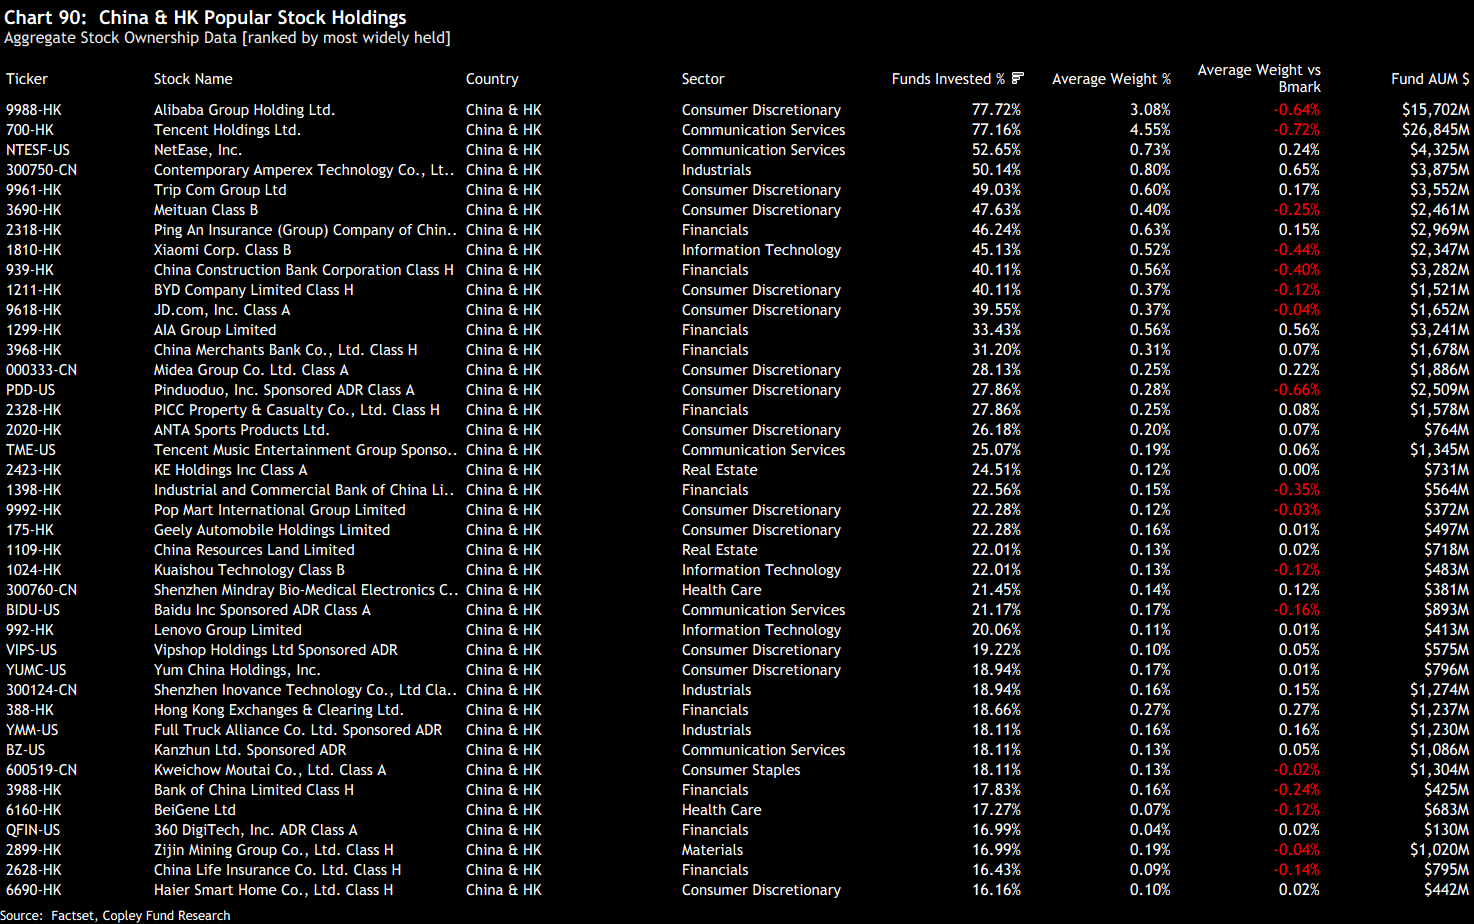
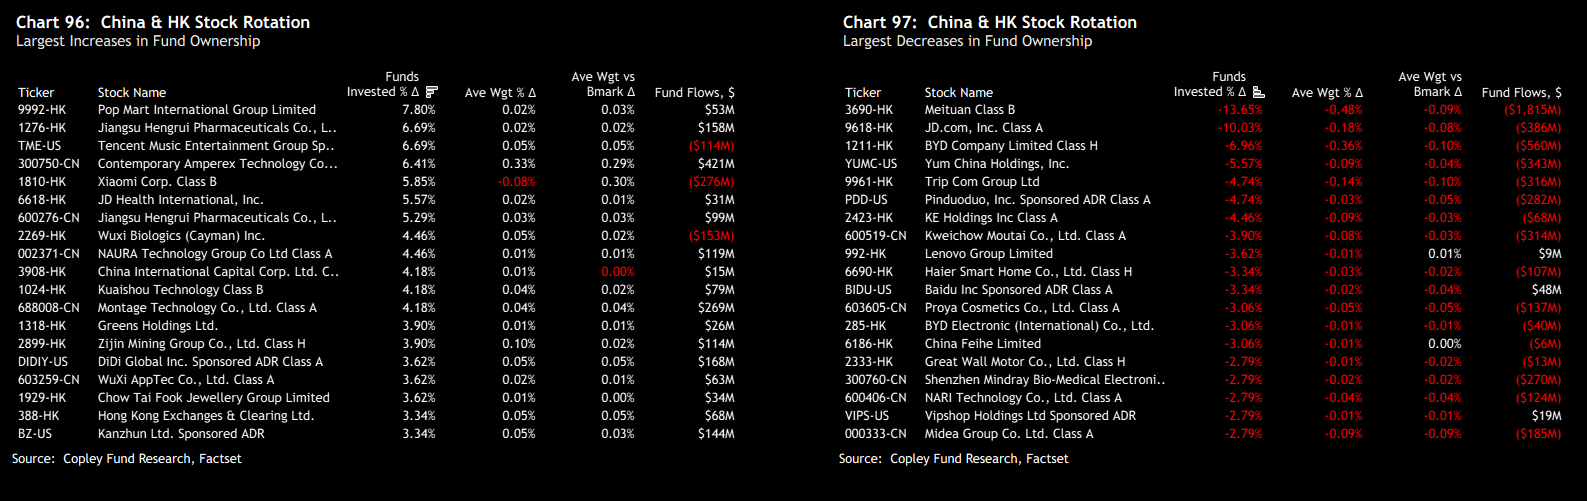
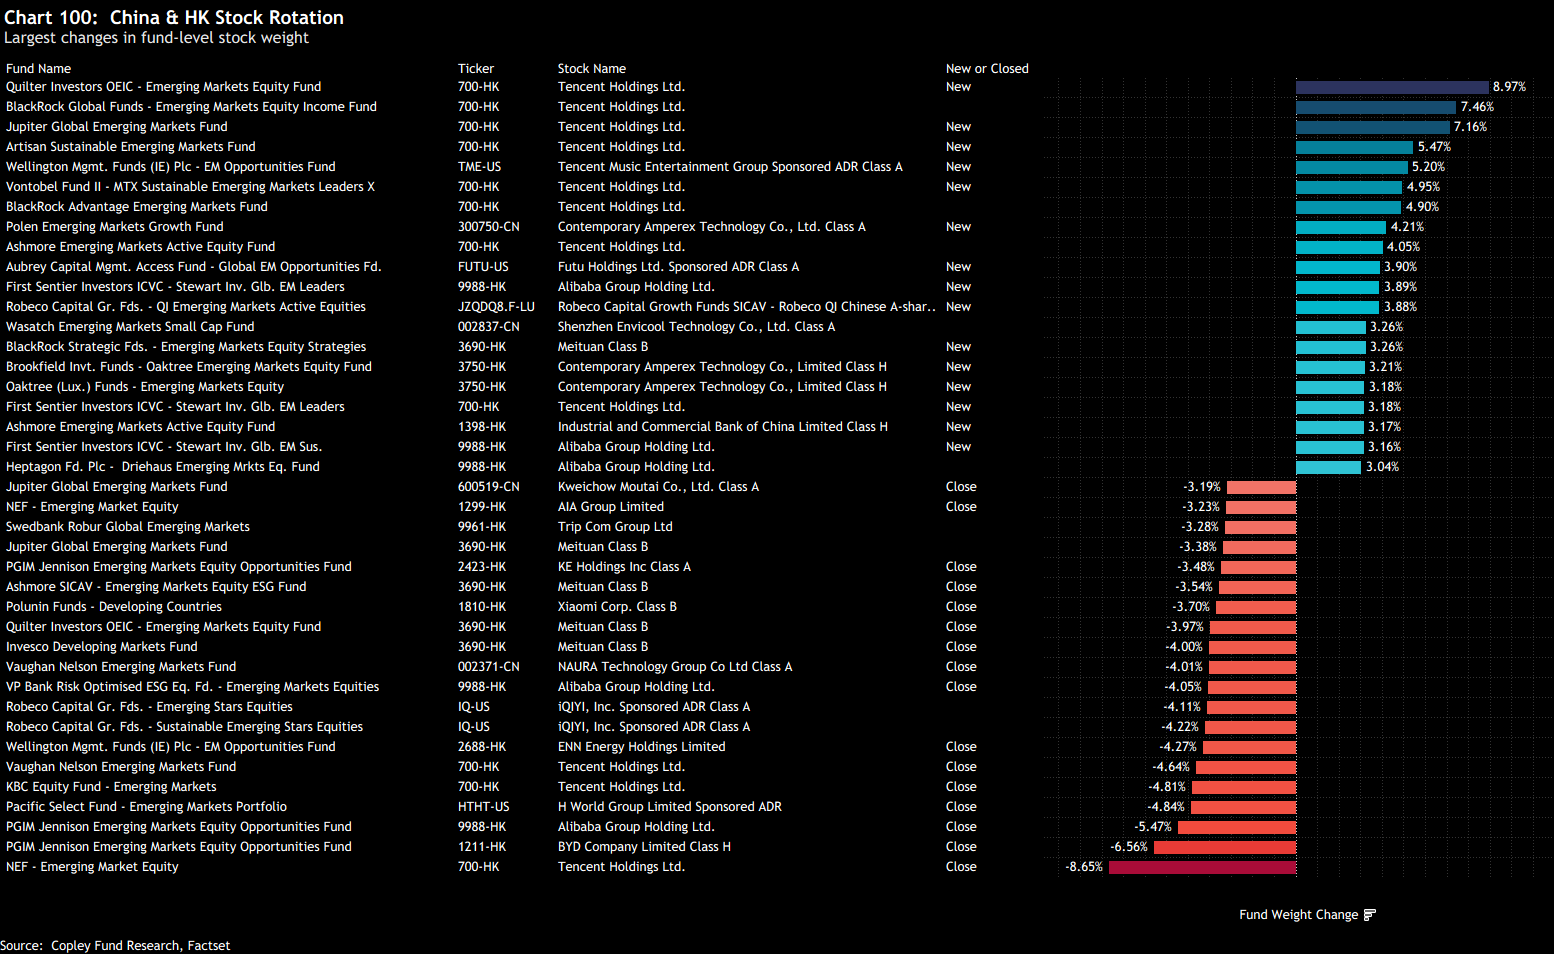
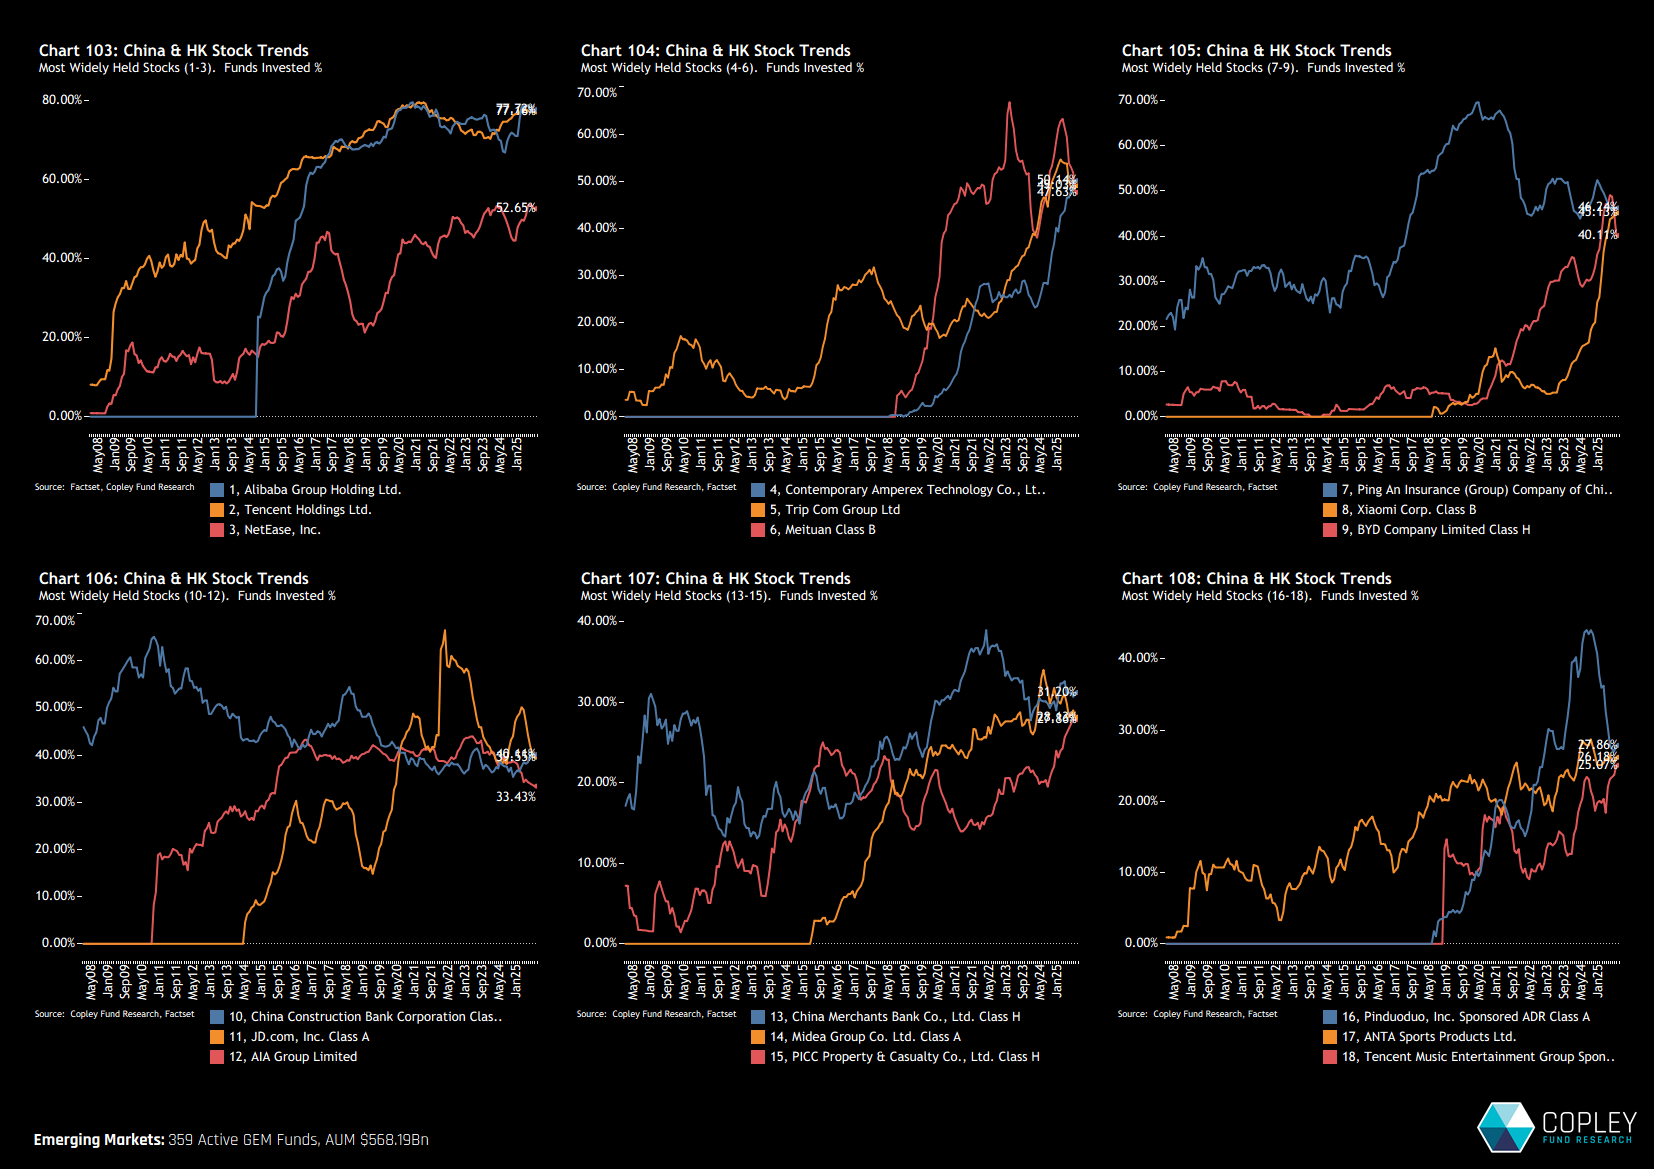
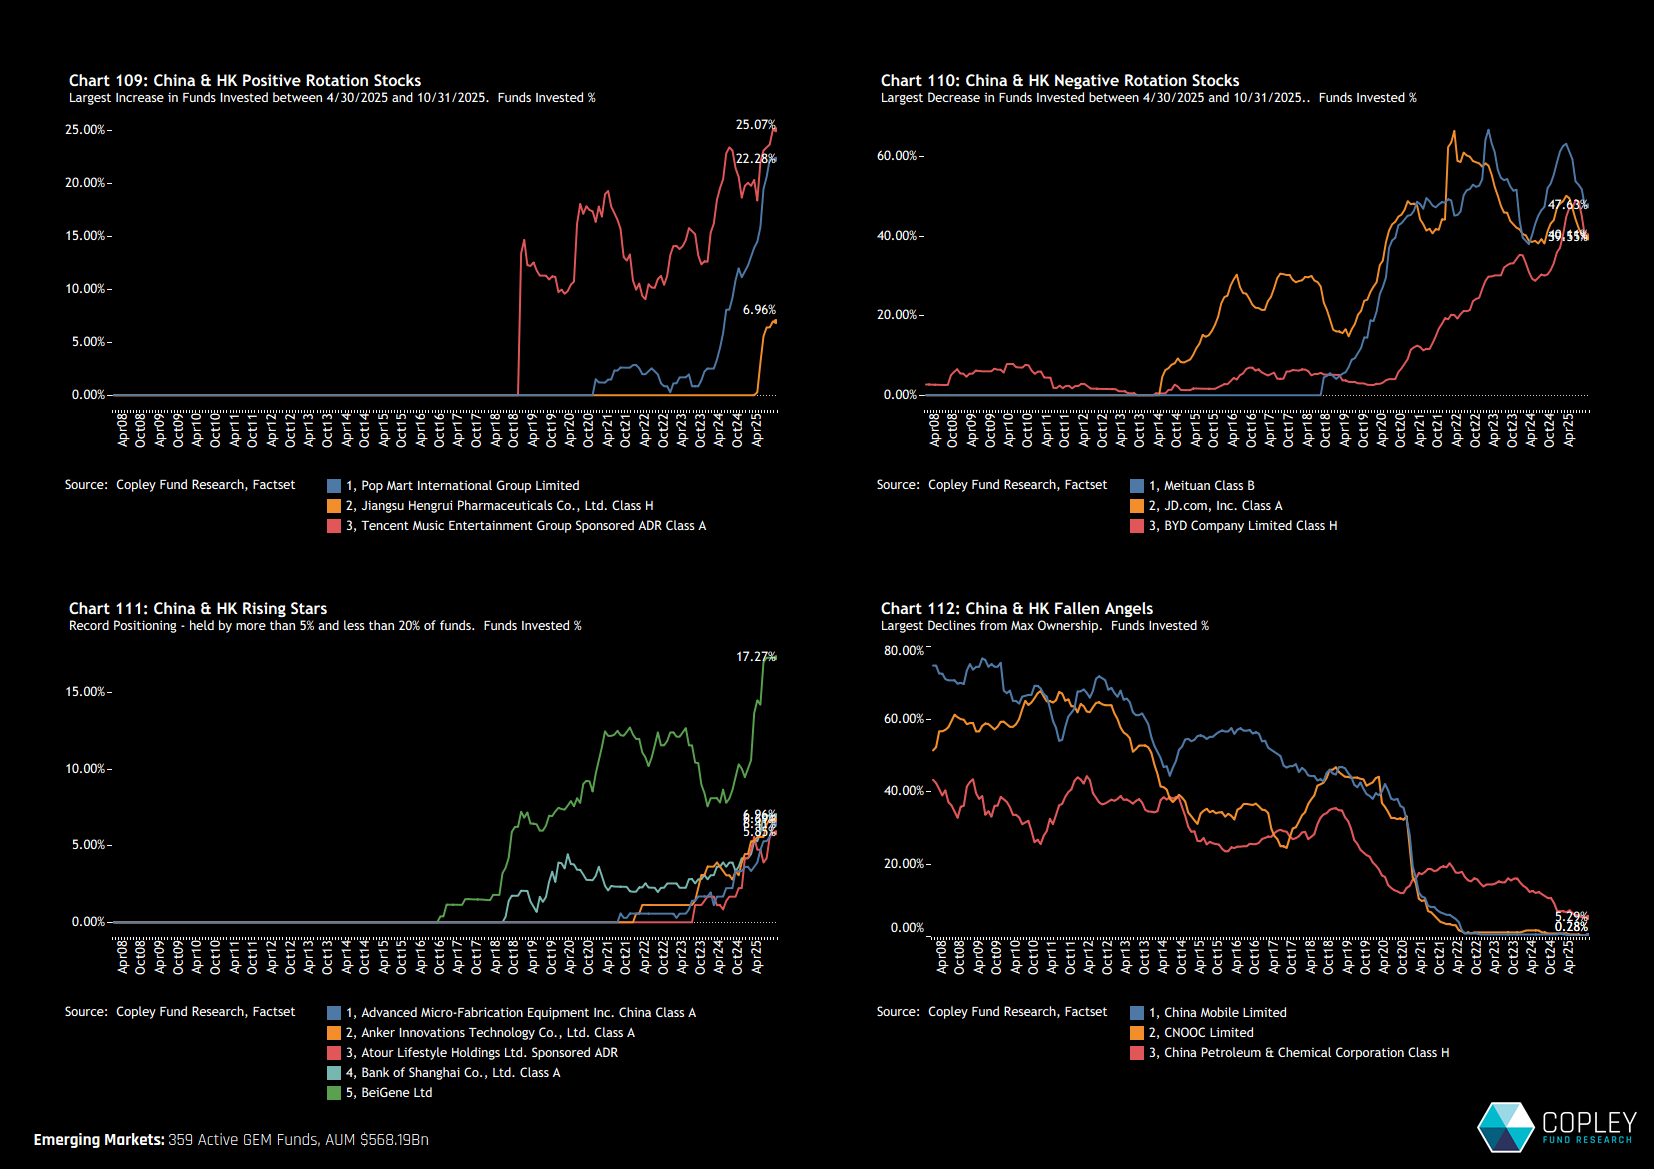
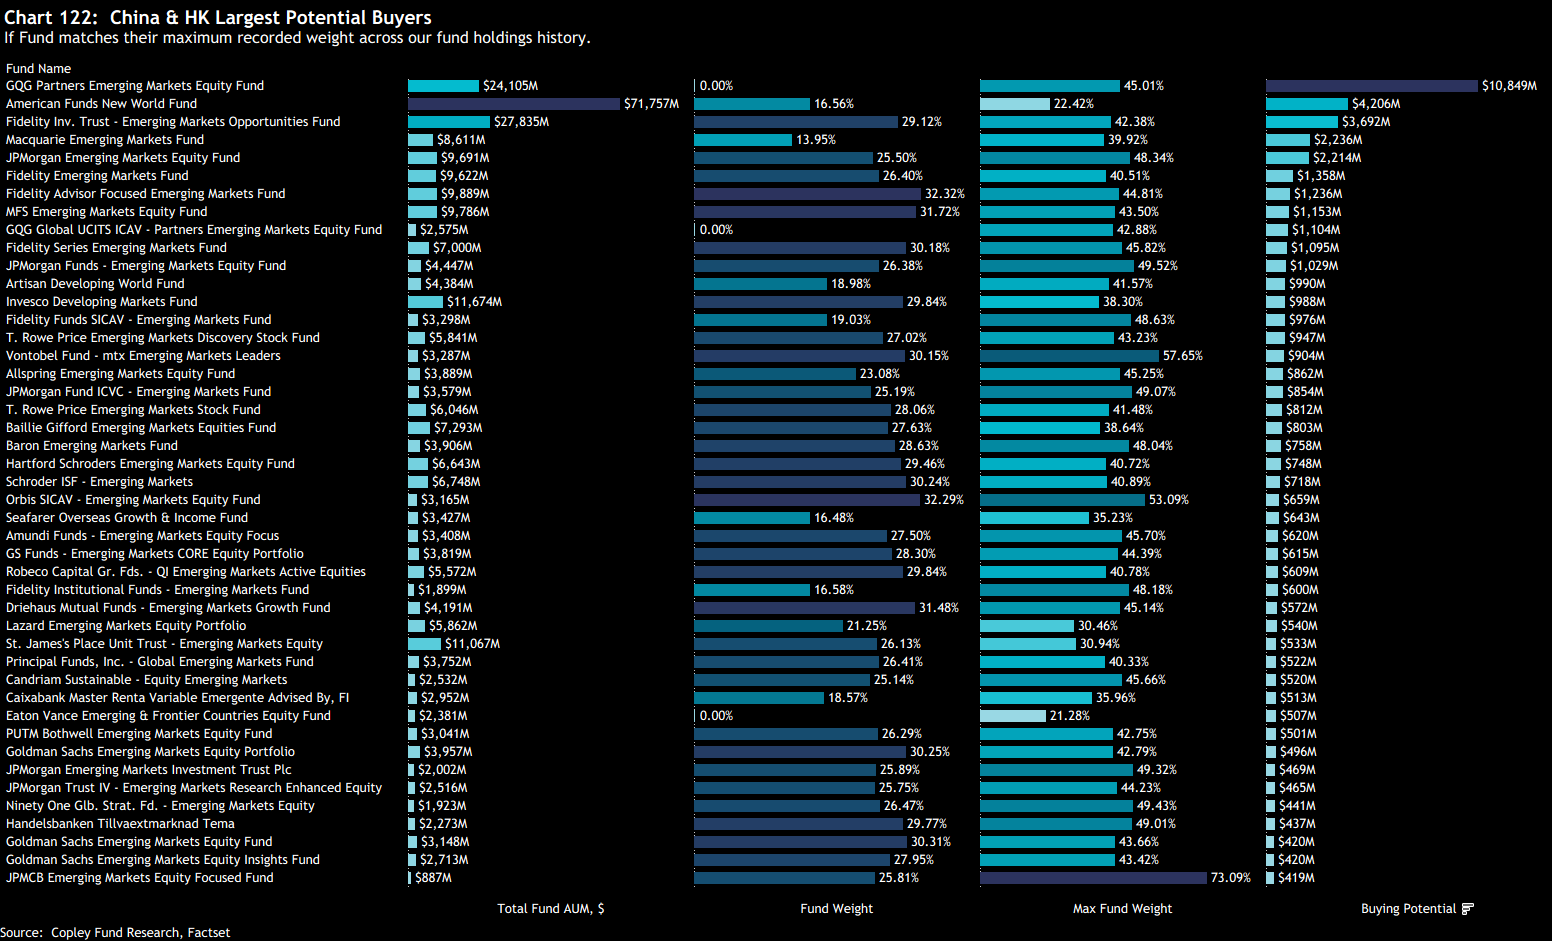
China & HK: Rebuild Slows Amid Heavy Sector and Stock Rotation
- Steve Holden
- 0 Comments

Related Posts


