Executive Summary
Japan ownership among active global funds continues to rise in absolute terms, with 87.7% of funds holding exposure—making it the fourth most widely held country. However, average weights remain low, and Japan persists as a structural underweight, with most funds still positioned below their long-term median levels.
Beneath the surface, rotation has been modest and uneven. Value strategies are the lead allocators at present, while Aggressive Growth funds are split—some adding exposure, others continuing to reduce. Sector positioning is concentrated in Tech and Industrials, while Financials show tentative signs of recovery but remain an area of low conviction. Stock-level ownership is highly dispersed, with little consensus beyond names like Keyence and Sony.
Despite strong market performance, the positioning response has been restrained. Some managers are returning after years on the sidelines, but the pace is measured. Active investors are reengaging—but with discipline, not exuberance!
Click on the Report Link below for access to the latest Japan Market Intelligence Report, and scroll down for the chart highlights
Country Positioning: Japan Ahead of Asian Peers
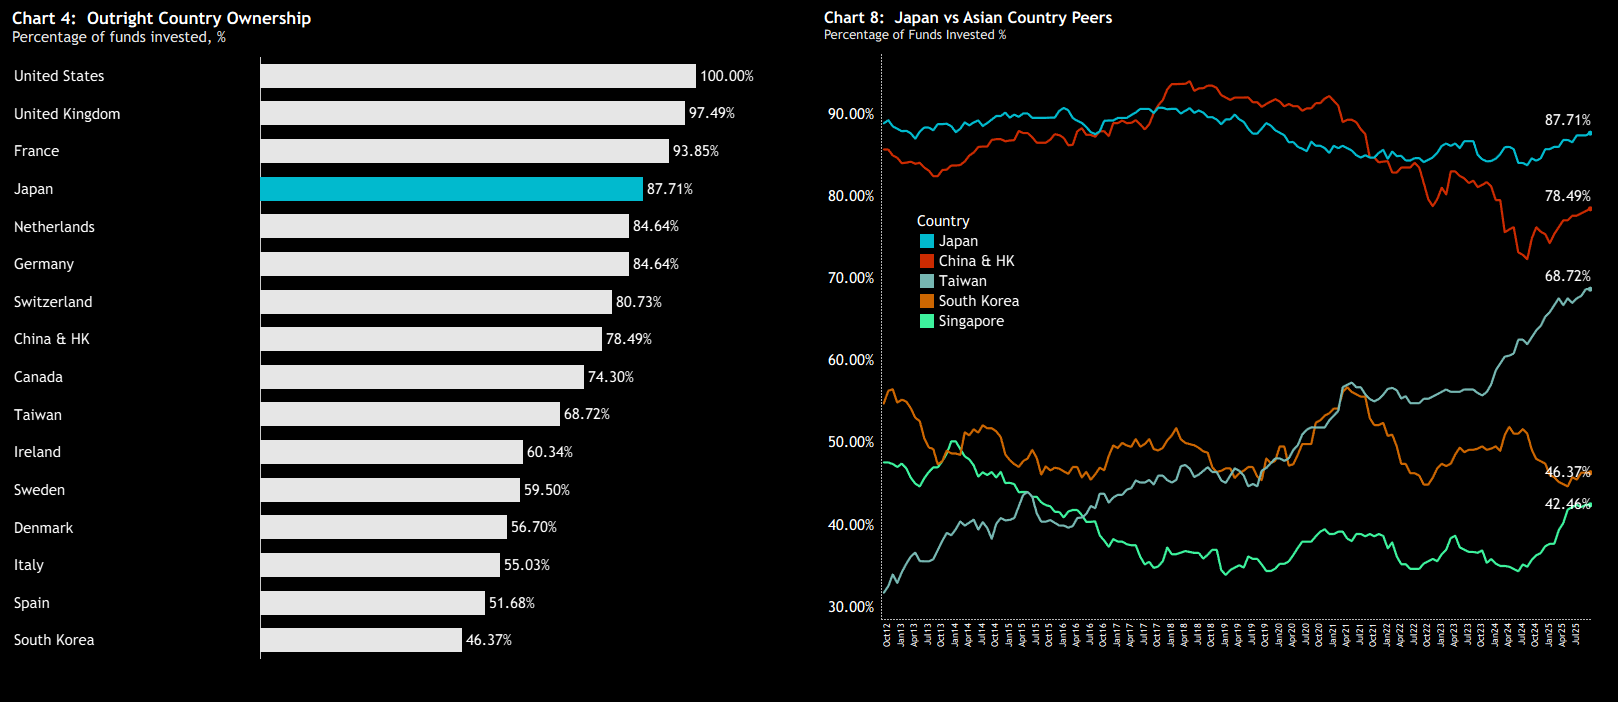
We begin with the percentage of global funds invested in each country — a measure that cleanly captures participation. Unlike AUM or average weight-based measures, this approach removes price distortions and captures a binary expression of conviction: a fund either owns a position, or it does not. Chart 4 shows Japan as the fourth most widely held country, with 87.7% of the 358 global funds in our dataset holding exposure. While this sits behind the near-universal ownership of the US and broad inclusion of the UK and France, it places Japan well ahead of other key Asian markets.
Chart 8 tracks the progression of this metric over time. The trend points to a steady recovery in the share of funds owning Japan, alongside a persistent gap versus China & HK and Taiwan. That said, ownership in other Asian markets has also been rising. China & HK, Taiwan, and Singapore have all seen accelerating participation in recent months—early signs of a broader regional rotation taking shape.
Absolute and Relative Fund Weights: Japan in Decline, Persistently Underweight
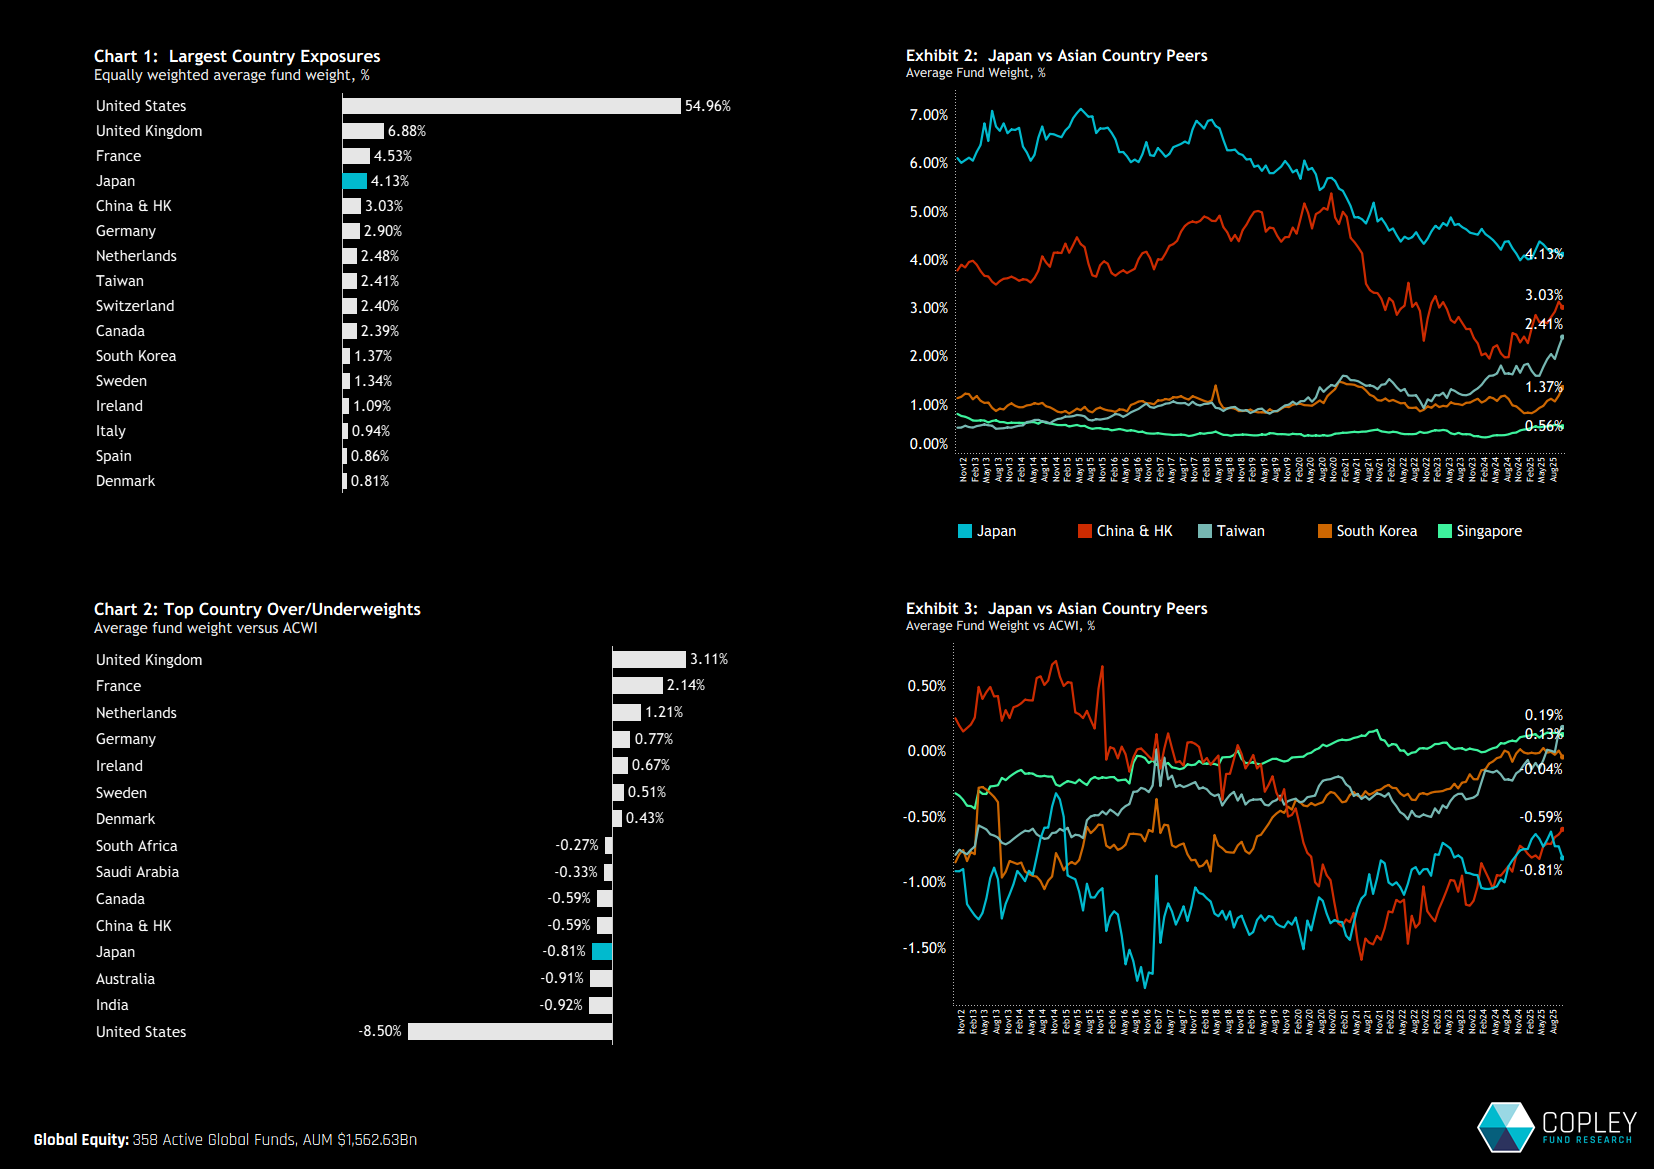
Japan ranks as the fourth largest country weight in absolute terms (Chart 1), and simultaneously the fourth largest underweight relative to the SPDR ACWI ETF (Chart 2). Despite rising participation, average weights remain pinned near the lower end of the 15-year range, while China & HK and Taiwan continue to close the gap (exhibit 2). In relative terms, Japan remains a structural underweight for active global managers, with positioning steadily contracting in recent years—broadly echoing the trend seen in China & HK. Taiwan, by contrast, has followed a different path, making a more decisive transition from a persistent underweight to a clear overweight (exhibit 3).
Country-Level Rotation: Mixed Signals
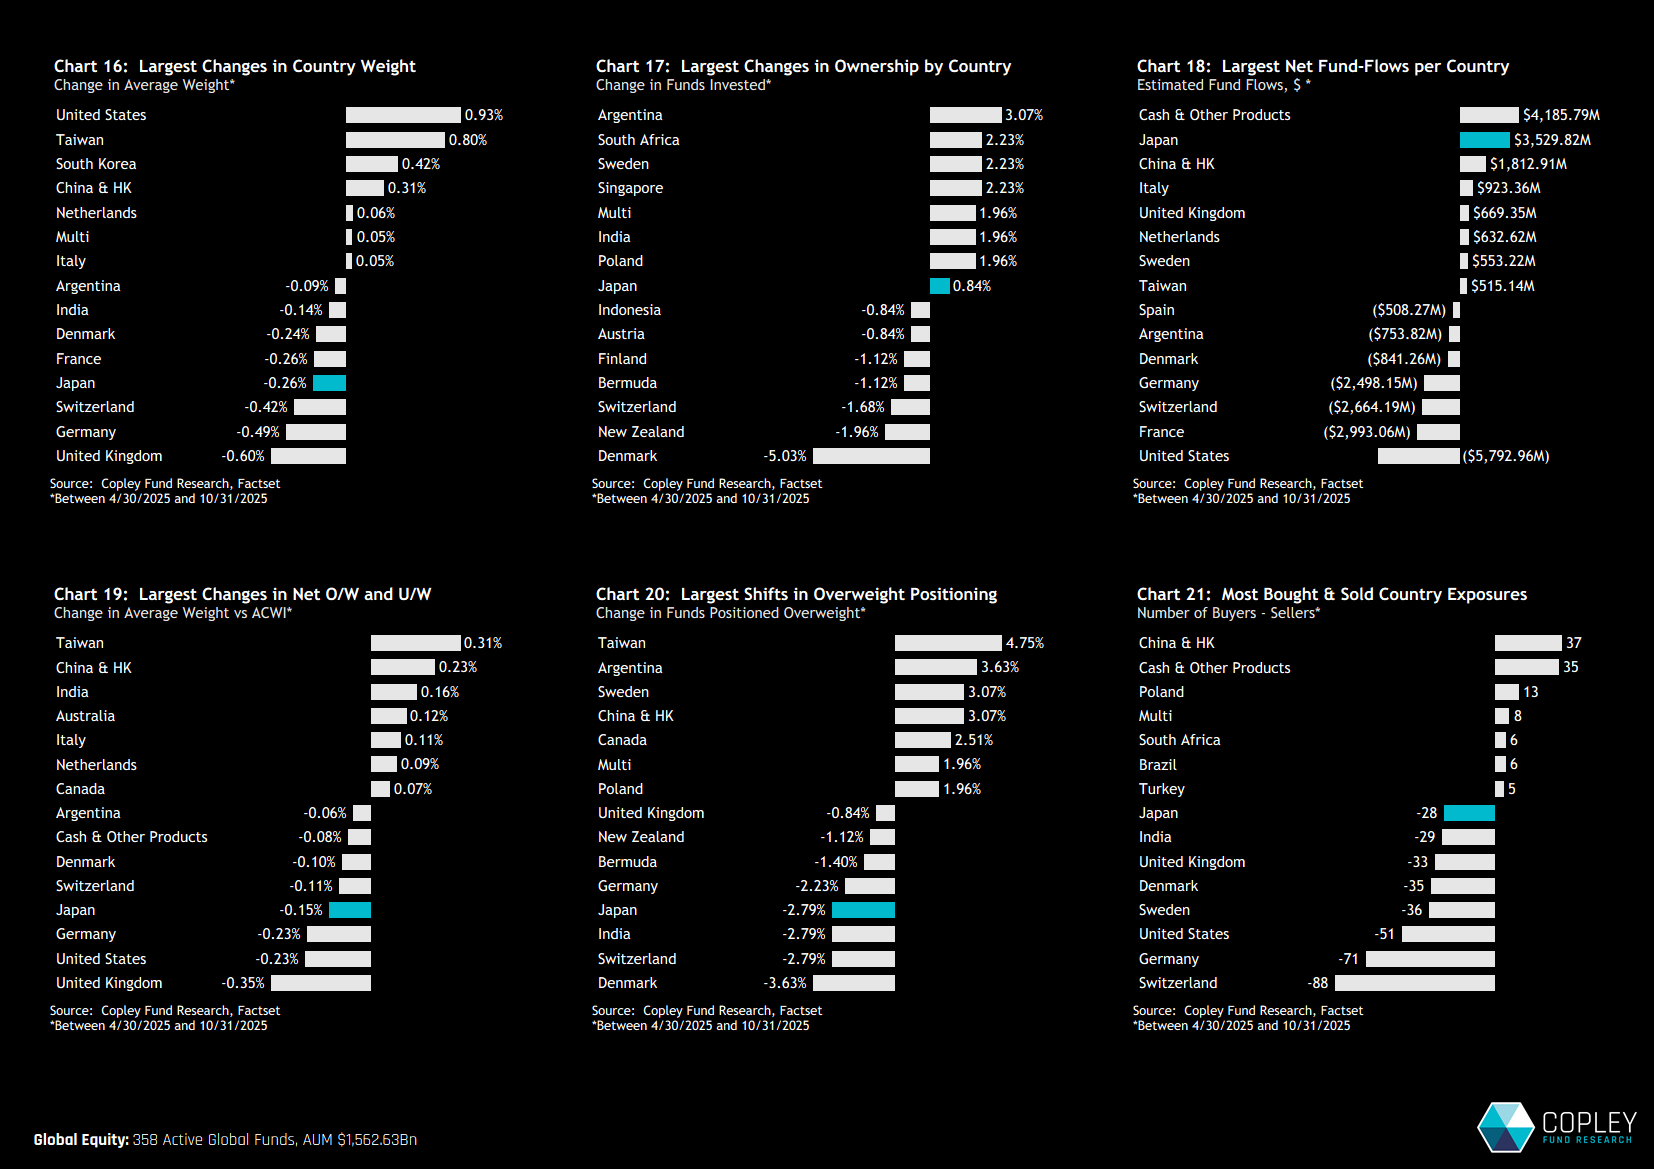
Fund rotation metrics over the past six months offer a conflicted read. On the positive side, the percentage of funds invested in Japan rose by 0.84%, and the country attracted the second-largest inflows outside of Cash, totalling $3.5bn. However, these gains are offset by weaker internals: average weights declined, the relative underweight widened, and a greater number of funds shifted to an underweight stance. Japan also saw a net imbalance of sellers over buyers—consistent with broader asset class dynamics, where global funds recorded $4.7bn in net outflows and a 3:2 ratio of funds seeing redemptions versus inflows. In short, while participation continues to rise, this is far from a full-fledged pivot into Japan. The rotation remains tentative.
Style Dynamics: Value over Growth
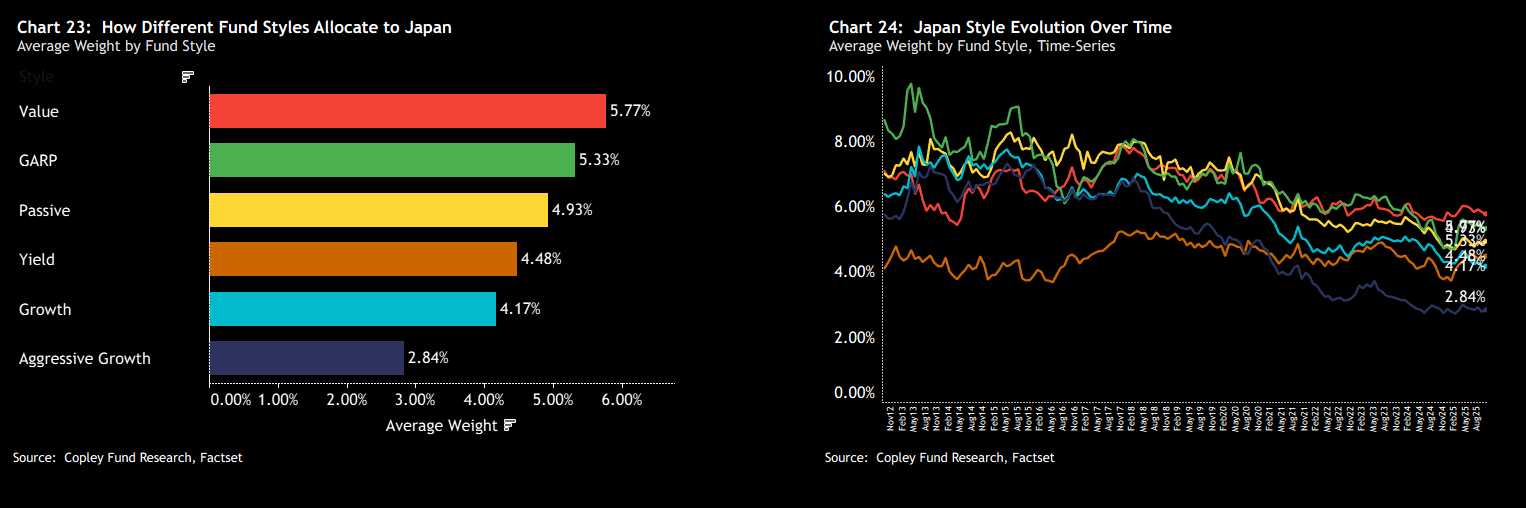
A clear Value bias emerges when splitting Japanese allocations by fund style. Average weights among Value funds are more than twice those of Aggressive Growth funds, which have steadily and consistently reduced exposure to Japan since 2018 and now sit near record lows. While GARP investors remain overweight Japan relative to the ACWI benchmark, both Yield and Growth funds maintain moderate underweights.
Fund-Level Positioning
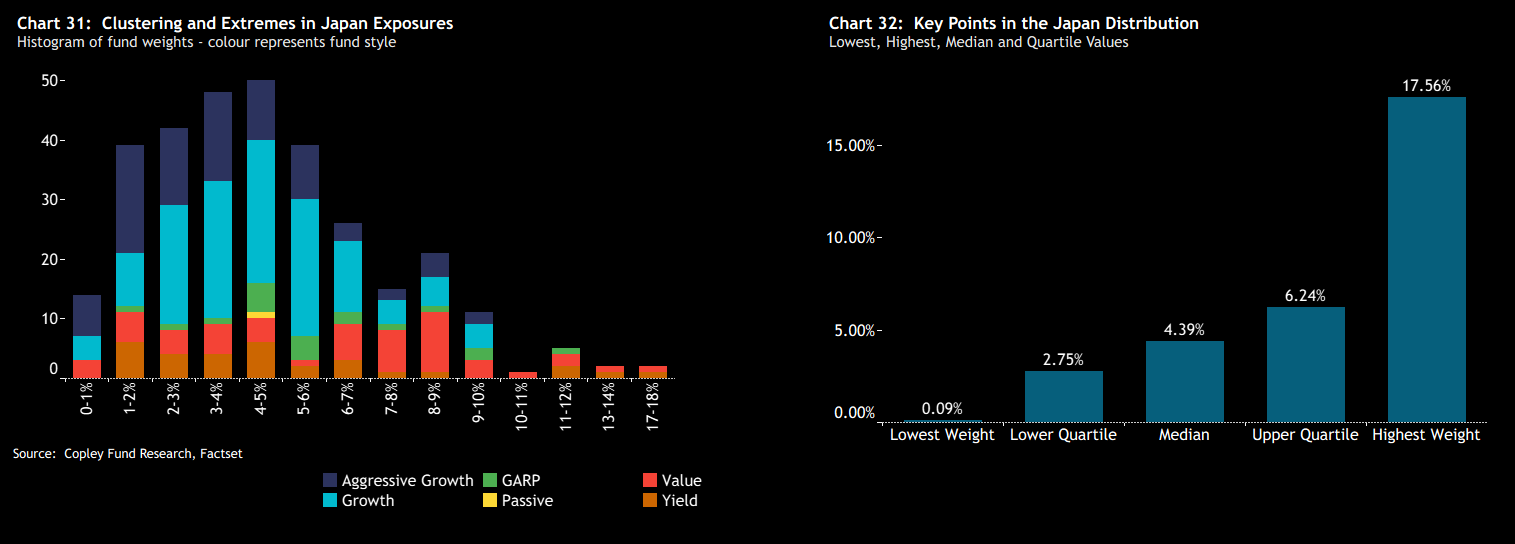
The distribution of Japan allocations across global funds (Chart 31) is centred between 1% and 6%, with relatively few funds holding positions above 10%. Those that do tend to have a Value or Yield orientation. Chart 34 further illustrates the skew: 75% of funds hold a Japan weight below 6.24%, with the largest single allocation topping out at 17.6%.
Japan’s Top Investors
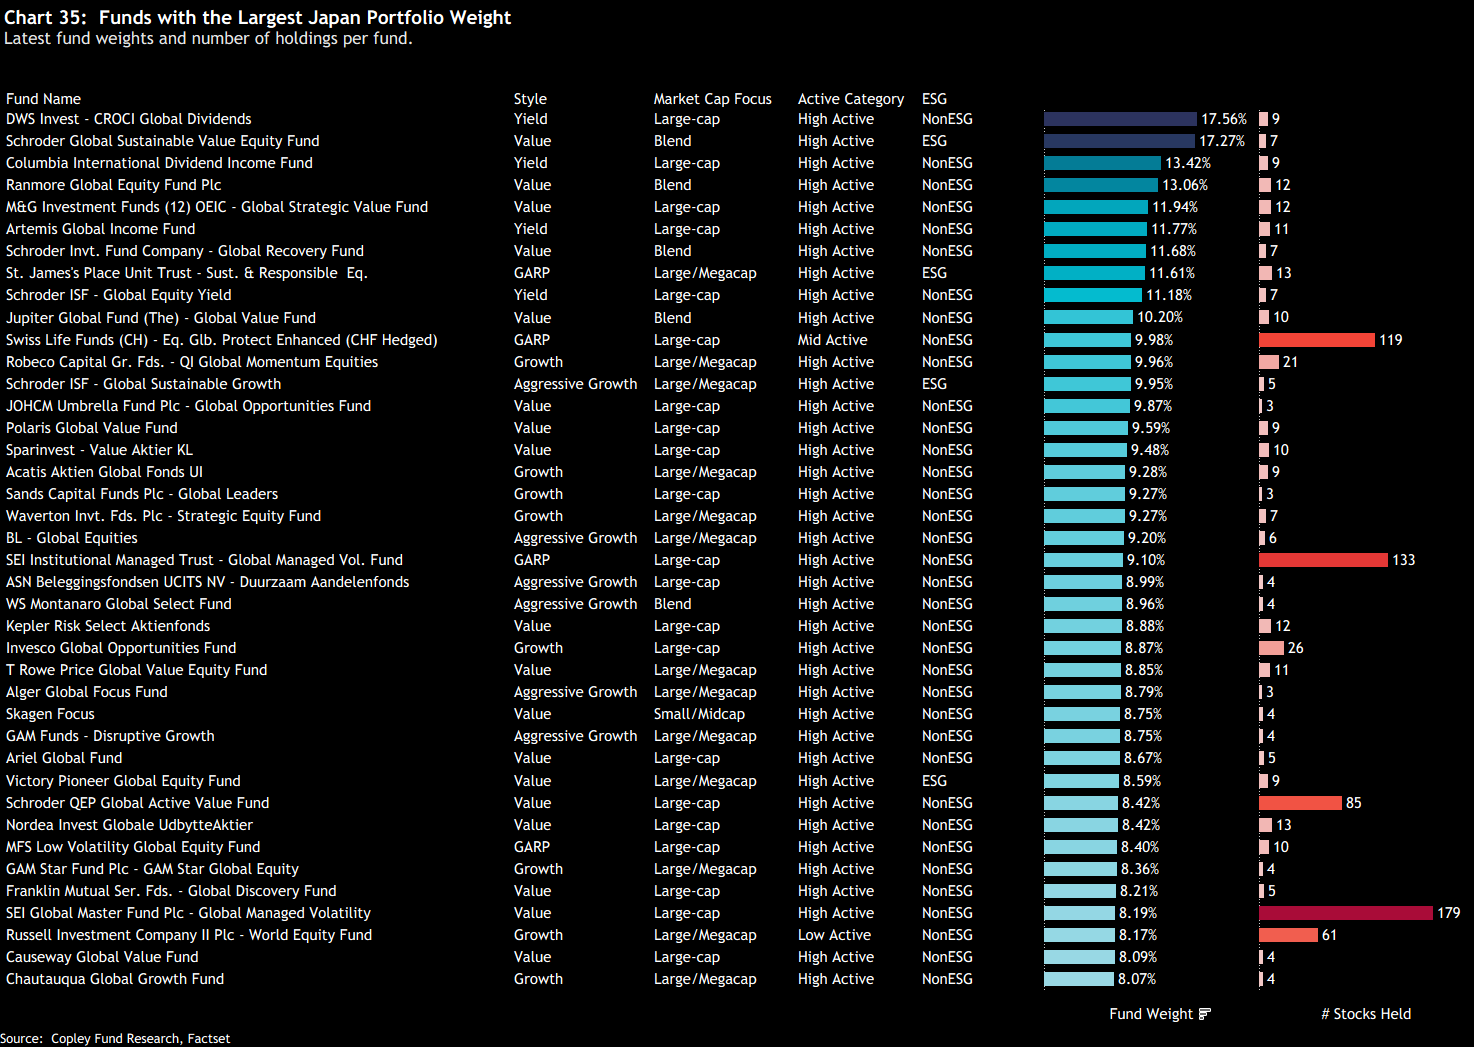
Chart 35 highlights the largest fund-level allocations to Japan. DWS CROCI Global Dividends and Schroders Global Sustainable Value lead the group, with weights of 17.6% and 17.3% respectively. They are followed by a cohort of Value and Yield-focused funds, each holding allocations above 10%.
Top holders typically maintain concentrated exposure, with 5 to 15 Japanese stocks in each portfolio. A few quant-oriented strategies are the exception, holding a broader basket of names.
Fund Rotation: Aggressive Growth Funds Active
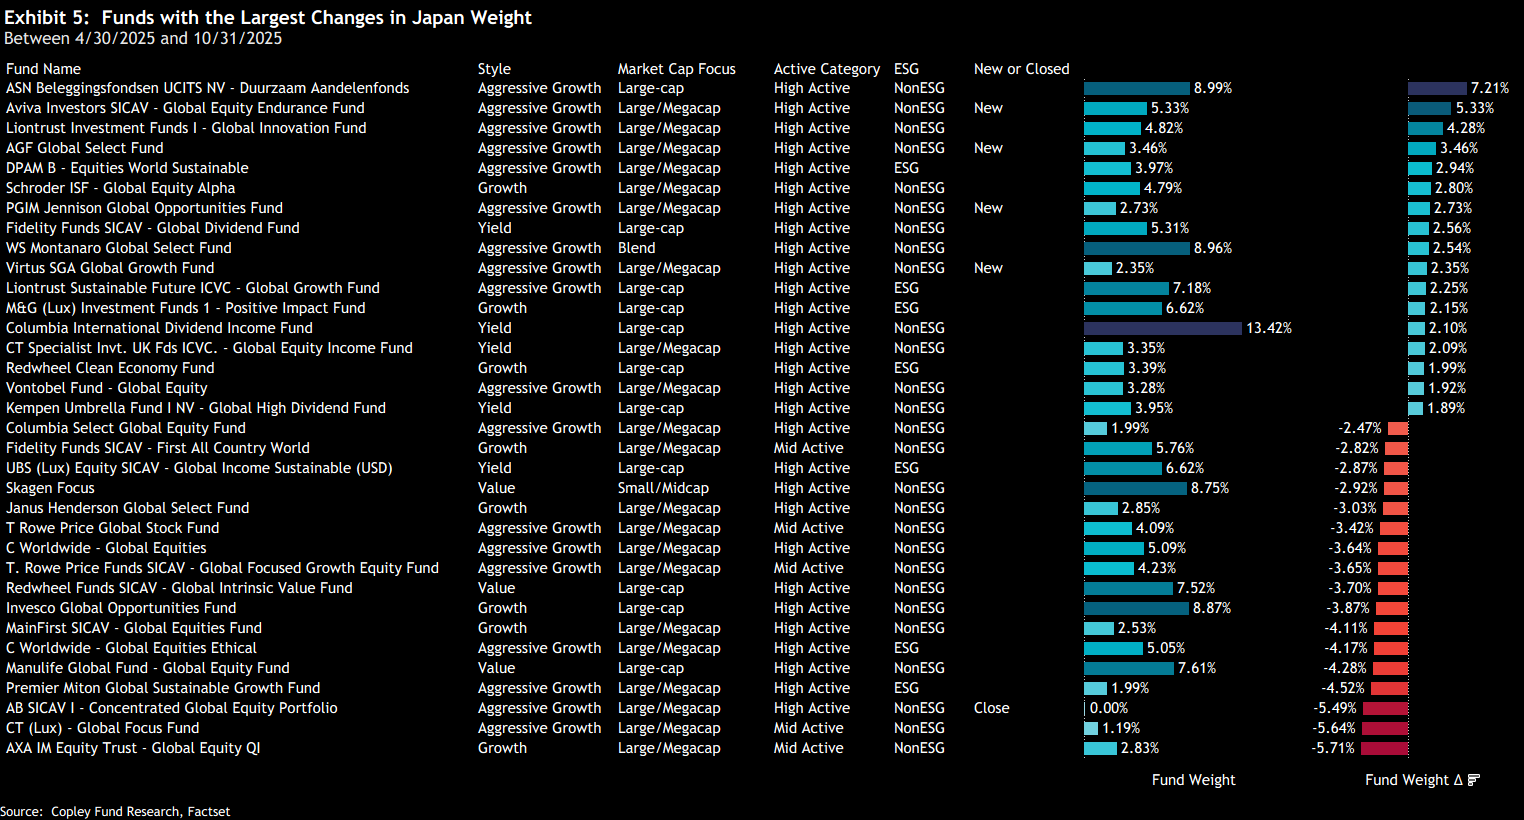
Over the past six months, six funds initiated exposure to Japan, led by Aviva Global Endurance (5.3%), AGF Global Select (3.46%), and PGIM Jennison Global Opportunities (2.73%). What stands out is the clear skew toward Aggressive Growth strategies among those increasing or establishing new positions.
Interestingly, this dynamic also holds at the other end of the spectrum. Several Aggressive Growth funds—including CT Global Focus, AB Concentrated Global Equity, and Premier Miton Global Sustainable—have sharply reduced or exited their Japan exposure. The message is mixed, but it’s clear that leadership and opportunity within high-growth strategies are in transition.
Japan’s Sector Positioning: Tech and Industrials Lead
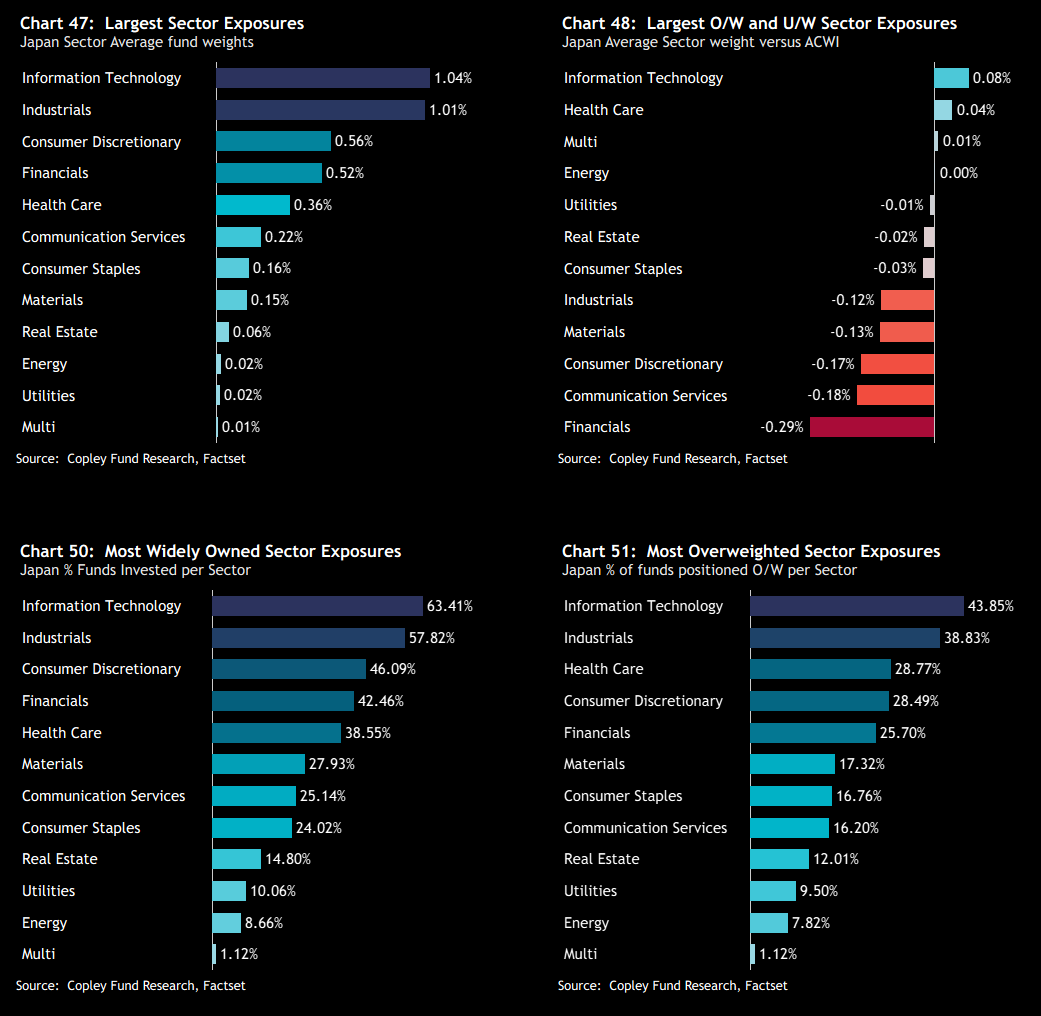
From a sector standpoint, Japan’s exposure within global funds is led by Information Technology and Industrials, each accounting for roughly 1% of total allocations. These are followed by smaller positions in Consumer Discretionary, Financials, and Health Care—together, the five sectors represent 85% of Japan’s aggregate weighting. Financials stand out as an area of low conviction. Despite their domestic importance, only 25.7% of global funds hold an overweight position in Japan Financials, resulting in a net underweight of -0.29% relative to the ACWI index.
Long-Term Sector Trends
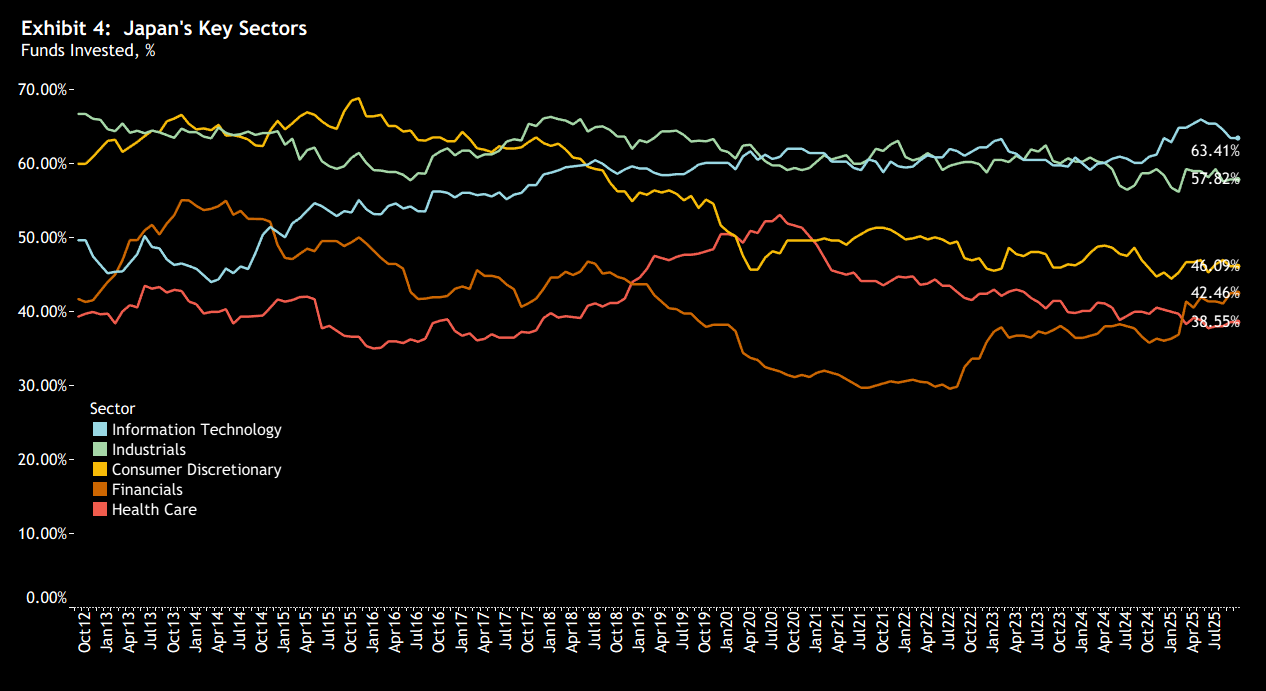
Exhibit 4 highlights the long-term trends in ownership among Japan’s key sectors. It shows the steady decline in fund ownership of Japan’s Consumer Discretionary sector. Once the most widely held sector in 2015—reaching nearly 70% of global funds—it is now held by just 46.1%. Taking its place are Information Technology and Industrials, with Tech overtaking as the most widely owned sector from early 2024 onward.
While Financials remain less widely held overall, they have been on a gradual recovery path and now exceed Health Care in ownership—a sector seeing a consistent exodus among active global managers.
Japan’s Stock Ownership Picture
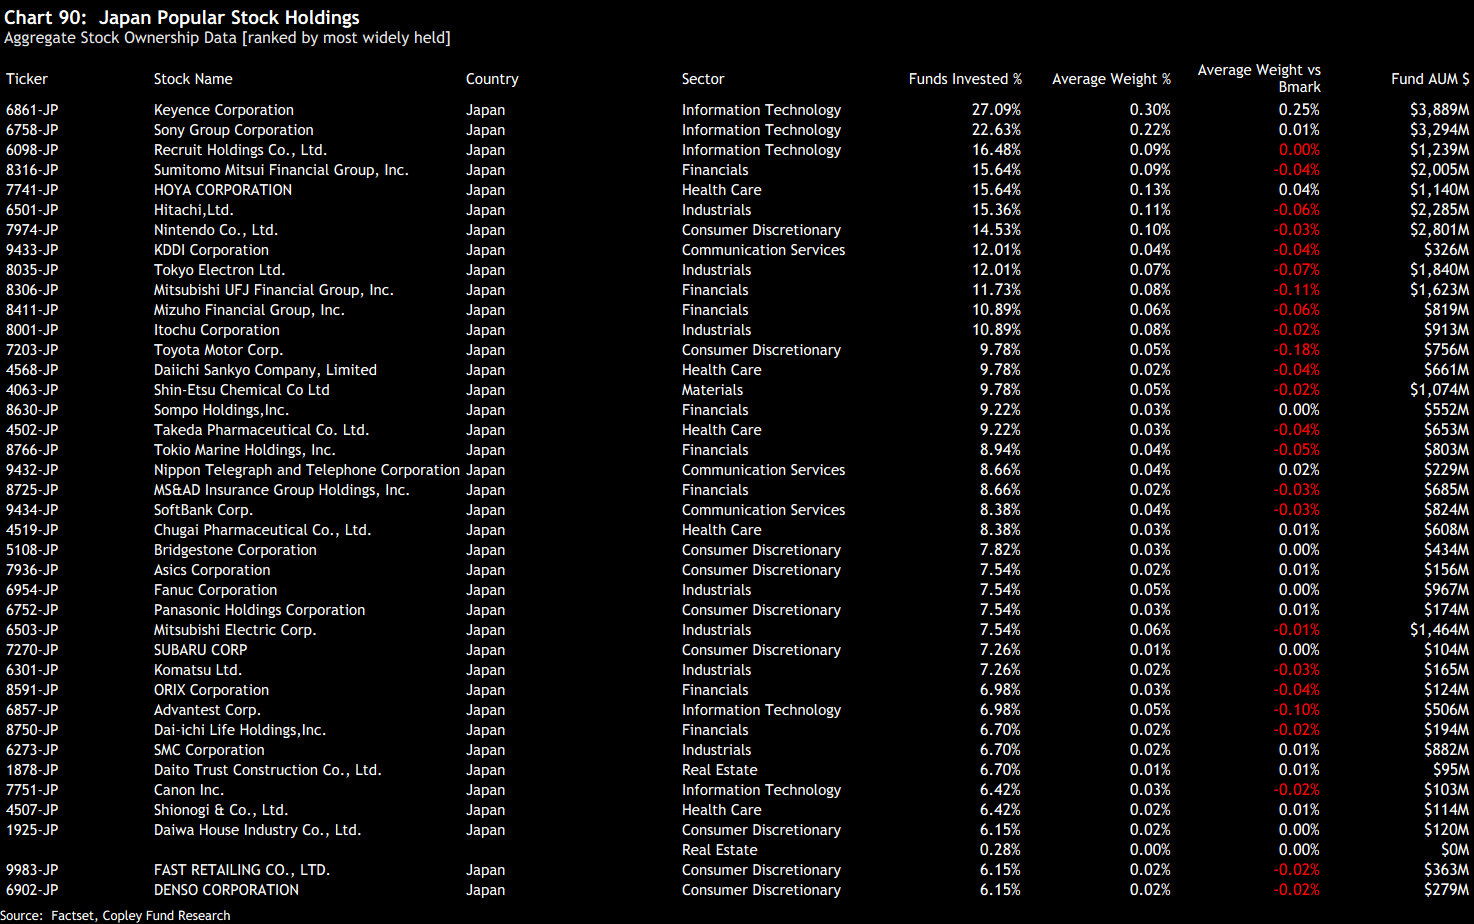
Despite being the fourth largest country allocation among global investors, stock-level ownership in Japan is relatively dispersed. Only two companies—Keyence Corp and Sony Group—are held by more than 20% of funds, with just 10 others owned by more than 10%. Keyence stands out as a notable overweight versus the benchmark, but overall, there are few true consensus positions.
Below the top names, the ownership curve flattens quickly: 228 Japanese stocks are held by just 1% to 10% of global funds. This paints a different picture to markets like the US, where holdings are far more concentrated—Microsoft, for example, appears in over 76% of global portfolios. In contrast, Japan shows a more fragmented profile, with relatively low overlap across funds and greater dispersion in positioning.
Japan’s Unloved Stocks
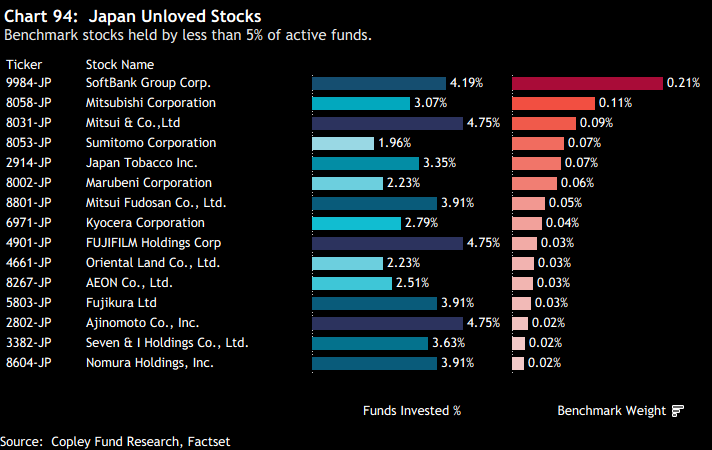
Chart 94 highlights a group of Japanese stocks that remain underrepresented in active global portfolios. These are names with a weight in the MSCI ACWI index but held by fewer than 5% of the active funds in our analysis.
SoftBank Group leads the list—owned by just 4.2% of funds despite a benchmark weight of 0.21%. These low-ownership names reflect areas where active managers are showing limited interest, even when benchmark inclusion might suggest otherwise.
Stock Rotation: Tentative Shifts in Ownership
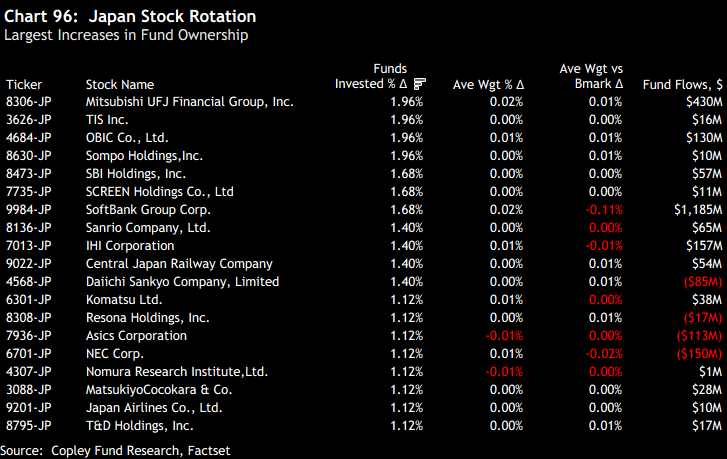
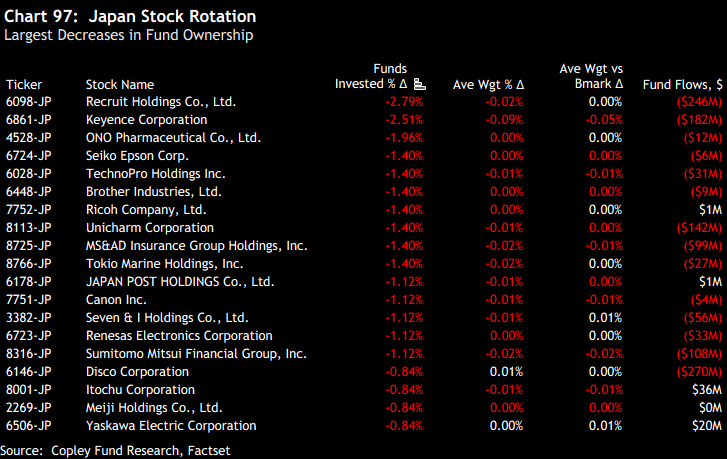
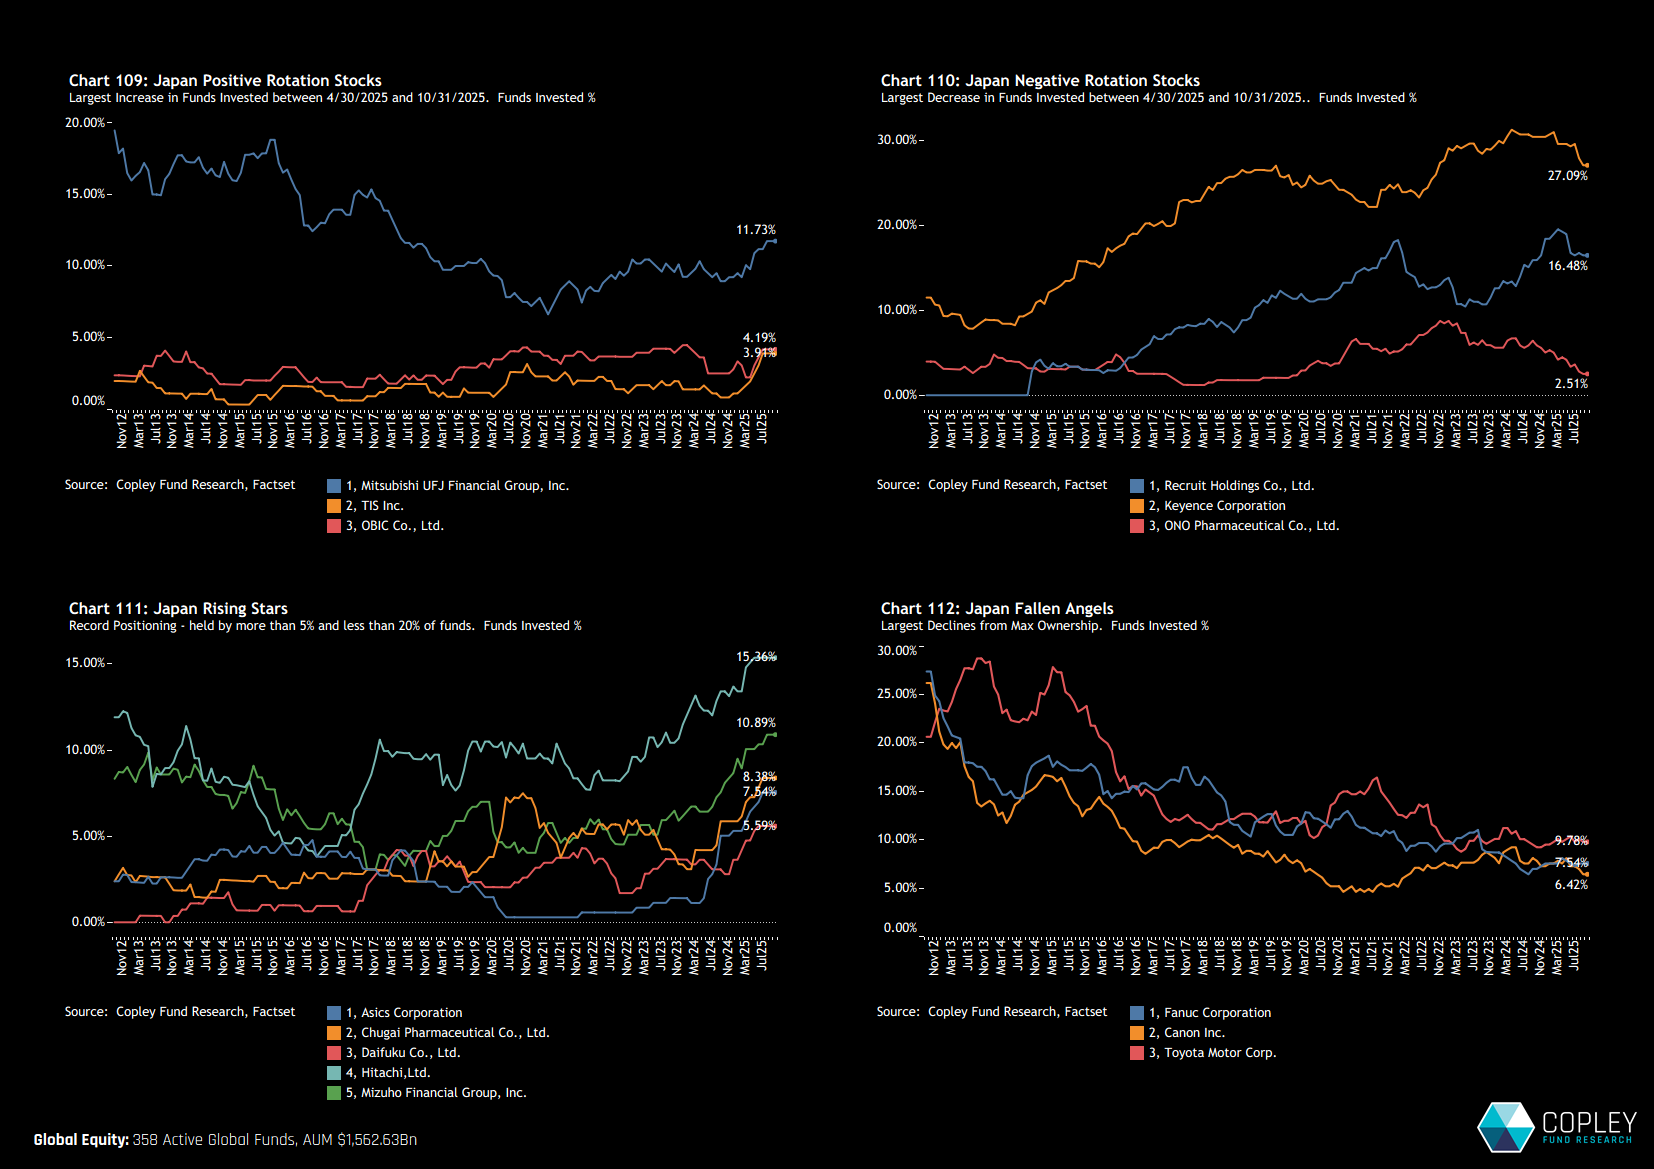
Over the past six months, rotation within Japanese equities has been modest. Four companies saw ownership rise by at least 2% of the funds in our analysis, led by Mitsubishi UFJ Financial, TIS Inc., and OBIC Co. On the other side, 2.8% of funds exited Recruit Holdings, while 2.5% reduced exposure to Keyence Corp. Overall, this measured activity reflects soft rotation rather than a decisive shift in sentiment. There is no clear evidence of a broad pivot in either direction.
The Largest Stock-Level Buyers and Sellers
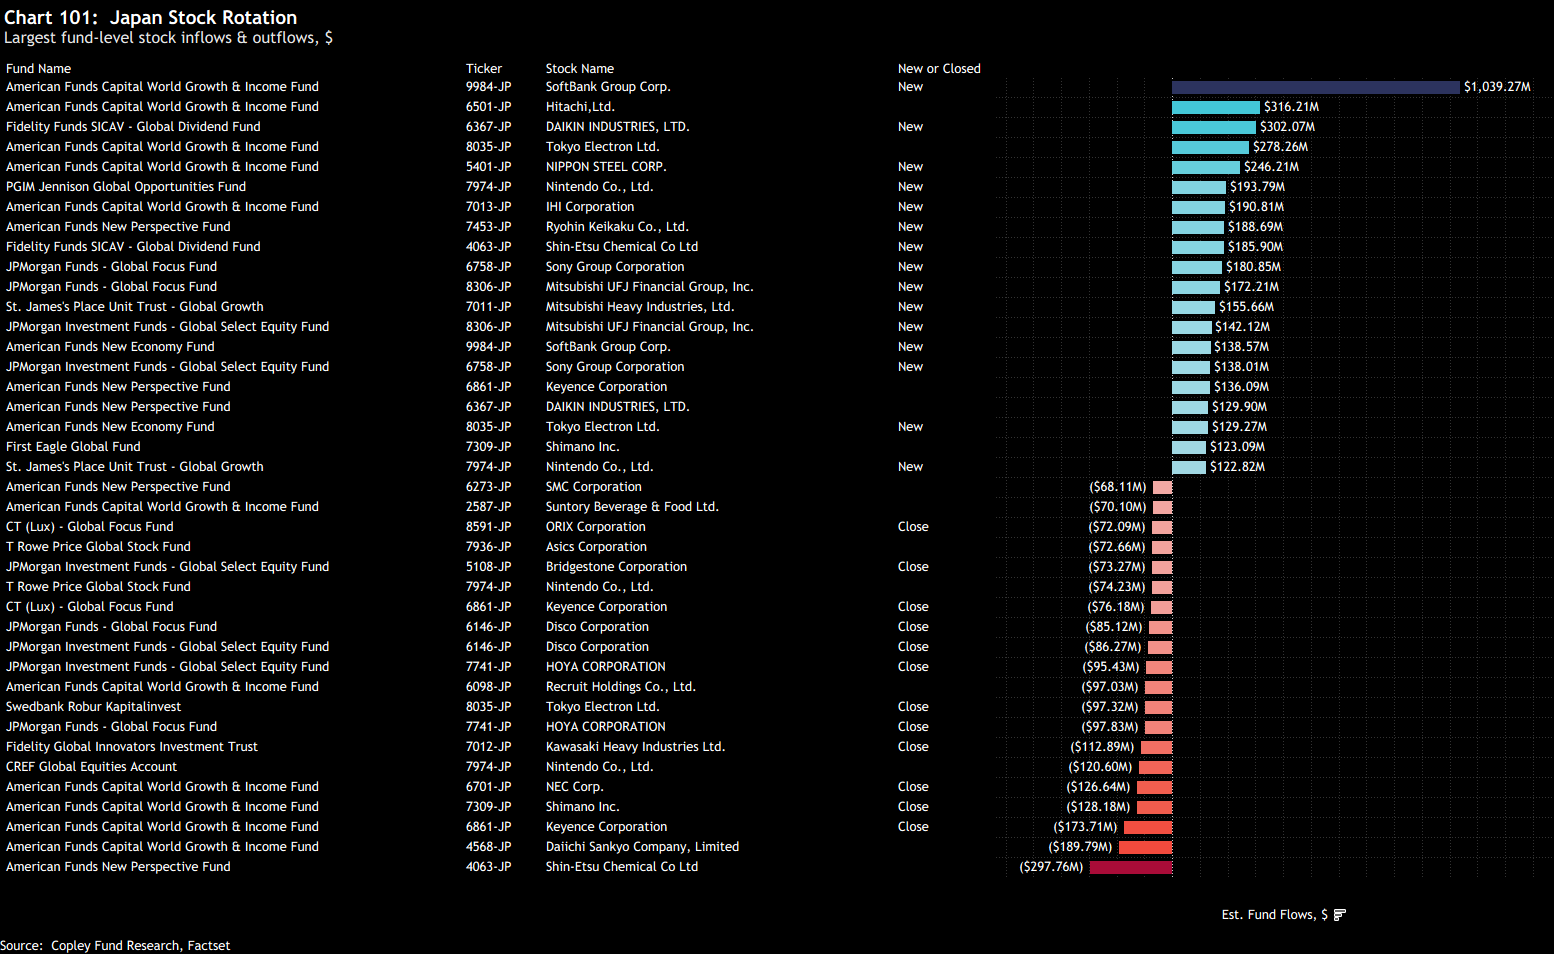
As shown earlier in Chart 18, Japan attracted strong net inflows from the global funds in our analysis. However, headline flow figures can be skewed by a handful of large strategies and may mask a more balanced picture at the individual fund level. That’s clearly the case here.
A significant share of the inflows came from Capital Group’s American Funds suite—particularly Growth & Income and New Perspective—which added meaningfully to positions in names such as SoftBank Group, Hitachi Ltd, and Tokyo Electron. At the same time, these strategies scaled back exposure to smaller holdings like Shin-Etsu Chemical and Daiichi Sankyo.
Stock Ownership Trends
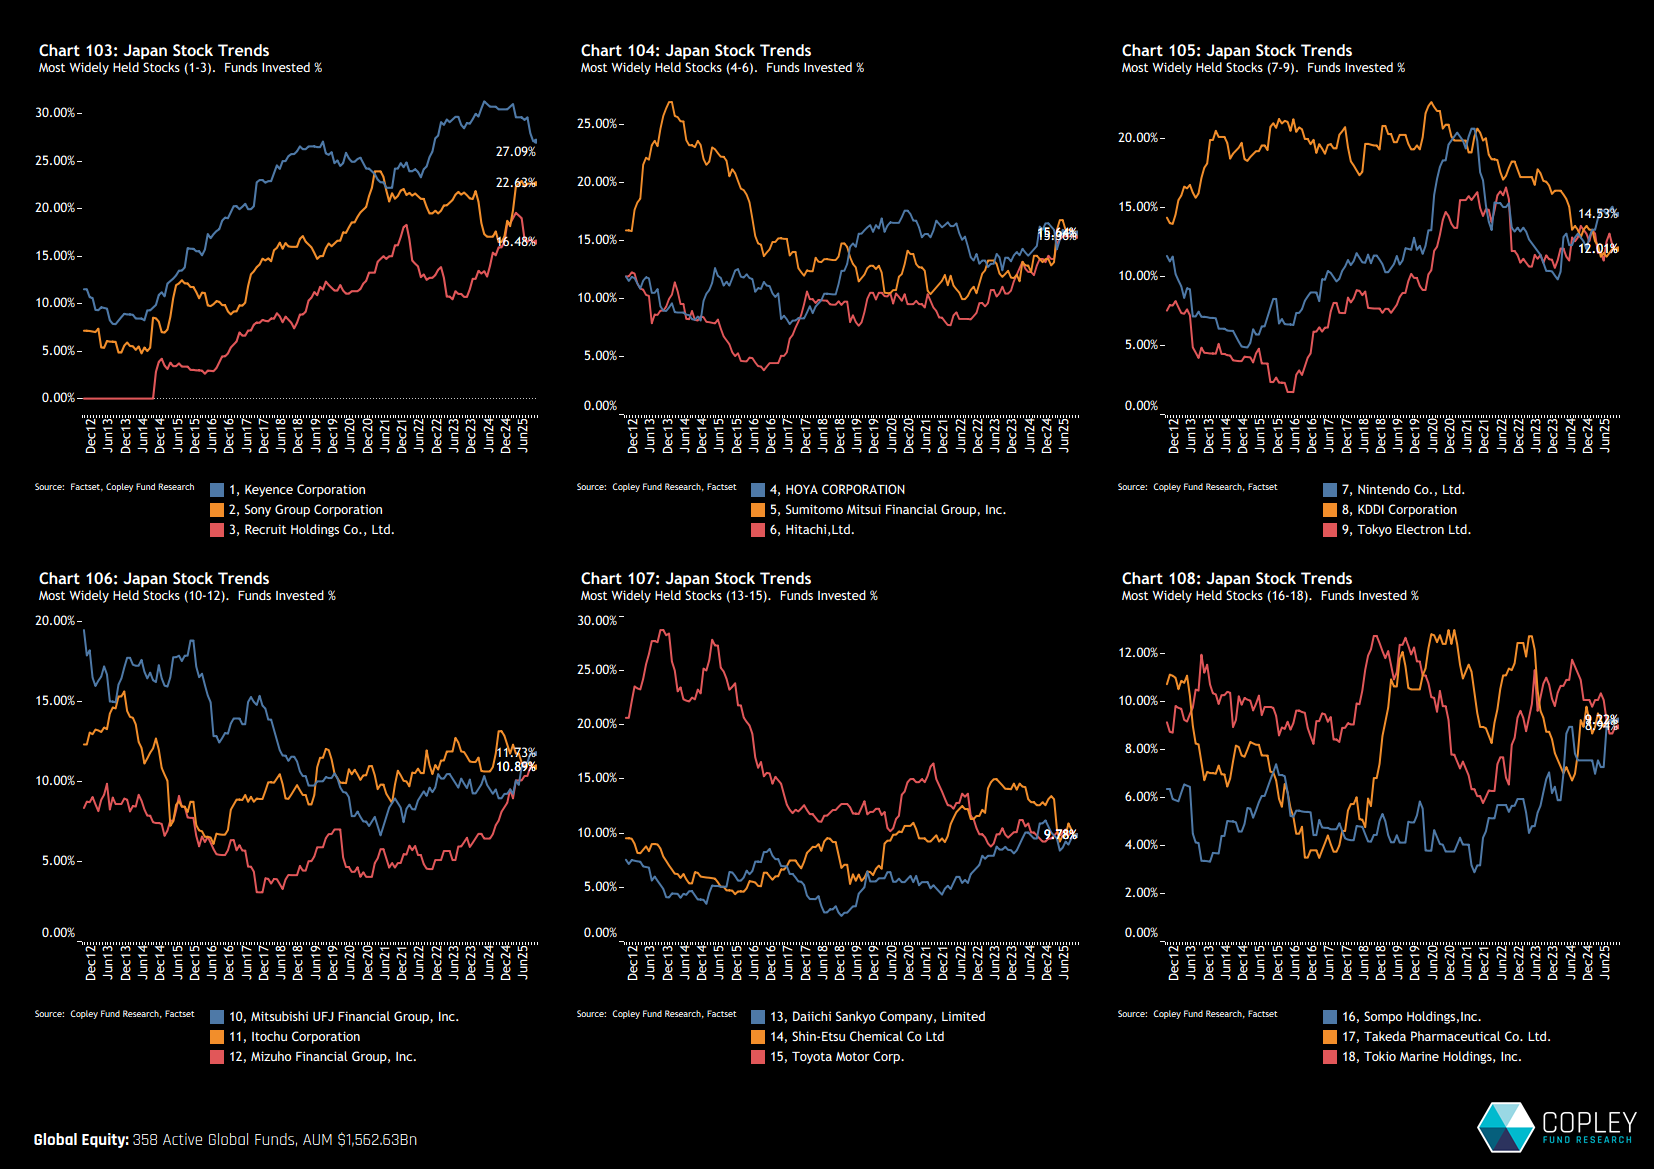
The six charts below track the evolution of fund ownership across the 18 most widely held Japanese stocks. Chart 103 highlights a notable divergence—Sony has seen a sharp increase in fund ownership, while Keyence has declined from previous highs.
Chart 104 shows a steady climb in ownership of Hoya Corp, Sumitomo Mitsui Financial, and Hitachi, pointing to growing institutional interest. Other notable moves include a sharp drop in KDDI positioning, a rise in Mizuho Financial ownership, and a recovery in exposure to Nintendo.
Selected Stock Highlights
Chart 109 highlights the stocks seeing the strongest six-month rotation into active global funds. Mitsubishi UFJ Financial has reached its highest ownership levels in seven years, while TIS and OBIC Co. appear to be in the early stages of building a global investor base. In contrast, Recruit Holdings, Keyence Corp, and ONO Pharmaceutical have seen meaningful declines—most notably ONO, which has almost faded from the picture entirely.
Chart 111 identifies five stocks where fund ownership is at record highs but still remains below 20% of the universe. These names may warrant close attention, combining upward momentum with substantial headroom for broader adoption. Hitachi and Mizuho Financial stand out here.
Lastly, Chart 112 illustrates the continued decline in ownership of Toyota Motor Corp, Fanuc, and Canon Inc.—once core holdings, now steadily retreating from the global fund landscape.
Can Japan Push on from here?
With Japan’s major equity indices breaking above multi-decade highs, we might have expected a decisive shift in global fund positioning. But while ownership is rising in absolute terms, the overall picture remains measured. There’s little evidence of aggressive rotation—whether at the sector level or in terms of standout individual stock flows. From a positioning standpoint, the mood is cautious rather than euphoric.
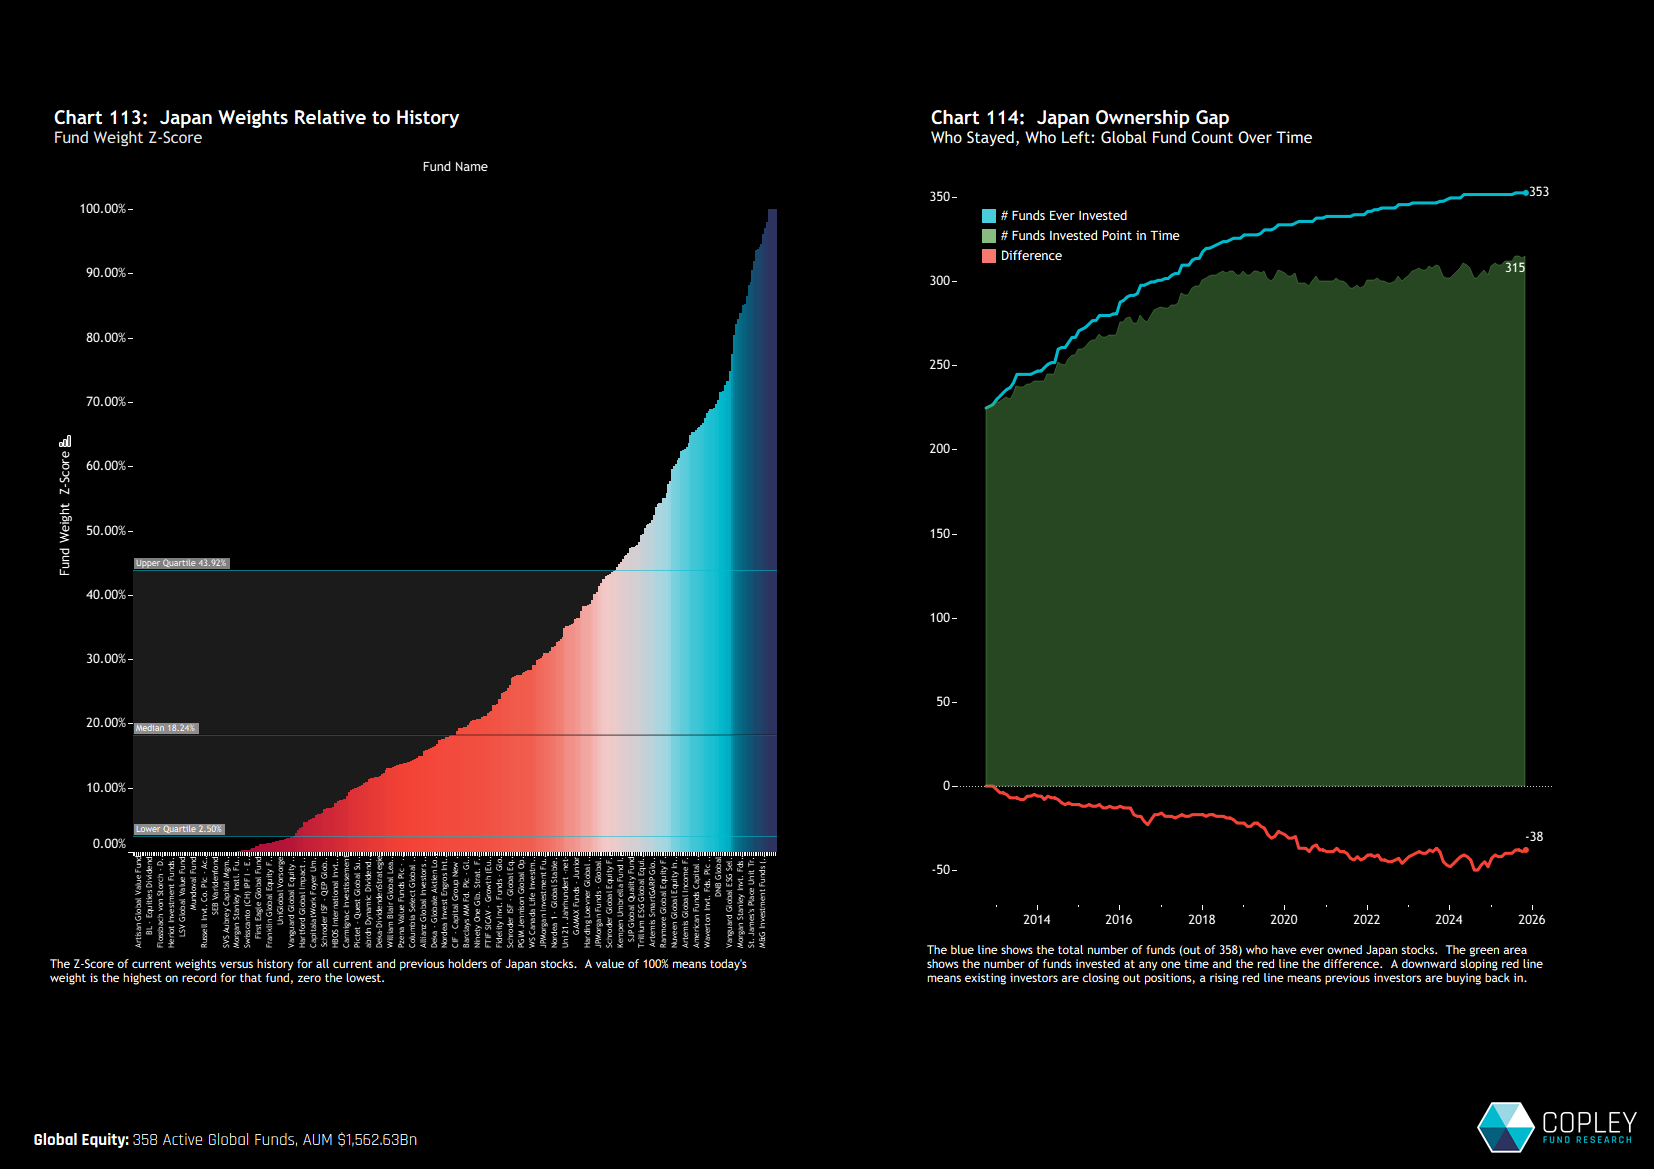
Viewed through a historical lens, current allocations remain subdued. A decade ago, aggregate fund weights in Japan frequently exceeded 7%, and individual fund-level exposures were meaningfully higher. Today, they sit well below those previous peaks. Chart 113 illustrates this clearly: the Z-score of current Japan weights across our fund universe places 50% of funds in the 18th percentile relative to their own historical positioning. Moreover, 75% of funds are currently running Japan allocations below their long-term median exposure.
Chart 114 adds another layer, showing the cumulative number of funds entering or exiting Japan since 2012. Of the 353 global funds that have invested in Japan over that period, only 315 are currently active in the market. The upward slope of the red line reflects a steady re-entry—but also highlights how many funds had exited altogether, and are only now starting to return.
In short, Japan’s positioning story is flatter than the market price action might suggest. There are signs of moderate re-engagement—particularly among Value-oriented strategies, with Aggressive Growth managers selectively adding exposure. But this is far from a wholesale pivot. Active investors are approaching with caution.