Active Global Funds: Performance & Attribution H1 2026
July 20th 2026
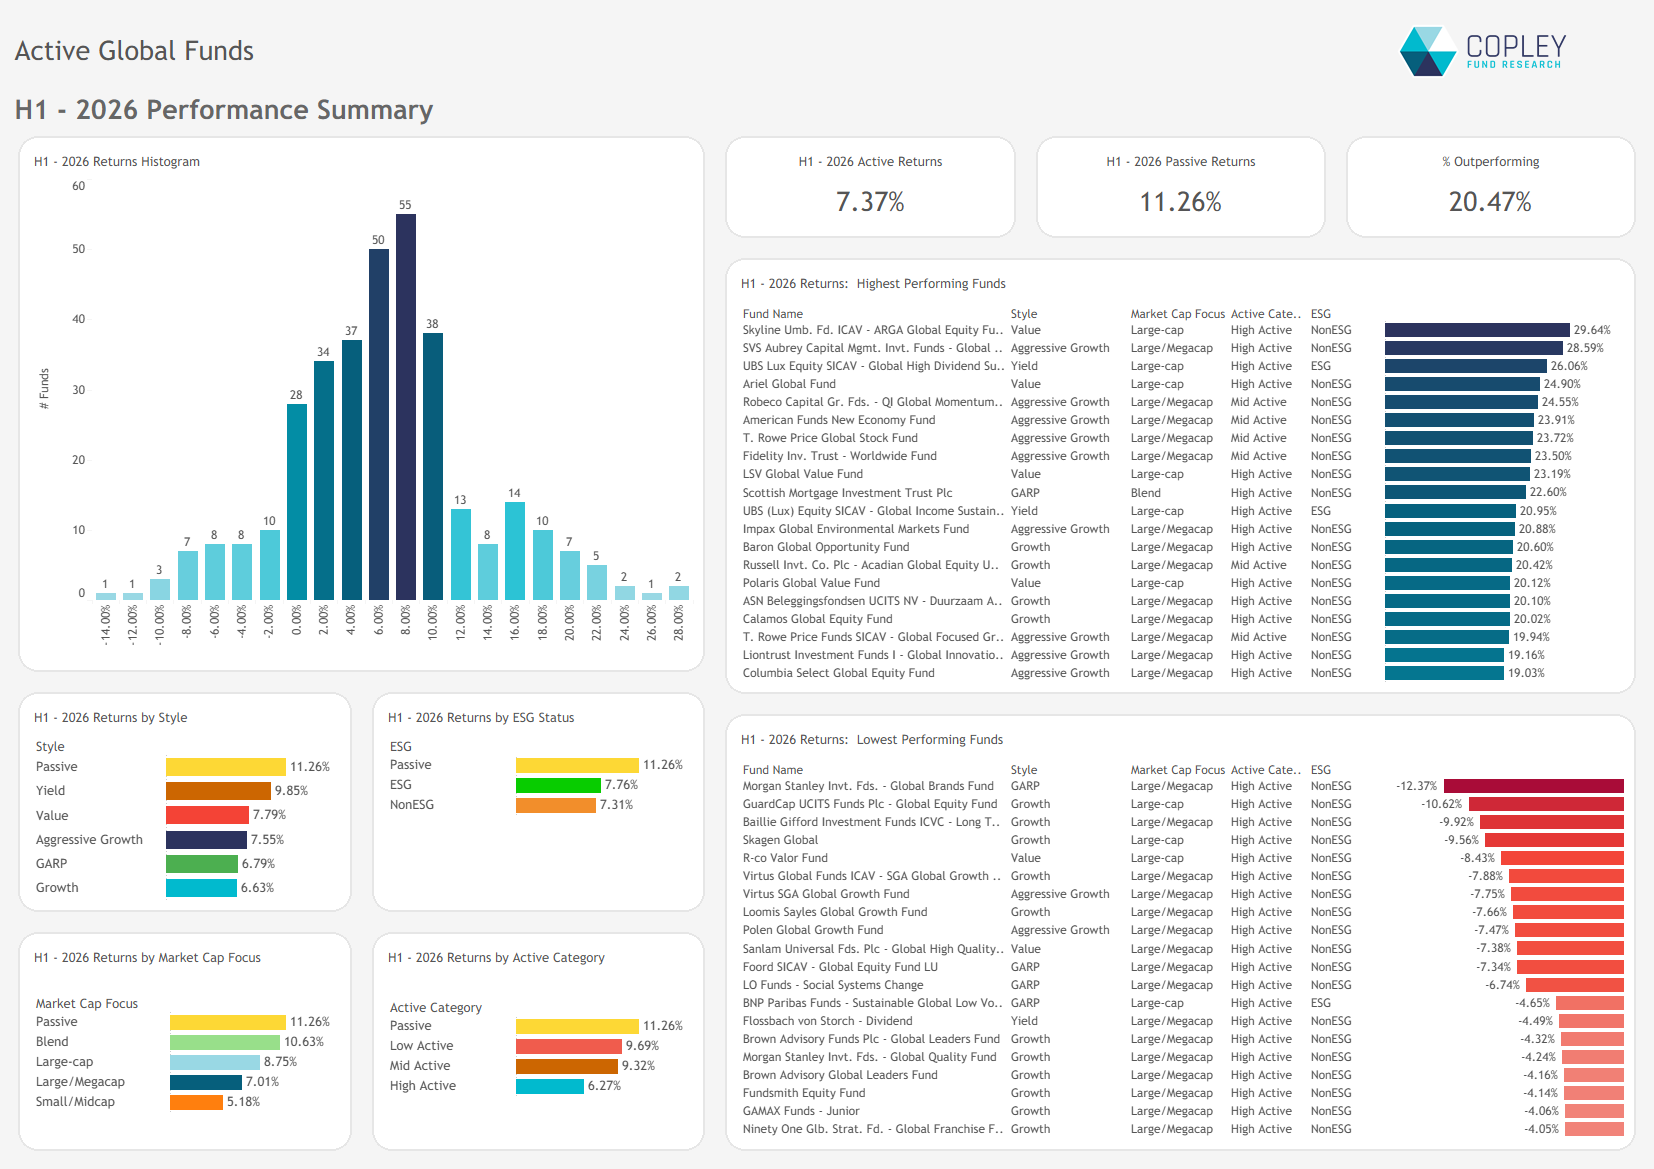
Active Global funds underperformed the MSCI ACWI benchmark by 3.87% in the first half of 2026, with fewer than one in five managers outperforming the index.
US Technology remained the dominant source of relative underperformance, with stock selection proving a far greater headwind than sector allocation.
A small number of AI-led winners drove index returns, reinforcing the challenge for active managers attempting to outperform increasingly concentrated market-cap weighted benchmarks.
Another Difficult Quarter Active Global funds compounded their Q1 underperformance in Q2, lagging the SPDR ACWI benchmark by a further 2.1% over the quarter and taking first-half relative performance to -3.87%.
Absolute returns of 7.37% will still have pleased investors. However, only 20.5% of funds outperformed the index, highlighting another difficult period for active management. High Active funds (Active Share >75%) fared worst of all, delivering the weakest relative performance across the benchmark independence categories.
At the other end of the spectrum, the top-performing funds comfortably outpaced the benchmark. ARGA Global Equity, Aubrey Global and UBS Global High Dividend each returned more than 25% during the quarter.
At the style level, Yield funds came closest to matching the benchmark, delivering an average return of 9.85% over the first half. Growth was the clear laggard, returning just 6.6% on average.
Technology Drives Returns
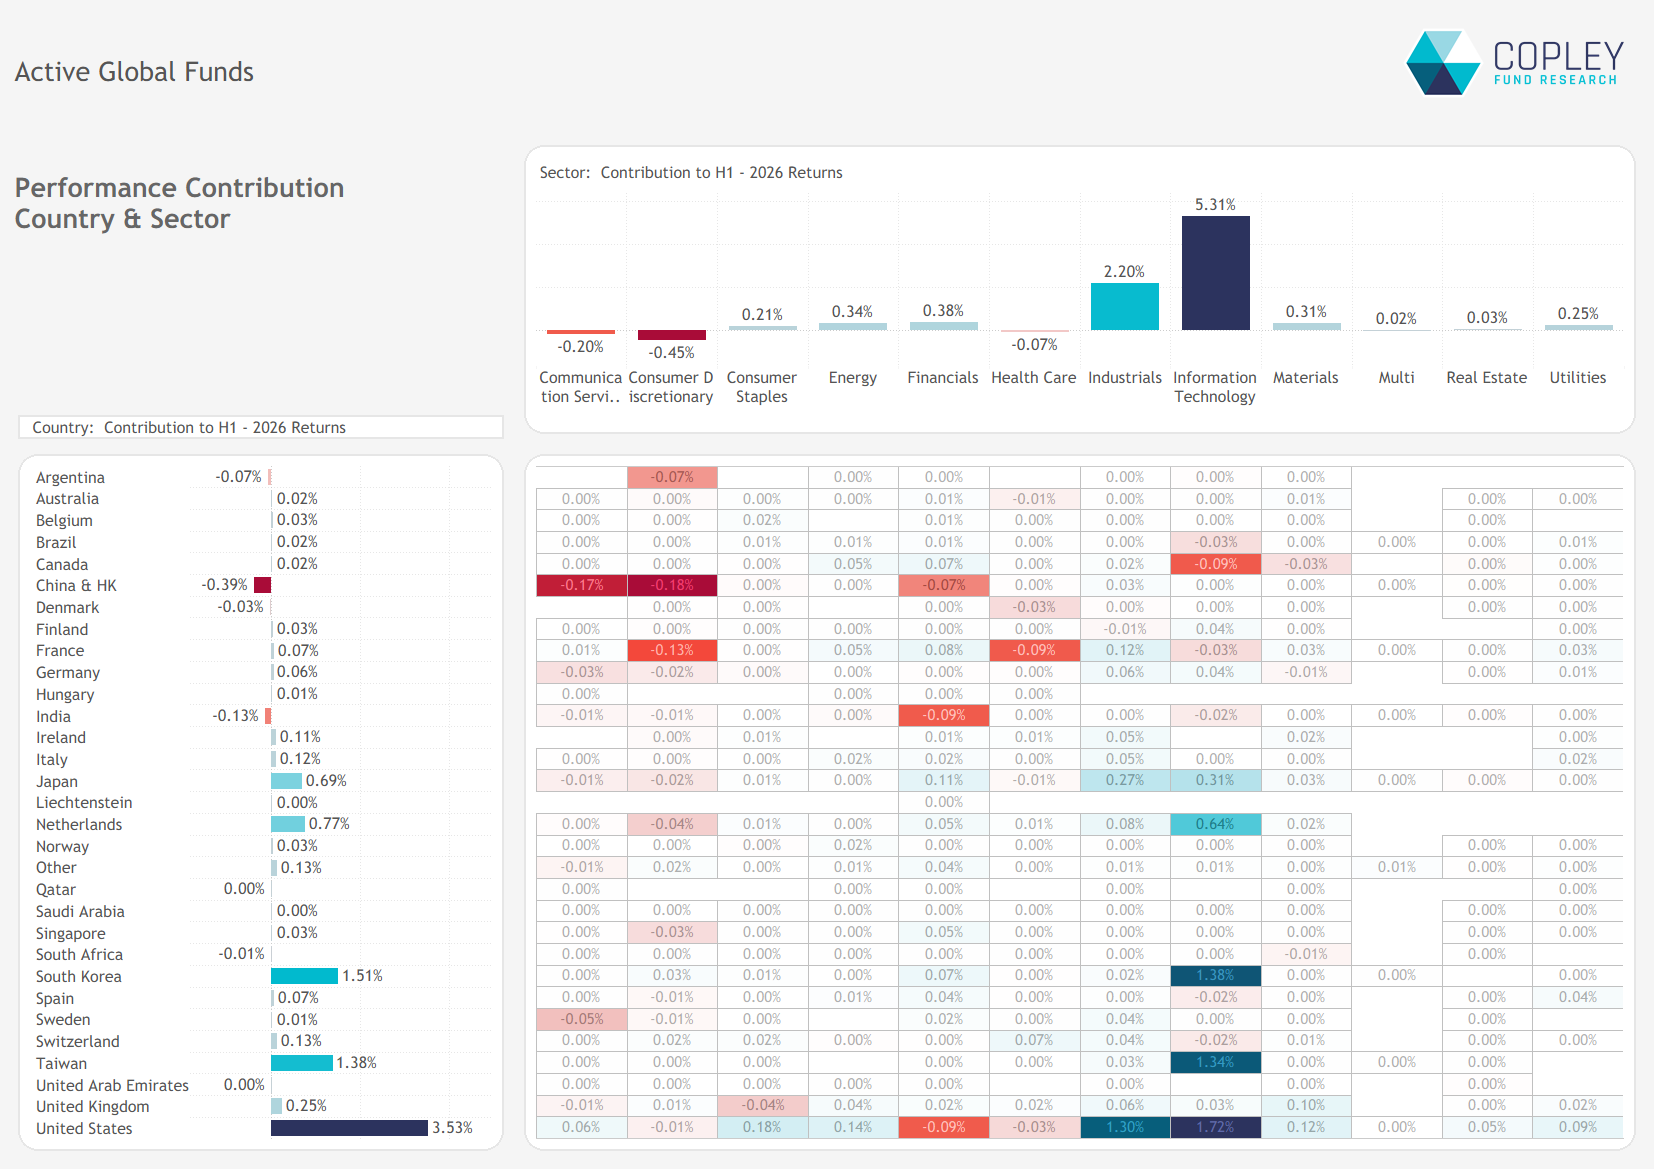
The charts below break down first-half return contributions by country and sector, based on aggregate manager holdings.
At the sector level, Technology was the dominant contributor, adding 5.3% to six-month returns. Strong gains from Industrials provided further support, while contributions from most other sectors were relatively modest.
At the country level, the USA, Taiwan and South Korea were the principal contributors, supplemented by smaller gains from Japan and the Netherlands. Technology accounted for the majority of returns in each market, while in the US, Industrials also made a meaningful contribution.
The largest country-level detractor was China & Hong Kong, where Communication Services, Consumer Discretionary and Financials all weighed on performance.
Performance Attribution – Where Funds Lost Ground to the Benchmark
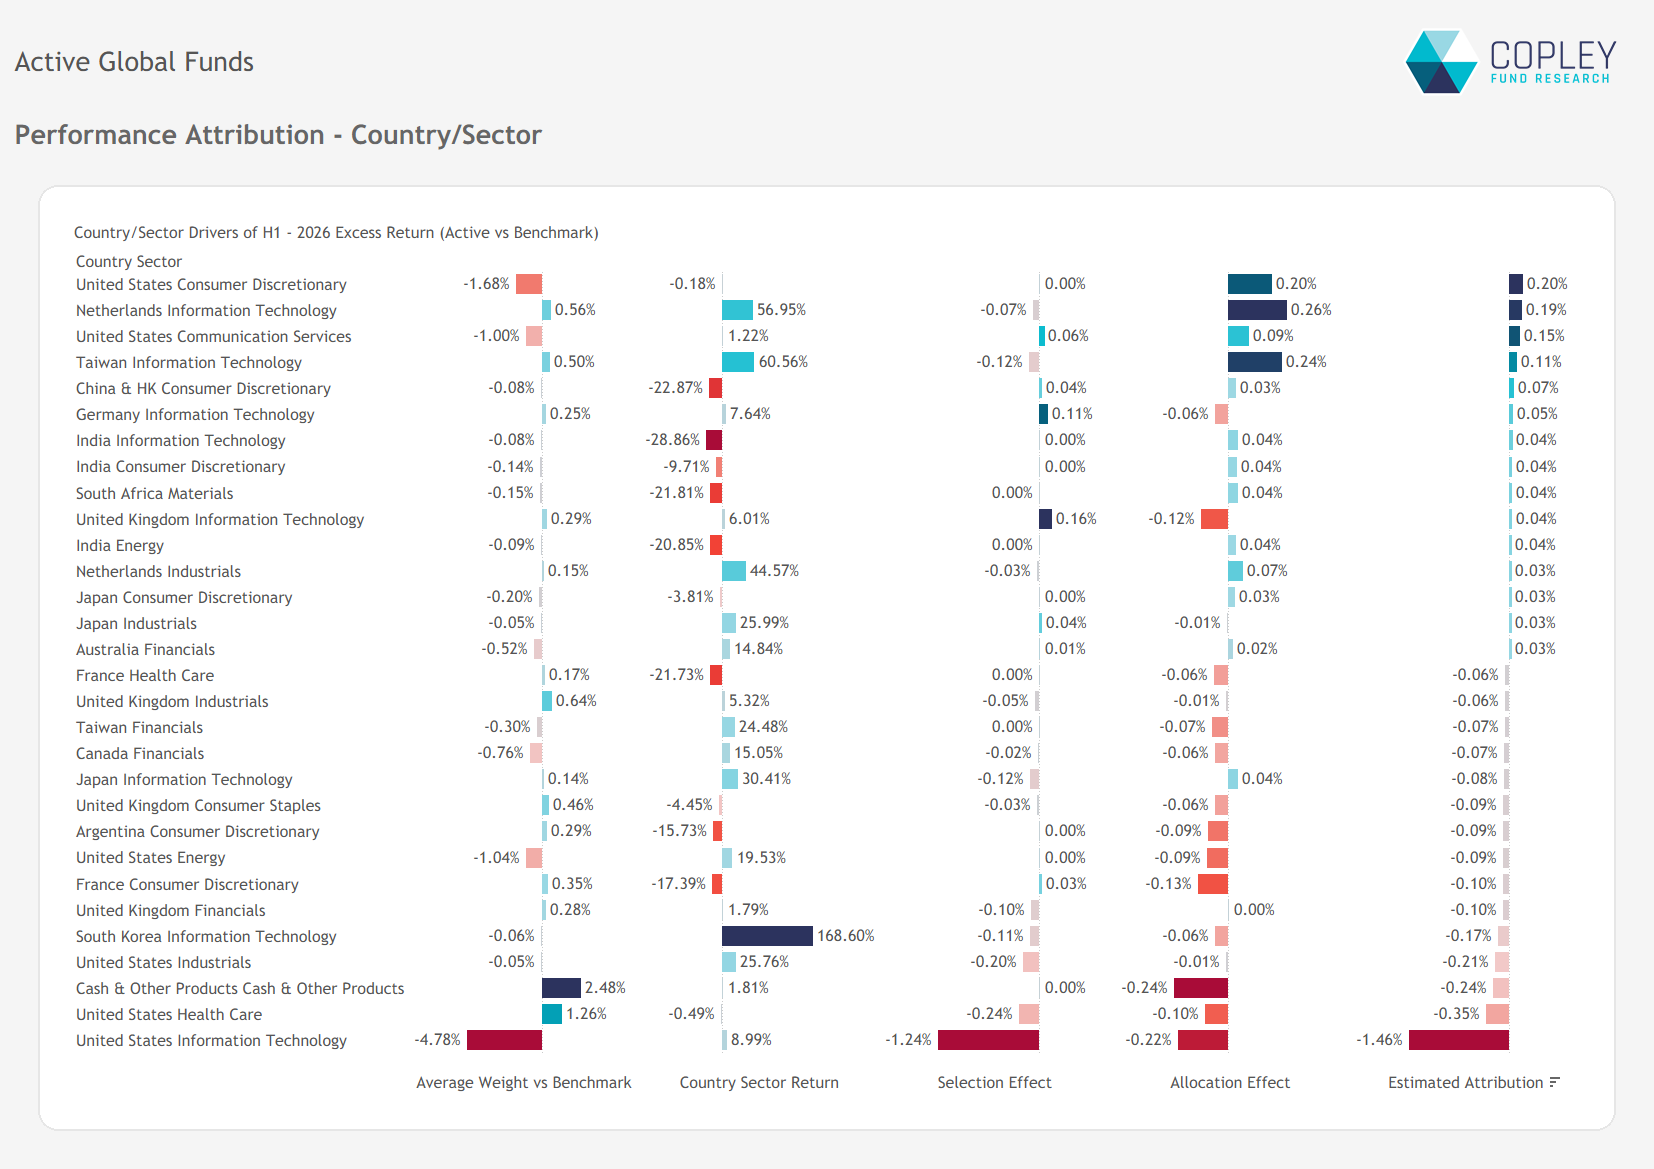
The chart below decomposes relative performance by country and sector, highlighting the principal sources of active managers’ underperformance versus the benchmark.
The most striking feature is the contribution from US Technology. At the allocation level, an average underweight of almost 5% detracted 0.22% from relative returns. The far greater impact however, came from stock selection, where managers gave up a further 1.22% on average through stock selection and position sizing within the sector.
These losses were only partially offset elsewhere. Modest gains from underweights in US Consumer Discretionary and US Communication Services, together with overweights in Dutch Technology, were insufficient to compensate for the drag from US Technology.
Stock Attribution
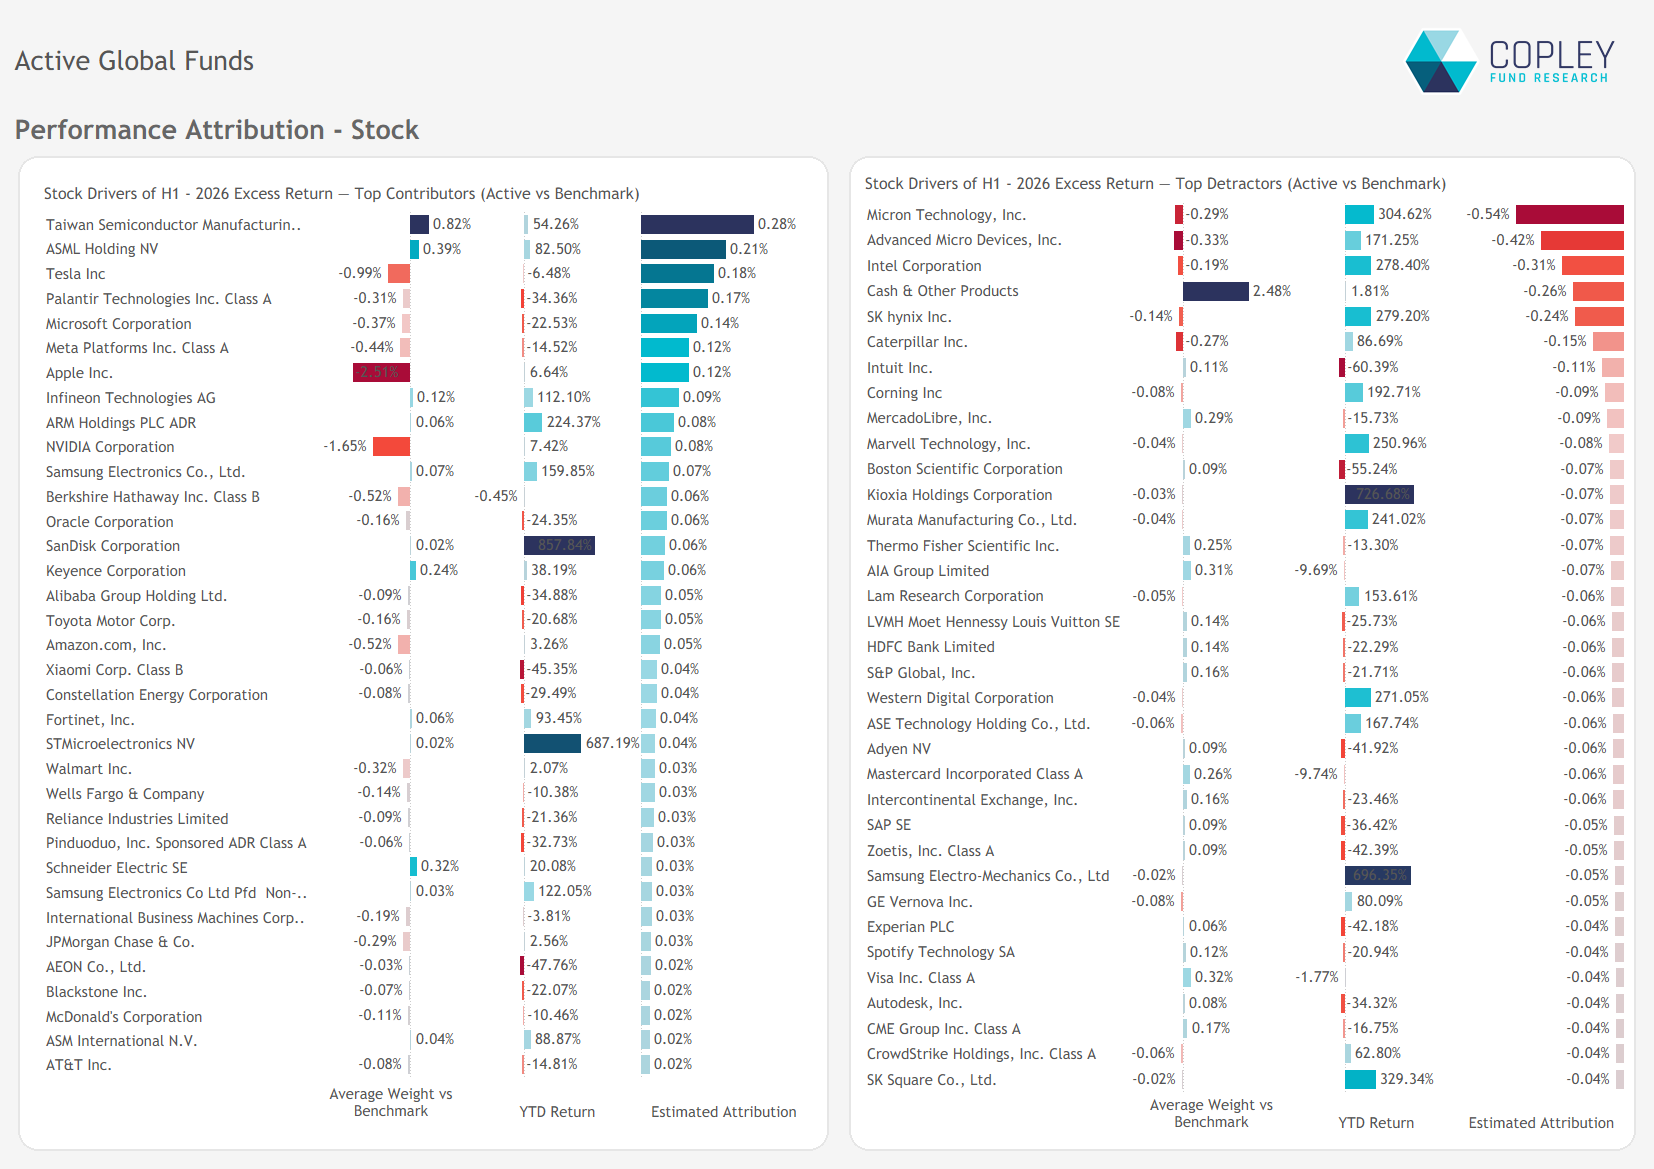
At the stock level, four companies accounted for a large proportion of active managers’ relative underperformance. Underweights in Micron Technology, Advanced Micro Devices, Intel and SK Hynix combined to detract around 1.5% from relative returns.
The result highlights one of the challenges of today’s market leadership. When a small number of AI-related beneficiaries double or triple in value, momentum-weighted indices capture the full upside, leaving even modest underweights costly.
Unfortunately for active managers, their largest overweight positions failed to offset those losses. TSMC and ASML returned an impressive 54% and 82% respectively, but not enough to compensate for the gains in the names they were underweight. Underweights in Apple and Tesla recovered some ground, although cash holdings, underweights in Caterpillar and overweights in Intuit largely offset those gains.
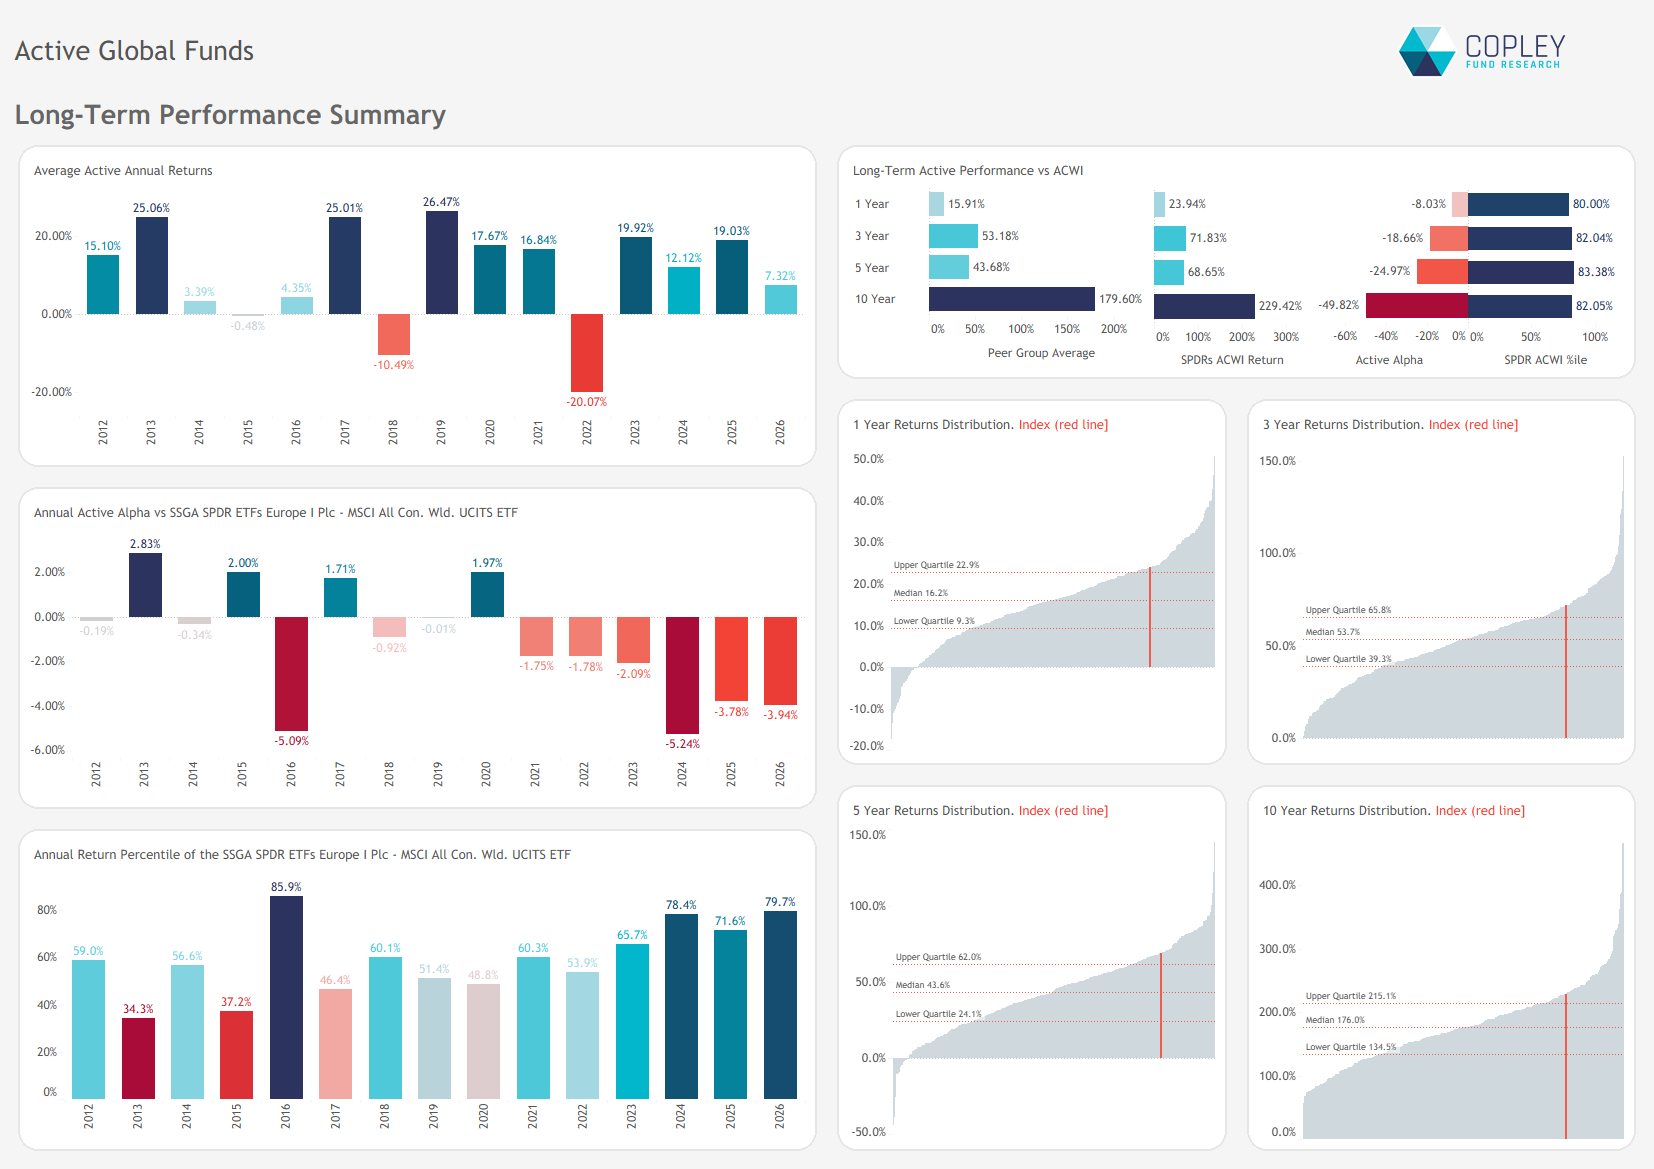
Long-Term Performance This quarter’s weakness extends a prolonged period of underperformance for Global active funds versus the MSCI ACWI Index. Six consecutive years of lagging returns now appears increasingly likely, with the SPDR ACWI ETF ranking around the 80th percentile of active peers in 2026 year-to-date.
The more important question is where active management goes from here. US Technology has been the defining source of underperformance for several years, raising the question of whether maintaining a meaningful underweight remains the right strategy. In a market where a handful of stocks can double or triple in value, even small underweights can prove costly, particularly when market-cap weighted indices automatically capture the full benefit.
For those managers delivering genuine outperformance in today’s market, the achievement is becoming increasingly noteworthy. With the benchmark proving so difficult to beat, sustained excess returns are arguably more valuable than they have been for many years.
Performance & Attribution Report
Click the link opposite for full charts and data detailing the drivers of H1 2026 performance, along with a review of 3-, 5-, and 10-year results across the active Global peer group.