The Materials sector is beginning to show signs of a meaningful turnaround within the GEM fund universe. Long overlooked and under-owned, it now stands out on our Ownership Cycle Grid as a rare case of low positioning combined with the strongest positive rotation of any sector over the past six months. While average active weights remain modest, they’ve started to recover from record lows, with broader fund participation and a narrowing net underweight suggesting that sentiment is beginning to shift.
This recovery is being driven in large part by renewed interest in China & HK and South African Materials, which have seen some of the sharpest increases in both participation and capital inflows. At the stock level, the rebound is visible in names like Gold Fields, Zijin Mining, and Anglo American, while a group of lightly held “rising stars” is starting to gain traction. Overall, sector exposure remains moderate, leaving clear room for allocations to catch up with other areas of the market — and potentially marking the early stages of a broader rebuild in Materials.
Click on the Report Link below for access to the latest EM Materials Market Intelligence Report.
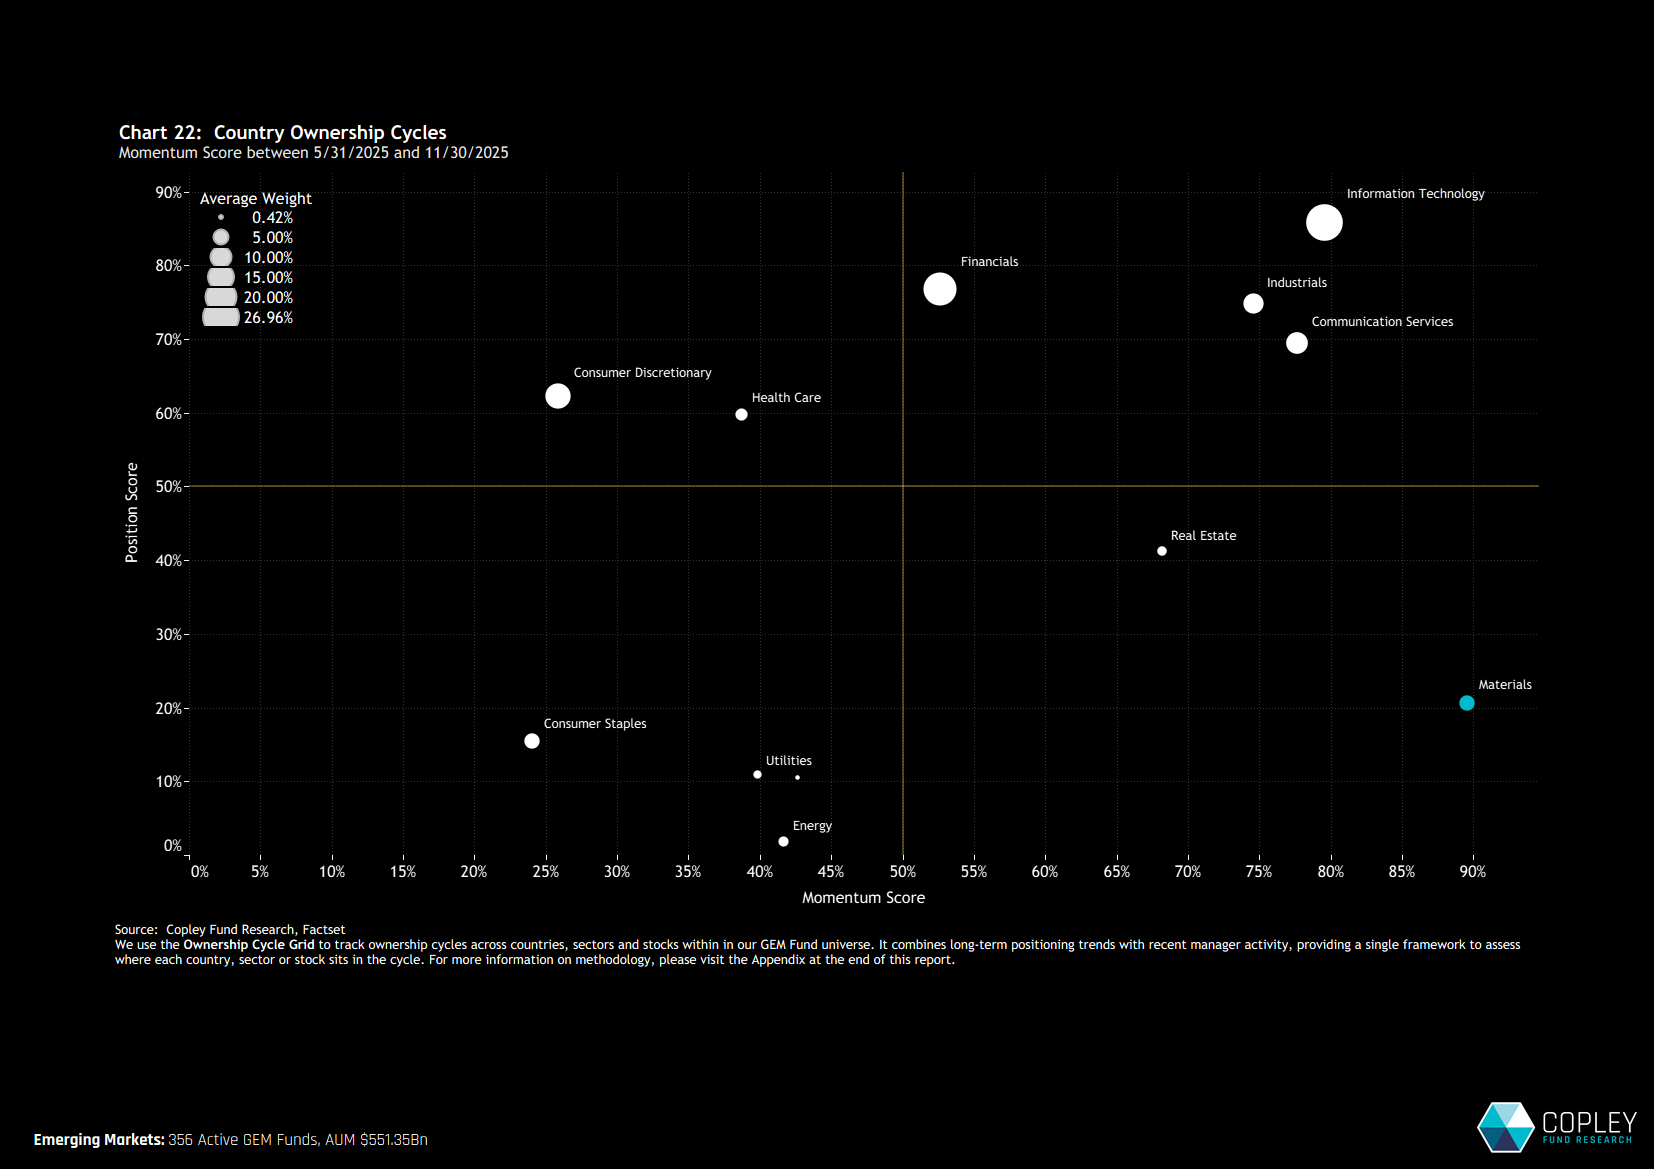
Sentiment Beginning to Turn Firstly, why are we focusing on the Materials sector at all this month? The starting point is our Ownership Cycle Grid — a framework designed to track where each country, sector, or stock sits in its positioning cycle. By combining long-term fund allocations with recent rotation trends, the Grid helps flag areas where sentiment may be turning. In this case, Materials stand out clearly in the bottom-right quadrant: a space typically associated with recovery candidates. Current positioning remains low, but the sector has seen the strongest positive rotation across our entire GEM fund universe over the past six months.
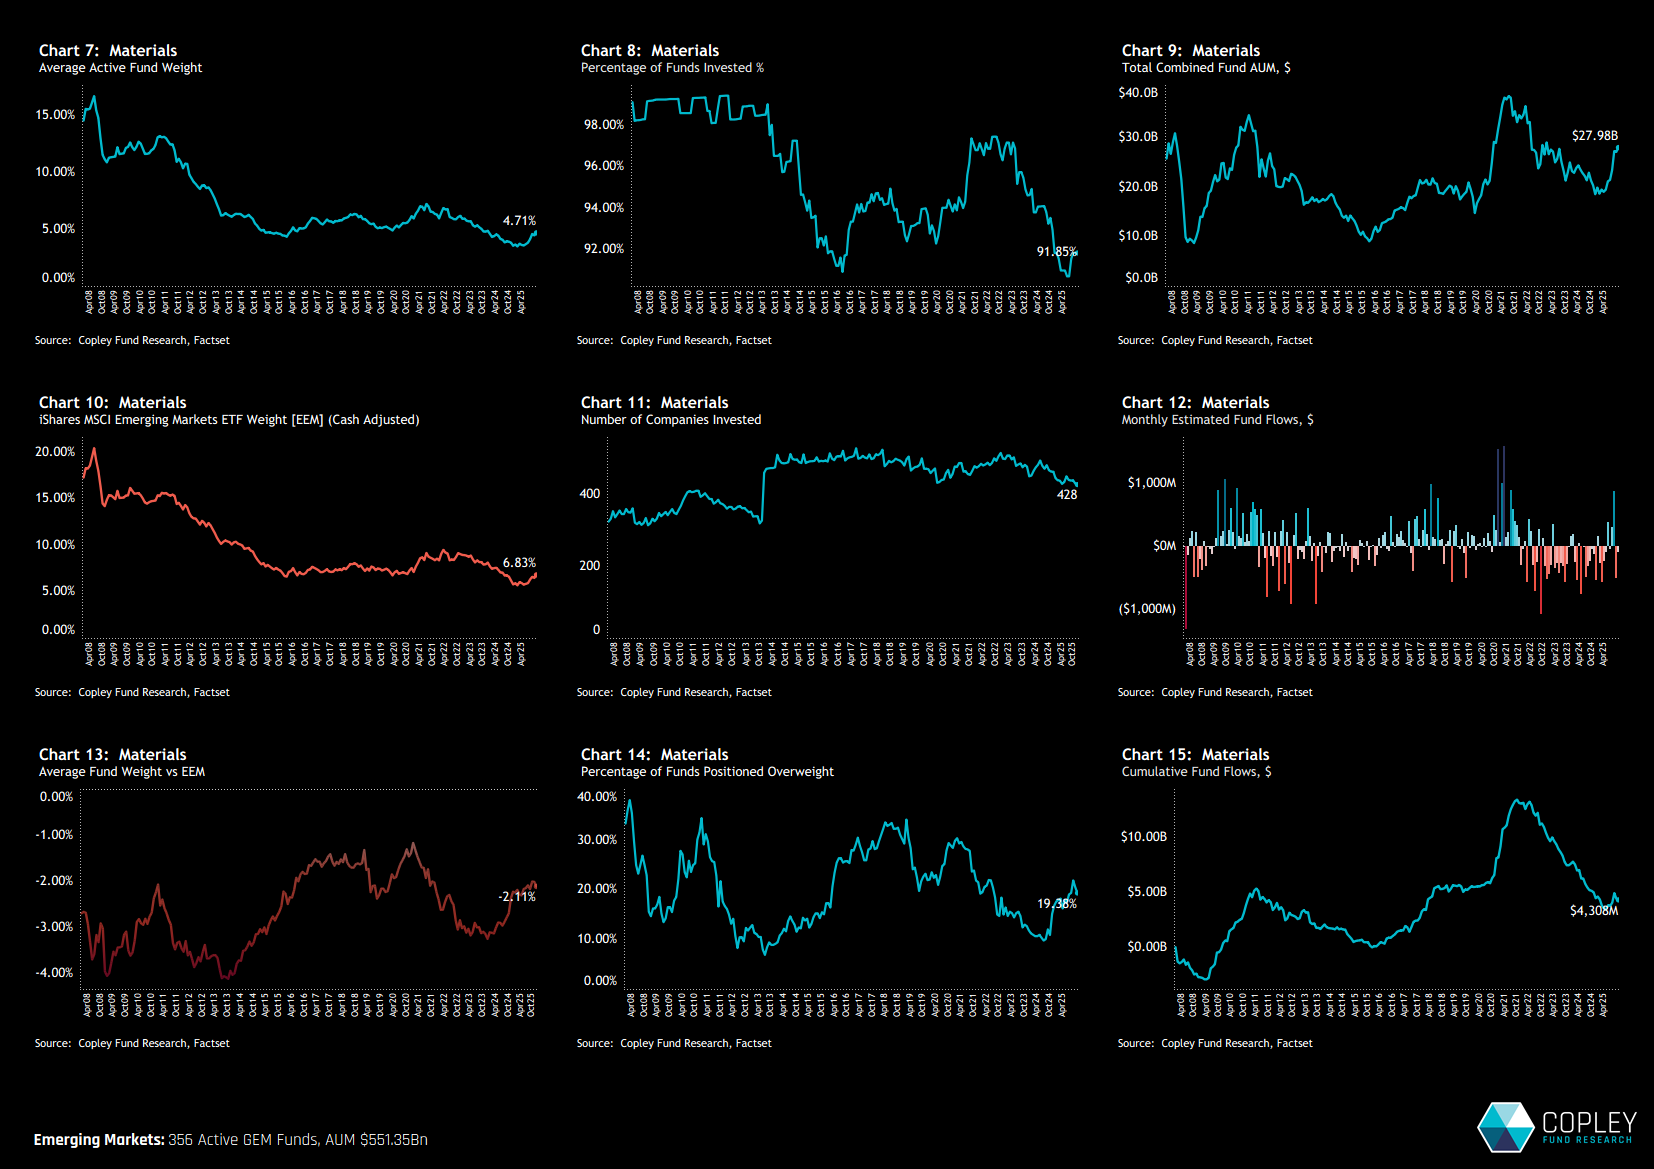
Materials Long-Term Trends A closer look at fund ownership metrics across the Materials sector reinforces the early recovery story. Average active weights, which once peaked above 15%, have fallen sharply over the years and now sit at 4.7% — but that’s up from an all-time low of just 3.5% earlier this year (chart 7). Participation is also starting to turn. The share of funds holding exposure has ticked higher (chart 8), and the sector’s net underweight has narrowed from below -3% to -2.1% today (chart 13), suggesting a gradual rebuild in allocations is underway.
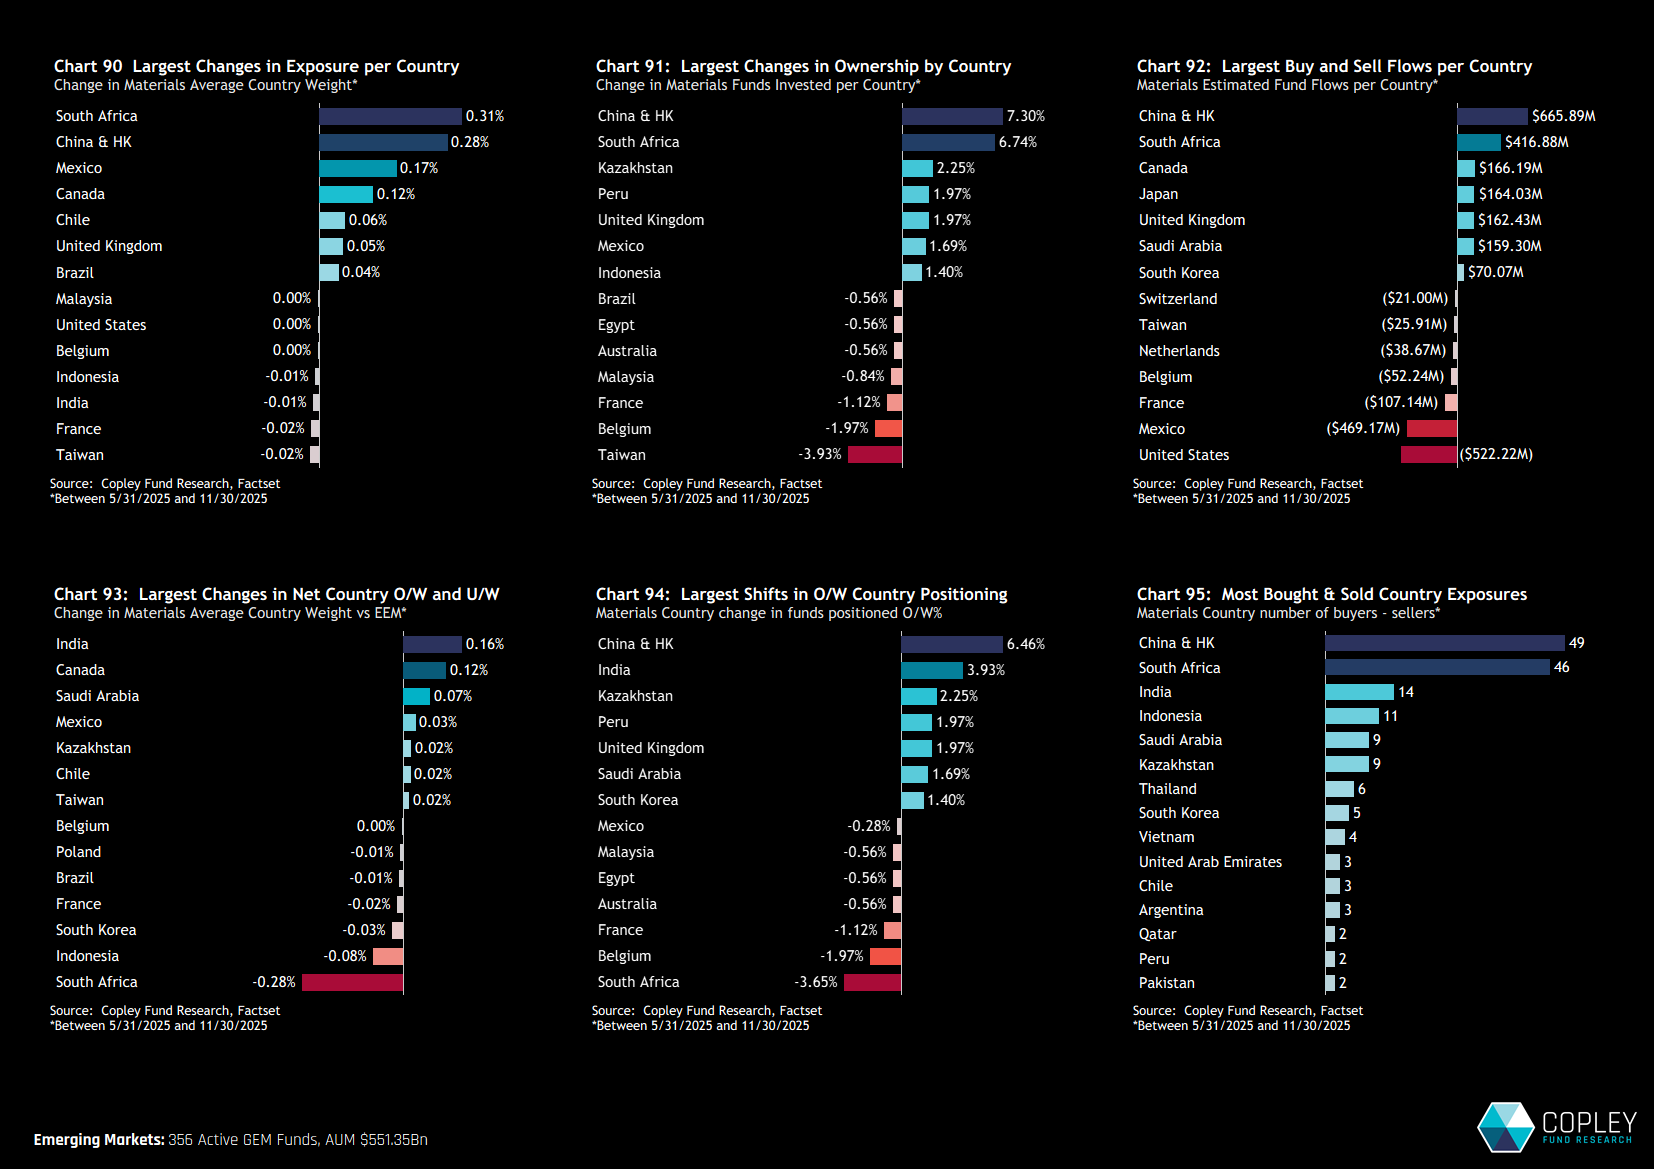
Country Drivers Looking at country-level trends helps clarify the origin of the Materials rebuild. The biggest shifts have come in China & HK and South Africa, where the percentage of funds invested has jumped by 7.3% and 6.7% respectively over the past six months (chart 91) — among the strongest increases for any country/sector pair in EM. Active fund inflows of $665 million into China & HK and $416 million into South Africa (chart 92), along with a clear skew toward buyers over sellers (chart 95), point to deliberate rotation. Together, these trends have helped lift average weights across both markets (chart 90).
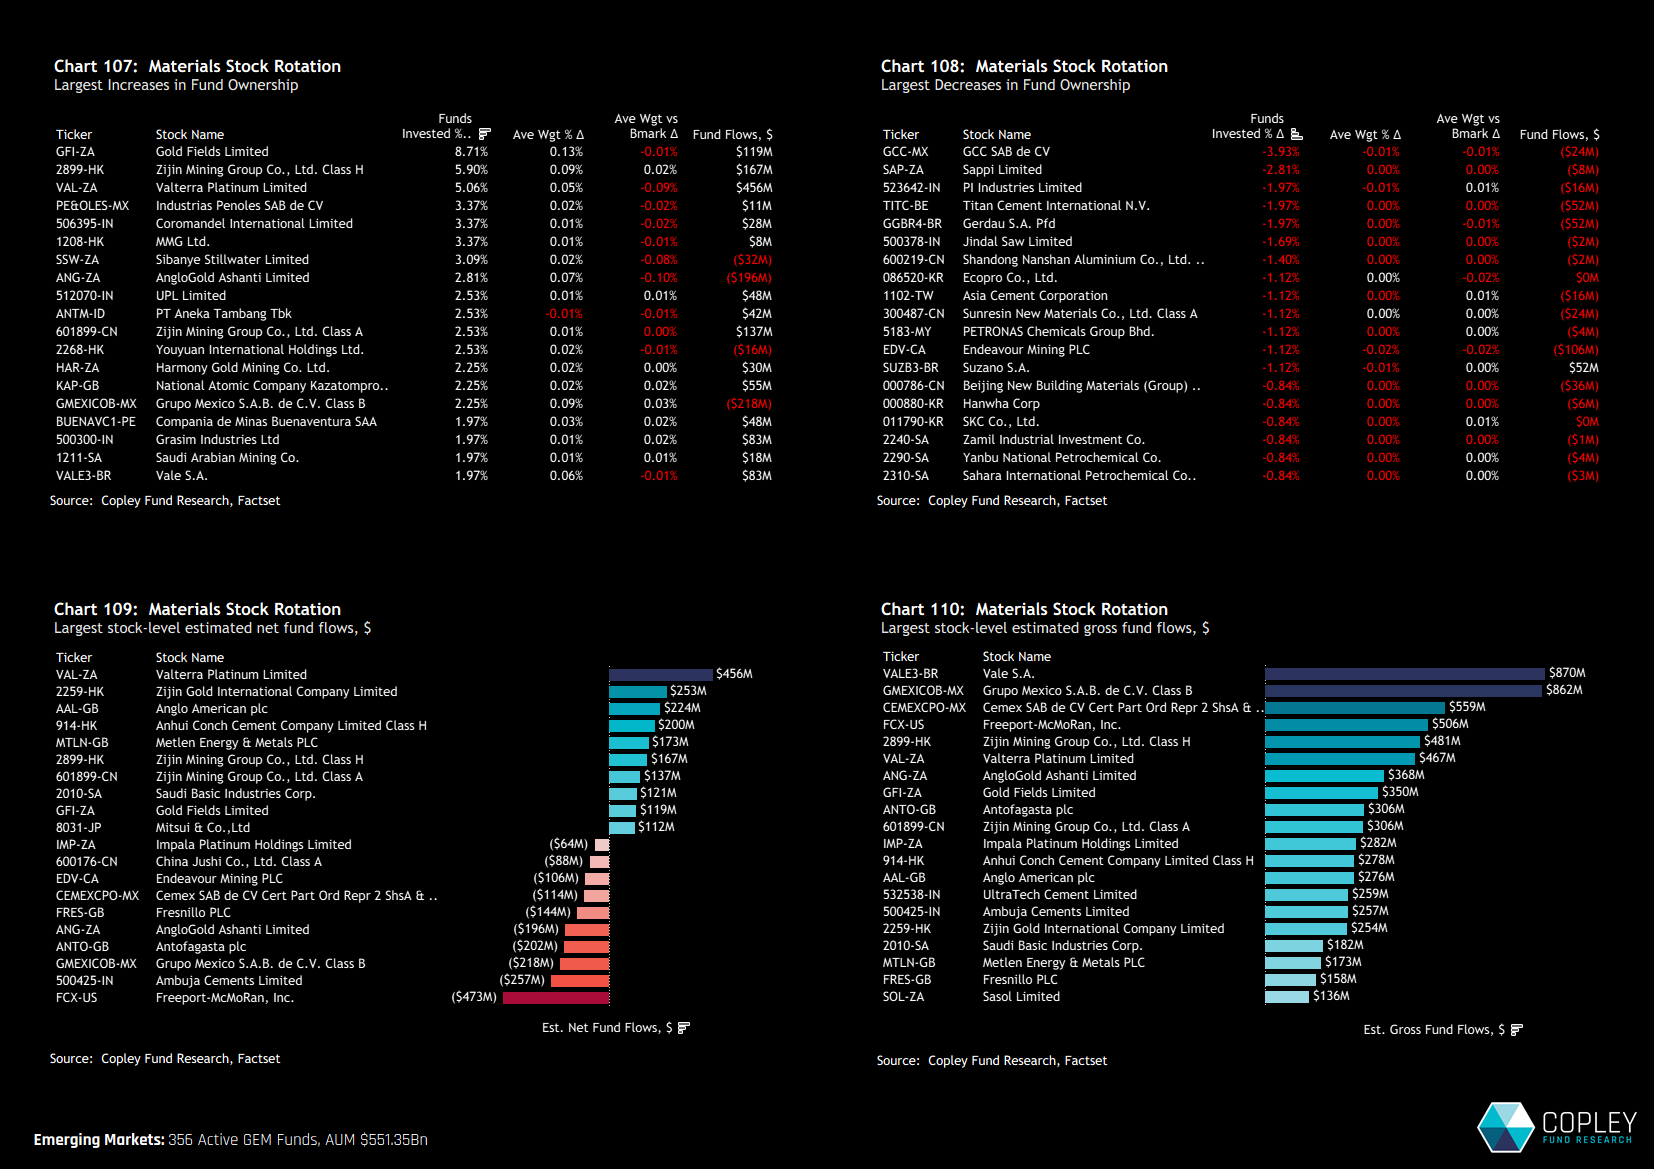
Stock Level Analysis: Winners capture big rotation. At the stock level, a handful of names have been key in driving the recent pickup in Materials positioning. As chart 107 shows, Gold Fields leads the pack, with an 8.7% increase in GEM fund participation over the past six months. Zijin Mining Group and Valterra Platinum have also seen solid gains in ownership. On the flip side, decreases have been less common and generally smaller, though names like GCC SAB and Sappi Limited did see modest but notable declines (chart 108). In terms of flows, Valterra Platinum, Zijin Mining, and Anglo American attracted the most capital, while outflows were concentrated in Freeport-McMoRan and Ambuja Cements (chart 109).
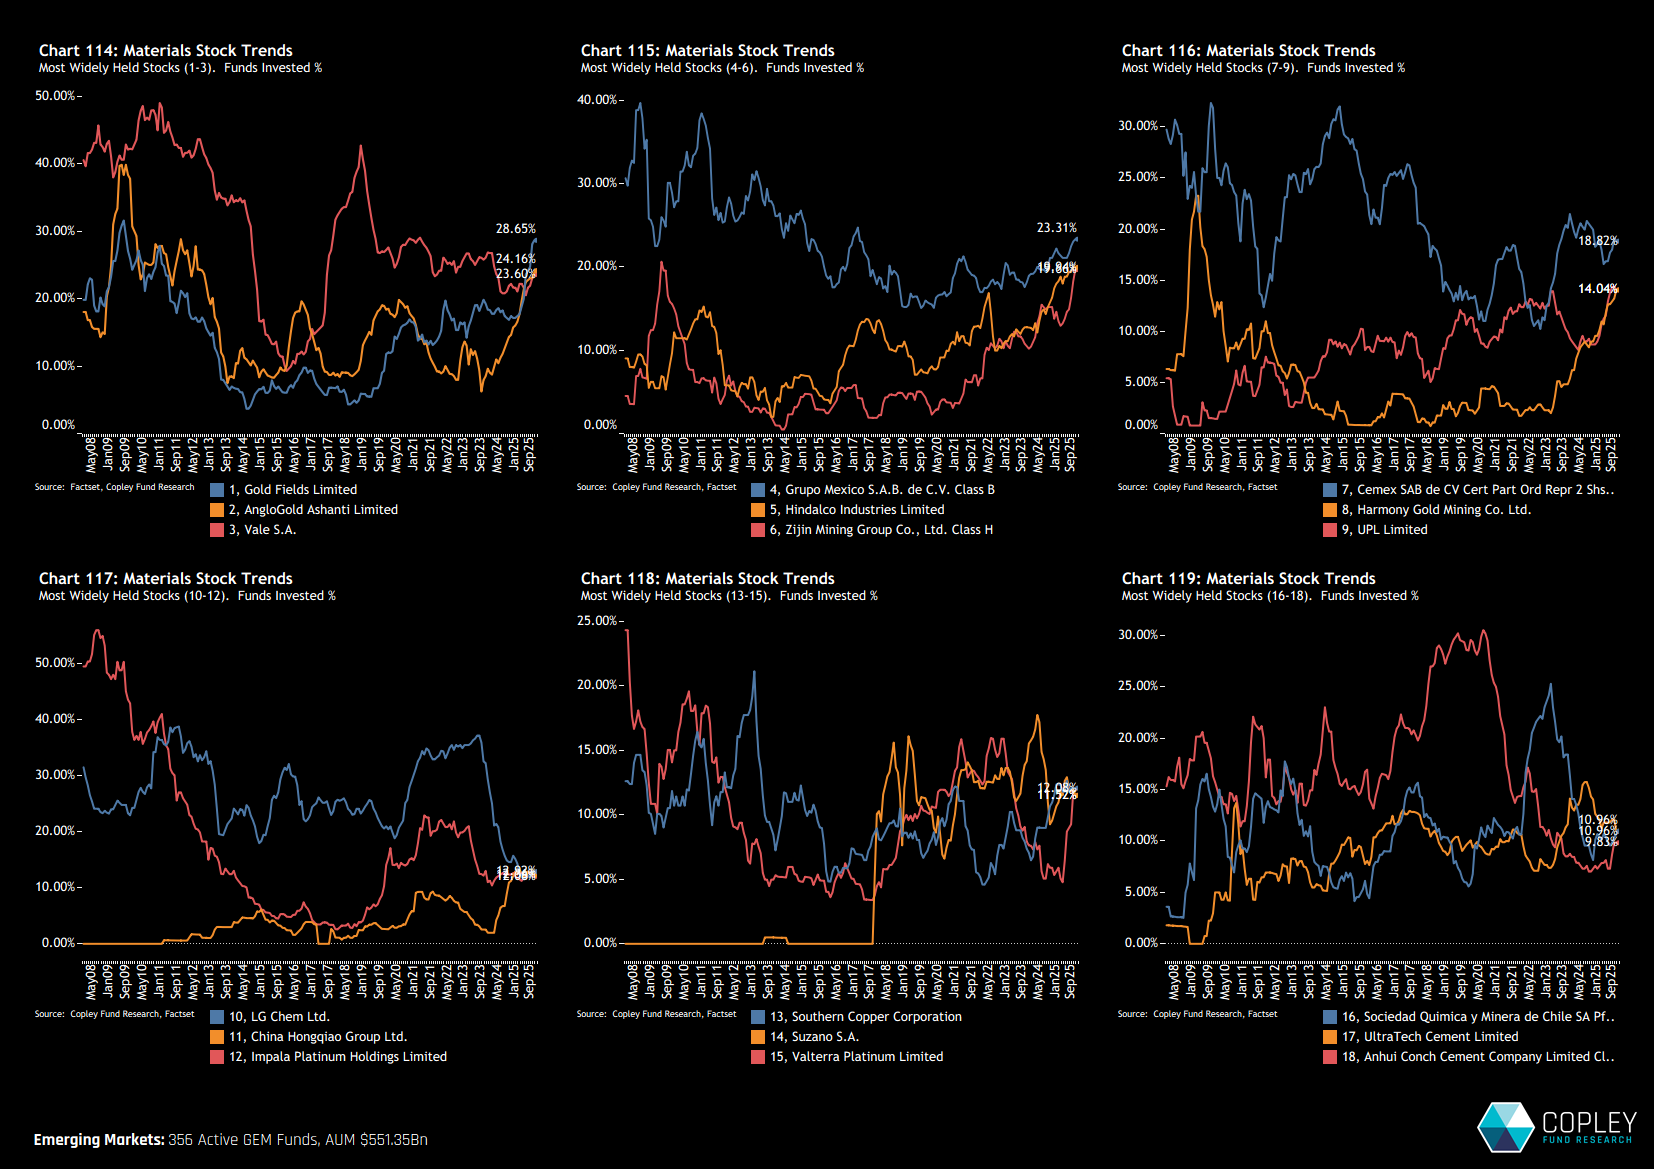
The Evolution of Ownership in Popular Materials Stocks The chart set below tracks the percentage of funds invested over time for the 18 most widely held stocks in the Materials sector — and reveals a clear shift in sentiment toward selected names. Anglo American, Gold Fields, Zijin Mining, and Hindalco have all seen a strong rebound in ownership, climbing to recent highs after periods of being under-owned. Grupo Mexico also appears to be recovering, though participation remains well below previous peaks. In contrast, LG Chem stands out on the downside, with fund ownership falling sharply from 37% in late 2023 to just 13% today.
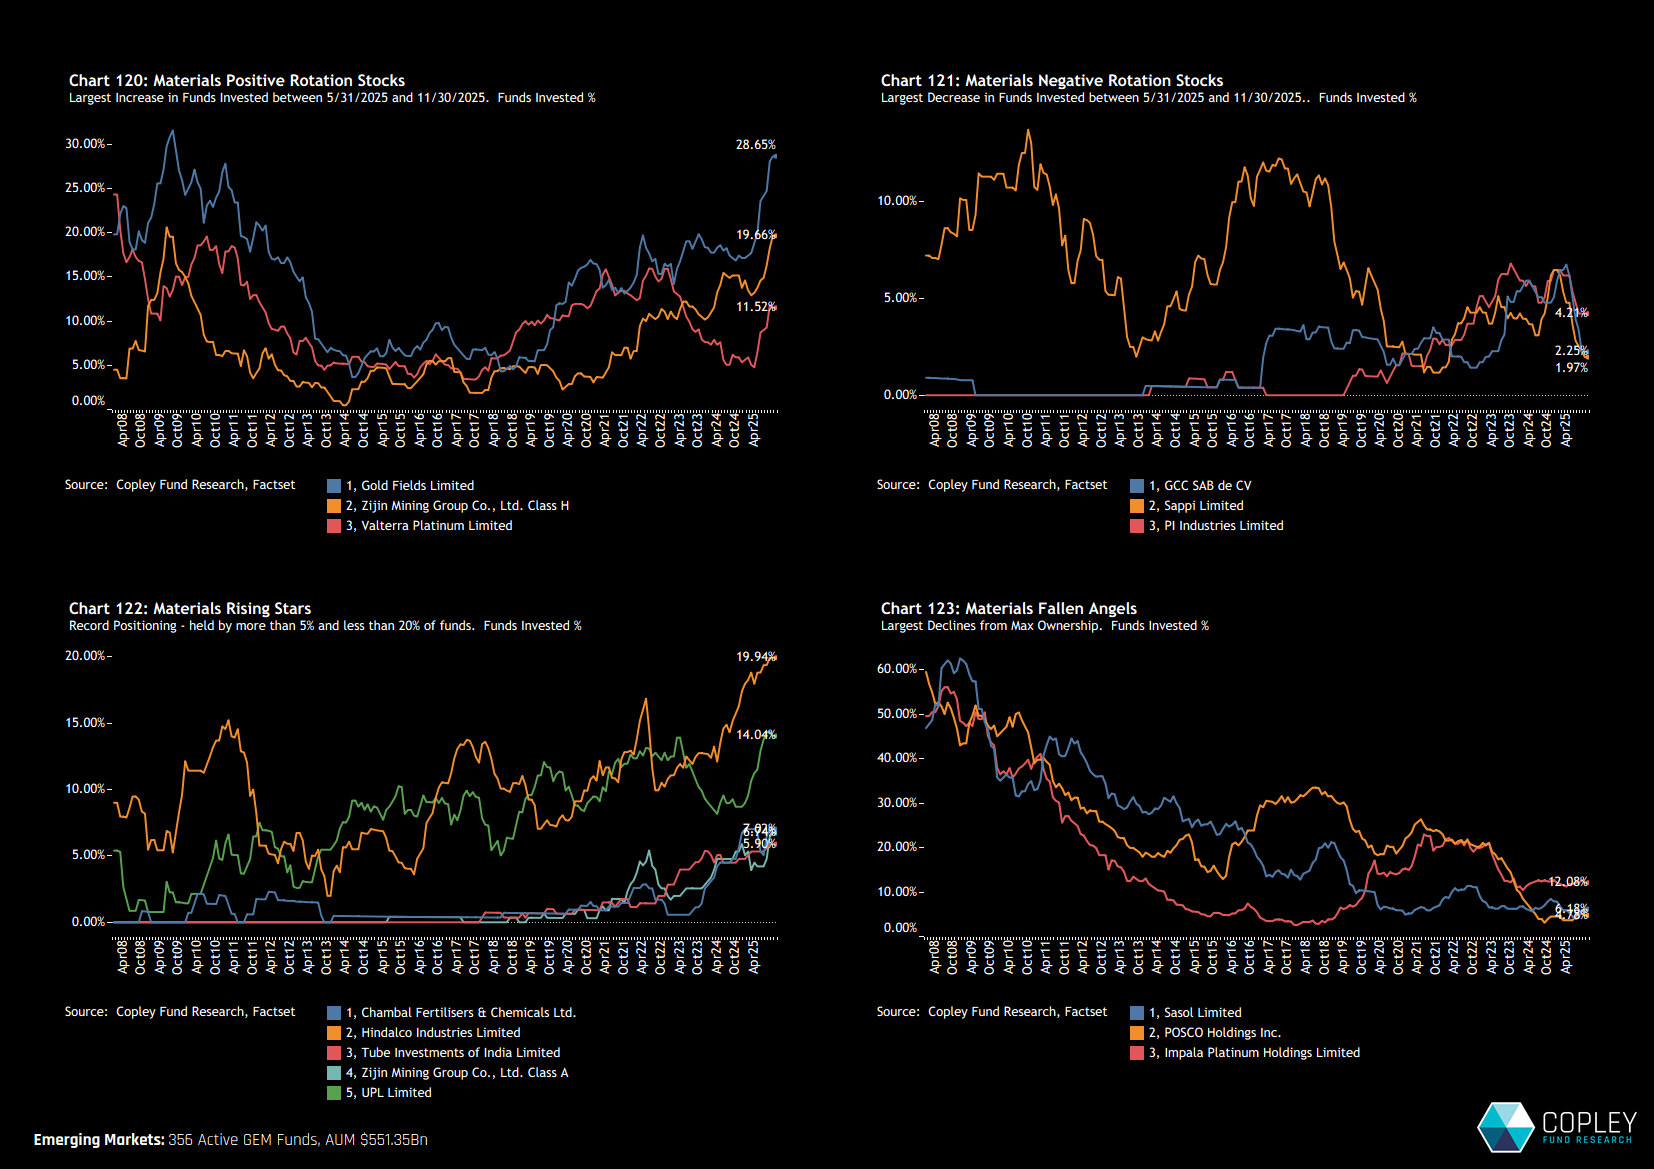
Stock to Watch Chart 120 highlights the three stocks with the strongest pickup in fund ownership over the past year, while chart 121 captures the largest declines — with names like Sappi and GCC SAB now almost entirely off the EM fund ownership map. Chart 122 flags the sector’s rising stars: stocks at record ownership levels but still held by only 5% to 20% of managers. These include Chambal Fertilizers, Hindalco Industries, Tube Investments of India, Zijin Mining, and UPL Limited — all showing growing traction without yet being consensus positions. In contrast, chart 123 shows the secular decline in ownership of Sasol Limited, POSCO Holdings, and Impala Platinum — names that were once widely held but have not participated in the recent sector rotation.
Materials Latest Fund Positioning
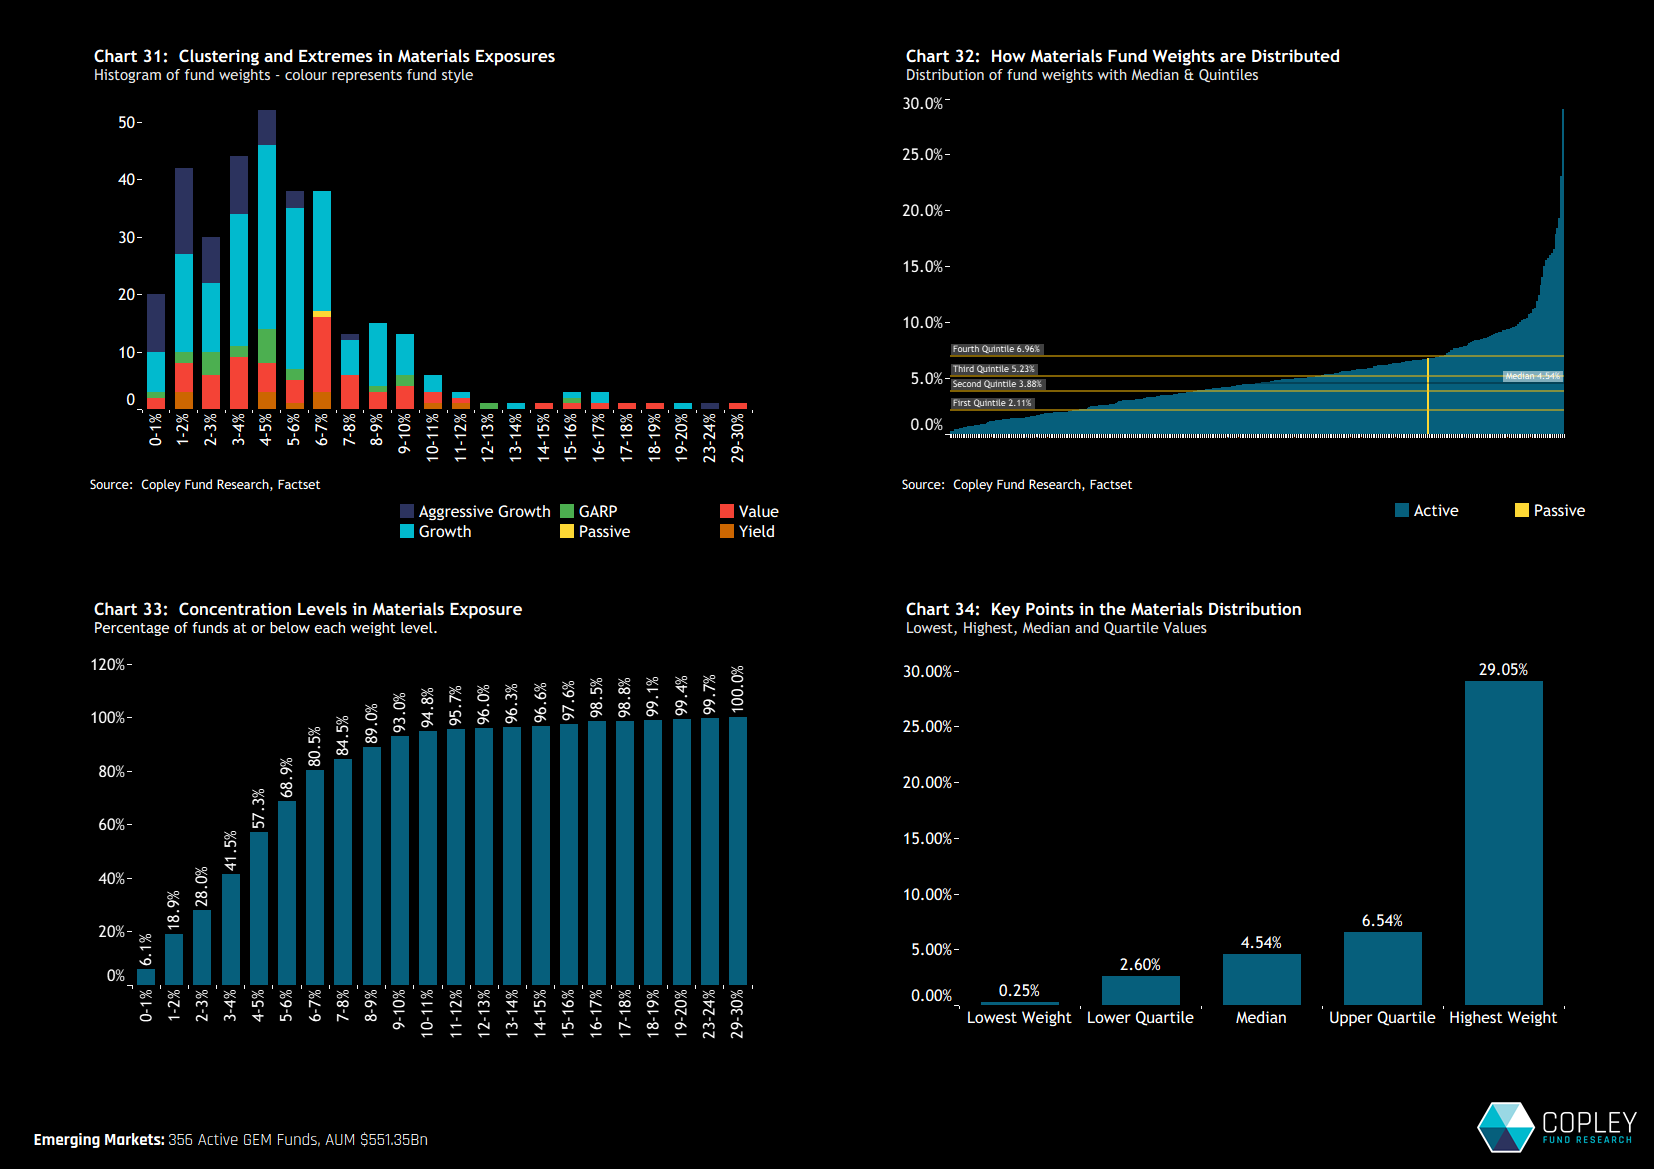
Where does all this activity leave fund-level positioning in the Materials sector? Chart 31 shows a wide distribution of weights, but with most allocations clustered between 1% and 7% and a long tail of higher-conviction positions stretching up to 29%. In fact, 95% of all Materials allocations sit below 11% (chart 33), with half of them falling between 2.6% and 6.5% (chart 34). This suggests that, outside of a few high-conviction outliers, exposure to the sector remains relatively moderate. But with ownership metrics starting to turn and rotation gaining pace, there’s clear room for positioning to catch up to sector peers. Perhaps what we’re seeing is just the early stages of a more meaningful rebuild.
AFI – Market Intelligence Report: Materials
Please click on the link opposite for the full positioning report on the EM Materials sector. It contains 133 charts, including fund-level detail at the sector, country/sector and stock level, breakdowns by Style, Market Cap Focus and Benchmark Independence, together with a full gap analysis on past holders and potential buyers in the sector.