Breaking the Range: EM Reclaims Attention in Global Portfolios

Global Funds

Breaking the Range: EM Reclaims Attention in Global Portfolios

December 16th 2025

Executive Summary

After years of range-bound allocations, Emerging Markets are finally gaining ground in Global portfolios. Average EM weights have broken out of a long-standing band, reaching their highest level since 2019, supported by strong inflows and a clear shift in positioning among active managers. The share of funds now overweight EM has risen meaningfully, and the net underweight has narrowed to its tightest level in eight years.

This move has been led by renewed interest in North Asia — particularly Taiwan, China & Hong Kong, and South Korea — with additional support from smaller markets like Poland and South Africa. At the stock level, TSMC remains the standout, but increased ownership in names like Tencent, Alibaba, and CATL hints at broader re-engagement with key EM equities. 

Click on the Report Link below for access to the latest EM Materials Market Intelligence Report.

Still, EM allocations remain shallow across most Global funds, concentrated in a small set of countries and stocks. Value and Small/Midcap strategies show a slight tilt toward higher EM exposure, but the difference is more marginal than structural. Even with the recent momentum shift, EM remains a modest position for the majority — 81% of funds hold less than 13%. For investors looking for meaningful EM exposure, a typical Global fund may not be the most effective route. But for those managers who do allocate more, it becomes a genuine point of differentiation — and one that deserves to be clearly communicated to prospective investors.

Breaking Out
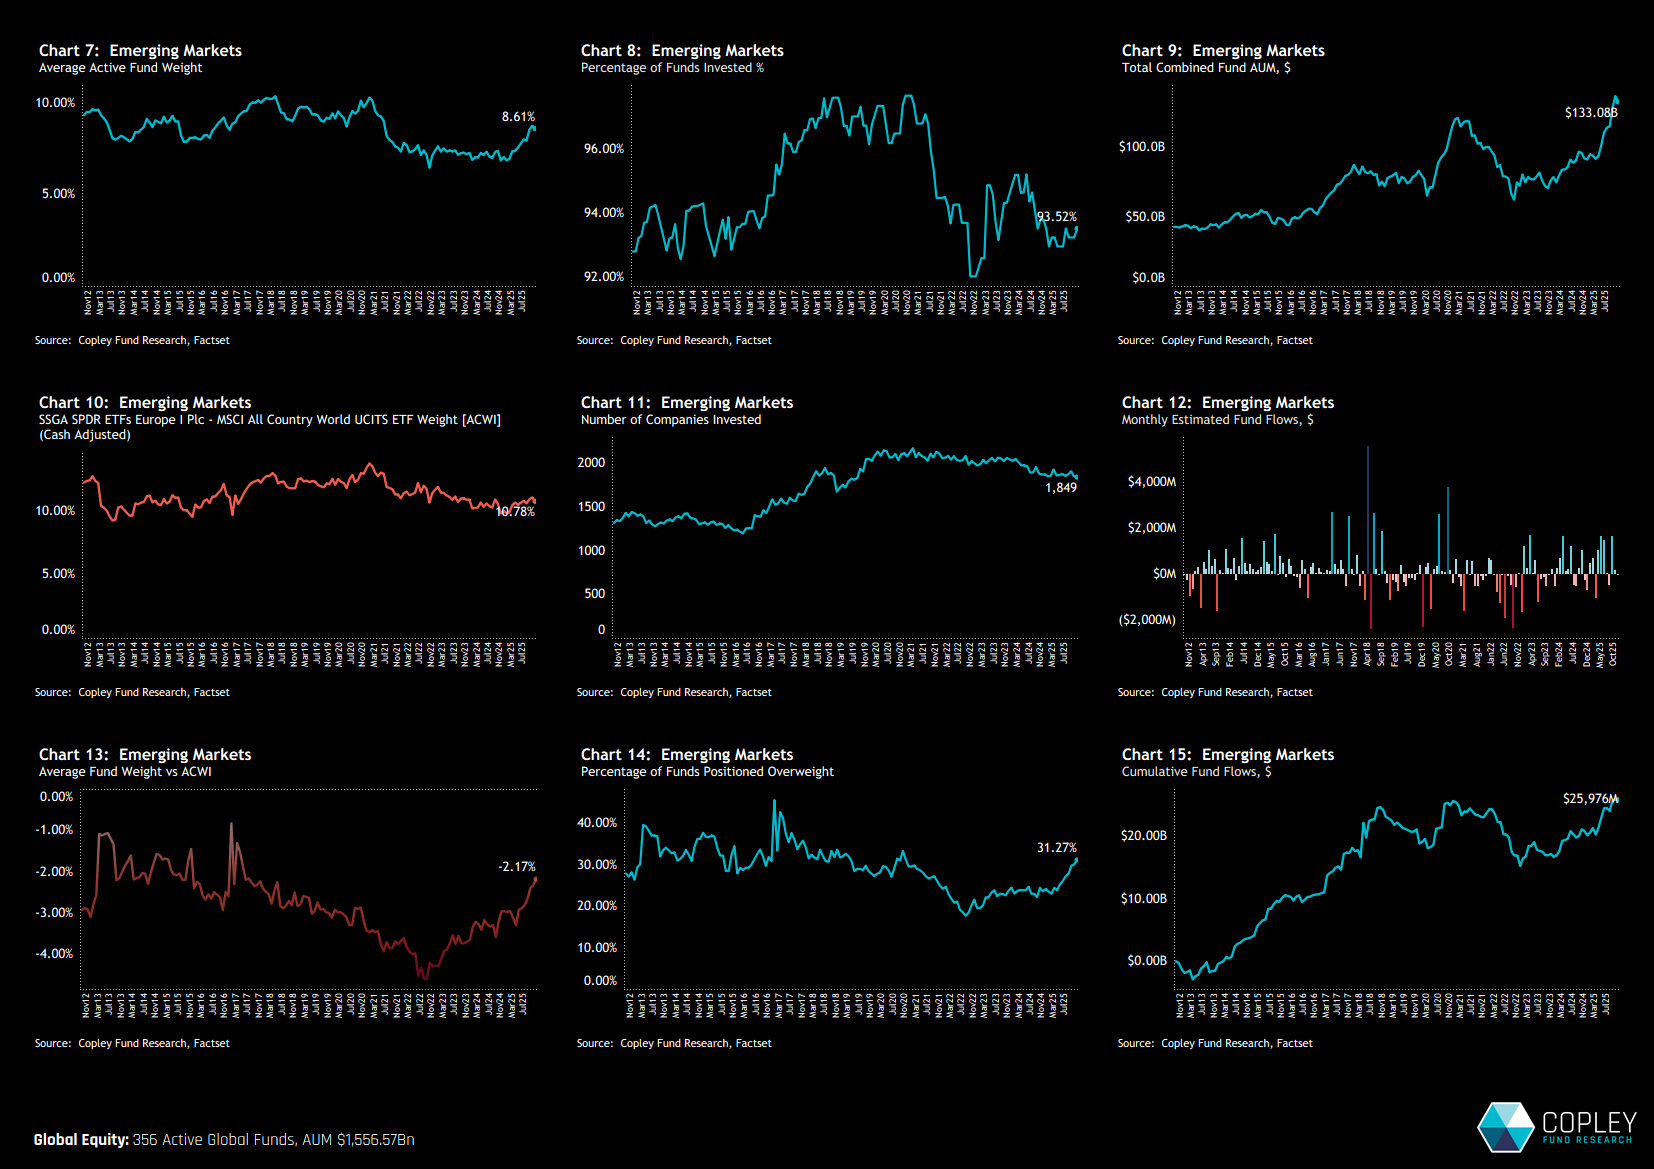
EM allocations within Global funds are breaking out of a long-held range. After spending most of 2021 to 2024 locked between 6.5% and 7.5%, average weights have moved higher in 2025, now at 8.61% — the highest level since early 2019 (chart 7). The move has been driven by strong inflows (chart 15) and a clear shift in manager positioning, with a growing number of funds rotating from underweight to overweight. As a result, the share of funds positioned above the ACWI index has climbed to 31.3%, up from sub-25% levels that had persisted for nearly four years (chart 14). The net underweight has narrowed to just -2.17%, its tightest point since 2017 (chart 13).

Country Rotation
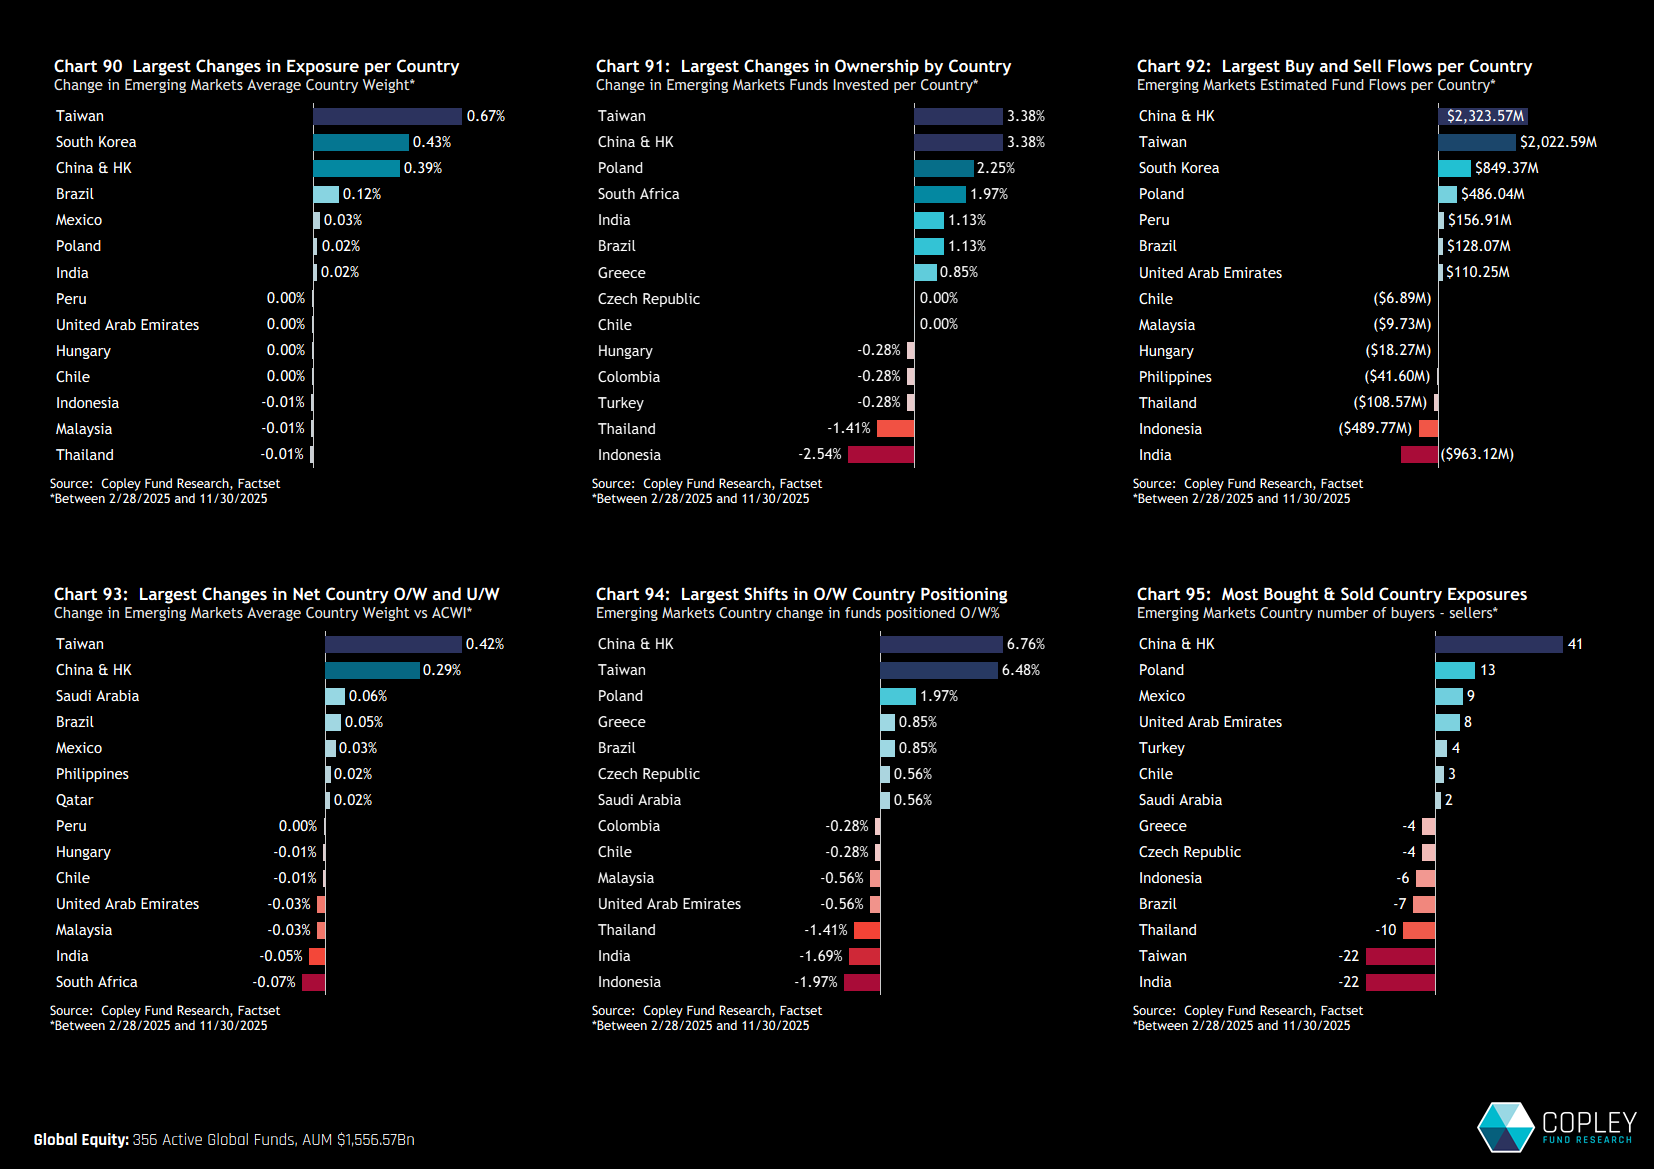
The move higher in EM allocations has been driven largely by the trio of Taiwan, South Korea, and China & HK, which together have added 1.5 percentage points to overall EM weights since the breakout began in February (chart 90). Active rotation has been the strongest in Taiwan and China & HK, with both markets seeing an additional 3.4% of funds initiate exposure and net inflows exceeding $2 billion each (charts 91&92). Smaller positive contributions came from Poland and South Africa. On the other side, India and Indonesia bucked the trend. India saw outflows and more funds moving underweight (chart 94), while Indonesia dropped out of favour with 2.5% of funds selling out over the period.

EM Country Positioning
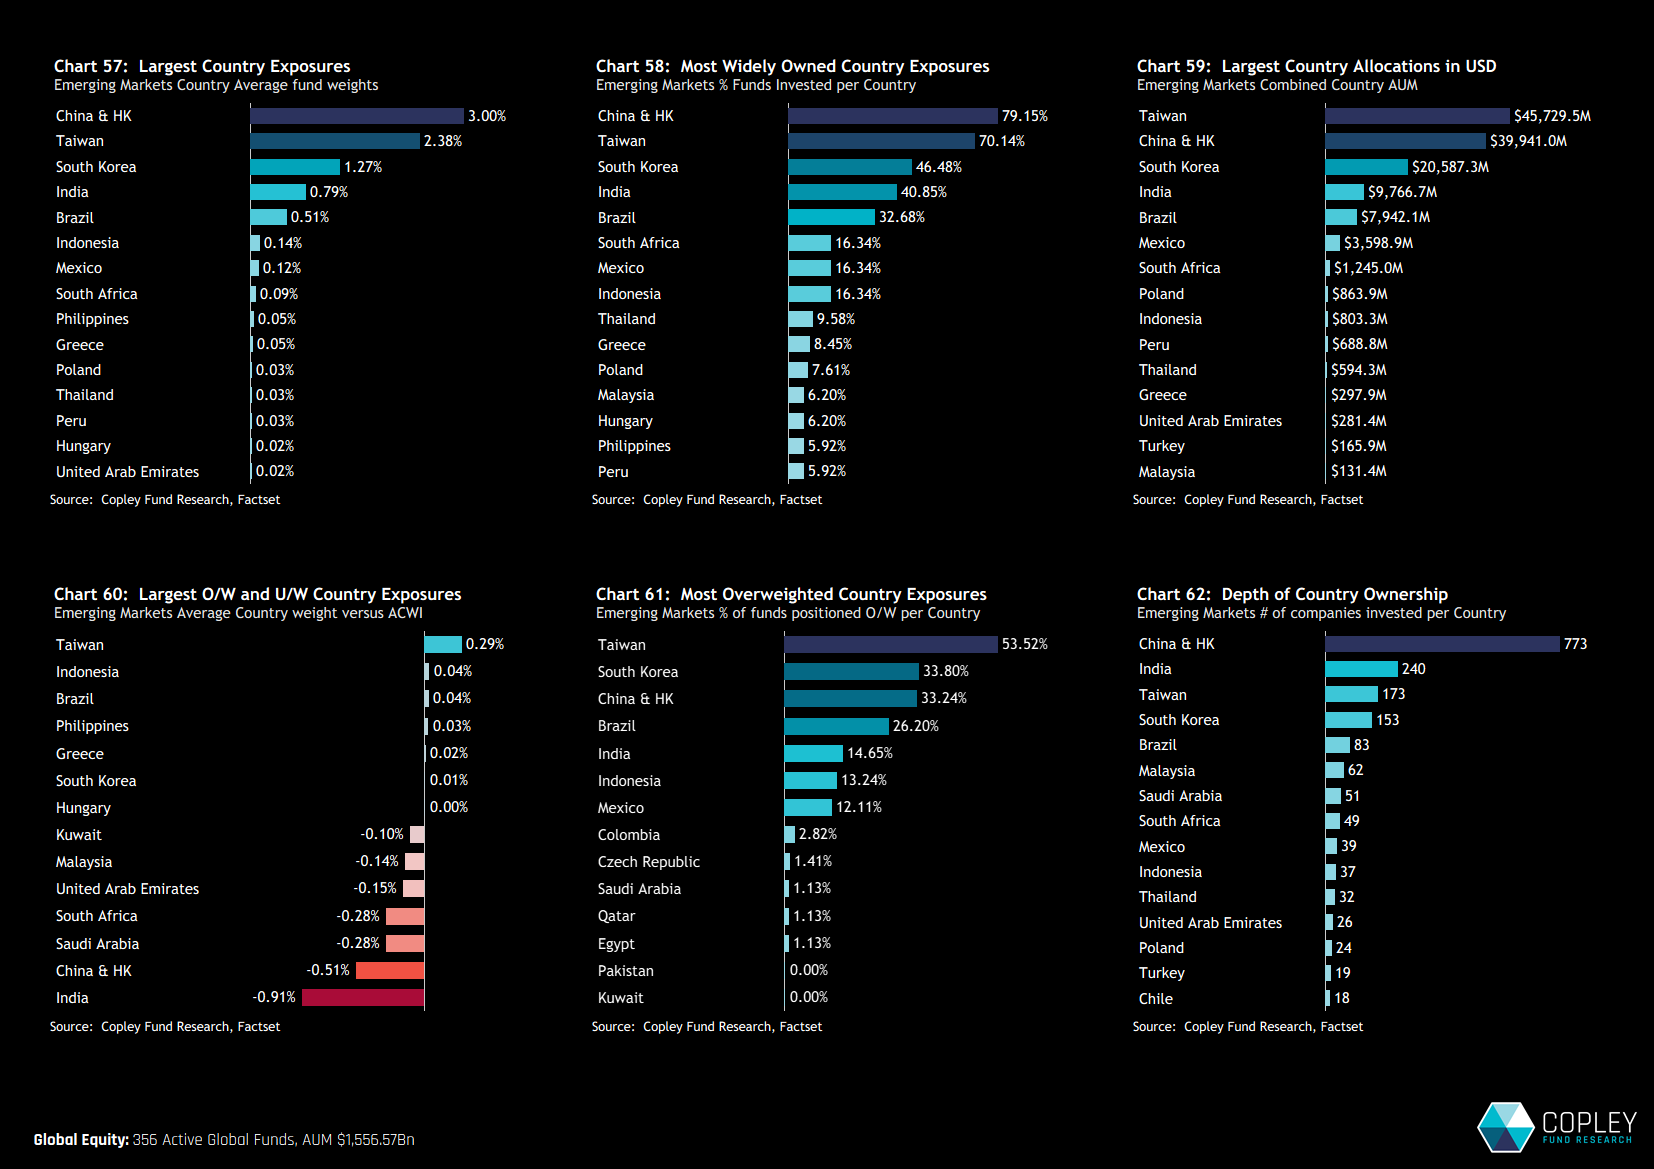
Country-level allocations within EM are dominated by China & HK and Taiwan — but unlike in dedicated EM portfolios, Taiwan is a much closer competitor here, both in terms of weight and outright ownership. Beyond these two, only South Korea, India, and Brazil feature in any meaningful way, with the top five markets accounting for 92% of the overall EM allocation. The net underweight of -2.17% is largely driven by India, where 85% of funds are positioned below benchmark. Smaller negative contributions come from underweights in China & HK, Saudi Arabia, and South Africa. Taiwan stands out as the only net overweight, with just over half of Global managers holding above-benchmark positions.

Stock Positioning
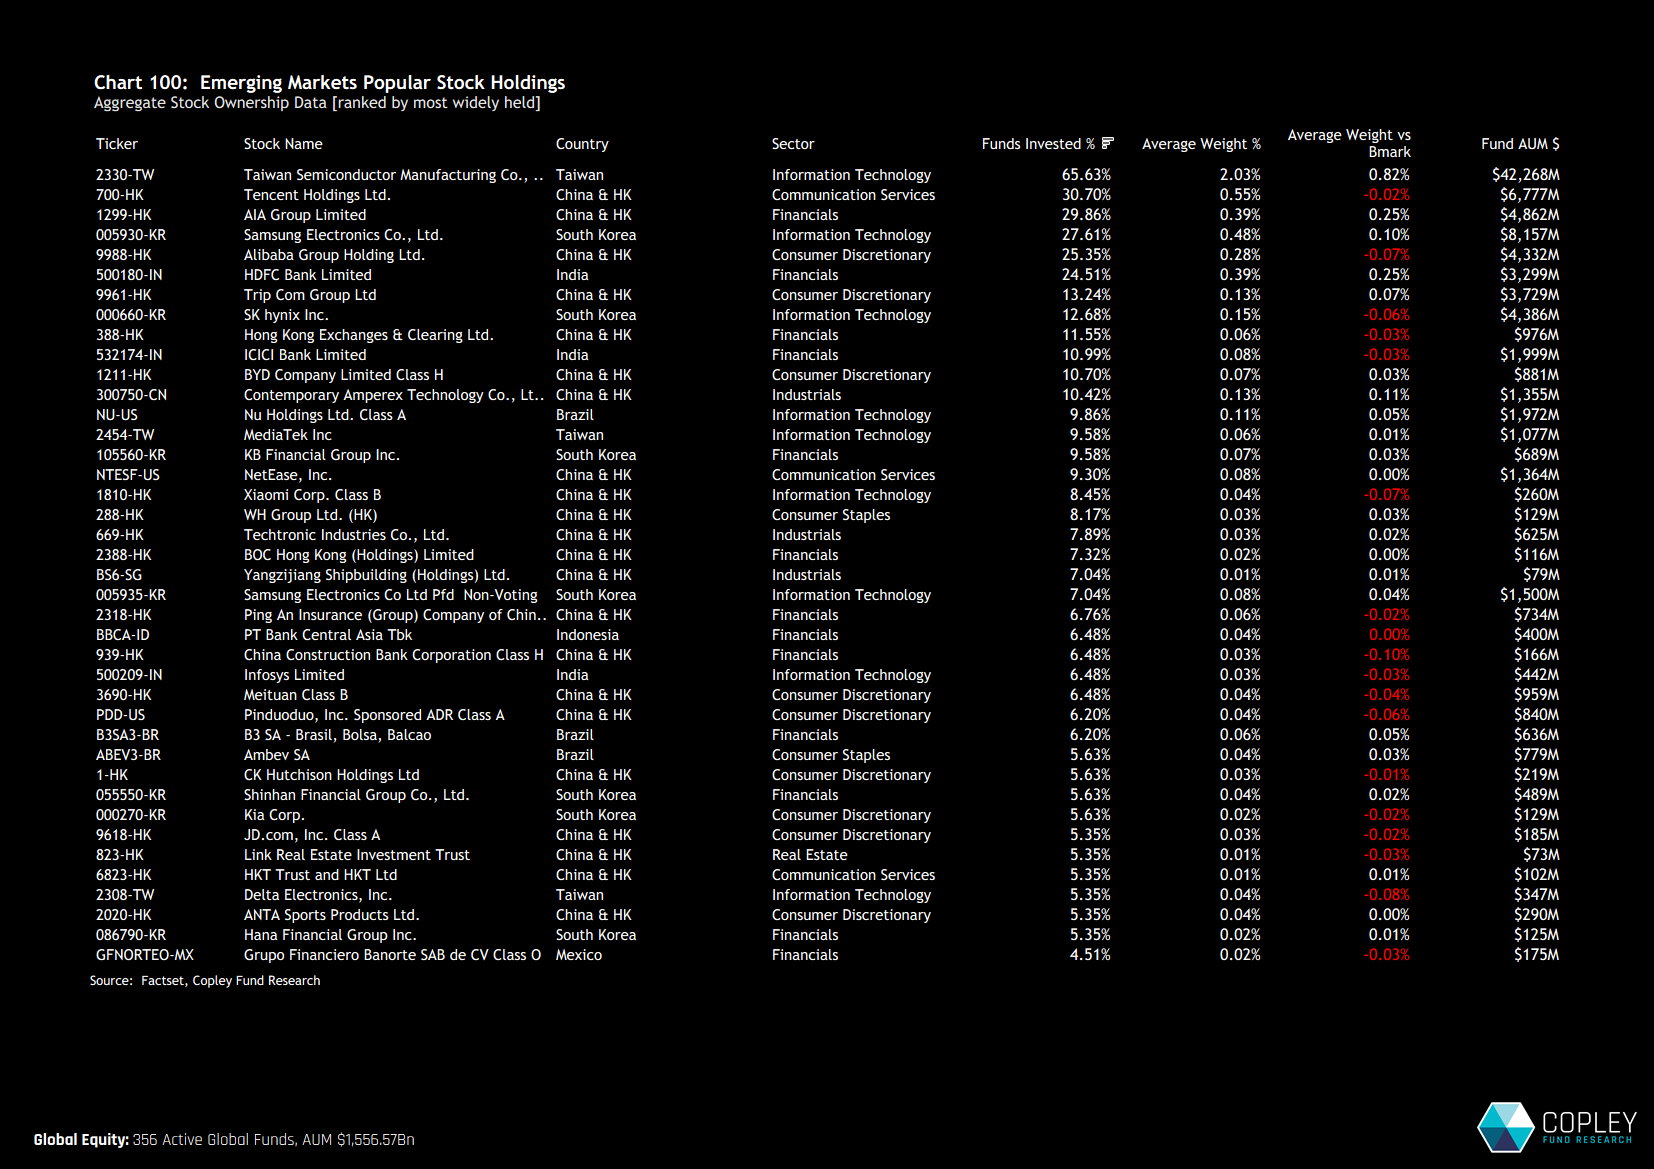
At the stock level, TSMC stands well above peers — not just as a leading EM name, but as a globally significant holding. It ranks as the 2nd most widely held stock globally and is the number one stock in Emerging Markets, held by 65.6% of managers. It towers over a second tier of names that includes Tencent, AIA Group, Samsung, Alibaba, and HDFC Group. But beyond this top group, depth quickly falls away. Only 12 EM stocks are held by more than 10% of global managers — a statistic that highlights not just the narrowness of EM exposure, but also the wide dispersion of holdings across individual portfolios.

The Evolution of Ownership in key EM Stocks
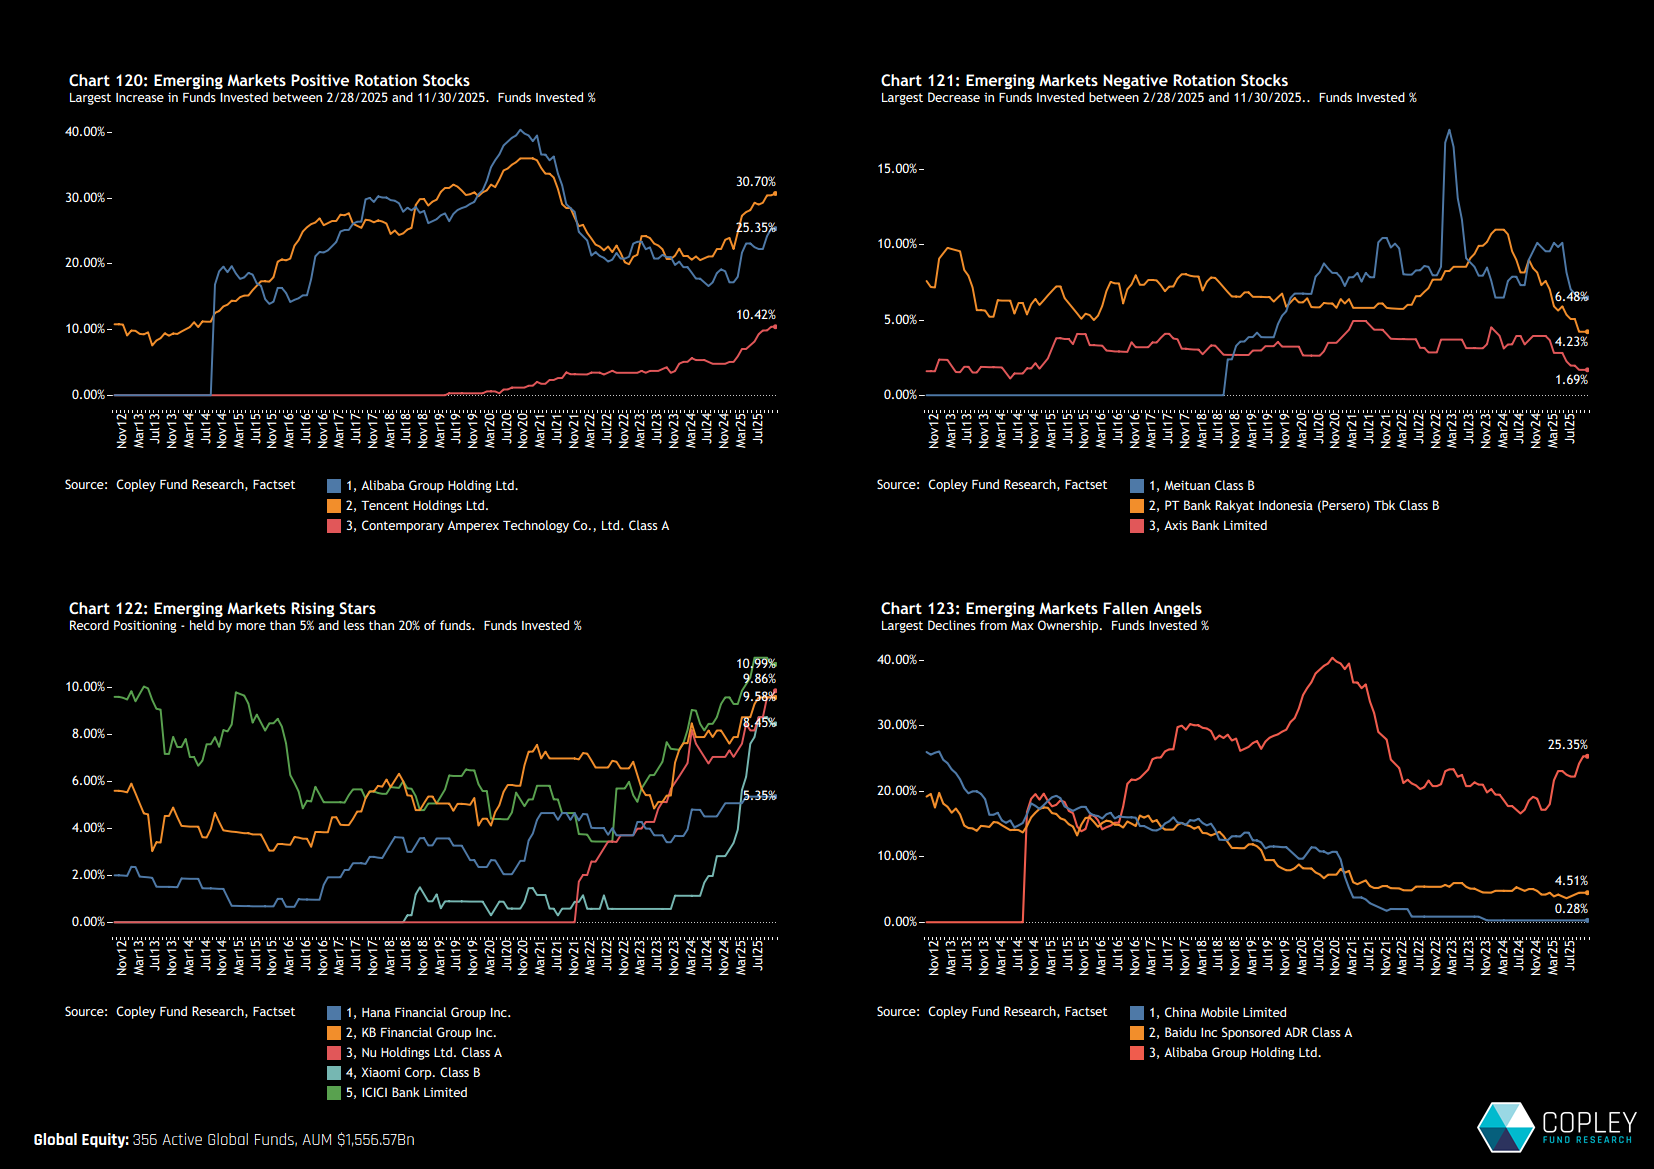
Chart 120 shows the time-series of funds invested in the three companies with the largest increase in ownership between February and November this year. It’s an all-China affair, with Tencent and Alibaba both regaining some of the ownership momentum lost during the 2020–2024 period, while Contemporary Amperex Technology (CATL) has pushed to new record highs — though it remains lightly held overall. Against this, Meituan, Axis Bank, and Bank Rakyat have seen recent declines in fund ownership (chart 121), while China Mobile, Alibaba Group Holding, and Baidu have recorded the steepest drops from previous highs (chart 123). Finally, chart 122 highlights five stocks now at record ownership levels but still held by fewer than 20% of managers — potential early-stage names that could attract broader interest as conviction builds.

Fund Ownership Distributions

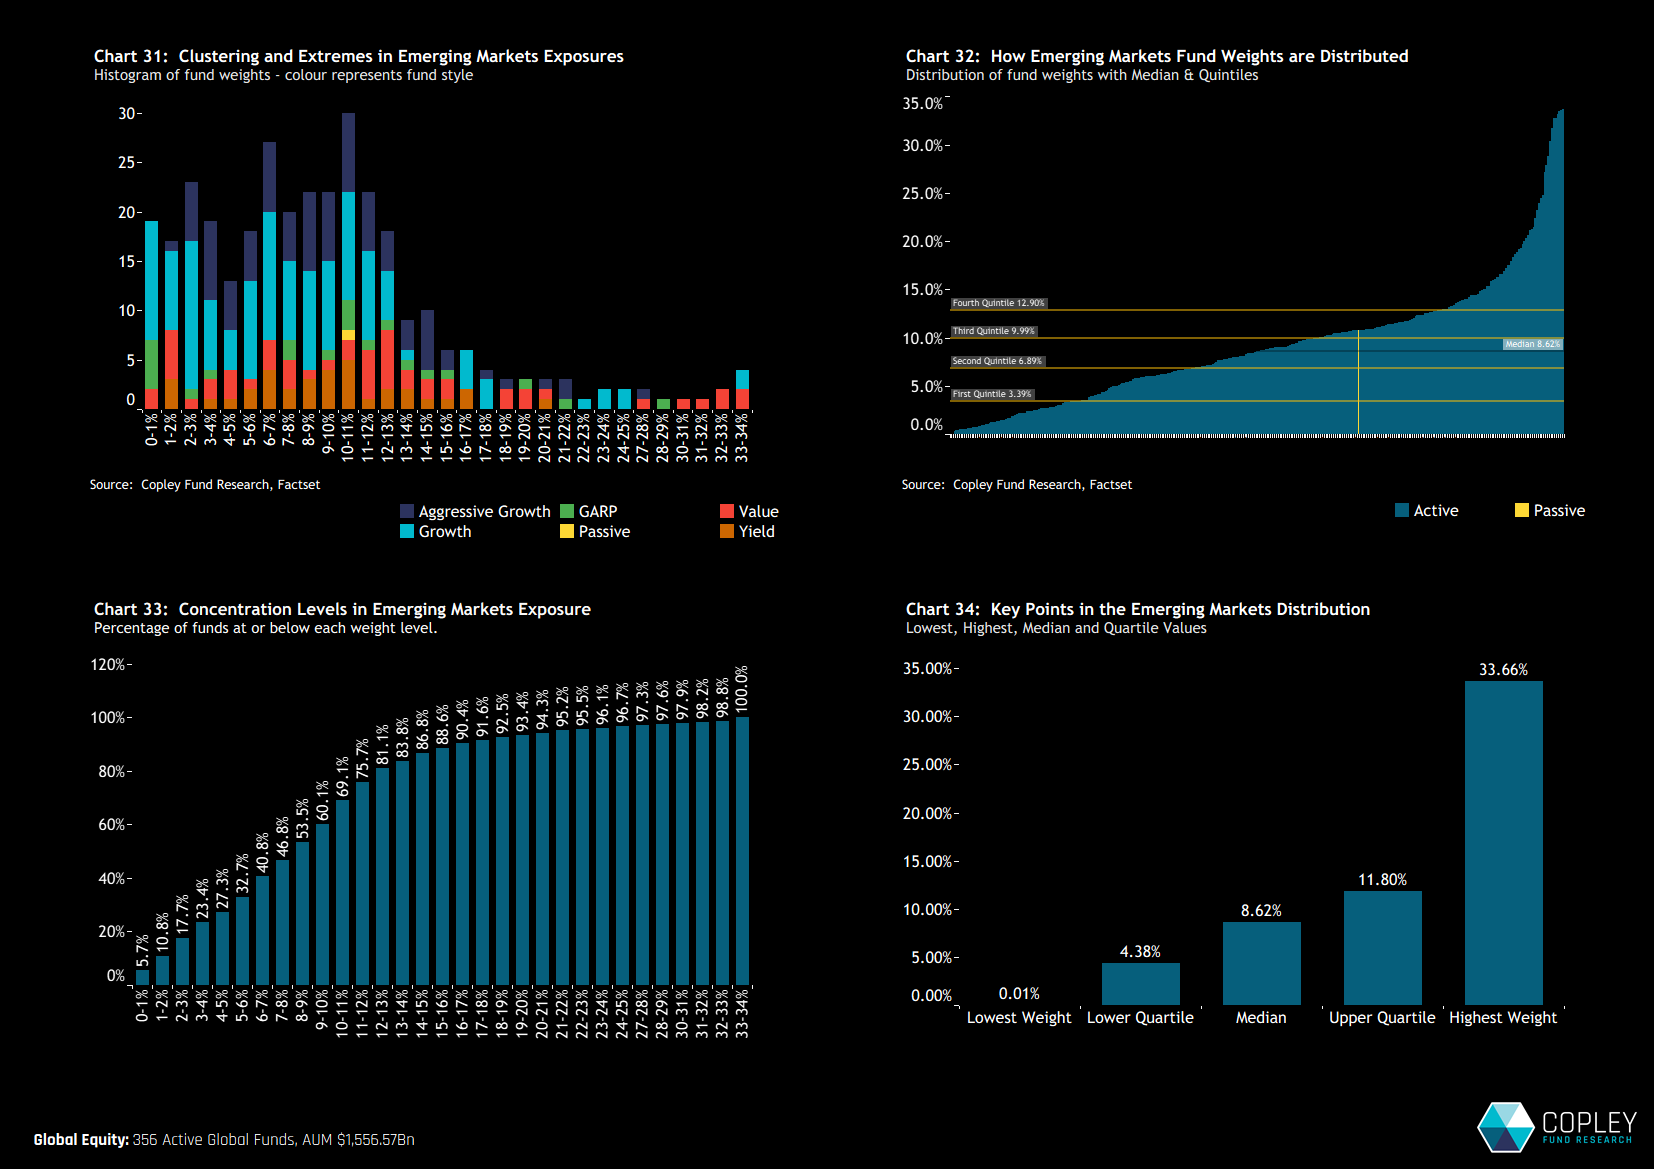
The EM allocation picture across individual Global funds is laid out in the four charts below. Chart 31 shows a clear clustering of fund weights between 0% and 13%, though there’s a long tail of higher-conviction positions extending well beyond that. Chart 33 confirms that 81% of funds are positioned below 13%, with the middle 50% of allocations falling between the quartile bands of 4.4% and 11.8% (chart 34). At the top end, the most bullish EM allocators hold as much as 33.7%, highlighting the wide dispersion of positioning across the fund universe.

Style and Size Splits
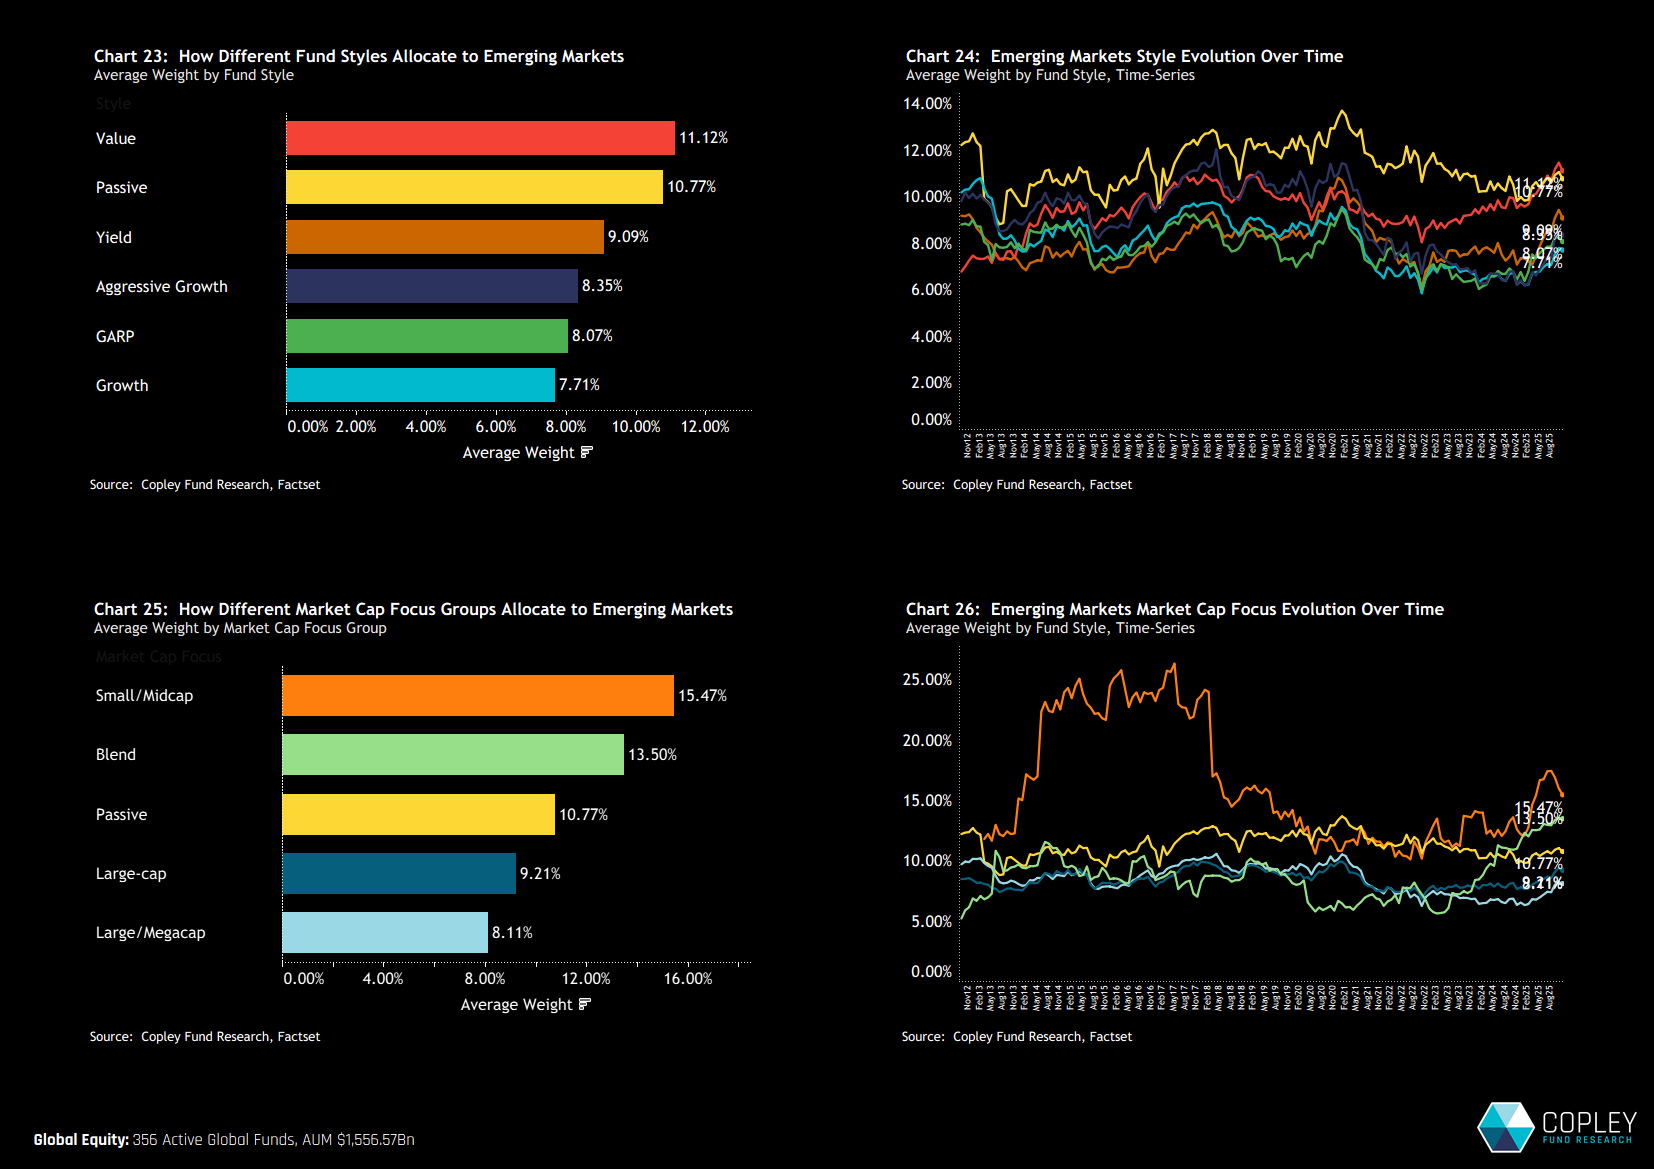
Finally, it’s worth examining how different types of Global funds are positioned in EM. Charts 23 and 24 break this down by fund style, and while EM is often linked to high-growth narratives, the data tells a different story. Value funds currently hold an average EM weight of 11.1%, compared to just 7.7% for Growth funds. A similar pattern emerges when looking at market cap focus: Small- and Mid-Cap-oriented funds are far more exposed to EM than their Large- or Mega-Cap counterparts (charts 25 and 26). While this partly reflects the limited presence of EM names in the global megacap universe, it also underscores the depth of opportunity that still exists among smaller companies across emerging markets.

AFI – Market Intelligence Report:  Emerging Markets

Please click on the link opposite for the full positioning report on Emerging Markets positioning withing Global funds.  It contains 133 charts, including fund-level detail at the sector, country/sector and stock level, breakdowns by Style, Market Cap Focus and Benchmark Independence, together with a full gap analysis on past holders and potential buyers in the region.  


Terms and Conditions

Investor Positioning Report — Copley Fund Research Ltd  ·  Last updated: July 2026  ·  Registered in England and Wales

1. Who we are

Copley Fund Research Ltd provides proprietary institutional fund intelligence to listed companies and investor relations professionals. These terms govern every purchase of an Investor Positioning Report. By completing a purchase you confirm you have read, understood, and agreed to these terms in full.

2. What you are purchasing

The Investor Positioning Report is a bespoke PDF report mapping the institutional fund universe around your stock. It covers current investors, past investors, competitor investors, and white space investors. Every report is built from scratch for the specific company ordered and is not a standardised or templated product.

3. Delivery and process

Following payment or invoice issuance, Copley Fund Research will contact you within one working day to agree your competitor set. Production begins once the competitor set is confirmed in writing. The completed report will be released to you within 48 hours of production starting, provided payment has been received in full; where payment is outstanding, the report will be withheld until payment clears. If the requested company falls outside our covered fund universes, or a competitor set cannot be agreed, Copley Fund Research will issue a full refund or cancel the outstanding invoice.

4. Competitor set agreement

The competitor set is agreed with you in writing prior to production, and the report is built to that agreed specification. Requests to amend the competitor set after delivery, based on a change of preference rather than an error, may be treated as a new order.

5. Refund policy

Because each report is produced individually for your company, orders are non-refundable once production has begun, except as set out in clauses 3 and 5a below. By purchasing, you agree not to dispute the charge with your card provider on the basis that the service was not as described, provided the report has been delivered to the agreed specification or corrected under clause 5a.

5a. Quality remedy

If a delivered report contains a material error caused by Copley Fund Research — for example, an incorrect company analysed, a competitor omitted from the agreed set, or content missing from the specification in clause 2 — Copley Fund Research will correct and redeliver the report at no additional charge, within a reasonable timeframe. This is your sole remedy for such errors.

6. Data and accuracy

All fund positioning data in the report reflects holdings as disclosed at the most recently available reporting date at the time of compilation. The timing of fund holdings disclosures is determined by regulatory requirements applicable to each fund and is outside the control of Copley Fund Research Ltd. This data may not reflect current fund positions. Copley Fund Research takes reasonable care to ensure accuracy but makes no warranty, express or implied, as to the completeness or current accuracy of the underlying data — though this does not affect the quality remedy in clause 5a for errors in how that data was analysed or presented. Past fund positioning is not indicative of future fund behaviour or investment decisions.

7. Not investment advice

The Investor Positioning Report is produced for investor relations intelligence purposes only. It does not constitute investment advice, financial advice, or a recommendation to buy, hold, or sell any security. The data reflects historical fund positioning and must not be relied upon as a prediction of future fund behaviour or investment decisions. Copley Fund Research Ltd is not authorised or regulated by the Financial Conduct Authority for the provision of investment advice.

8. Permitted use and confidentiality

The report is licensed for internal use by the purchasing organisation only. You may share it with employees and directors of your organisation. You may not: reproduce, redistribute, publish, or resell the report or any part of it; share it with any third party outside your organisation without prior written consent; use the fund or portfolio manager names contained in the report to approach those individuals on behalf of Copley Fund Research or in a manner that could damage Copley Fund Research's relationships with those funds; or use the data for any purpose other than your own investor relations strategy. The data, analysis, and methodology contained in the report are the intellectual property of Copley