China & HK: Rebuild Slows Amid Heavy Sector and Stock Rotation

Global Emerging Markets

China & HK: Rebuild Slows Amid Heavy Sector and Stock Rotation

November 24th, 2025

Executive Summary
China & HK allocations among active EM funds have recovered from their late-2024 lows, rising from 21.5% to 26%, but momentum has stalled. Positioning remains well below historical highs, and China continues to sit as a structural underweight. Ownership is just below median historical levels, and fund flows suggest a lack of clear conviction.

Beneath this top-line stasis, however, positioning has been highly active. Industrials and Materials have seen renewed inflows, while exposure to Consumer sectors has fallen. Stock-level activity shows selective rotation into names like Pop Mart and Tencent Music, alongside exits from Meituan and JD.com.

With China among the better-performing EM markets year-to-date, and many funds still holding well below prior peak allocations, the case for re-engagement is growing—should sentiment continue to shift.
Click on the Report Link below for access to the latest China & HK Market Intelligence Report, and scroll down for the chart highlights and narrative.

Country Positioning:  China Remains on Top
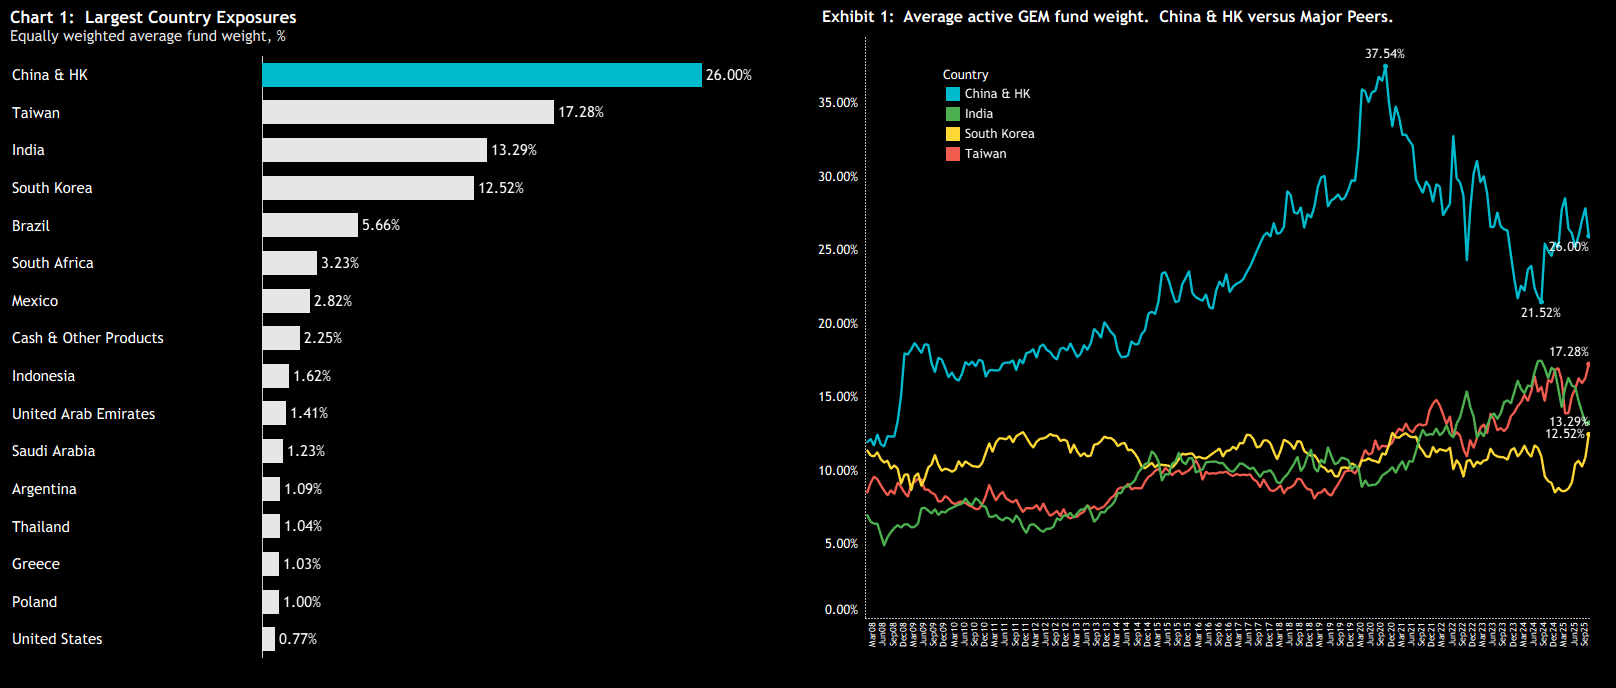
Allocations to China and Hong Kong among the GEM funds in our analysis now average 26% — a clear recovery from the late-2024 low of 21.5%, though still well below the 2020 peak of 37.5%. As exposure to China and HK has rebounded over the past two years, positioning in India has declined, while Taiwan has seen allocations rise to new highs. South Korea, typically confined to a narrow range, has also moved up from the lower end of its band.  The top 4 countries make up a combined 69.1% of the total average GEM fund portfolio.

Benchmark Positioning:  Underweight Intact
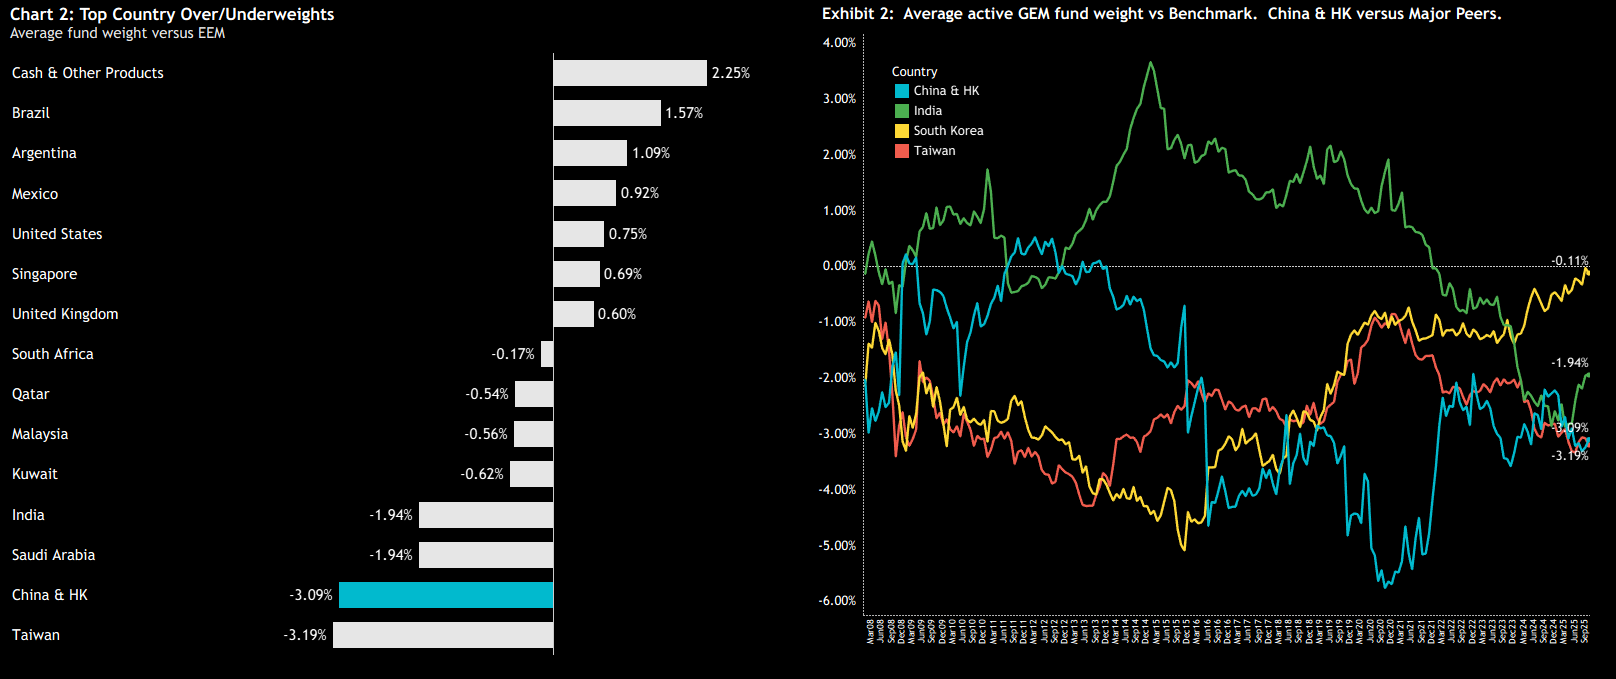
Relative to the iShares MSCI EM ETF (EEM), China & HK is the second-largest net underweight at -3.09%, just behind Taiwan at -3.19%, and ahead of India and Saudi Arabia, both at -1.94%. On the overweight side, positioning is led by cash and the major Latin American markets. Over time, allocations to South Korea have moved closer to benchmark, while Taiwan has overtaken China & HK as the largest underweight country position.

Ownership Cycles:  Momentum Stall
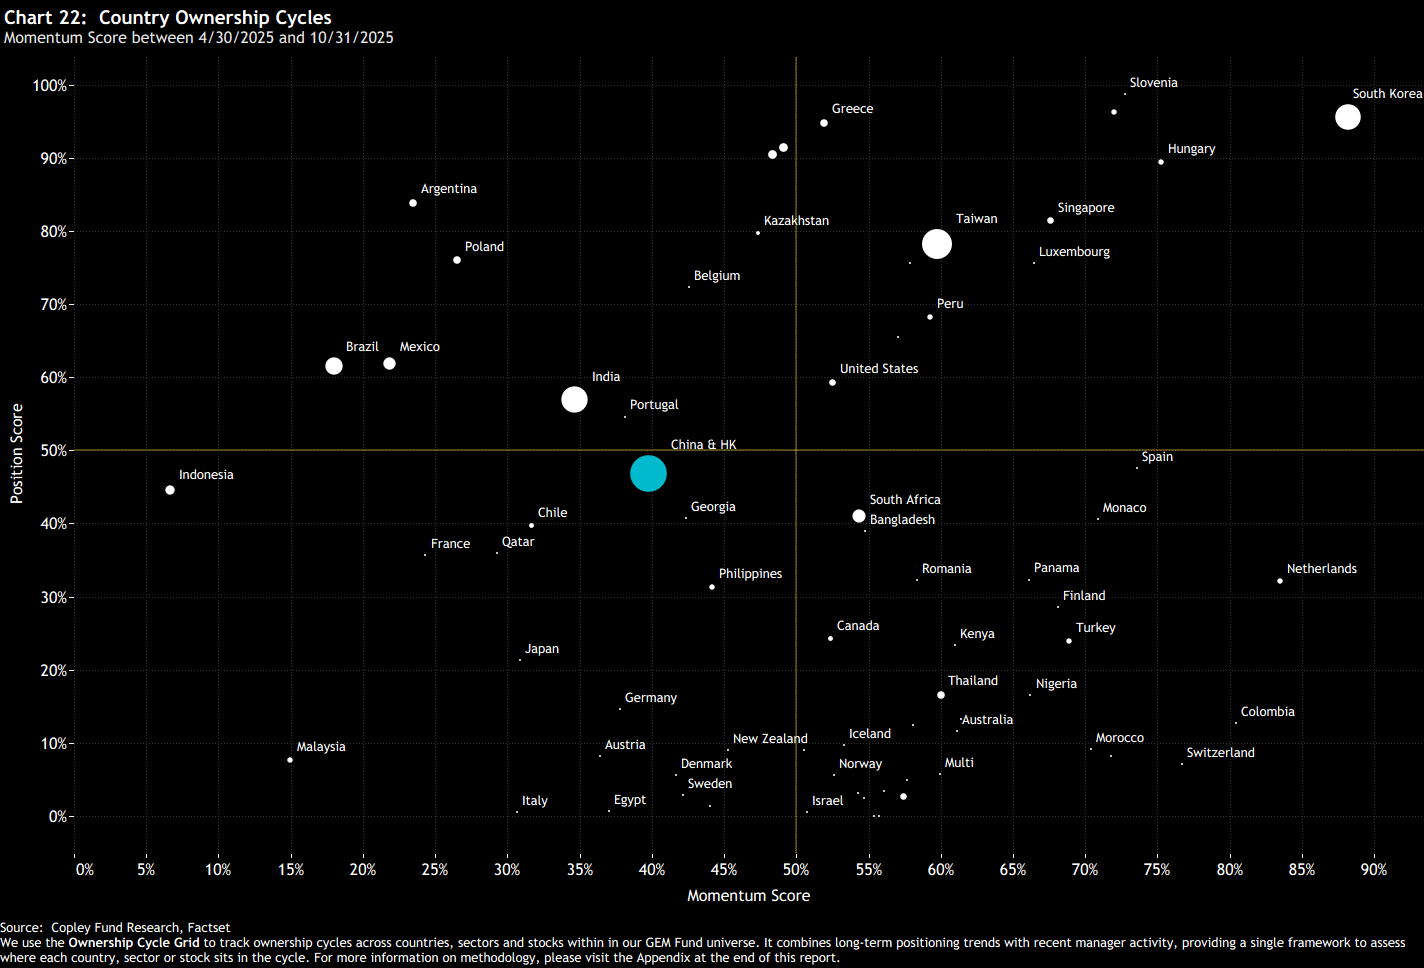
On our ownership cycle grid, China & HK sits just below its historical median in terms of fund positioning, and slightly left of center on the momentum axis. This reflects a lack of conviction rotation over the past six months—average weights have edged lower, buyer and seller counts are evenly balanced, the share of overweight funds has risen, yet fund outflows remain strong— see page 7 of the China Intelligence Report for more details.

High Active Investors are Underweight
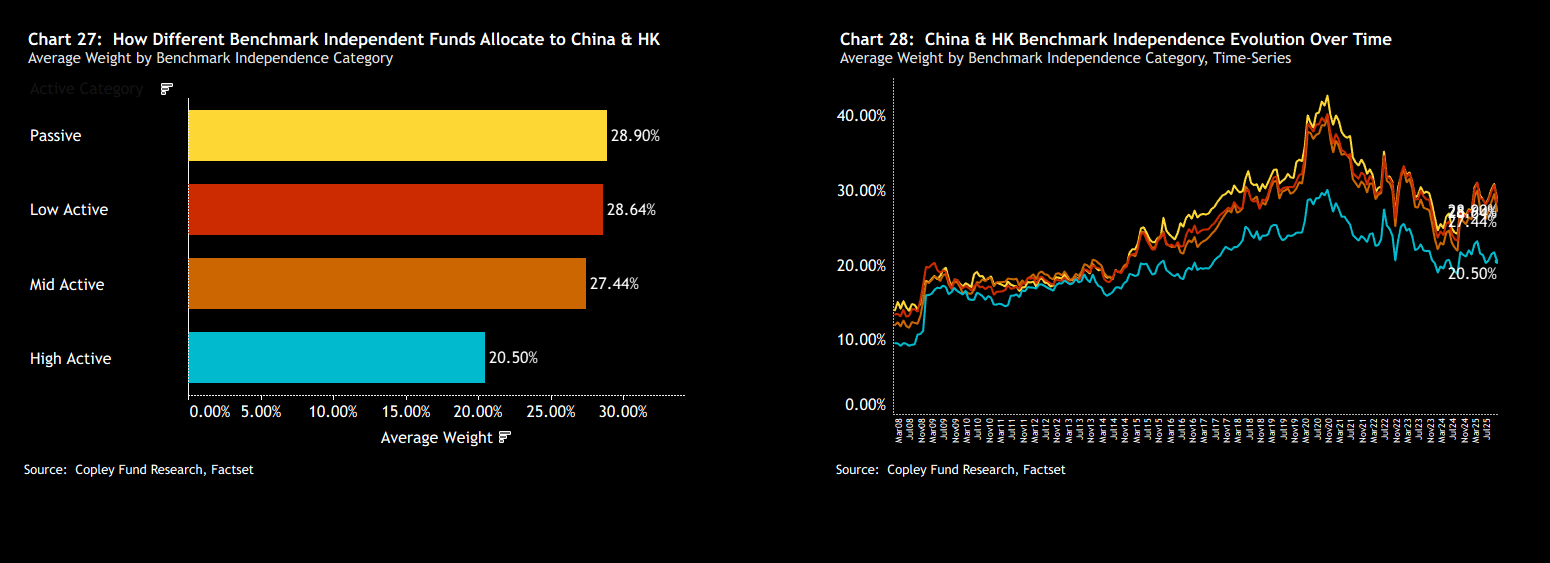
While different fund styles show fairly similar allocations to China & HK, the larger divergence appears across levels of benchmark independence. High Active funds—those with active share above 75%—are significantly more underweight China & HK compared to their mid and low active peers, and have been for the past decade.

Fund-Level Positioning
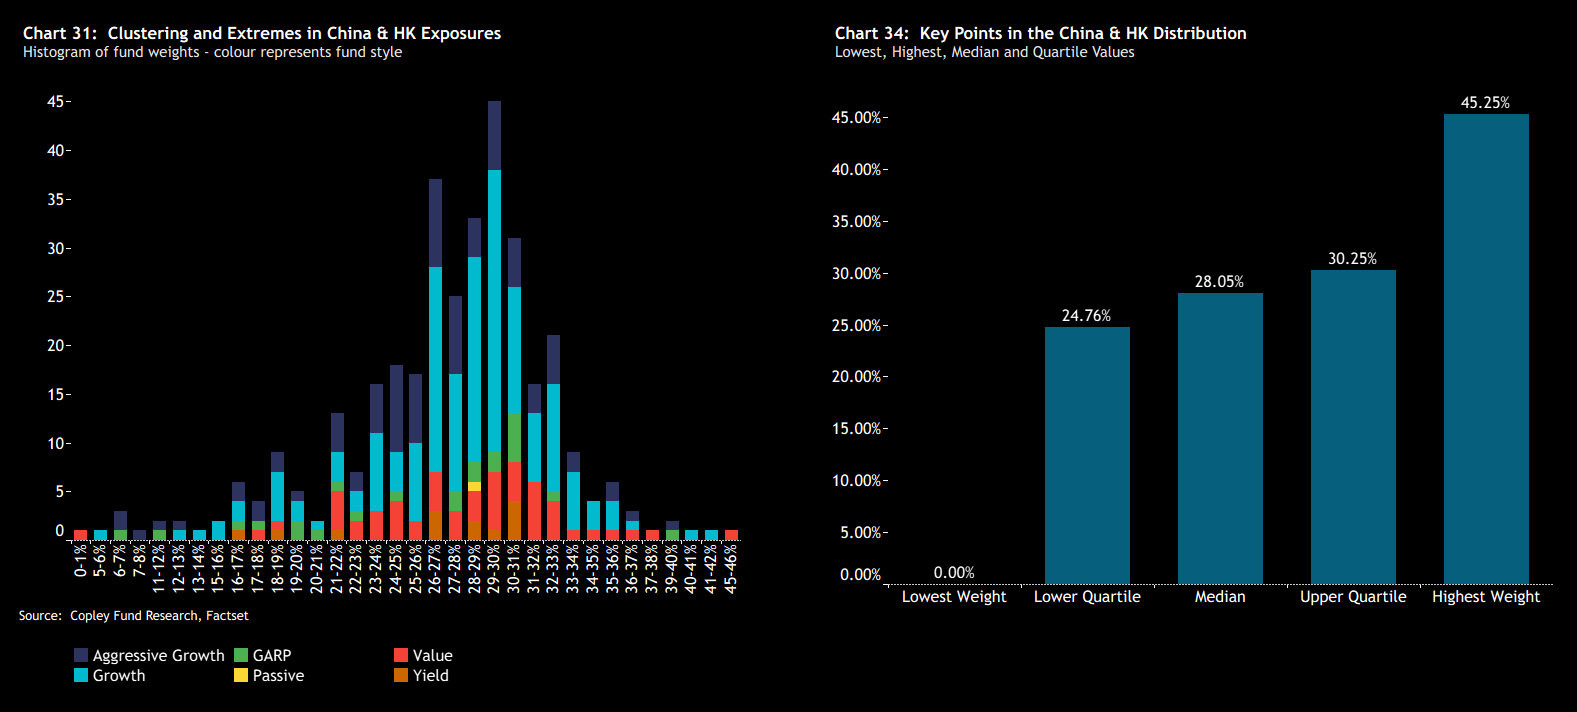
The histogram of China & HK fund weights (ch31) shows a broad distribution, ranging from zero exposure up to a high of 45.25%. Despite this range, there’s a clear concentration of funds holding between 20% and 35%. As shown in chart 34, the interquartile range is relatively tight, with 50% of funds allocating between 24.76% and 30.25%.

China & HK’s Top Investors
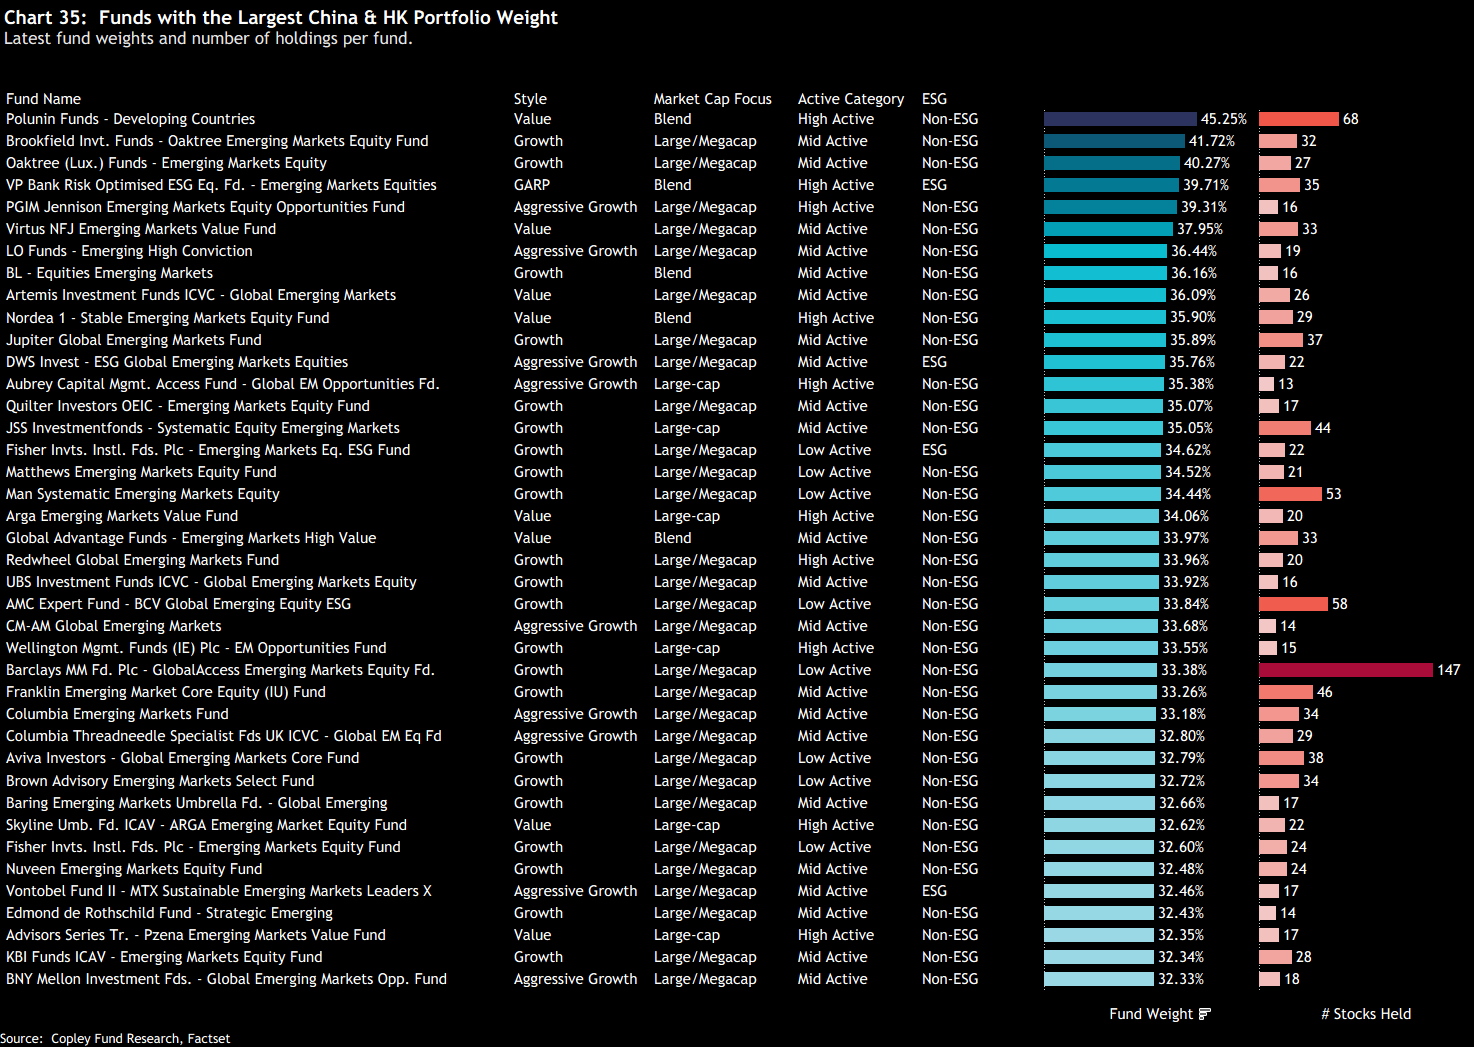
The list of largest holders of China & HK includes three funds with allocations above 40%, led by Polunin Developing Countries at 45.25% and Oaktree Emerging Markets at 41.72%. What stands out is the diversity of strategies represented—spanning Value and Growth styles, Large Cap, Megacap, and Blend exposures, as well as a mix of high, medium, and low active share funds, including some ESG-focused strategies. The depth of China’s market, with over 1,000 individual Chinese stocks held across the fund universe, makes it structurally feasible for a wide range of portfolio types to build substantial allocations.

China’s Sector Landscape
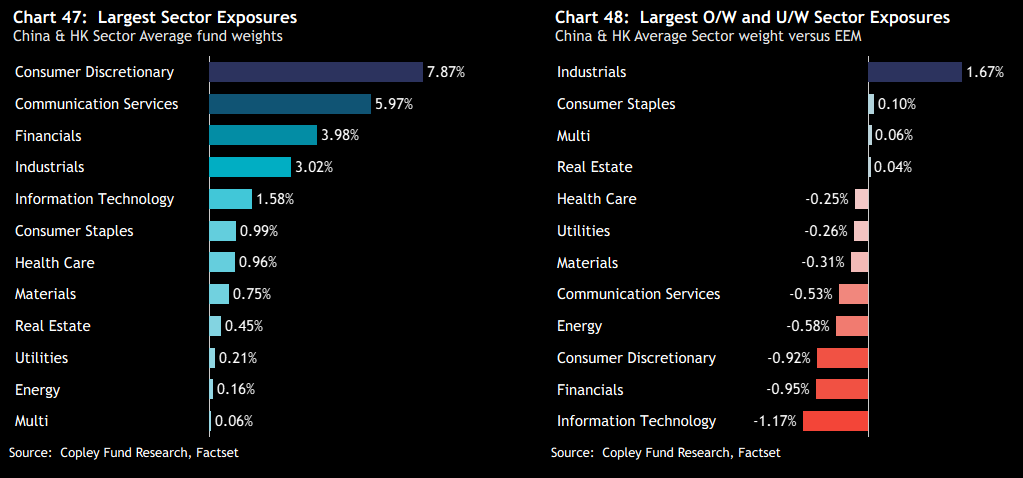
Sector positioning within the China market is dominated by heavy allocations to Consumer Discretionary, Communication Services, and Financials—together accounting for 69% of the total China exposure. Industrials stands out as the only conviction overweight, held at +1.67% above the MSCI EM index. Underweights are led by Information Technology (-1.17%), Financials (-0.95%), and Consumer Discretionary (-0.92%).

China’s Heavy Sector Rotation
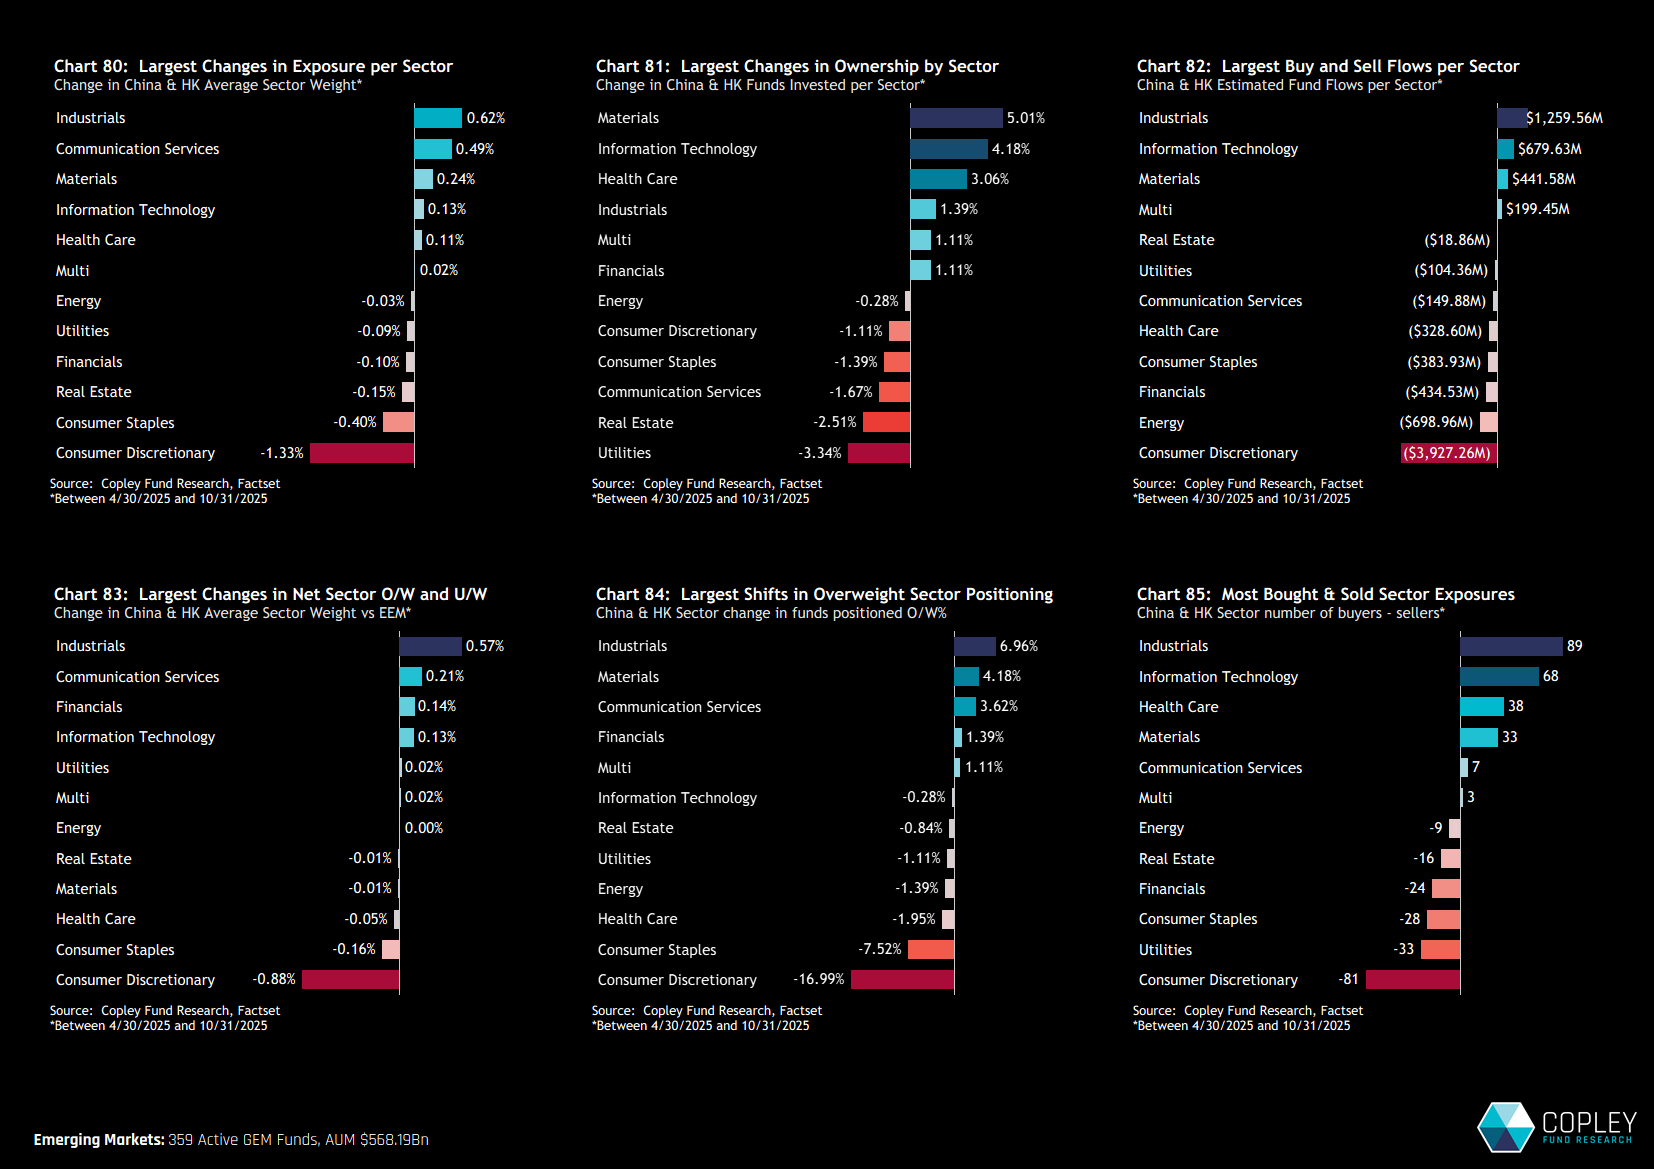
China sector rotation over the past six months stands out for the scale and clarity of positioning changes. These are active moves—driven by allocation decisions rather than passive price effects. Industrials were the primary beneficiary, with average fund weights rising by 0.62%, 1.4% of funds initiating exposure, $1.3bn in net inflows, a clear buyer tilt, and a +0.57% rise in net overweight. Materials also saw renewed interest, with 5% of GEM funds opening new positions. On the other side, Utilities, Consumer Discretionary, and Consumer Staples experienced broad reductions in exposure, with most ownership metrics trending lower.

China & HK Stock Ownership Picture
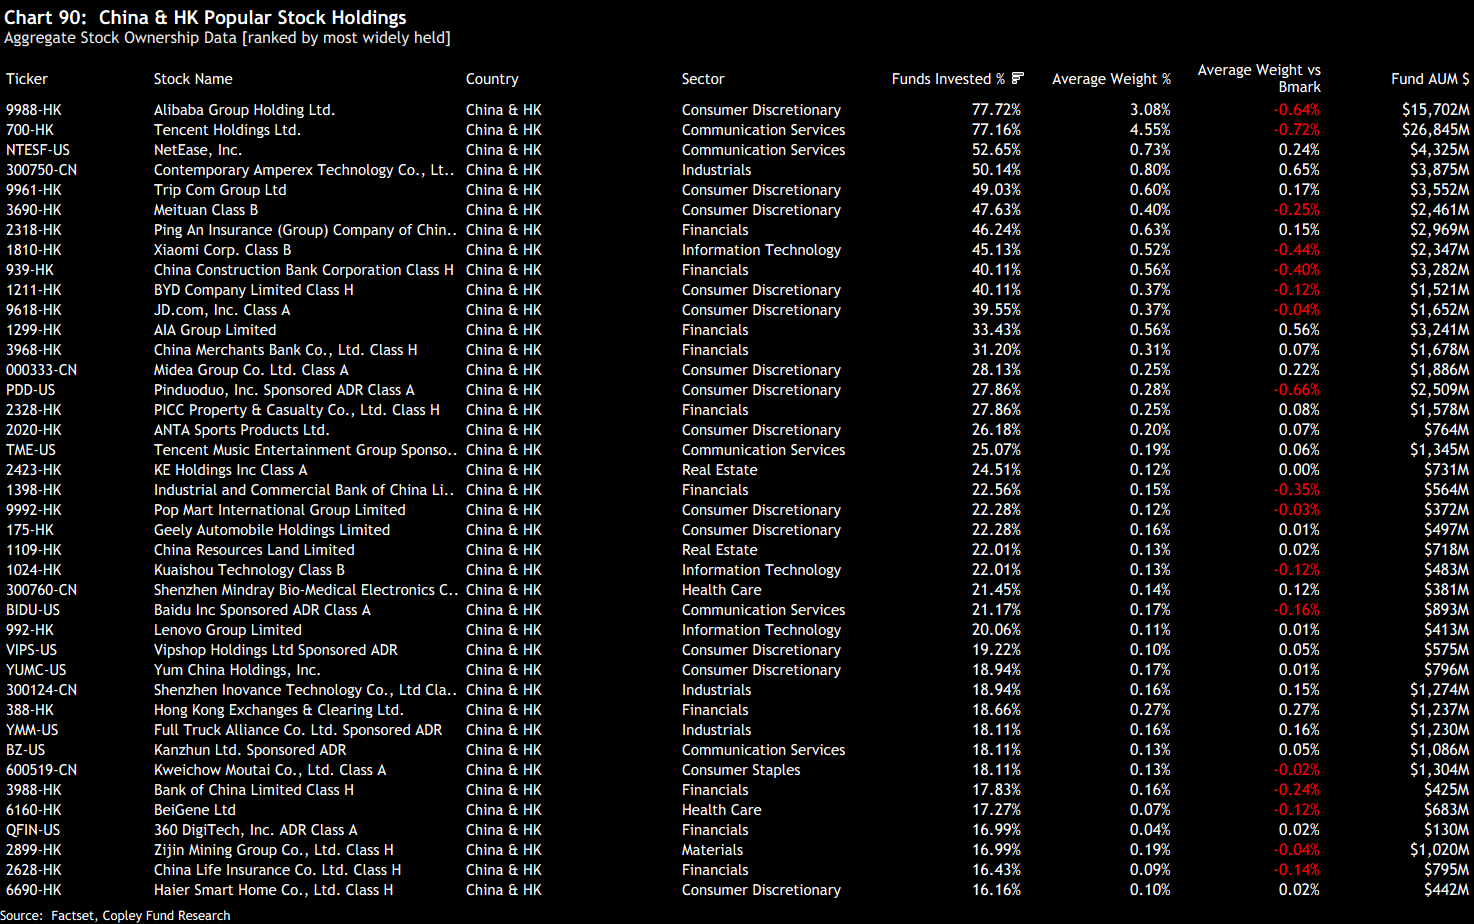
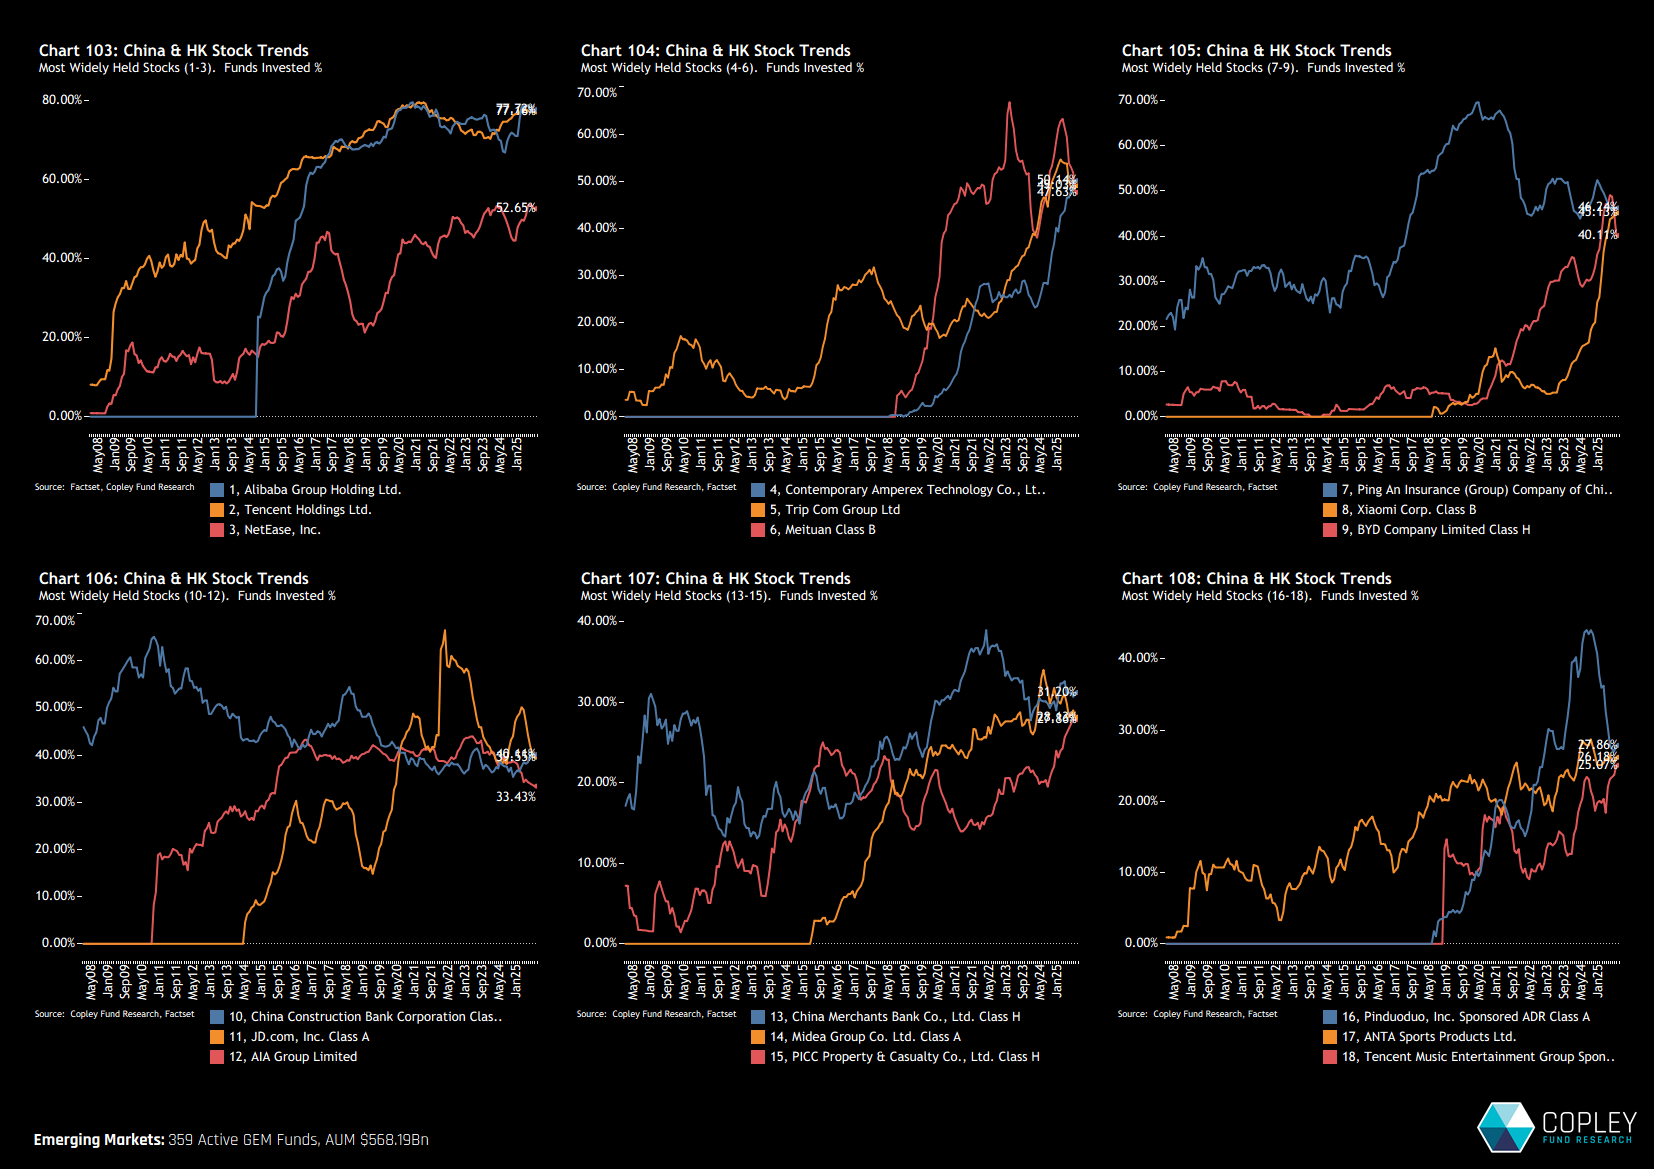
Despite the vast breadth of investable companies in China & HK, positioning remains heavily concentrated at the top end of the benchmark. Alibaba and Tencent are held by just over 77% of the active EM funds in our analysis, with average weights of 3.08% and 4.55%, respectively—both below their MSCI EM index weights. Beyond these, only NetEase and Contemporary Amperex Technology are held by more than half of the managers in our analysis. On the underweight side, notable names include Pinduoduo, Xiaomi Corp, and several of the large state-run Chinese banks.

Stock Rotation:  Big Shifts in Stock Ownership
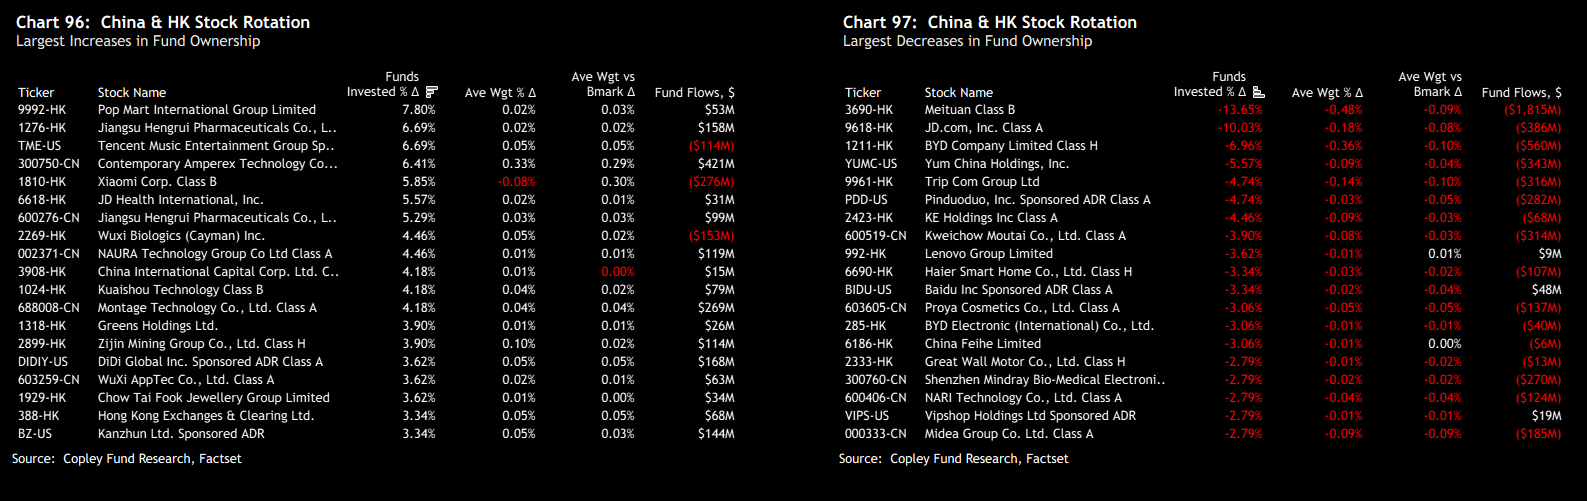
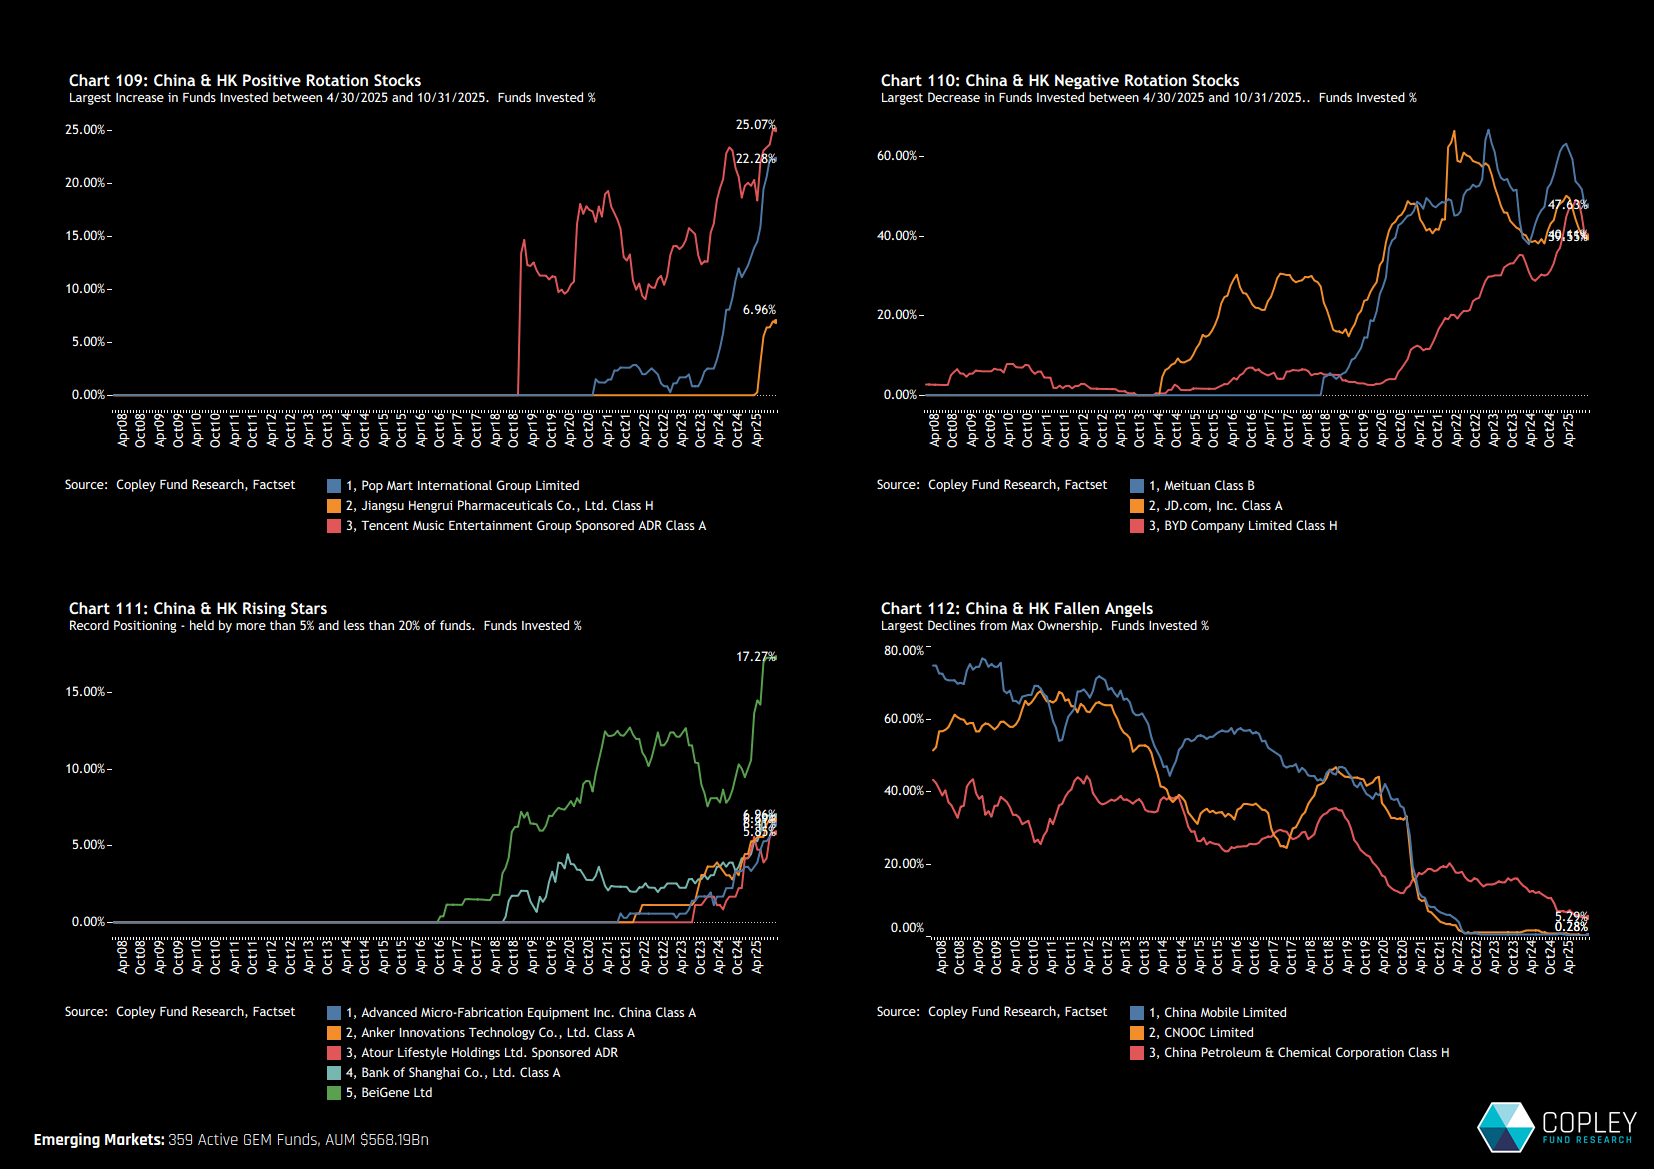
Over the last six months, there has been notable rotation at the company level. The left-hand chart below shows a net 7.8% of active EM funds in our analysis initiating positions in Pop Mart International, with a further 6.7% opening exposure to both Jiangsu Hengrui Pharma and Tencent Music Entertainment. On the other side, Meituan and JD.com saw net outflows, with -13.7% and -10% of funds fully closing their positions.

The Big Fund-Level Stock Moves
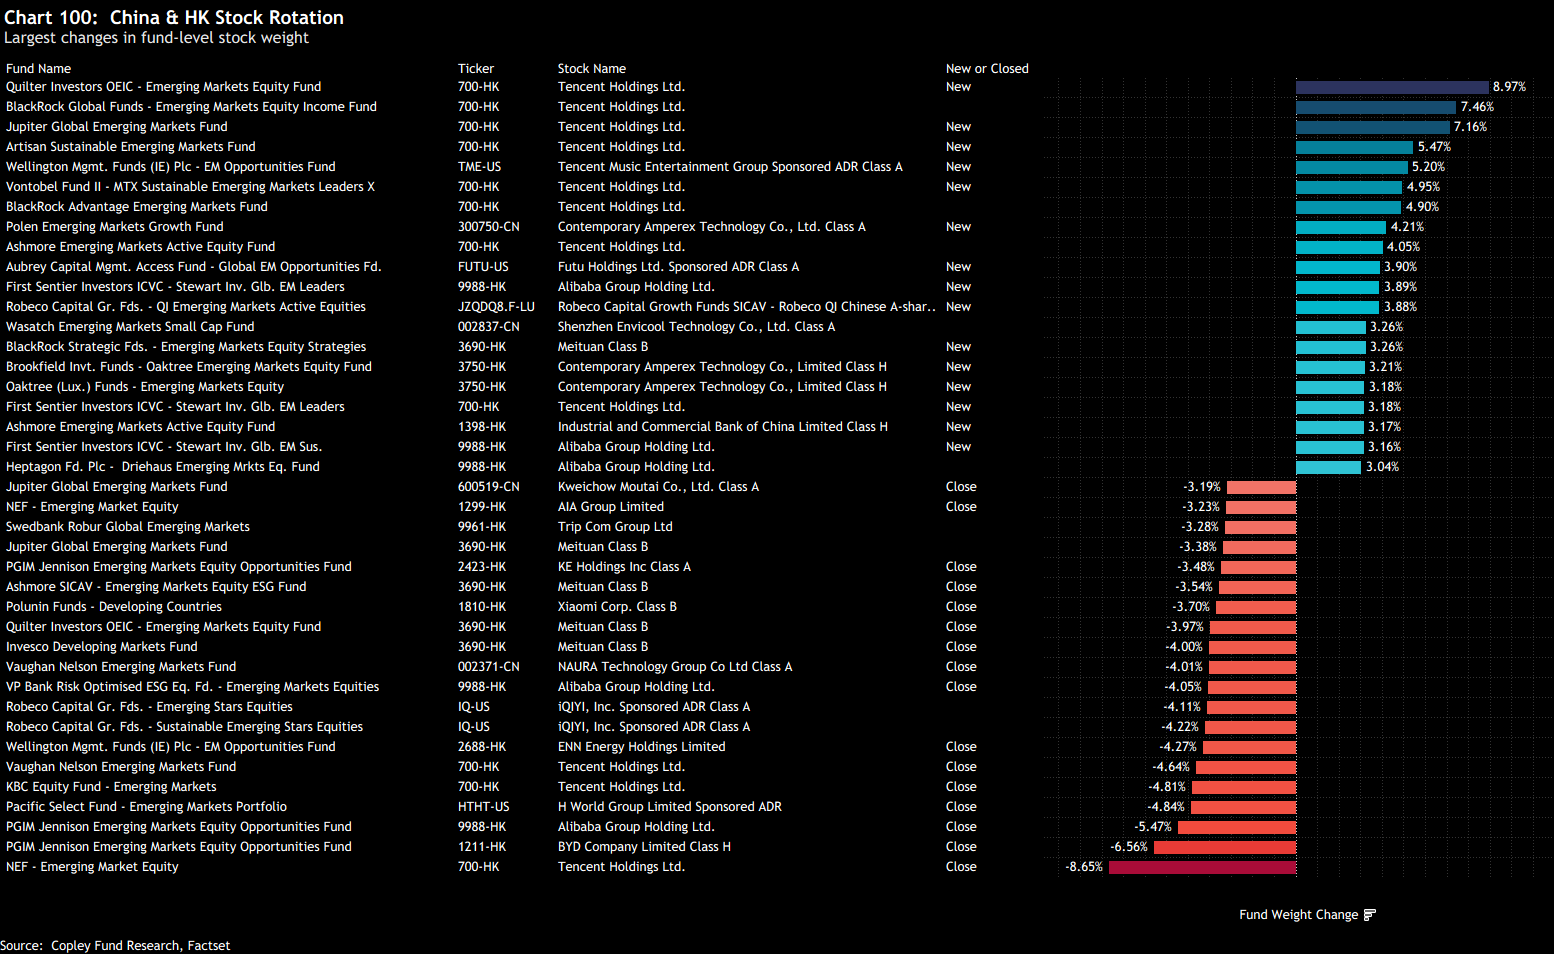
Tencent Holdings tops the list of largest individual company weight increases, with sizeable new positions from Quilter Emerging Market (8.97%), Jupiter Emerging Markets (7.16%), and Artisan Sustainable EM (5.5%). Alibaba Group Holding and Contemporary Amperex Technology also ranked among the larger additions. On the sell side, Tencent and Alibaba appeared again, alongside Meituan, where Invesco, Quilter, and Ashmore were among the funds closing exposure.

Stock Ownership Trends
The six charts below track the progression of fund ownership across the 18 most widely held names in the China & HK market. Chart 103 highlights the clear lead held by Alibaba and Tencent over NetEase—a structural pattern that has persisted for the past decade. Notable long-term shifts include Xiaomi Corp (chart 105), where ownership has climbed from near zero to over 40% in just over two years. Pinduoduo (chart 108) has seen a sharp decline in ownership since its 2024 peak, while Contemporary Amperex Technology has rapidly gained traction, entering the top five most widely held Chinese stocks over a similar period.

Selected Stock Highlights
Chart 109 shows the companies with the strongest six-month rotation into active EM portfolios, led by Pop Mart, Jiangsu Hengrui Pharma, and Tencent Music—all reaching new highs in fund ownership. In contrast, Meituan, JD.com, and BYD have seen notable declines, reversing prior upward trends—though ownership in all three remains strong. Chart 111 highlights five stocks where ownership is at record highs but still below 20% of the fund universe. These names warrant closer attention, combining recent momentum with significant room for broader adoption. Finally, chart 112 shows China Mobile, CNOOC, and China Petroleum & Chemical continuing their long fade from the EM fund landscape, having once held much greater prominence.

Can China Recover Past Highs?
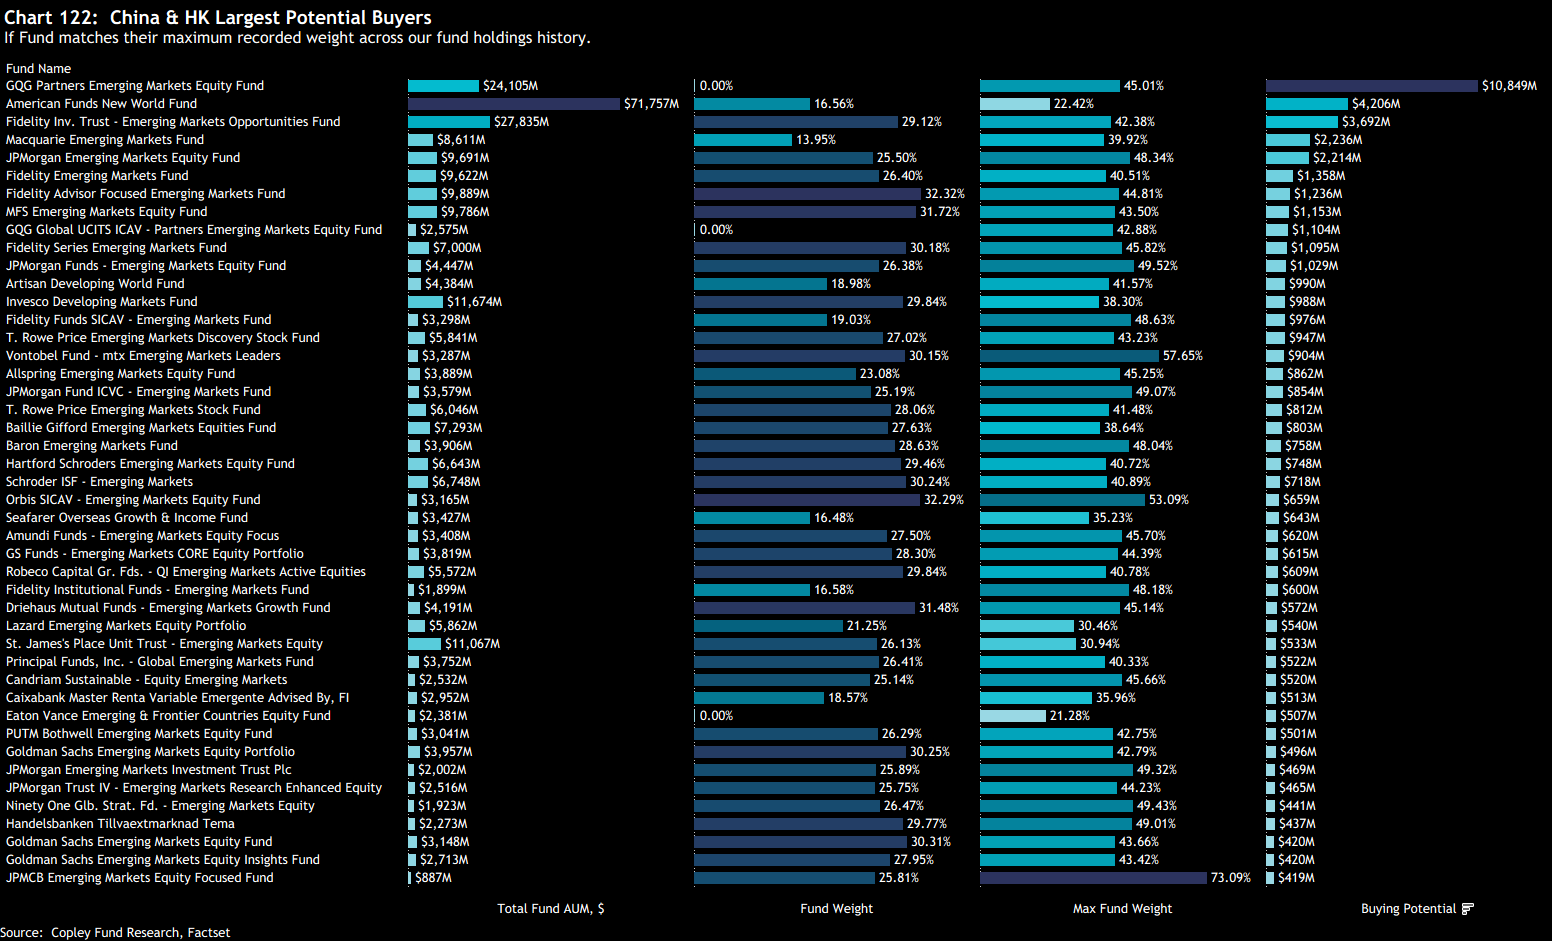
While China remains the largest country allocation by a wide margin, the current average weight of 26% sits well below prior highs. All aggregate exposures in our analysis—country, sector, and stock—are built from the bottom up, and many individual EM funds remain significantly underweight relative to their historical peaks. Below, we highlight a group of funds with the largest potential buy-side impact, based on their current AUM and the gap between today’s China weight and their past maximum exposure.

While overall China allocations remain muted compared to past highs, the scale of underlying rotation suggests investors are actively reshaping their exposure. With performance strengthening and positioning gaps still wide open, the potential for a broader re-engagement remains firmly on the table.

Terms and Conditions

Investor Positioning Report — Copley Fund Research Ltd  ·  Last updated: July 2026  ·  Registered in England and Wales

1. Who we are

Copley Fund Research Ltd provides proprietary institutional fund intelligence to listed companies and investor relations professionals. These terms govern every purchase of an Investor Positioning Report. By completing a purchase you confirm you have read, understood, and agreed to these terms in full.

2. What you are purchasing

The Investor Positioning Report is a bespoke PDF report mapping the institutional fund universe around your stock. It covers current investors, past investors, competitor investors, and white space investors. Every report is built from scratch for the specific company ordered and is not a standardised or templated product.

3. Delivery and process

Following payment or invoice issuance, Copley Fund Research will contact you within one working day to agree your competitor set. Production begins once the competitor set is confirmed in writing. The completed report will be released to you within 48 hours of production starting, provided payment has been received in full; where payment is outstanding, the report will be withheld until payment clears. If the requested company falls outside our covered fund universes, or a competitor set cannot be agreed, Copley Fund Research will issue a full refund or cancel the outstanding invoice.

4. Competitor set agreement

The competitor set is agreed with you in writing prior to production, and the report is built to that agreed specification. Requests to amend the competitor set after delivery, based on a change of preference rather than an error, may be treated as a new order.

5. Refund policy

Because each report is produced individually for your company, orders are non-refundable once production has begun, except as set out in clauses 3 and 5a below. By purchasing, you agree not to dispute the charge with your card provider on the basis that the service was not as described, provided the report has been delivered to the agreed specification or corrected under clause 5a.

5a. Quality remedy

If a delivered report contains a material error caused by Copley Fund Research — for example, an incorrect company analysed, a competitor omitted from the agreed set, or content missing from the specification in clause 2 — Copley Fund Research will correct and redeliver the report at no additional charge, within a reasonable timeframe. This is your sole remedy for such errors.

6. Data and accuracy

All fund positioning data in the report reflects holdings as disclosed at the most recently available reporting date at the time of compilation. The timing of fund holdings disclosures is determined by regulatory requirements applicable to each fund and is outside the control of Copley Fund Research Ltd. This data may not reflect current fund positions. Copley Fund Research takes reasonable care to ensure accuracy but makes no warranty, express or implied, as to the completeness or current accuracy of the underlying data — though this does not affect the quality remedy in clause 5a for errors in how that data was analysed or presented. Past fund positioning is not indicative of future fund behaviour or investment decisions.

7. Not investment advice

The Investor Positioning Report is produced for investor relations intelligence purposes only. It does not constitute investment advice, financial advice, or a recommendation to buy, hold, or sell any security. The data reflects historical fund positioning and must not be relied upon as a prediction of future fund behaviour or investment decisions. Copley Fund Research Ltd is not authorised or regulated by the Financial Conduct Authority for the provision of investment advice.

8. Permitted use and confidentiality

The report is licensed for internal use by the purchasing organisation only. You may share it with employees and directors of your organisation. You may not: reproduce, redistribute, publish, or resell the report or any part of it; share it with any third party outside your organisation without prior written consent; use the fund or portfolio manager names contained in the report to approach those individuals on behalf of Copley Fund Research or in a manner that could damage Copley Fund Research's relationships with those funds; or use the data for any purpose other than your own investor relations strategy. The data, analysis, and methodology contained in the report are the intellectual property of Copley