Communication Services: Lowest Exposure on Record
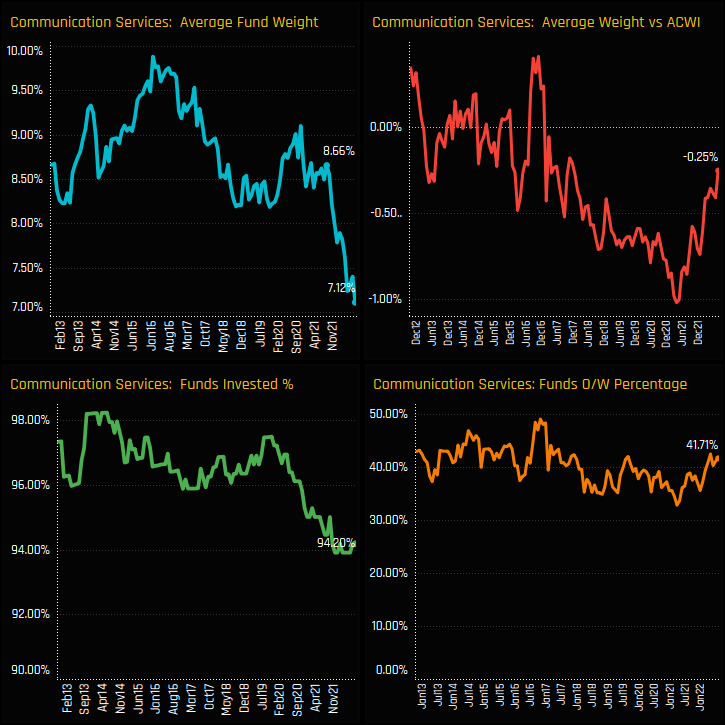
Charts clockwise from top to bottom
- Communication Services allocations among active Global managers are at their lowest levels on record. Average weights stand at an all-time low of 7.12%, having broken out of a decade long range of between 8% – 10% towards the end of 2021. Some of this decline was down to active rotation, with the percentage of funds invested in the sector dropping to 94.2%, though the decreasing underweight infers some of the allocation shift was down to underperformance in key stock underweights.
- Versus sector peers, Communication services are now the 7th largest sector allocation and a minor underweight versus the iShares ACWI index. Information Technology remains the standout sector holding on an absolute basis, with funds running underweights in Energy and Financials and overweights in Health Care and Industrials.
- The bulk of the holdings distribution sits between 5% and 10%, with quite an extended tail to the upside led by Schroders Global Equity Yield (23.6%) and Longleaf Partners Global (22.36%). On average, the sector is preferred by GARP and Value investors, with Aggressive Growth and Yield funds less represented among the larger holders.
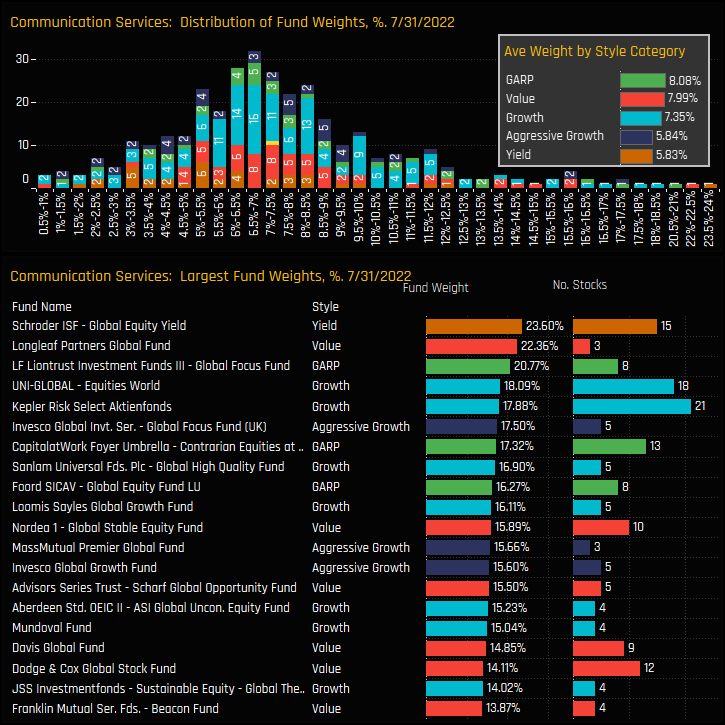
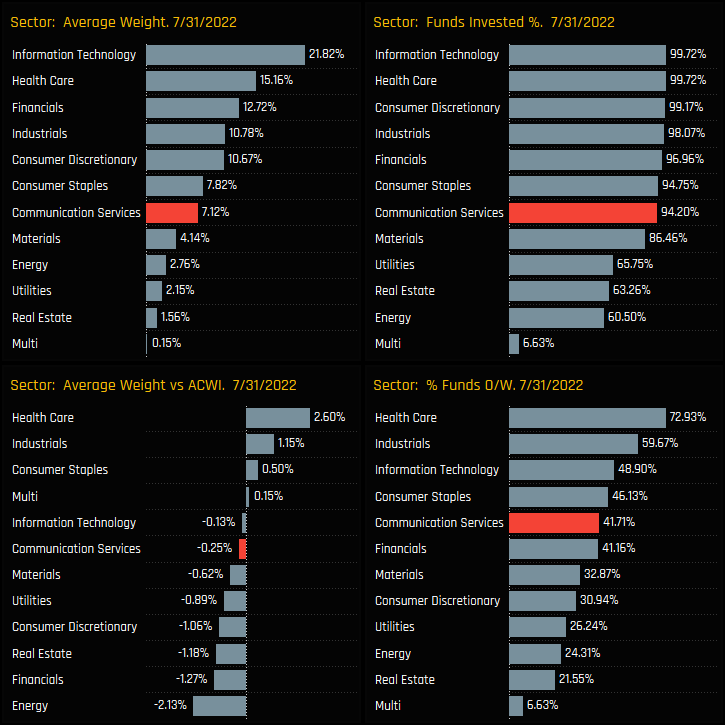
(clockwise from top)
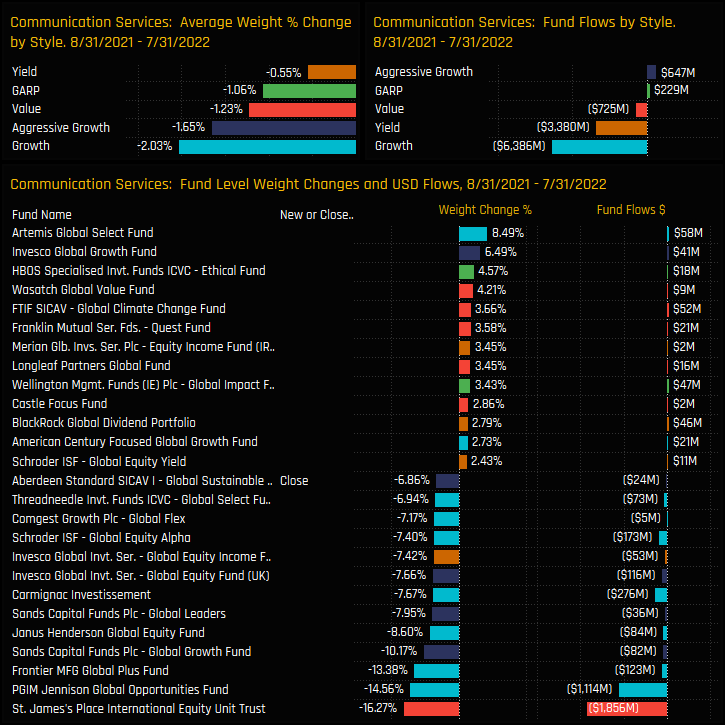
- The fund holding changes between the most recent high in August 2021 and the end of July 2022 highlight the imbalance in fund activity. All Style groups saw allocations fall, with the larger changes in fund weight on the sell side, led by St. James Place Equity Trust (-16.27%) and PGIM Jennison Global Opportunity (-14.56%).
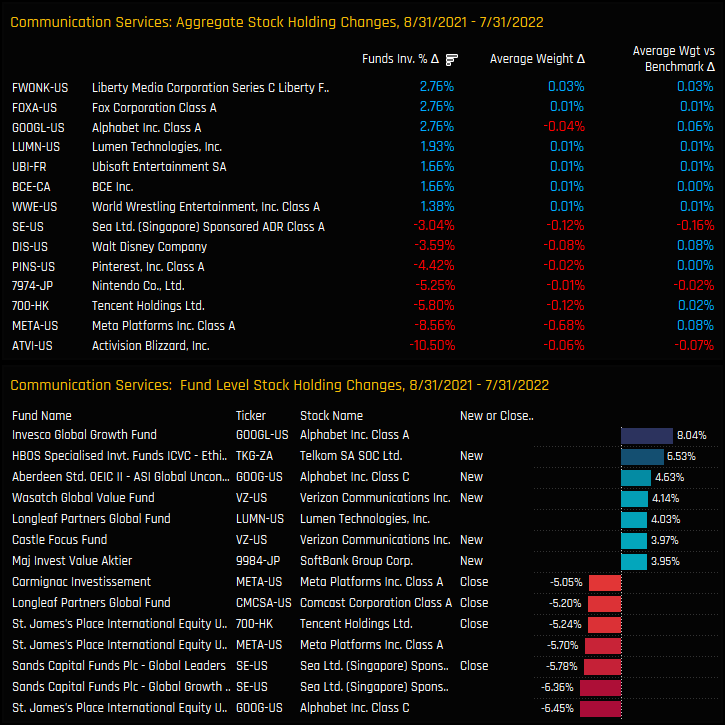
- On a stock level, Activision suffered the worst of the position closures, losing investment from -10.5% of the funds in our analysis, alongside Meta Platforms (-8.6%), Tencent (-5.8%) and Nintendo (-5.25%) between 08/31/2021 and 07/31/2022. All of the companies that lost investors contributed to the net drop in average sector weight, led by Meta Platforms (-0.68%), Walt Disney (-0.12%) and Tencent (-0.12%).
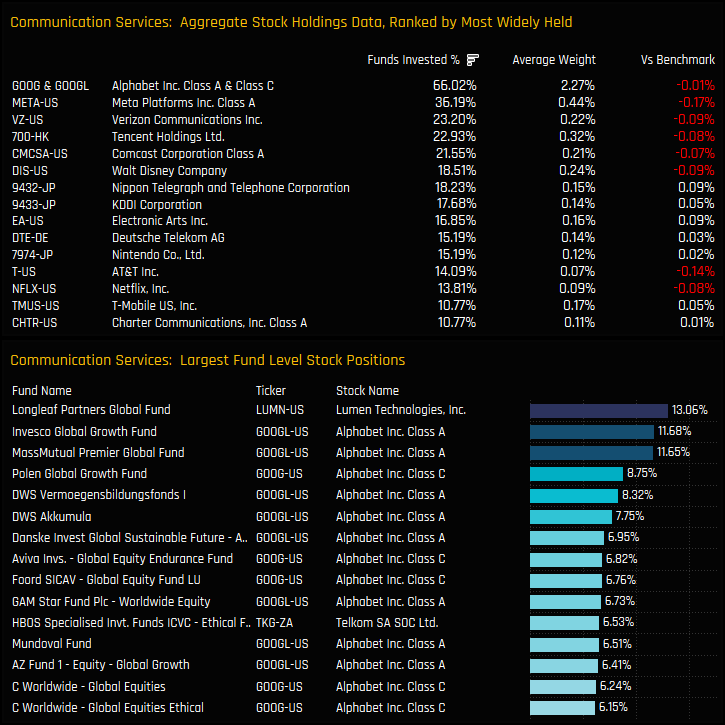
- This leaves the combined listings of Alphabet Class A and Class C as the dominant holdings in the sector, held by 66% of Global managers at an average weight of 2.27%, largely in line with the benchmark. The 2nd tier of Meta Platforms, Verizon Communications and Tencent Holdings are held by significantly less funds and all underweight the benchmark, on average. Aside from Longleaf Global’s 13.1% position in Lumen Technologies, Alphabet Class A or Class C occupy the majority of the high conviction fund level positions in the sector.
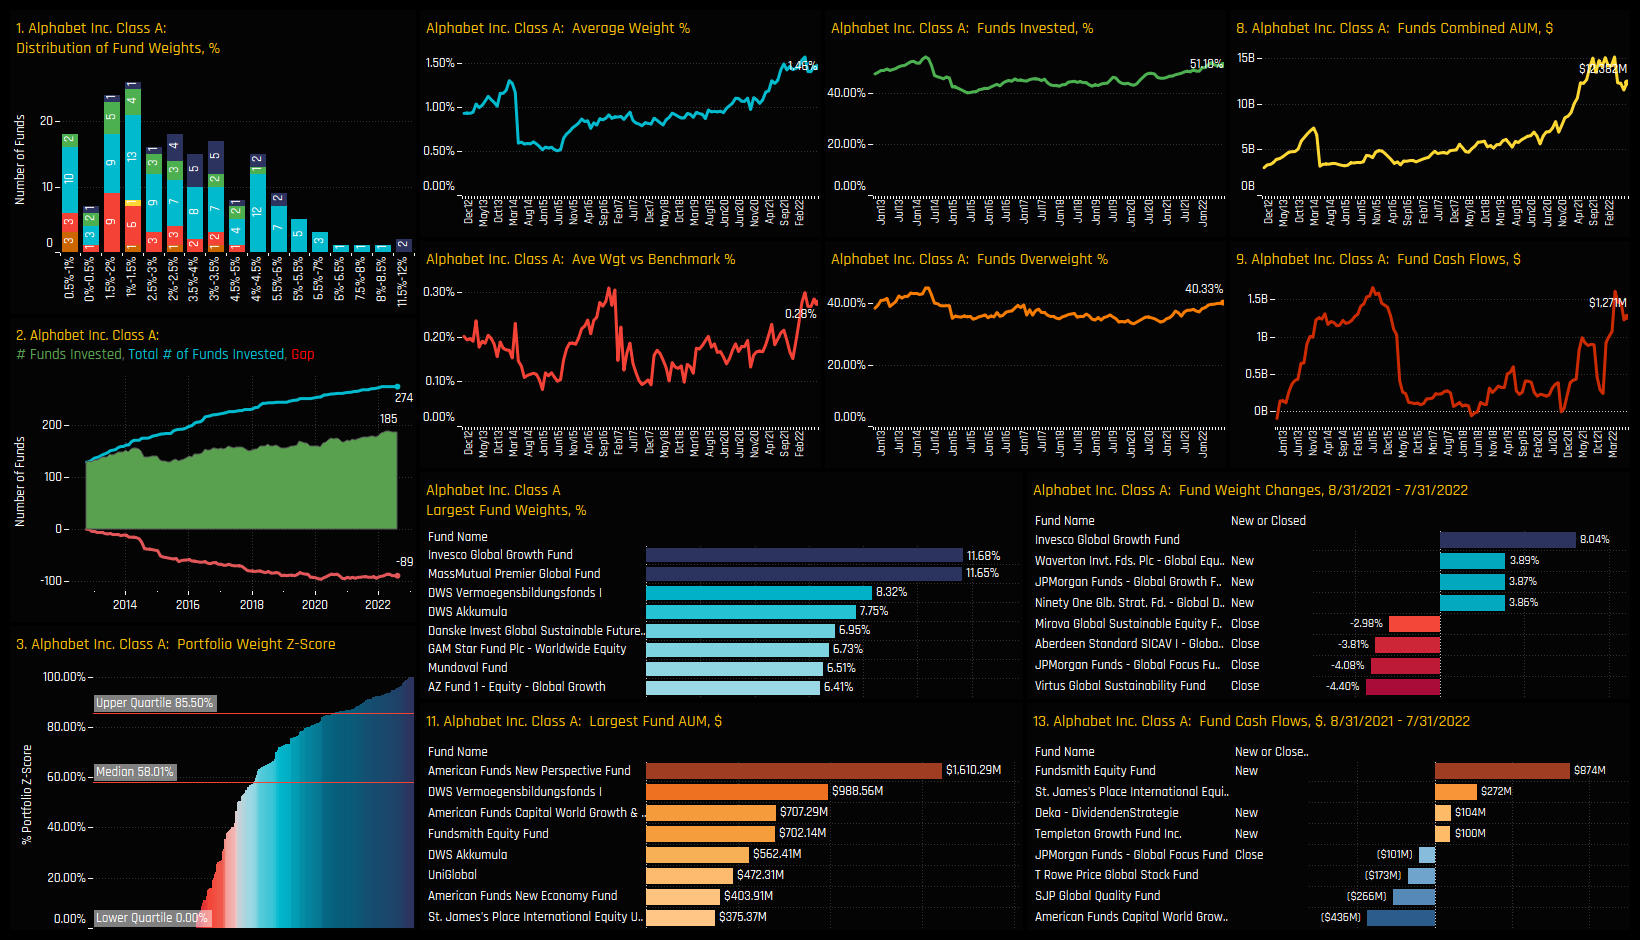
Not only has this reduction in 2nd tier holdings pushed Communication Services allocations to their lowest levels on record, but it has also reduced diversification, with Alphabet Inc now accounting for a record 31.8% of total sector exposure.
Stock Profile: Alphabet Inc Class A
Stock Profile: Meta Platforms

Click on the link below for the latest data report on Communication Services positioning among active Global funds.
Taiwan Technology: Pause and Reverse
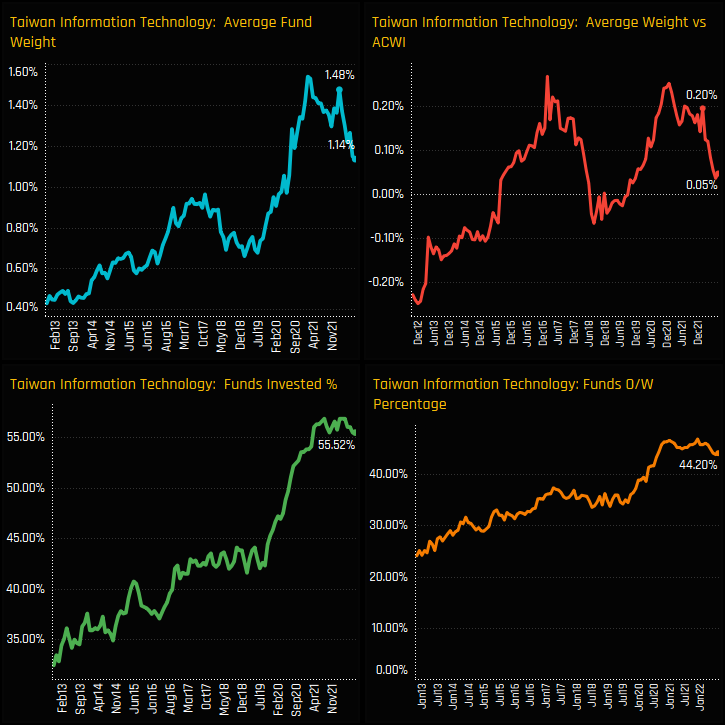
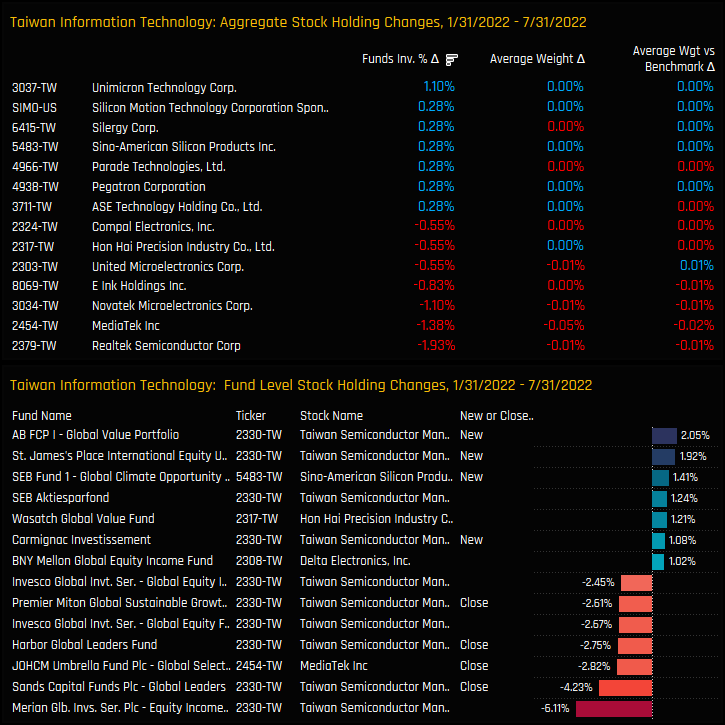
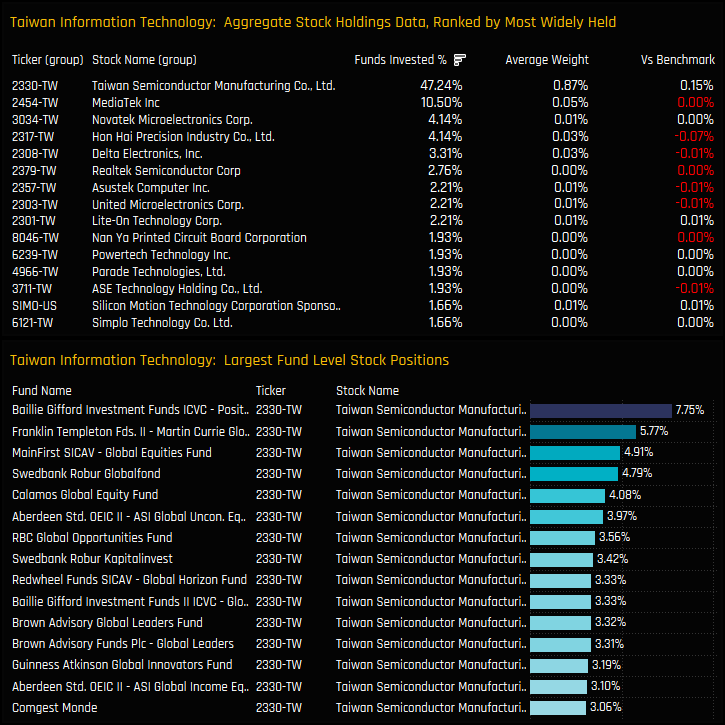
(clockwise from top)
- Sentiment in Taiwan Technology stocks is in a fragile state. The COVID induced rally between 2020 and 2021 saw the percentage of funds invested in Taiwan Technology increase from 42% to a peak of 56.9% early this year. Whilst we have seen some closures from global managers, most remain invested, though some underperformance has caused average weights to fall from 1.48% early this year to 1.14% today. The question is, how many will keep the faith now that COVID risks have started to diminish?
- There is little debate to where the risks lie for active investors within the sector. Taiwan Semiconductor Manufacturing accounts for 0.87% of the total 1.14% sector weight. It is held by 47.24% of the global funds in our analysis, some way ahead of MediaTek Inc (10.5%) and Novatek Microelectronics (4.14%). All of the largest 15 stock positions in the sector are taken up by TSMC.
- Up until now, investors are continuing to back TSMC, with investment levels remaining unchanged this year as investors make minor adjustments in smaller holdings instead. Realtek Semiconductor lost 1.93% of investors, MediaTek Inc -1.38% whilst Unimicorn Technology Corp gained +1.1%.
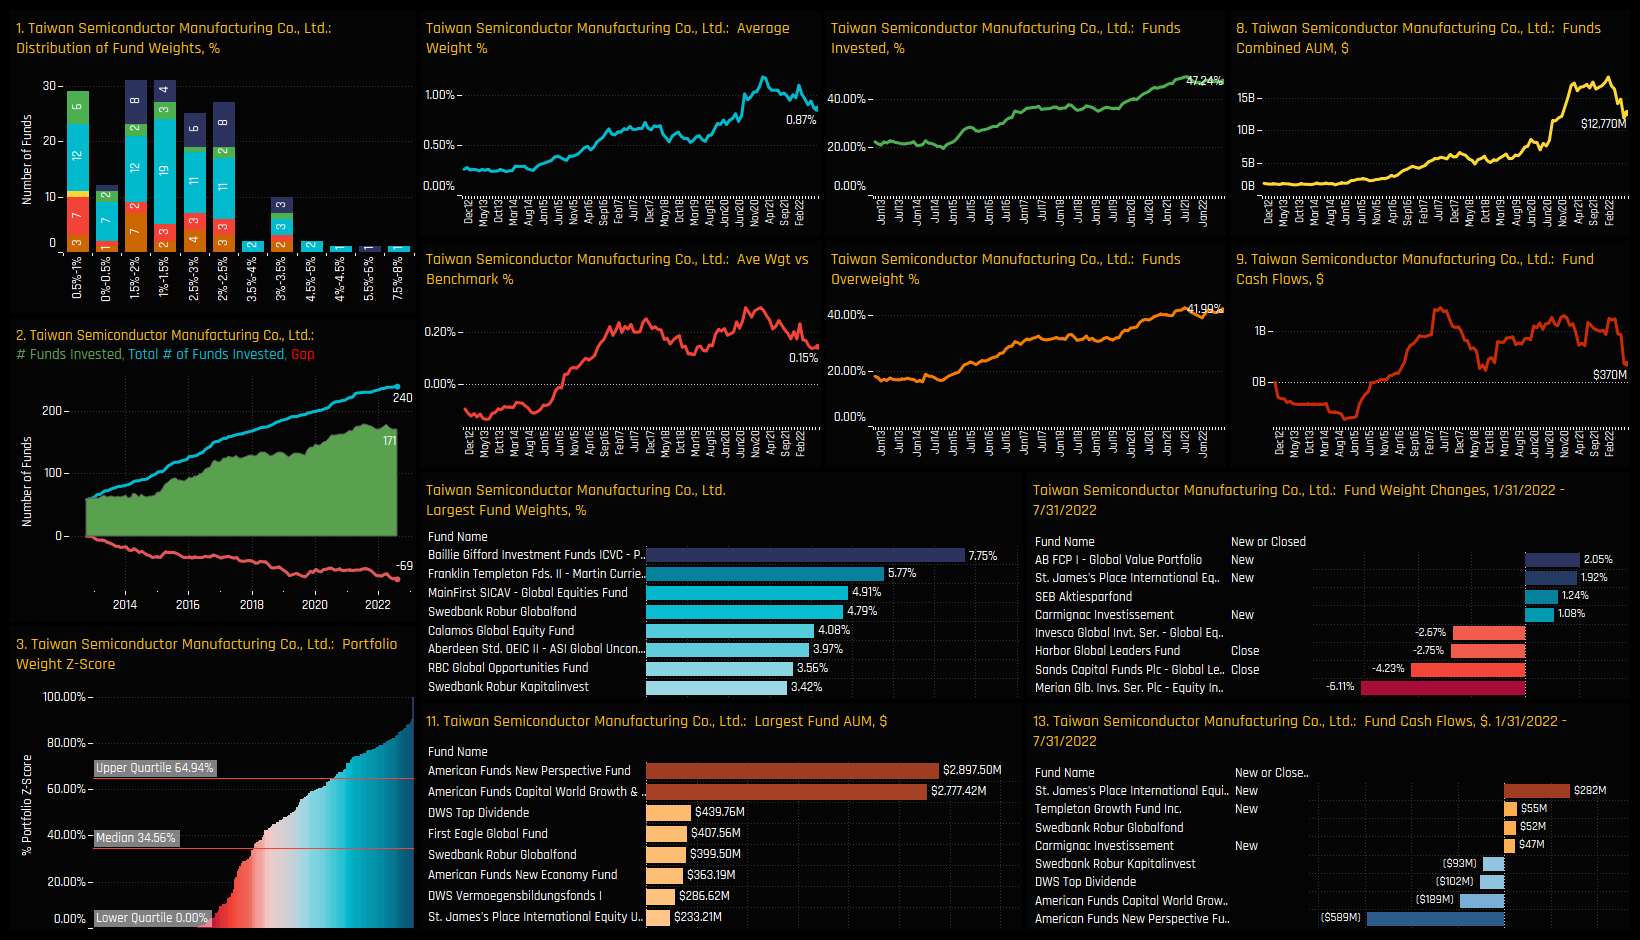
But all all eyes remain on TSMC. With 44% of managers positioned overweight the benchmark and a cohort of new investors since the COVID-19 pandemic – how many will have the appetite to stick through any further underperformance.
Stock Profile: Taiwan Semiconductor Manufacturing Co
Click on the link below for the latest data report on Taiwan Technology positioning among active Global funds.
Australia: Sleeping Giant Awakes
(clockwise from top)
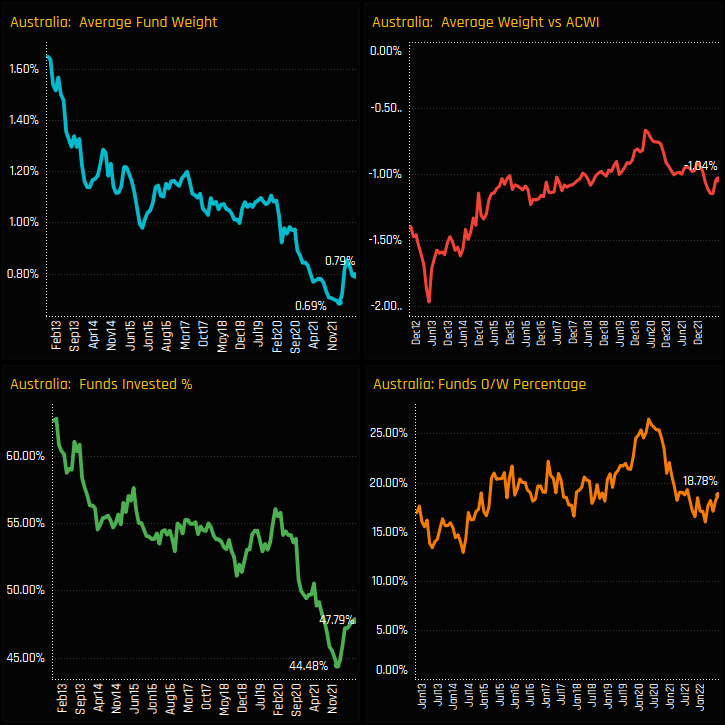
The long-term decline in Australia exposure is showing signs of stabilizing. The ownership lows were printed earlier this year, with 44.5% of managers invested at an average weight of 0.69%, but since then selected funds have started to buy back in. Australia is still a long way from a high conviction holding, being one of the larger country underweights at -1.04% below benchmark, but the recent uptick hints at a change in sentiment among selected managers.
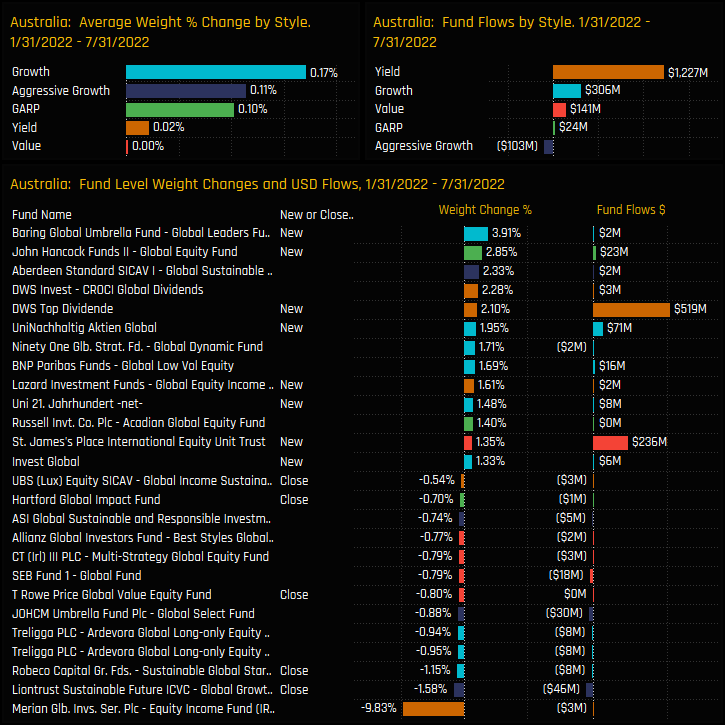
Fund activity over the last 6-months hasn’t been exclusively positive, though generally paints to a more constructive picture. Growth, Aggressive Growth and GARP strategies saw allocations increase the most, led by new positions from Baring Global Leaders (+3.91%) and John Hancock Global Equity (+2.85%).
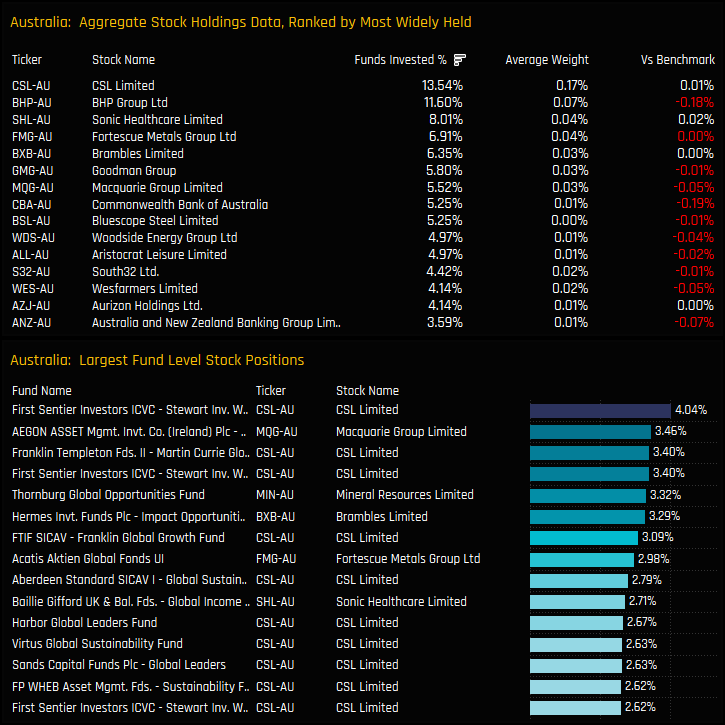
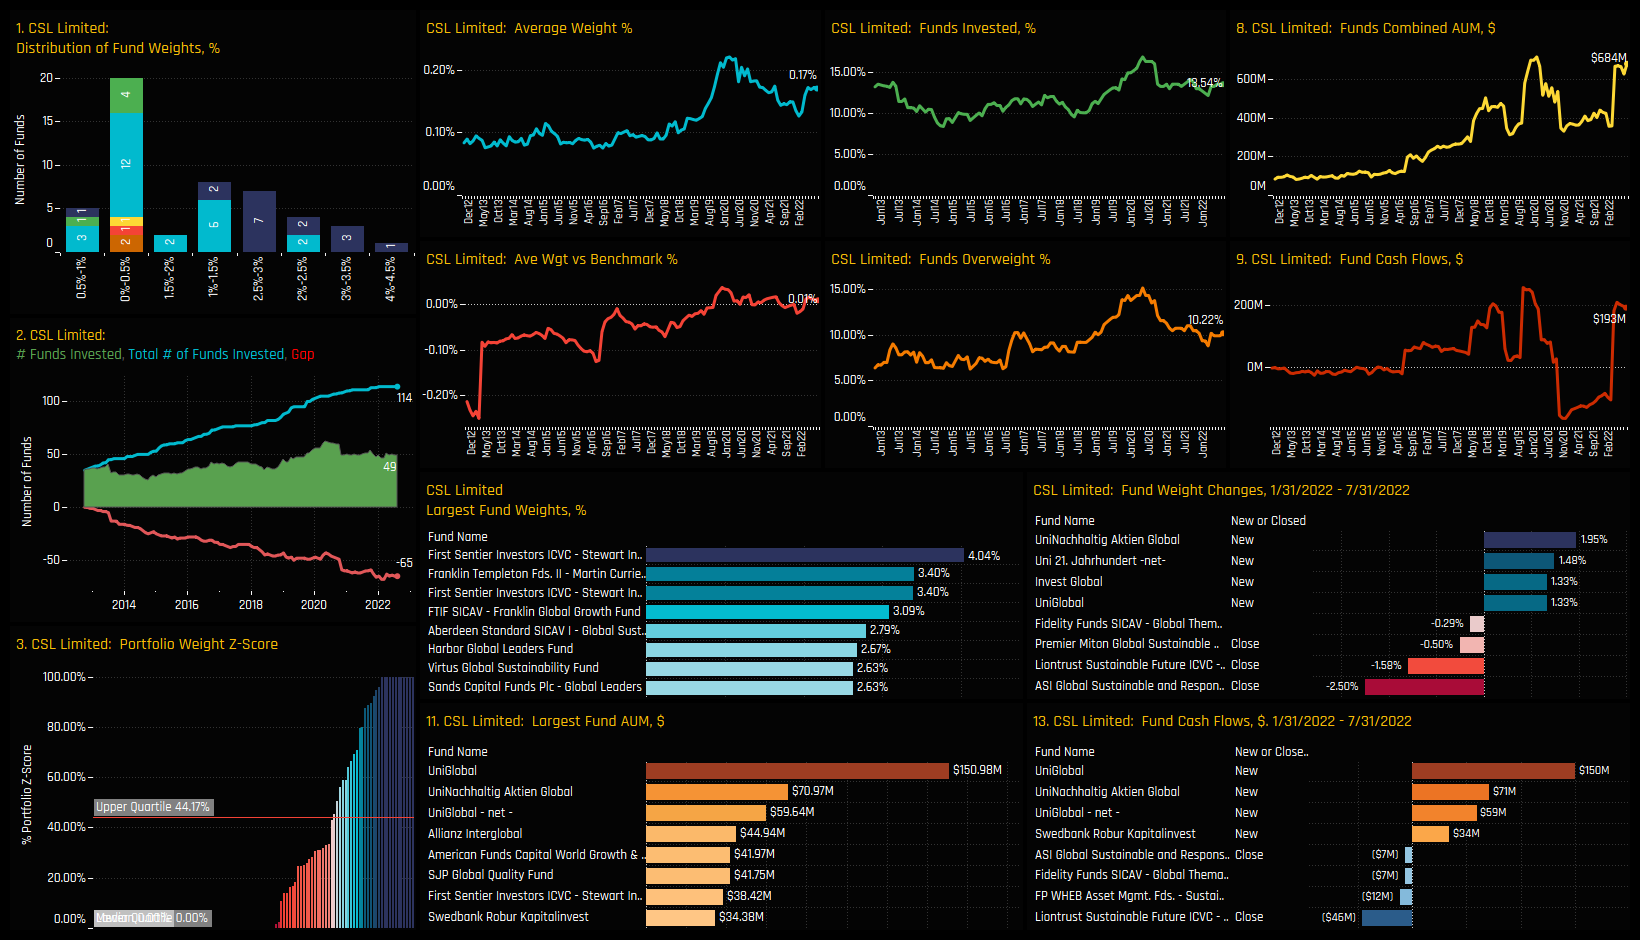
Stock level ownership is still light, with CSL Limited the clear high conviction stock. It is the most widely held Australian company among global investors, owned by 13.5% of funds at an average weight of 0.17%. It also features heavily in the high conviction positions, led by First Sentier Worldwide Sustainable (4.04%) and Franklin Templeton/Martin Currie Global Unconstrained (3.40%). The key underweights are in BHP Group and Commonwealth Bank of Australia.
But despite this ownership turnaround, the fact remains that Australia is still a very lightly held country exposure, avoided by the majority of global investors and a key underweight.
Stock Profile: CSL Limited
Click on the link below for the latest data report on Australia positioning among active Global funds.
UK Consumer Discrexodos
(clockwise from top)
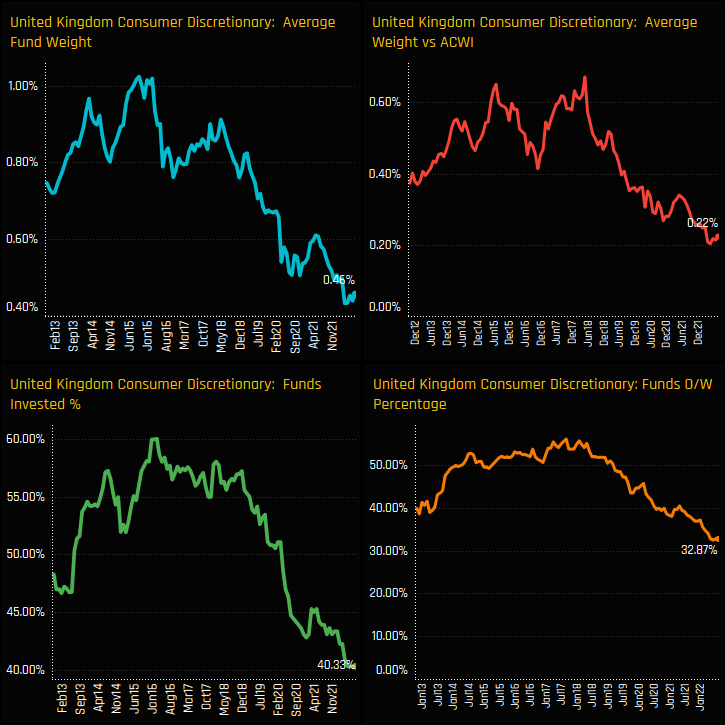
Active Global managers are losing faith in the UK Consumer. The percentage of funds invested in the UK Consumer Discretionary sector has fallen to an all-time low of just 40.3%, with average weights falling in unison to the lowest levels on record. Still an overweight position, the conviction of that overweight has been dwindling over the last 5-years, with an all-time low 32.9% of funds overweight the benchmark.
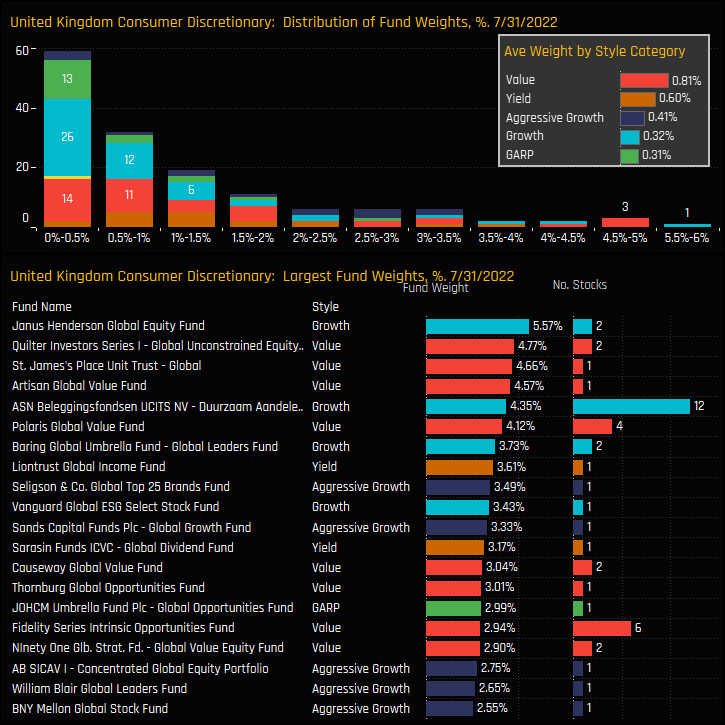
This lack of conviction is reflected in the distribution of fund weights, which is heavily skewed towards towards the left hand side. The majority of managers hold less than a 1.5% stake in UK Consumer Discretionary companies, with the tail to the upside occupied by a small number of funds and led by Janus Henderson Global Equity (5.57%) and Quilter Global Unconstrained (4.77%). From a style perspective, Value and Yield funds are more exposed than Growth.
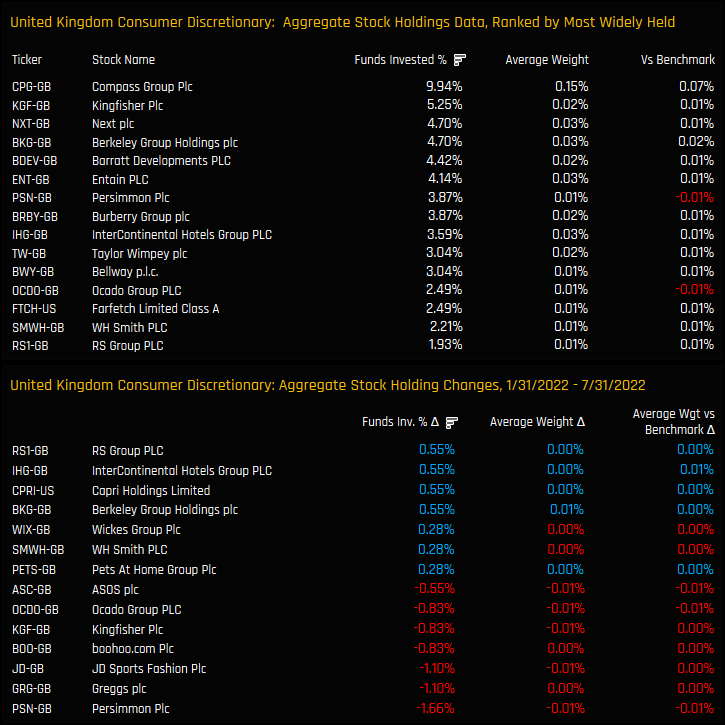
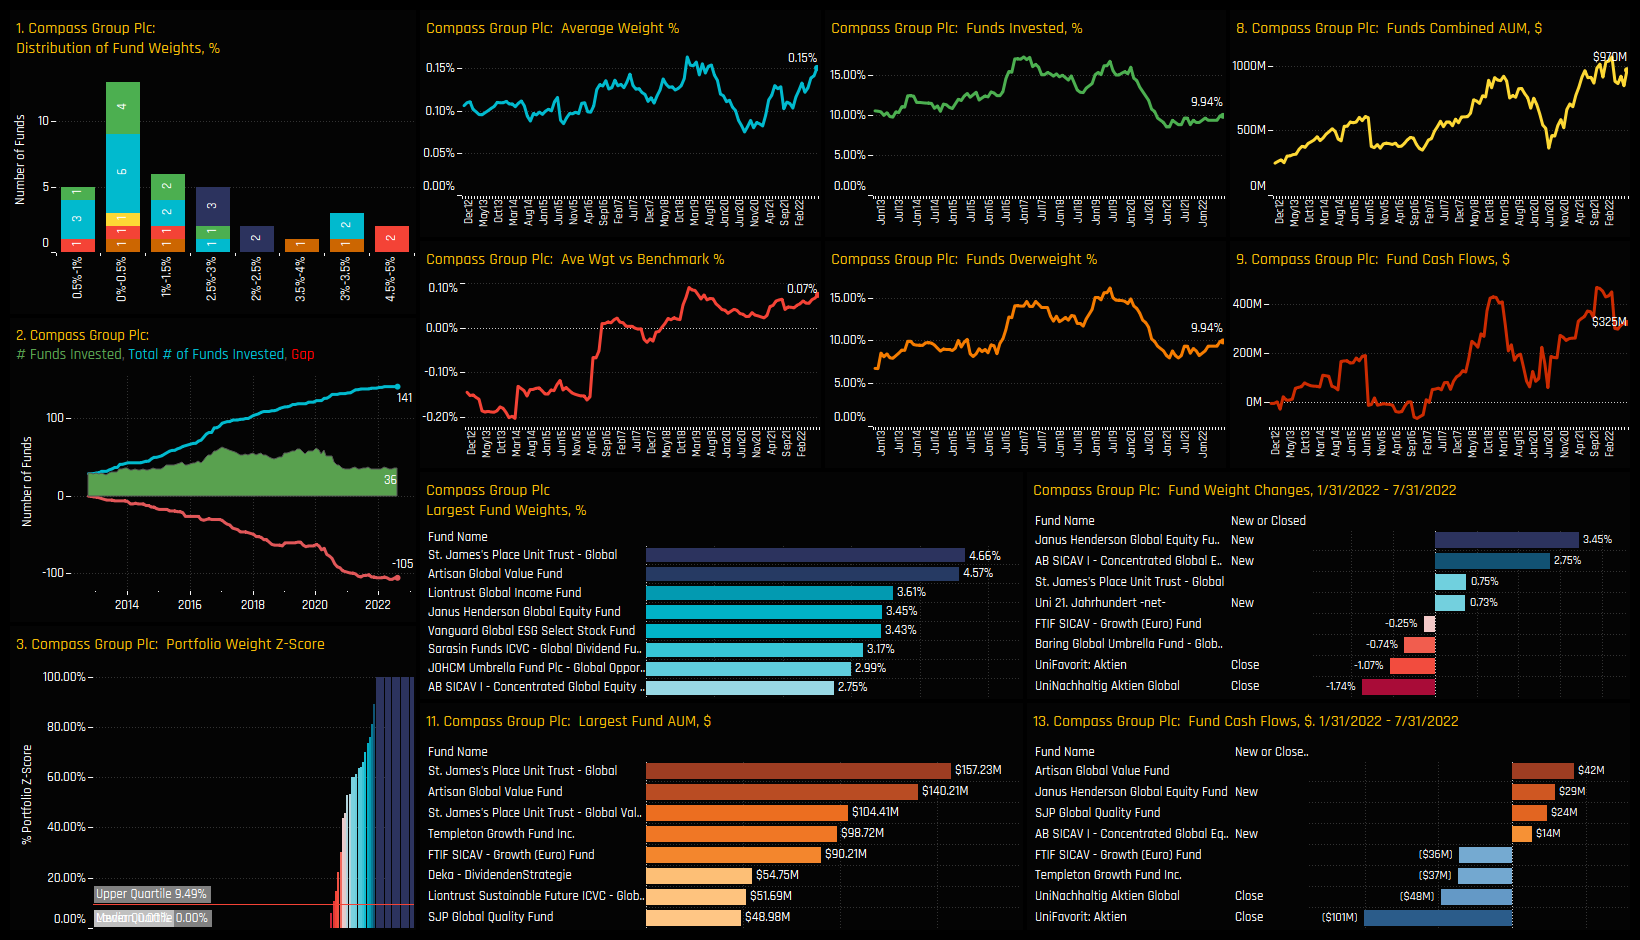
Stocks in the sector have been mostly avoided by global managers, though Compass Group stands apart from peers, owned by 9.94% of funds at an average weight of 0.15%. Activity over the last 6-months reflects a gradual chipping away of exposure, with -1.66% of funds closing Persimmon exposure, -1.1% Greggs and -1.1% JD Sports.
Stock Profile: Compass Group PLC
Click on the link below for the latest data report on UK Consumer Discretionary positioning among active Global funds.
Momentum in the Trucking Industry
(clockwise from top)
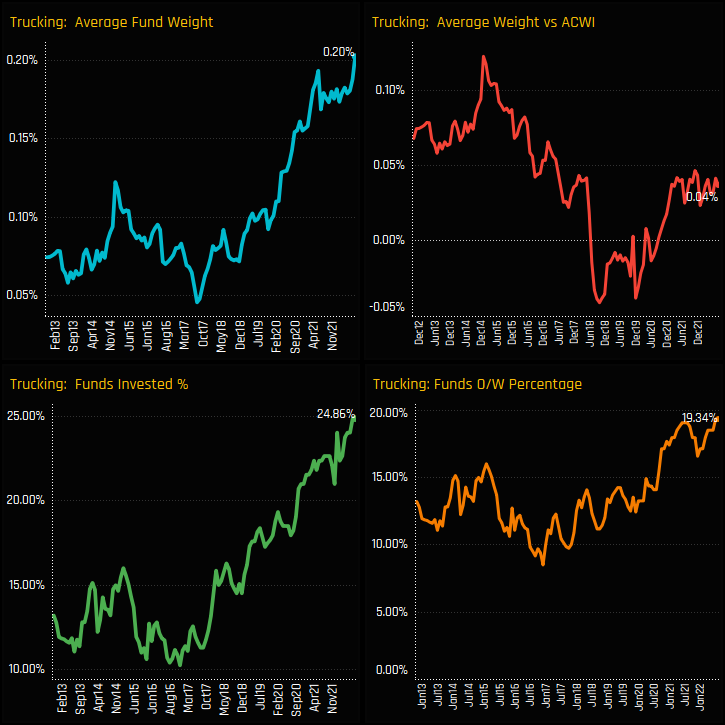
Exposure towards the Trucking industry group has hit fresh highs this month. Following a 5-year run of ownership growth, a record 24.9% of managers have exposure to Trucking stocks at an average weight of 0.20%.
In most cases portfolio weights in Trucking stocks are small, with the majority of the current investor base holding less than a 1.5% stake. The interesting part of the distribution is at the top end, with the 9 of the top 11 holders occupied by Aggressive Growth strategies.
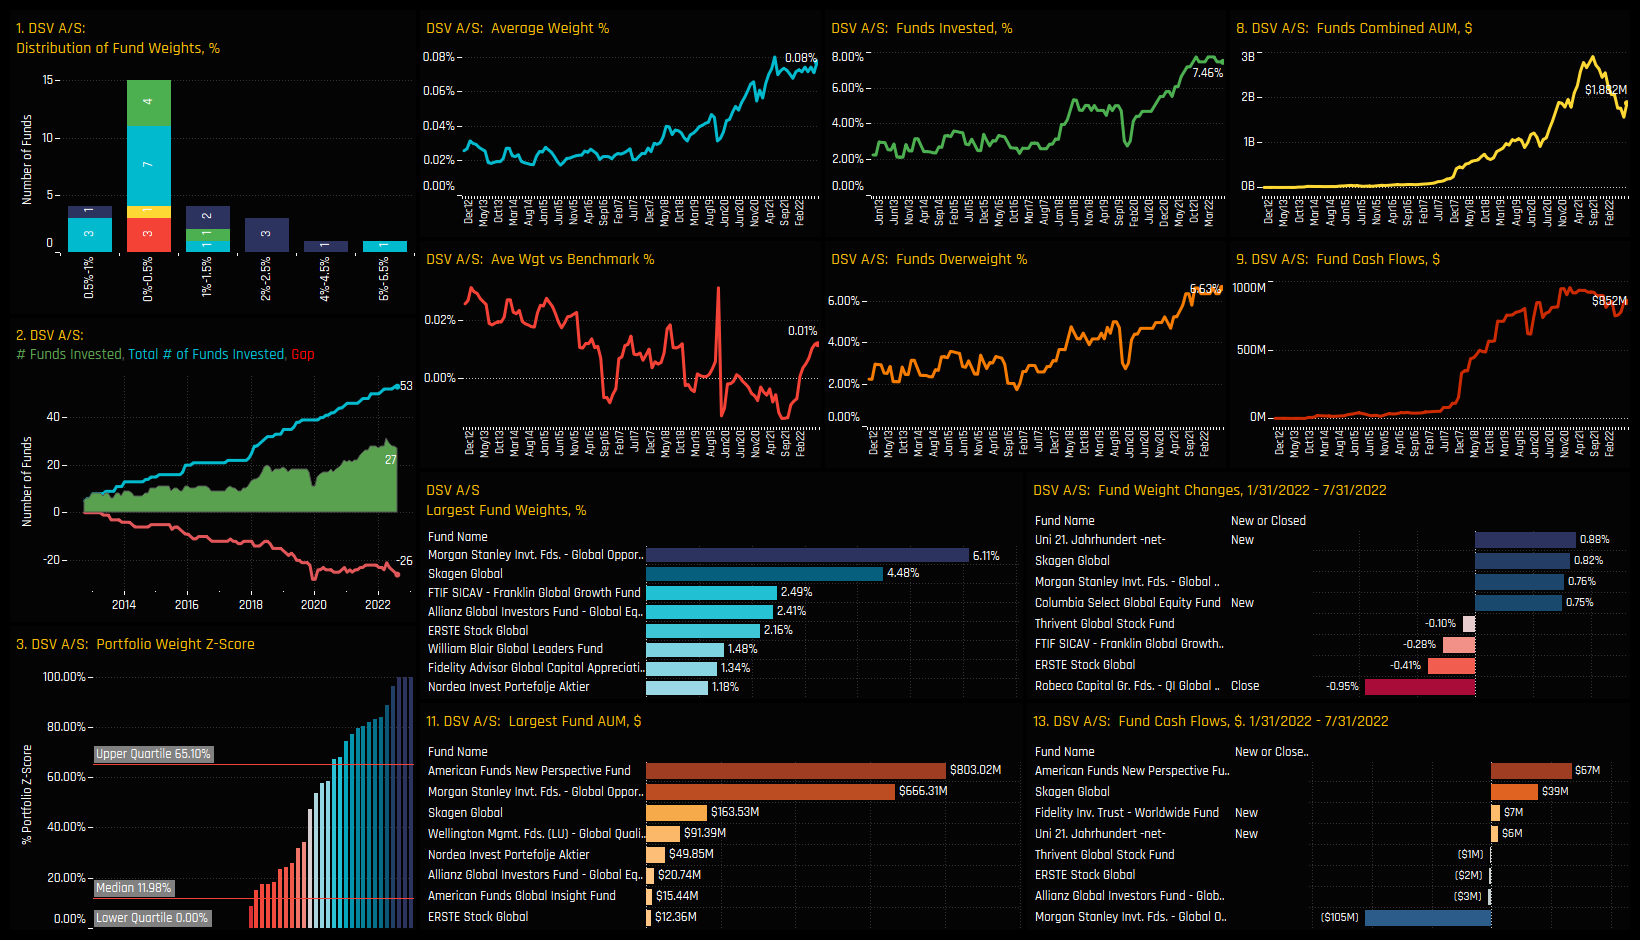
With over three quarters of global managers still uninvested in the industry group, stock ownership is predictably light. The clear high conviction holding is DSV A/S, held by 7.46% of managers at an average weight of 0.08% and in notable size by Morgan Stanley Global Opportunity (6.11%) and Skagen Global (4.48%).
Though still undiscovered by most investors, Trucking companies could be worth some consideration.
Stock Profile: DSV A/S
Click on the link below for the latest data report on Trucking positioning among active Global funds.
South Korean Autos. All Over?
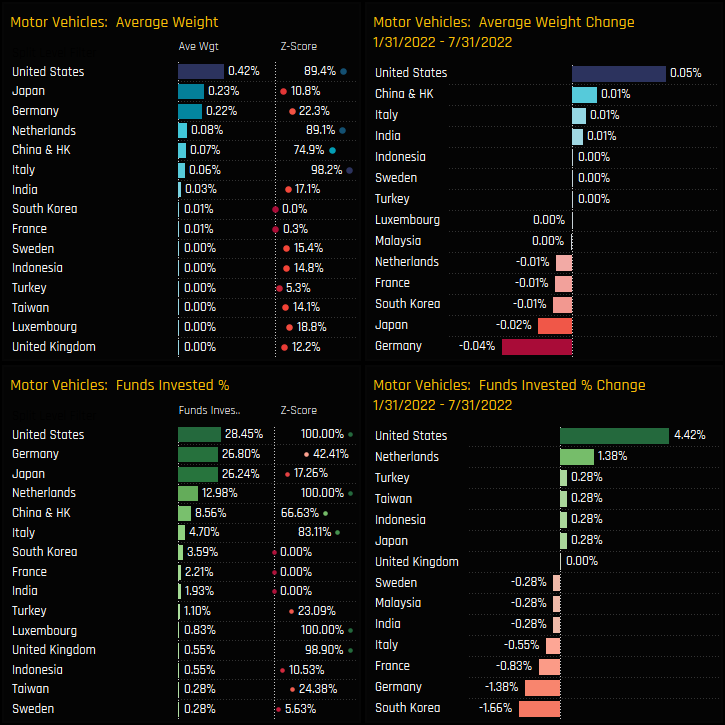
(clockwise from top)
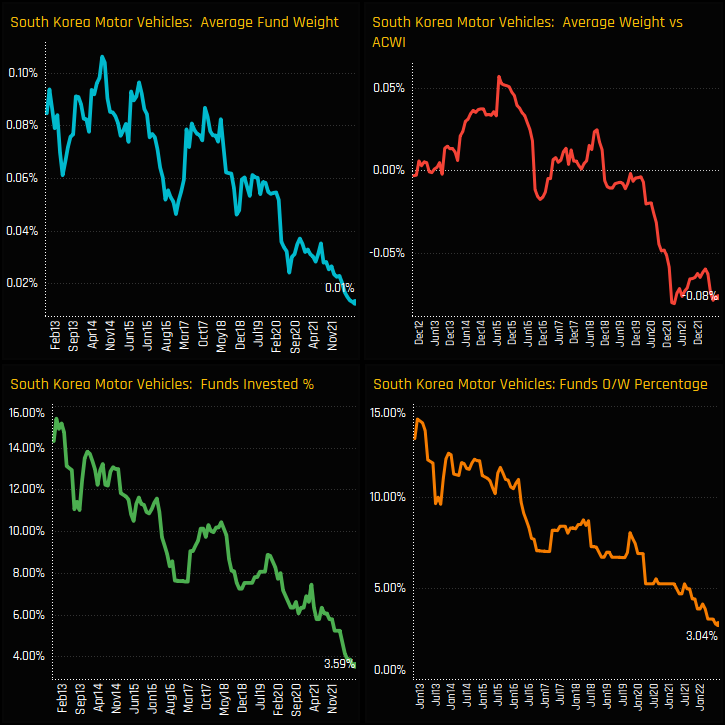
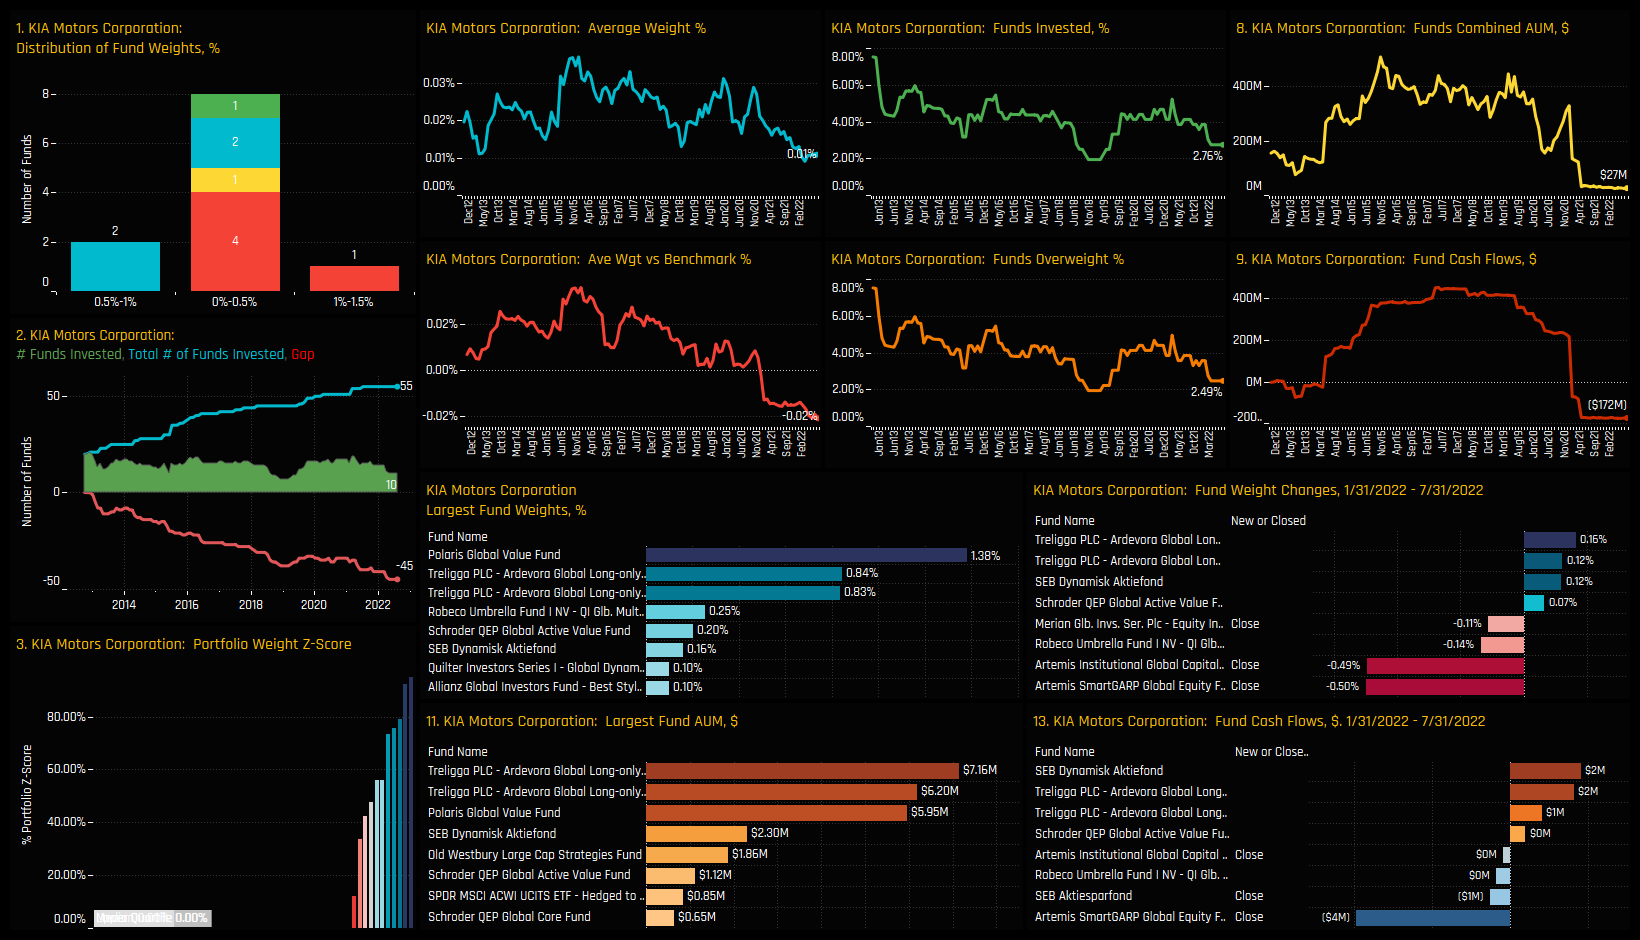
Investment in South Korean auto stocks has almost dwindled to zero. Of the 362 global funds in our analysis, just 3.6% hold any exposure, the culmination of a decade-long downward trend in ownership that has seen managers switch from net overweight to net underweight.
The Motor Vehicles sector is dominated by the USA, Japan and Germany, with South Korea a rounding error on the overall industry allocation. Over the last 6-months, only US Auto stocks have captured any real ownership growth, with South Korea losing the most investors over the period.
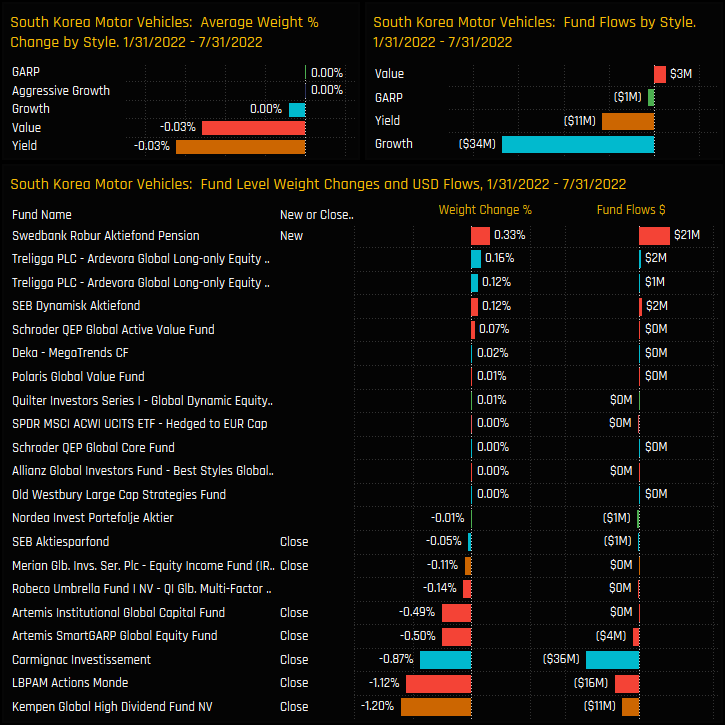
On a fund level, closures far outweighed openings between 01/31/2022 and 07/31/2022, led by Kempen Global High Dividend (-1.2%), LBPAM Actions Monde (-1.12%) and Carmignac Investissement -0.87%).
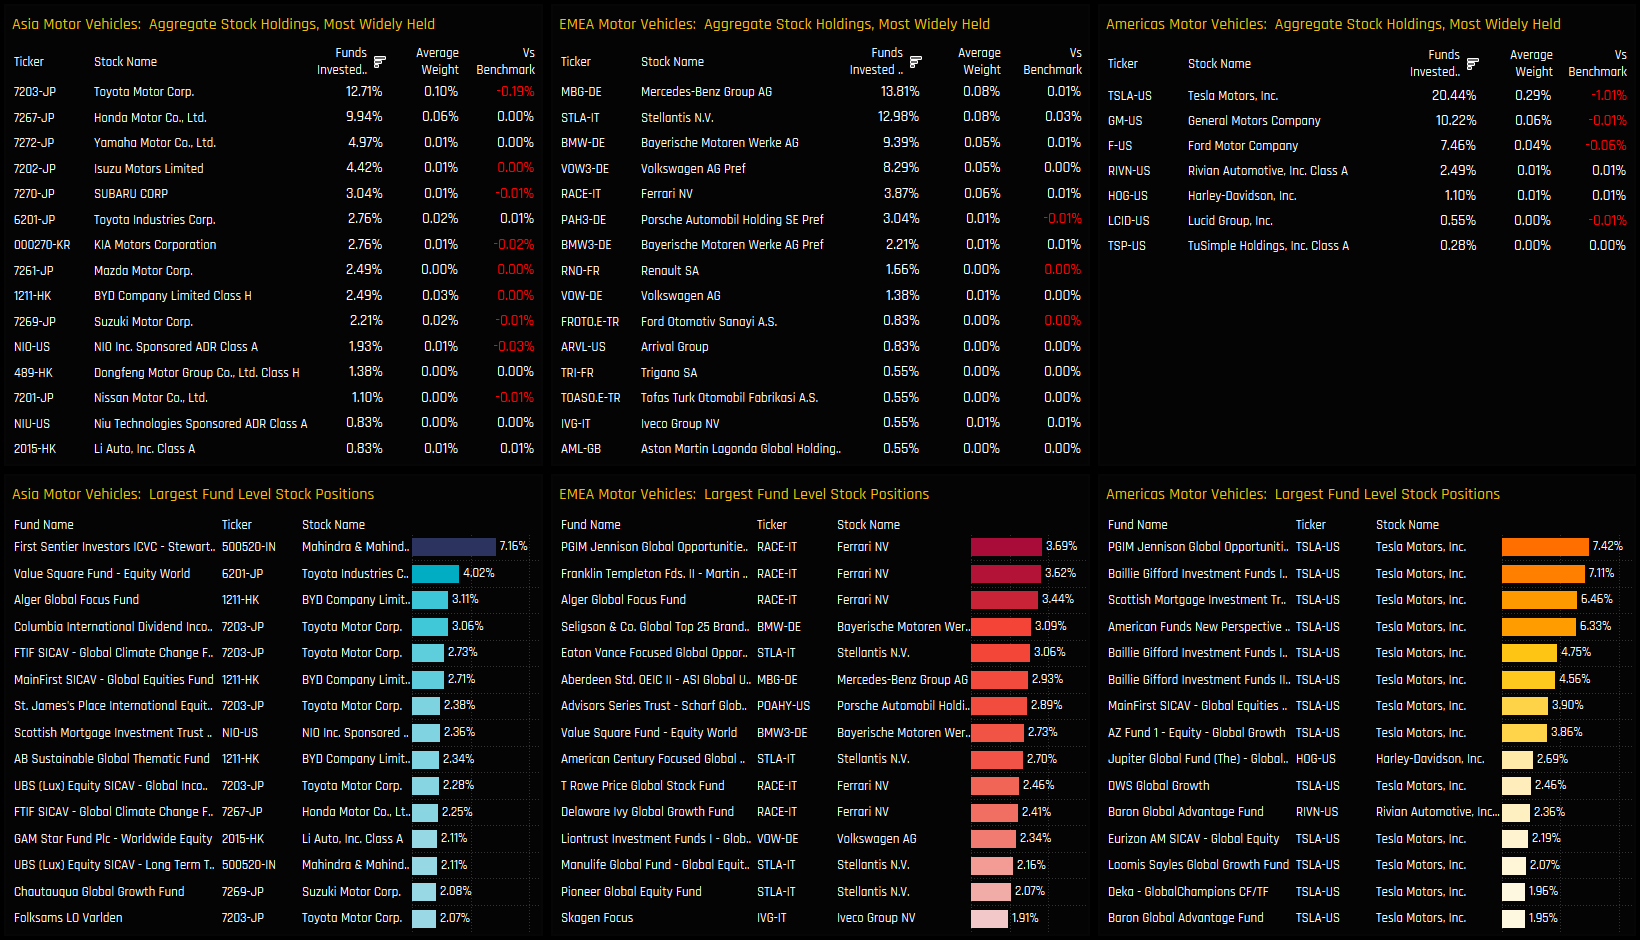
Stock Holdings
Stock Profile: KIA Motors
Click on the link below for the latest data report on South Korea Autos positioning among active Global funds.
For more analysis, data or information on active investor positioning in your market, please get in touch with me on steven.holden@copleyfundresearch.com
Related Posts

- Steve Holden
- October 14, 2024
Global Funds: Performance & Attribution Review, Q3 2024
337 Global funds, AUM $1.1tr Global Funds: Performance & Attribution Review, Q3 2024 Summa ..

- Steve Holden
- October 24, 2022
Global Equity: Consensus Positioning
359 Active Global Funds, AUM $832bn Consensus Positioning Consensus positioning is something th ..

- Steve Holden
- July 26, 2023
Global Fund Positioning Analysis, July 2023
349 Global Equity Funds, AUM $988bn Global Fund Positioning Analysis, July 2023 In this issue: ..

